 Luis F. M. Rosa
 Steffi Hunger2
 Beate Strehlitz
 Falk Harnisch
- 1Department of Environmental Microbiology, Helmholtz-Centre for Environmental Research, Leipzig, Germany
- 2Department Centre for Environmental Biotechnology, Helmholtz-Centre for Environmental Research, Leipzig, Germany
Microbial electrosynthesis (MES) is an exciting and dynamic research area at the nexus of microbiology and electrochemistry. To pave the way of MES to application, reactor infrastructure is needed that meets the requirements of both biological, and electrochemical engineering. Recently we presented an upgrade kit facilitating turning commercial bioreactors based on batch stirred tank reactors (BSTR) into electrobioreactors that can be scaled and benchmarked. The upgrade kit comprises electrodes and an inlay with membrane, separating the BSTR chamber into anode and cathode compartments. The obtained electrobioreactors enable seizing the existing infrastructure for monitoring and controlling the bioprocess while being complemented by electrochemical control and measurement. Here the effect of the upgrade kit on mass transfer was investigated in a 1 L electrobioreactor using experimental approaches and modeling of fluid dynamics. It is shown that the fluid dynamics in the BSTR are changed dramatically, impacting the integral parameters volumetric mass transfer coefficient, kLa, and mixing time, θ. The influences of the inlay chamber and electrodes as well as stirrer position and geometry are described. Additionally, the sterilizability of the inlay, housing the polymer-based membrane of the electrobioreactor, which is needed for operating two-chamber MES based on microbial pure cultures, are demonstrated.
Introduction
Microbial electrosynthesis (MES) is a field of microbial electrochemical technologies (MET) that is defined as the execution of microbially catalyzed electrochemical reactions to transform a substance into a desired product (or a mixture of products) (Schröder et al., 2015). MES has gained increasing attention as it promises to use renewable (electric) energy and biogenic feedstock for a bio-based economy. For paving the way of MES from its current technology readiness level (TRL1) of maximum 4–5 to a production technology, an adequate reactor infrastructure is required (Holtmann and Harnisch, 2019). These reactors must allow balancing the necessities related to the exploitation of microorganisms with the requirements for electrochemical reactions taking place. These are requirements that also need to be met by reactors for other applications in the field of MET, including its archetype the microbial fuel cell (MFC), and microbial desalination cells (MDC). MFC are designed for operating open, non-sterile cultures usually derived from wastewaters, where the electrochemically active organisms are mainly forming biofilms. Thus, design concepts and lessons learned during MFC engineering can be very well-adapted for MES using open cultures as well. Examples are the production of hydrogen in microbial electrolysis cells (MEC) or gaining carboxylates from CO2 using microbial mixed cultures. However, this adaptation of design concepts is not possible when it comes to MES using defined co-cultures and (genetically modified) pure cultures. In this line of research substantial progress has been made in the last years, e.g., using E. coli for the production of acetoin from glucose (Sturm-Richter et al., 2015), and chiral alcohols from ketones (Mayr et al., 2019), or using P. putida for production of detergents (Schmitz et al., 2015). These studies exploited until now mostly distinct lab scale reactors, with custom made designs. The reactors are usually bottle-type reactors made with laboratory flasks with one or two chambers and electrodes inserted in the flasks using adapted lids. A two-chamber system–allowing separating the anode and cathode compartments–is implemented often by using H-cells based on tailored glass flasks that are separated by an ion exchange membrane (Nevin et al., 2010, 2011). Alternatively, for two-chamber systems an insertion of a (smaller) counter electrode chamber in the bigger (bottle-like) working electrode chamber is realized (Xu et al., 2014). The counter-electrode chamber often consists of a glass tube equipped with a membrane at one end. In all cases the membrane is essential for keeping the anode and cathode chambers physically separated, but ionically connected. Thus, the generated products or off-gas streams can be harvested with higher purities and (electro) chemical short circuits can be avoided. This results in improved characterization of MES, e.g., in terms of coulombic efficiency (CE) or product yield. However, from a bioprocess engineering perspective these reactors are not only poorly characterized but are also hardly suitable for process development and scaling. Further, an adequate benchmarking—meaning comparison of MES to biosynthesis not using electric power—seems impossible. To circumvent these limitations and enable knowledge-driven process development, we recently introduced an upgrade kit that allows (reversibly) transforming existing bioreactor infrastructure into electrobioreactors (Rosa et al., 2017). This upgrade kit makes the application of conventional bioreactors used for bioprocess engineering possible, including their infrastructure for process monitoring, and control for investigating MES. The resulting reactors are denominated as electrobioreactors. Using the upgrade kit, two-chamber 1 L electrobioreactors based on batch stirred tank reactors (BSTR) were achieved (see Figure 1 and Figure SI 1). We demonstrated that the material and design of electrodes and other components of the 1 L electrobioreactors can be achieved allowing research on several pure cultures of electroactive microorganisms, e.g., Gluconobacter oxidans (Gimkiewicz et al., 2016), Clostridium kluyveri (Koch et al., 2017), Shewanella oneidensis (Rosa et al., 2017), and genetically modified E. coli (Mayr et al., 2019). However, to what extent the insertion of electrodes, an inlay creating two chambers, and the use of an adapted stirrer as well as removal of chicanes resulted in change of fluid dynamics remained unclear, and is addressed within this study.
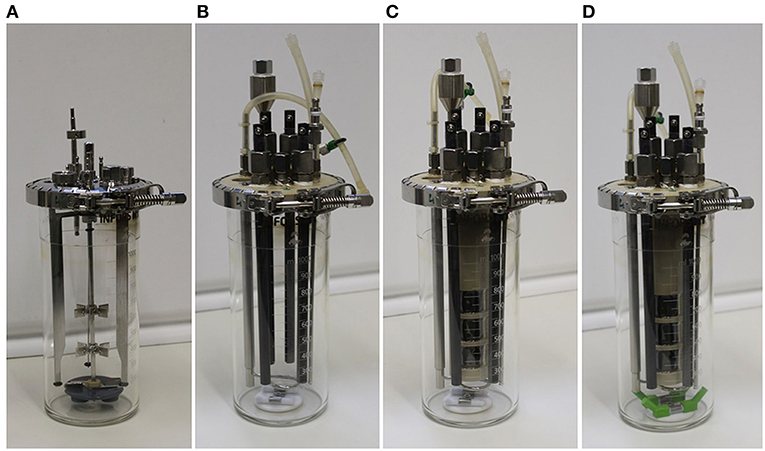
Figure 1. Pictures of the different experimental setups described in the text in detail. (A) Bioreactor of the manufacturer (setup 1); (B) upgrade kit for bioreactors including working and counter electrodes, without chamber inlay, and with the standard upgrade kit stirrer (setup 2); (C) upgrade kit for bioreactors complete with membrane chamber inlay (setup 3); (D) upgrade kit for bioreactors complete with membrane inlay and a modified stirrer with extensions (setup 4).
For reactor engineering and scaling the description of a given reactor system in terms of geometry, flow fields and hydrodynamic conditions using standardized data representation are necessary. Reactor design parameters include dimensionless numbers like the Reynolds number (Re) or Newton number (Ne) for the description of the flow field or mixing environment (Harnisch and Holtmann, 2019), and when electrochemical performance is to be appraised, the Wagner number (Wa) (Ibl, 1981) must be taken into account in the scaling process. This means that the complex interplay of biotechnological, fluid-dynamic, and electrochemical processes must be investigated in an electrobiorector to reveal correlations between those that may allow subsequent engineering (Zlokarnik, 2006). Characterizations of a two-chamber BSTR were carried out with the determination of the common parameters for mass transfer and flow field: kLa and θ. The kLa is a value that comprises the volumetric interfacial gaseous-liquid surface area, a, and the mass transfer coefficient, kL, measured as their product. The kLa is used for the characterization and design of bioreactors in order to compare different systems regarding mass-transfer limitations at the gas-liquid interface, and it is used as an important scale-up factor of processes in geometrically similar reactors (Moutafchieva et al., 2013). Most industrial productions are based on aerobic cultivation, often at high cell densities, characterized by a quick depletion of oxygen from the liquid phase, which can only be resupplied by forced dissolution from gas streams. Consequently, the kLa is usually assessed for oxygen transfer, but it can be measured for other gases that are relevant for a given process, like CO2, as well (Enzmann et al., 2019). Generally, care must be taken to ensure that the response time of the sensors used for detecting the respective dissolved gas in solution is fast enough, otherwise it could be limiting, which leads to wrong kLa calculation (Meusel et al., 2016). The kLa depends heavily on the internal geometries of the reactors and its components, which determine the convective movement inside (vessel height to diameter ratios, number and geometry of chicanes and baffles, stirrers, stirring speeds and power), and on the properties of the liquid medium (density, viscosity, surface tension, and coalescence properties) (Van't Riet, 1979). Thus, the kLa is an excellent measure for the overall mass transfer capacity of a specific reactor system. In fact, one of the strategies for upscaling aerobic bioprocesses from laboratory scale to industrial scale is by keeping the kLa constant (Garcia-Ochoa and Gomez, 2009). Although most MES processes are operated anaerobically or microaerobically, here the kLa was measured using oxygen from air, as the gained numbers are highly suitable for mass transfer benchmarking.
In standard bioreactors, concentration and temperature gradients must be prevented in order to avoid unfavorable impact on cell growth and product formation (Kraume, 2004). Mixing efficiency affects both performance and scale-up in a bioreactor. Homogenization (mixing) is characterized by the mixing quality to be achieved and the mixing time necessary (Kraume, 2004). The mixing quality represents a pre-selected value (for example, macro-mixing, fine mixing, or mixing up to molecular dimensions) (Kaiser et al., 2011). The parameter mixing time, θ, is an excellent measure for the overall mass transfer in the liquid phase. Mixing time can be calculated for a reactor and different reactor running conditions. It is dependent on the bioreactor geometry, the used stirrer type and size, the specific power input (convective conditions established in the reactor), as well as the liquid properties, especially on the diffusivity of the compounds of interest in the bulk medium used, and the bulk medium liquid properties (Kaiser et al., 2011).
The aim of our investigations was to continue our line of reactor engineering to generate and characterize an electrobioreactor that fulfills the legal and factual requirements to be used in industrial and white biotechnology. In this study, following our previous work (Rosa et al., 2017), we investigated the influences of upgrade kit elements on the fluid dynamics in a 1 L reactor. Starting with the “conventional bioreactor” (setup 1–see section Materials and Methods for details)—which is the bioreactor without the upgrade kit, which is not applicable for MES—stirrer, electrodes and chamber were inserted consecutively, and kLa as well as θ were determined. Further, computational fluid dynamics (CFD) analysis of the reactors was performed. In conjunction, the results lead to the suggestion of new stirrer designs for the improvement of the mixing. Additionally, the sterilizability of the electrobioreactor needs to fulfill the regulatory standards in biotechnology. Therefore, the very first sterilization tests on the inlay housing the polymer membranes for 1 L electrobioreactor were carried out (GMP-Berater, 2018).
Materials and Methods
Chemicals
All chemicals were of at least analytical grade and were obtained from Sigma-Aldrich (Deisenhofen, Germany), Carl-Roth GmbH & Co. KG (Karlsruhe, Germany), or VWR International GmbH (Darmstadt, Germany). For preparation of all solutions, de-ionized water (Millipore, Darmstadt, Germany) was used. Tap water, distilled water, and deionized water were used for the investigations of sterilization conditions for the membrane as indicated.
Reactor Setups
Four different experimental setups were used throughout this study (Figure 1), all based on the 1 L bioreactor vessel (Infors Multifors, Infors AG, Bottmingen, Switzerland):
Setup 1: Bioreactor of the manufacturer, with a stainless steel lid, three metal chicanes and one central shaft with two Rushton turbines evenly spaced, driven from the bottom of the reactor using magnetic coupling (Figure 1A).
Setup 2: Partial installation of the upgrade kit in the bioreactor (Figure 1B). This includes removing all the parts shown in Figure 1A (stainless steel lid, three metal chicanes, magnetic stirrer shaft with two Rushton turbines, and magnetic coupling), and introducing a custom-made reactor lid made of polyetheretherketon (PEEK) equipped with four graphite rods (10 mm diameter and 250 mm long, CP-2200 quality, CP-Handels GmbH, Wachtberg, Germany), with two rods serving as working electrodes (WEs), and two rods serving as counter electrodes, a reference electrode (Ag/AgCl Sat. KCl, SE11, with 6 mm diameter, and 100 mm length, Xylem Analytics, Meinsberg, Germany), and a custom made magnetic stirrer composed of two 7 mm diameter, 40 mm long Teflon-covered magnets in the bottom of the vessel.
Setup 3: Based on setup 2, a membrane inlay is added. The inlay of the upgrade kit is also made of PEEK and contains three side openings (i.e., “windows”) with an active membrane size of 716 mm2 each (Figure 1C). A cation exchange membrane (fumasep FKE, FuMA-Tech GmbH, Bietigheim-Bissingen, Germany) is used to maintain the physical separation but to allow ionic connection of the two reactor chambers. The membrane is mounted on the inner side of the inlay and glued in the gaps with a two-component epoxy adhesive (Loctite Hysol 3430, Henkel, Düsseldorf, Germany). Inside the inlay, two graphite rods serving as counter-electrodes are installed. The 150 mL compartment formed by the inlay reduced the working volume of the working electrode chamber to 850 mL, comprising the complete upgrade kit for bioreactors (Figure SI 1).
Setup 4: An identical bioelectroreactor as for setup 3 was used, but with improved stirrer geometry. Therefore, 3D printed (Ultimaker 2+, Geldermalsen, The Netherlands) poly-lactic acid extensions (PLA, Innofil3D, Emmen, The Netherlands) were built to elongate the stirrer paddles by 2 cm at an angle of 45° (Figure 1D).
Experimental Determination of the Volumetric Mass-Transfer Coefficient kLa
The volumetric mass transfer coefficient, kLa, comprises the volumetric interfacial gas-liquid surface area, a, and the mass transfer coefficient, kL, being both measured as their product (Garcia-Ochoa et al., 2010). Different methods for the experimental determination of kLa are available (Van't Riet, 1979; Garcia-Ochoa and Gomez, 2009), here the gassing-out method was used (Meusel et al., 2016). This method is based on the measurement of oxygen saturation of the electrolyte solution (Van't Riet, 1979). For all setups, different gassing [0.5, 1, and 2 standard liter per minute (sLpm)], and stirring conditions (200, 500, 650, and 1,000 rpm) were assessed using oxygen sensors (see below) in M4-mineral medium [1.27 mM K2HPO4, 0.73 mM KH2PO4, 5 mM HEPES, 125 mM NaCl, 9 mM (NH4)2SO4], supplemented with trace elements (1 mM MgSO4, 100 μM CaCl2, 5 μM CoCl2, 0.2 μM CuSO4, 57 μM H3BO3, 5.4 μM FeCl2, 1.3 μM MnSO4, 67.2 μM Na2EDTA, 3.9 μM Na2MoO4, 1.5 μM Na2SeO4, 5 μM NiCl2, and 1 μM ZnSO4). All values were obtained at 30 ± 0.5°C (Schütz et al., 2011).
The oxygen sensors were Clark-type electrodes (OxyFerm170, Hamilton Bonaduz AG, Bonaduz Switzerland) with response times of 25 to 30 s (t63% response times, measured) that were left to polarize for at least 6 h before the measurements. Sensors were calibrated using the two-point calibration procedure: 100% dissolved oxygen tension (DOT) when a stable reading was obtained while sparging air at 2 sLpm and stirring at 1,000 rpm, and 0% DOT when a stable reading was obtained while sparging with N2, using the designated stirring and sparging conditions. After calibration, oxygen saturation curves were obtained as four independent replicates (n = 4) for each aeration/stirring combination. The kLa values were calculated as the slope of a linear regression, obtained by fitting the ln[100-DOT(t)] vs. time, by means of the least square differences. DOT(t) is the normalized dissolved oxygen data at a certain time, obtained for each trial, fitted between 10 and 90% of saturation (Meusel et al., 2016).
Experimental Determination of the Mixing Time
The mixing time, θ, was experimentally determined using the conductivity meter sensor method (Meusel et al., 2016). In brief, 750 mL of de-ionized water was added to the reactor setups, and the conductivity was measured, using a conductivity meter with a 1 s response time (SevenExcellence™ S700, Mettler-Toledo, Greifensee, Switzerland). After adding 1 mL of a 4 M KCl, while stirring at 200, 500, 650, and 1,000 rpm, at 30°C, data collection was continued until a steady final conductivity was measured for at least 30 s. The measurements were repeated independently 10 times (n = 10) for each setup. The mixing time of each replicate was considered as the first time at which the measured conductivity (normalized from 0 to 100%) was stable in an interval 100 ± 5% of the measured average final conductivity of the last 30 measurements. Due to experimental limitations, we could only measure this parameter using different stirring rates without the use of gas sparging. Sparging can affect θ in both negative and positive ways (Vasconcelos et al., 1998), so its influence at this scale should be determined experimentally. The gas bubbles interfered severely with the signal of the conductivity meter used, resulting in very high fluctuations of the signal, which impeded appropriate signal treatment. Additionally, the conductivity meter used was limited to measuring intervals of a minimum of 1 s, so we consider the results to have an error of ±1 s.
Sterilization of the Inlay With Membrane
In general, the polymer-based ion exchange membrane (fumasep FKE, FuMA-Tech GmbH, Bietigheim-Bissingen, Germany) was glued using a two-component epoxy adhesive on the inner side of the inlay, as described above and shown in Figure 2 (Gimkiewicz et al., 2016). Three different methodologies were used to study the sterilization of the inlay with the glued membrane and to test the stability of membrane material and gluing.
Sterilization 1: Sterilization with damp heat [steam sterilization: saturated steam 205 kPa, 121°C (GMP-Berater, 2018)]: The inlay was sterilized in an autoclave (Tuttnauer 2540, Tuttnauer Europe B.V., Breda, Netherlands) for 20 min in a 1 L beaker filled with 0.750 L demineralized water or tap water. The inlay was poured with 0.100 L demineralized water or tap water. The reference flask for the temperature sensor was 1 L tap water.
Sterilization 2: Sterilization with dry heat [hot air sterilization: temperature ≥160°C, 120 min (GMP-Berater, 2018)]: The drying oven (Heraeus UT 6120, Heraeus Holding GmbH, Hanau, Germany) was preheated to 180°C. The inlays were equipped with adhesive temperature measuring stripes (Testo SE & Co. KGaA, Lenzkirch, Germany) with visual display showing the maximum temperature of exposure (details see Supplementary Information 1.1 and Figure SI 5) and were put in the drying oven. After the temperature on the measuring stripes exceeded 160°C, the timer of the oven was set to 120 min to start the process.
Sterilization 3: γ-sterilization: The inlay with the glued membrane was sterilized using γ-radiation to adsorb 25 kGy (GMP-Berater, 2018) at subcontractor (Synergy Health Radeberg GmbH, Radeberg, Germany).
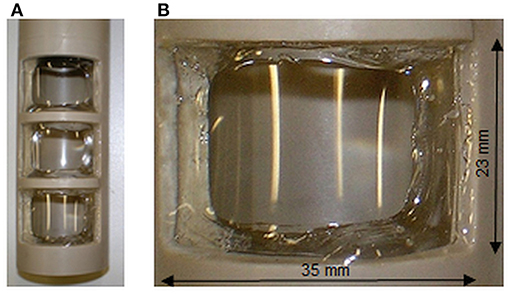
Figure 2. Detailed views on the inlay (A) and on one window (B) with the glued membrane. Dimensions provided refer to the window opening; the active membrane surface is diminished by glue edges to 716 mm2.
For sterilization 1, additional study was performed. Membrane sections equal in size were placed each on a petri dish (made of glass) and filled with 30 ml distilled water, de-ionized water, tap water or 5 wt-% NaCl solution. The petri dishes were unsealed closed and autoclaved for 20 min and 121°C with a reference flask filled with 30 mL tap water (Autoclave: Tuttnauer 2540, Tuttnauer Europe B.V., Breda, Netherlands).
Statistics
All experimentally derived data (kLa, θ) were measured as independent replicates as detailed above; confidence intervals (CI) at 95% confidence (p = 0.05) were calculated using the standard deviation and Student-t probability distributions (Miller and Miller, 1988). Linear correlations were obtained using the minimization of the sum of the squares of errors.
Modeling Using Finite Element Method
Geometry and Mesh
The finite element method (FEM) numerical solving program, COMSOL Multiphysics (Comsol Multiphysics GmbH, Göttingen, Germany), was used to solve Navier-Stokes (NS) partial differential equations (PDEs) (Yang et al., 2014) to assess the velocity fields of setups 2 to 4. The different geometries of the setups are represented in Figure 3. Figure 3A shows the geometry of setup 2, Figure 3B depicts the geometry of setup 3, which includes all the accessories from geometry 3A plus the solid inlay with the ion exchange membrane window, which physically separates the working electrode chamber from the counter electrode chamber (being here not modeled). Figure 3C resembles the geometry and stirrer addition of setup 4. The CAD geometry dimensions were measured from the physical parts with an accuracy of 0.1 mm.
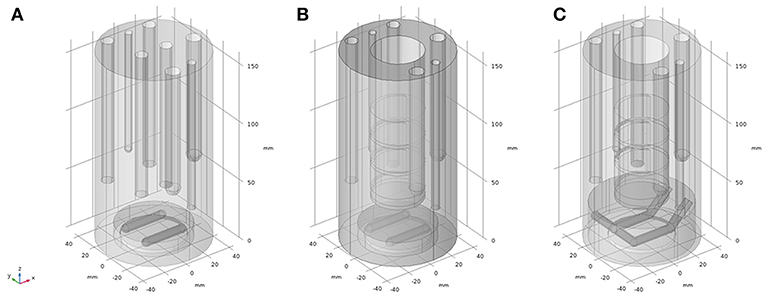
Figure 3. CAD geometry representations of the reactor setups used for finite element modeling; (A) model used for representation of setup 2; (B) model used for representation of setup 3; (C) model used for representation of setup 4.
The meshing of the geometries was done using the default “Fine” settings. This created a static polyhedral mesh with adequate size and number for the chosen physics (time-dependent Rotating machinery NS), and also created an additional “sliding mesh” which is dynamic in time, for defining the boundaries around the moving stirrer. The mesh statistics for each of the studied geometries are described in Table SI 1, and a visual example of the mesh can be seen in Figure SI 2.
Modeling and Boundary Conditions
The geometries were modeled assuming the liquid phase was water (ρ = 1,000 kg m−3, μ = 0.001 Pa s, T = 293.15 K). All the walls and internal static surfaces (vessel walls, electrodes, inlay, and membrane) were attributed to the boundary condition “no-slip,” which assumes Newtonian behavior of the liquid, setting the velocity of the liquid at these surfaces to 0. The magnetic stirrer surfaces were modeled as a “rotating wall,” which also sets surface velocity to 0, but inside a rotating domain. The stirrer was modeled encased in a rotating domain; this is a cylinder-shaped volume that contained the stirrer. The walls of this cylinder were modeled with “continuity” in order for the momentum forces generated to be passed to the exterior domain, i.e., the remaining liquid phase in the reactor.
The stirring speed was modeled with an incremental time-dependent s-shaped step function so that it was increased in time from 0 rpm to 1,000 rpm (Figure SI 3). With the time-dependent study being computed from time 0 s to time 0.6 s with 0.001 s of increment the rpm were increasing up to ≈0.45 s of modeled time, where it then became constant for the next 0.15 s. This means the model results will include 0.15 s of rotation at 1,000 rpm, from 0.45 to 0.6 s, yielding in total only three complete rotations at full speed. Although this can hardly be considered as “steady state conditions” we used the gained values. We are confident that this approach is more faithful to the physics than the Coriolis frozen rotor approach2, which is not suitable, when introducing obstacles in the flow field, as is needed in this case. The time-dependent solver was used at the default settings.
Results and Discussion
Determination of the Volumetric Mass-Transfer Coefficient kLa
As introduced above, the volumetric mass transfer coefficient, kLa, is a critical parameter for determining the gas transfer rate across the liquid-gaseous interface in biotechnological processes and a key parameter in estimating reactor mass transfer performance. Thus, kLa is an excellent reference point for assessing changes in mass transfer. The kLa of a standard bioreactor (setup 1) and several modifications of the same vessel (setups 2 to 4) when installing the bioelectrochemical upgrade kit (Rosa et al., 2017) were assessed for different stirring speeds (200, 500, and 1,000 rpm) and fixed volumetric aeration rates with air (0.5, 1, and 2 sLpm).
Results obtained for the measurement of kLa are shown in Figure 4. In the original reactor setup 1, kLa varies almost linearly from low to high stirring speeds, independently of the aeration rate (Figure 4A). Maximum kLa is obtained for highest stirring speed and gassing, at 225.73 ± 26.72 h−1, whereas the minimum kLa is obtained, as expected, for minimum stirring and gassing (20.49 ± 1.85 h−1). Setup 2 is characterized by a different dependency of kLa (Figure 4B). For lower stirring speeds, i.e., between 200 and 500 rpm, the value of kLa is almost not increasing for all aeration rates (12.32 ± 0.73 h−1 to 22.55 ± 2.78 h−1 and 35.75 ± 4.23 h−1 at 200 rpm to 17.25 ± 0.63, 35.35 ± 2.16 and 46.03 ± 4.36 h−1 at 500 rpm at 0.5, 1, and 2 sLpm, respectively). Yet, it increases dramatically, from 500 to 1,000 rpm (from 17.25 ± 0.63, 35.35 ± 2.16 and 46.03 ± 4.36 h−1 at 500 rpm to 134.31 ± 6.52, 152.86 ± 3.33 and 152.67 ± 12.09 h−1 at 1,000 rpm at 0.5, 1, and 2 sLpm, respectively). These kLa values are still inferior to the ones obtained with setup 1. This can be explained by two major changes of setup 2 in the reactor geometry relatively to setup 1: the removal of the three metal baffles (chicanes) and the replacement of the two Rushton turbine stirrers evenly spaced in the liquid column by one single custom-made magnetic stirrer placed on the bottom of the reactor vessel. The removal of the baffles as a static element that countered the circular liquid movement inside the vessel diameter promoted mixing and turbulence, and the removal of the two Rushton turbines implies clearly that then only the one stirrer has to propel the complete liquid column. One may further assume that this led to a less even distribution of the liquid movement than using the original pair of Rushton turbines. The influence of these alterations is very remarkable, as evidenced by the kLa values as well as the modeling (vide infra). The further introduction of the inlay membrane (setup 3) brings the replacement of some of the stirred liquid volume by a static cylindrical solid element, centered in the reactor vessel. The resulting kLa values measured for setup 3 (Figure 4C) yield a mixed behavior compared to the kLa values of setup 1 and setup 2 as follows. For the lower aeration rate of 0.5 sLpm, there is a non-linearity of kLa from low to high stirring speeds, from 16.03 ± 2.01 h−1 to 33.98 ± 6.91 h−1 and then to 131.07 ± 5.94 h−1 at 200, 500, and 1,000 rpm, respectively, but as the aeration rate increases, kLa resumes an almost linear behavior with stirring speed (26.08 ± 0.79 h−1, 56.18 ± 5.04 h−1 and 140.35 ± 2.59 h−1 at 1 sLpm and 54.35 ± 5.42, 82.43 ± 1.68 and 156.20 ± 9.87 h−1 at 2 sLpm, at 200, 500, and 1,000 rpm, respectively). In this case, the aeration regime has a clear effect on the kLa with increasing stirring rate in comparison to setup 2. We suspect this is due to the decreased liquid volume of the system from 1,000 mL (in setup 1 and 2) to 850 mL (in setup 3 and 4). The effective ratio of gassing rate to liquid volume is changed, i.e., a lower liquid volume to the same gassing rate, which brings a slight increase in the kLa, at least for the higher gassing regimes. Still, as expected, the kLa of setup 3 is inferior to the kLa of setup 1. The kLa of the electrobioreactor can be improved when using advanced stirrer geometry (setup 4). The detailed kLa results obtained for setups 3 and 4 are discussed in the following section, together with the results obtained for the respective modeling.
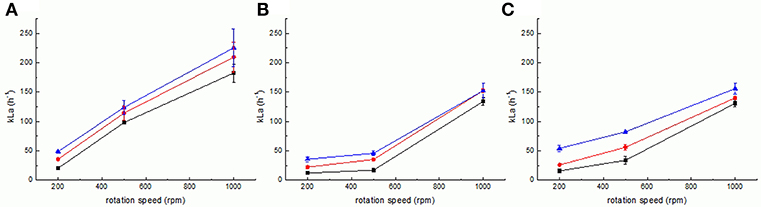
Figure 4. Measurement of kLa for setups 1 (A), 2 (B), and 3 (C) at various gassing rates (0.5 sLpm–squares, 1 sLpm–circles and 2 sLpm–triangles). Error bars represent the confidence interval at 95% confidence calculated from at least 5 independent measurements (n ≥ 5).
Modeling
The model geometries depicting the bioelectroreactor setups 2, 3, and 4 (Figure 3) were successfully solved. The results represent a numerical approximation of the velocity magnitude of the liquid inside the electrobioreactors, discretized in space and also in time, from 0 to 0.6 s of model time (with a resolution of 0.006 s), where from approximately 0.45 to 0.6 s at least 3 full rotations of the stirrer at maximum stirring rate (1,000 rpm) were modeled. The velocity magnitudes obtained for the different geometries at a fixed time of 0.6 s were analyzed (Figure 5 and Figure SI 4).
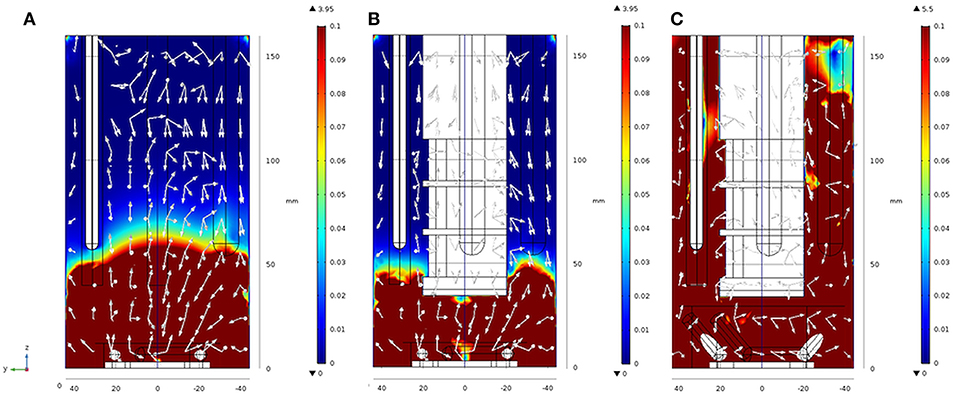
Figure 5. Results from finite element modeling: velocity magnitude fields obtained for t = 0.6 s, 1,000 rpm in setups 2 (A), 3 (B), and 4 (C) in y-z cut planes of the geometry. White arrows are normalized and only serve to indicate the main direction of the velocity magnitude. 3D views of the same Figures are found in Figure SI 4A–C. For further details see also Figure SI 4.
From the images presented in Figure SI 4 and taking into consideration the behavior of Newtonian fluids stirred by a Rushton turbine in a baffled reactor (see Zadravec et al., 2007), it is evident that different geometries in setups 2 to 4 have severe impact on the fluid flow inside the reactor as can be expected (Yang et al., 2014). Figure 5A shows that setup 2 is characterized by a clear and distinct separation of the velocity fields into two zones. One zone where velocity magnitudes vary from extremely high, 3.95 m s−1 down to 0.1 m s−1, situated between reactor heights of 50 and 60 mm, and one zone where the magnitudes are considerably lower, from 0.1 to 0.001 m s−1, above the reactor height of 60 mm. One should note that this is the zone at around 50–60 mm in the electrobioreactor, where most of the electrodes have their end tips. From this height upwards, the electrodes inside the reactors also serve as chicanes to the flow, hence breaking the high velocity fields. In setup 3 (Figure 5B), an additional large element (the inlay with the membrane) is included. The inlay tip is at 40 mm height from the bottom, and this brings the cut-line between high and low velocity zones 10 mm lower, to around 40 to 50 mm. Based on these modeling results and considering the associated kLa measurements, an improved stirrer (Figure 3C) finally leading to setup 4 (Figure 1D) was suggested. The stirrer in setup 4 consists in extending the magnetic stirrer cylinders (the “paddles” of the stirrer), generating a double anchor-like stirrer with a larger overall diameter, for which the tips sit higher in the liquid column. The model results for this geometry (setup 4) are presented in Figure 5C, where two major outcomes are visible: (i) the increase in the maximum velocity within the geometry (from 3.95 m s−1 for setups 2 and 3, to 5.5 m s−1 for setup 4), due to the increase in the stirrer diameter, and (ii) the disappearing of the zone delimited by velocity magnitudes inferior to 0.1 m s−1 due to the stirrer geometry.
Following the modeling results of the advanced stirrer geometry, it was also experimentally realized (Figure 1D), and the kLa of the derived setup 4 was measured (Figure 6). Due to the increased diameter of the stirrer (implying a higher power input for the same rpm), the magnetic coupling of the stirrer magnets with the turning motor magnets was lost for rates >650 rpm. Consequently, the kLa could not be measured for the same rpm range as for the other setups. Remarkably, the kLa values measured for setup 4 at rates ≤650 rpm were in the same range as the kLa values obtained with the original bioreactor (setup 1) with a maximum kLa value obtained for 650 rpm and 2 sLpm gassing rate of 249.07 ± 5.02 h−1. This illustrates that in electrobioreactors, kLa values can be reached that are comparable to shaking flasks with chicanes and that are needed for cultivations of usual cell densities.
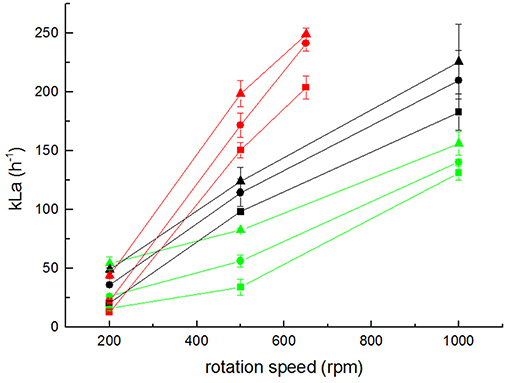
Figure 6. Measurement of kLa values for setups 1 (black), 3 (green), and 4 (red) at various gassing rates (triangles 0.5 sLpm; circles 1 sLpm; and squares 2 sLpm). Error bars represent the confidence interval at 95% confidence calculated from at least 5 independent measurements (n ≥ 5).
Mixing Time
In order to further compare the two stirrer designs, the mixing time, θ, was measured using the conductivity meter sensor method. Setup 1 yielded mixing times between 18 and 3 s (for 200 and 1,000 rpm, respectively). The results obtained for setups 3 and 4 are shown in Figure 7. In both cases, θ decreased markedly, with the increase in the stirring rate from 19 to 7 s at 200 rpm and from 7 to 5 s at 500 rpm (for setup 3 and setup 4, respectively). The lowest θ obtained were 6 s for setup 3 at 1,000 rpm, and 4 s for setup 4 at 650 rpm. Once again, these values show that the introduction of a stirrer of higher diameter with tips elevated at a higher position in the reactor liquid column increases the convective mixing significantly.
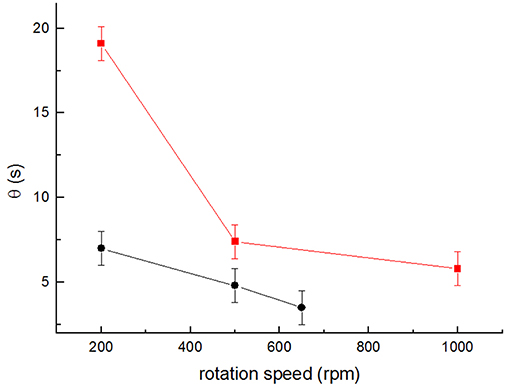
Figure 7. Average values of mixing times θ obtained for the different stirring speeds for setup 3 (squares) and setup 4 (circles) for at least 3 independent determinations (n ≥ 3). Error bars represent the time resolution of the conductivity meter (±1 s).
Sterilization of the Inlay With Membrane
For MES using pure cultures, sterile conditions need to be assured. Thus, the sterilization of the upgrade kit as well as of the other parts not present in the conventional bioreactor need to be demonstrated. Preliminary considerations about sterilizable materials and sterilization procedures can already be found (Gimkiewicz et al., 2016; Enzmann et al., 2019), and recently sterilizability of electrodes for a secondary MES was demonstrated (Hegner et al., 2019). Here we focused on the sterilizability of the inlay of the upgrade kit housing the ion exchange membrane. This can be considered as the technological heart of the upgrade kit, as it allows operation in a two-chamber system with physical separation of anodic oxidation and cathodic reduction. As polmyer-based membranes are commonly applied as separators in MES, the sterilization procedure was exemplified using a widely utilized cation exchange membrane (fumasep FKE) (e.g., Rozendal et al., 2008; Sevda et al., 2013; Jiang et al., 2017; Rosa et al., 2017; James et al., 2018). For preliminary tests in non-sterile conditions, it was shown that mechanical mounting of the membrane was sufficient. But depending on the culture medium, different behavior of the membrane, and of its mounting was observed leading to leaking. This is due to differences in swelling, expansion, and wrinkling of the membrane during pretreatment, conditioning and storage in liquid as already described. To exclude leakages of the inlay due to the mounting, a suitable gluing method was developed (details see section Materials and Methods). The inlay with the successfully glued membrane was systematically tested for sterilizability according to the technical conditions described in GMP-Berater (2018) for pure-culture processes using three state-of-the art sterilization methods. The visual characterization of the inlay and the glued membrane after sterilization with dry heat (Figure 8B) and γ-sterilization (Figure 8C) shows yellow coloration of the membrane and gluing surface. The coloration after sterilization with dry heat was more intense than with γ-radiation. The glue especially shows an increased optical response. Nevertheless, the connection between the membrane and the PEEK-inlay was reliable; the membranes did not show any visible damages and were not melted or leaky.
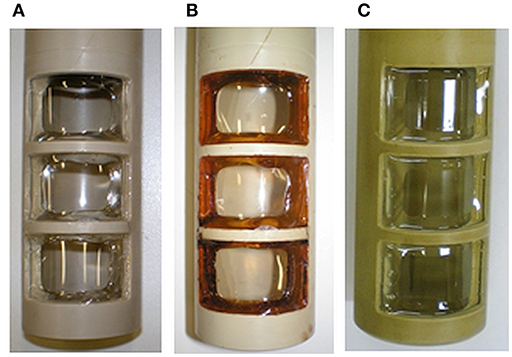
Figure 8. Glued membrane before (A) and after sterilization with dry heat (B) and γ-radiation (C).
The sterilization with damp heat (Sterilization 1) exposes the membrane to liquid and supersaturated steam at a temperature of 121°C for 20 min. First, the behavior of the membrane itself was tested. Figure 9 shows the enlargement of the membrane sheet after autoclaving in distilled (Figure 9B) and de-ionized water (Figure 9C), while the use of tap water (Figure 9D), and 5 wt-% NaCl solution (Figure 9E) does not result in a change of size. None of the membranes were damaged or melted, but structural changes of the membranes were observed after swelling (B and C had become soft and sensitive). The use of tap water did not result in a change of the stability of the membrane but led to wrinkles (D). Autoclaving using a 5 wt-% NaCl solution seemingly did not influence the structural integrity of the membrane (E).
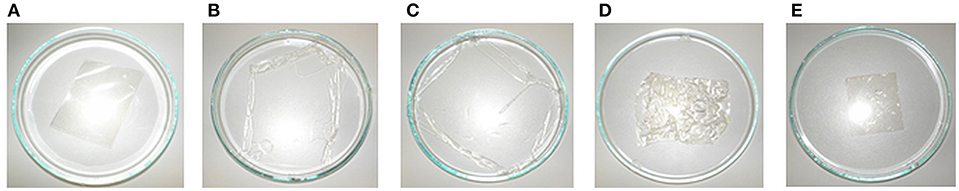
Figure 9. Photographs of membrane before (A) and after autoclaving in distilled water (B), deionized water (C), tap water (D), and 5 wt-% NaCl solution (E).
For investigations using the glued membrane, the inlays were autoclaved in de-ionized water and tap water. The glued bonding was stable, and the membranes did not show any damages and were not melted. However, distinct structural changes of the membrane were observed after swelling. The membranes autoclaved in de-ionized water lost physical stability (Figure 10A) and were more sensitive to shear stress. Using tap water, the membranes were slightly wrinkled after autoclaving (Figure 10B) but could achieve their initial state after drying (Figure 10C). The glue was visually unchanged and kept the membrane in shape. These very first results demonstrate that the membranes tolerate the sterilization conditions but suffer some changes in their physical properties after the pretreatment with demineralized water.
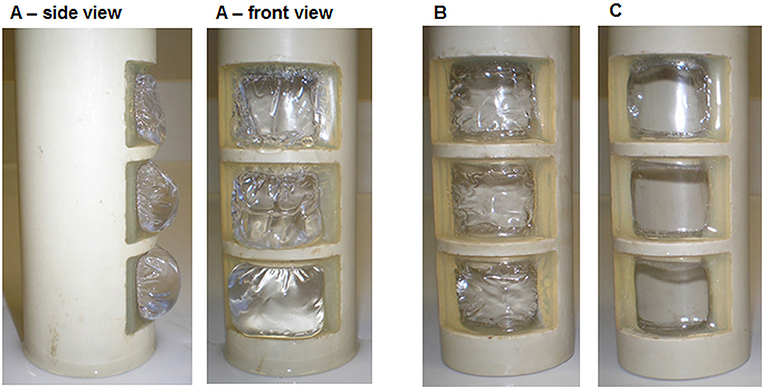
Figure 10. Membrane after autoclaving in de-ionized water (A), tap water (B), and subsequent drying after autoclaving in tap water (C).
Specifically, for the two-chamber electrobioreactor (setups 3 and 4), the variation of the window size, the use of window grills and further membrane developments are required. Subsequent investigations with several adhesives and the development of possible mechanical or thermal connection between the membrane and the inlay are absolutely necessary. As alternatives to polymer-based membranes, other (porous) materials can be applied. Here, the uses of ceramic or porous glass seem to be the materials of choice for the harsh sterilization conditions, but they have limitations in selectivity, and permeability (Krieg et al., 2019).
Conclusions
Electrobioreactors were created by introducing an upgrade kit into a 1 L BSTR. The upgrade kit severely changes the fluid dynamics in the reactor, as characterized by the volumetric mass transfer coefficient kLa and mixing time θ, and as shown by CFD modeling. Derived by model-based predictions, small changes in the stirrer geometry (advanced stirrer) were realized experimentally. This resulted in considerably improved mass transfer performance in terms of increase of the velocity magnitude to up to 5.5 m s−1 and in removal of “dead zones” (i.e., volumes with velocity magnitudes <0.1 m s−1) of the electrobioreactor (setup 4), being kLa, and θ values better than in “conventional” bioreactors (setup 1). The sterilizability of the inlay, being an assembly of polymer-based membrane glued to the PEEK-based cylinder, was demonstrated. The scale-up of a sterilizable two-chamber BSTR-based electrobioreactor might very likely be developed from an autoclavable to an in-situ sterilizable system. Consequently, the steam sterilization is an essential step in this development. This will require in-depth investigations concerning mechanical stability and functionality of the potential membrane materials. Although in-situ sterilization is preferred, the ex-situ sterilization using dry heat or γ-radiation is a temporarily acceptable solution, demanding an aseptic working environment which allows sterile transfer of the extern sterilized inlay into the bioreactor. Furthermore, the operational reliability of all sterilized components of the upgrade kit (inlay chamber, membrane, working-, counter- and reference electrode) must be tested. Microbial and electrochemical methods for surveying functionality in modus operandi should be established and integrated into the monitoring technology of electrobioreactors, e.g., electrochemical impedance spectroscopy (Koók et al., 2019).
Data Availability
The datasets generated for this study are available on request to the corresponding author.
Author Contributions
FH, LR, and SH contributed the conception and design of the study. LR performed all modeling experiments, analyzed the modeling, and experimental data, performed the statistical analysis, prepared figures, and wrote sections of the manuscript. SH constructed the upgrade kit, performed the sterilization experiments, analyzed data, prepared figures, and wrote sections of the manuscript. TZ performed experiments for kLa and θ determination and analyzed the respective data. BS provided guidance on data analysis and manuscript preparation, discussed the data, and wrote sections of the manuscript. FH conceived of the study, advised and provided guidance on all experiments, obtained funding, and wrote the manuscript. All authors contributed to manuscript revision, read and approved the submitted version.
Funding
FH acknowledges support by the BMBF (Research Award Next generation biotechnological processes–Biotechnology 2020+) and the Helmholtz-Association (Young Investigators Group). This work was supported by the Helmholtz-Association within the Research Programme Renewable Energies.
Conflict of Interest Statement
The authors declare that the research was conducted in the absence of any commercial or financial relationships that could be construed as a potential conflict of interest.
Acknowledgments
Peter Portius and co-workers from the workshop of the UFZ Leipzig are acknowledged for their excellent service for building the upgrade kits.
Supplementary Material
The Supplementary Material for this article can be found online at: https://www.frontiersin.org/articles/10.3389/fenrg.2019.00098/full#supplementary-material
Footnotes
1. ^https://ec.europa.eu/research/participants/data/ref/h2020/wp/2014_2015/annexes/h2020-wp1415-annex-g-trl_en.pdf
2. ^https://knowledge.autodesk.com/support/cfd/learn-explore/caas/CloudHelp/cloudhelp/2019/ENU/SimCFD-UsersGuide/files/GUID-81E86432-7979-41AF-A7C2-9123144FC6F9-htm.html
References
Enzmann, F., Mayer, F., Stöckl, M., Mangold, K.-M., Hommel, R., and Holtmann, D. (2019). Transferring bioelectrochemical processes from H-cells to a scalable bubble column reactor. Chem. Eng. Sci. 193, 133–143. doi: 10.1016/j.ces.2018.08.056
Garcia-Ochoa, F., and Gomez, E. (2009). Bioreactor scale-up and oxygen transfer rate in microbial processes: an overview. Biotechnol. Adv. 27, 153–176. doi: 10.1016/j.biotechadv.2008.10.006
Garcia-Ochoa, F., Gomez, E., Santos, V. E., and Merchuk, J. C. (2010). Oxygen uptake rate in microbial processes: an overview. Biochem. Eng. J. 49, 289–307. doi: 10.1016/j.bej.2010.01.011
Gimkiewicz, C., Hunger, S., and Harnisch, F. (2016). Evaluating the feasibility of microbial electrosynthesis based on gluconobacter oxydans. Chemelectrochem 3, 1337–1346. doi: 10.1002/celc.201600175
GMP-Berater (2018). “Band 4; Chapter 12: D Sterilisationsverfahren,” in Nachschlagewerk für Pharmaindustrie und Lieferanten, eds B. Peither, T. Peither, and M. P. Ag (Schopfheim: Maas & Peither AG - GMP-Verlag), 1–38.
Harnisch, F., and Holtmann, D. (2019). “Electrification of biotechnology: status quo,” in Bioelectrosynthesis, eds F. Harnisch and D. Holtmann (Cham: Springer International Publishing), 1–14. doi: 10.1007/10_2017_41
Hegner, R., Neubert, K., Rosa, L. F., and Harnisch, F. (2019). Engineering the electrochemical CO2 reduction to formate at bioprocess-compatible conditions to bioreactor scale. ChemElectroChem 6, 3731–3735. doi: 10.1002/celc.201900526
Holtmann, D., and Harnisch, F. (2019). “Electrification of biotechnology: quo vadis?,” in Bioelectrosynthesis, eds. F. Harnisch and D. Holtmann. (Cham: Springer International Publishing), 395–411. doi: 10.1007/10_2018_75
Ibl, N. (1981). Nomenclature for transport phenomena in electrolytic systems. Pure Appl. Chem. 53:1827. doi: 10.1351/pac198153101827
James, O. O., Sauter, W., and Schröder, U. (2018). Towards selective electrochemical conversion of glycerol to 1,3-propanediol. RSC Adv. 8, 10818–10827. doi: 10.1039/C8RA00711J
Jiang, B. L., Muddemann, T., Kunz, U., Bormann, H., Niedermeiser, M., Haupt, D., et al. (2017). Evaluation of microbial fuel cells with graphite plus MnO2 and MoS2 paints as oxygen reduction cathode catalyst. J. Electrochem. Soc. 164, H3083–H3090. doi: 10.1149/2.0131703jes
Kaiser, S. C., Löffelholz, C., Werner, S., and Eibl, D. (2011). “CFD for characterizing standard and single-use stirred cell culture bioreactors,” in Computational Fluid Dynamics Technologies and Applications, eds. I. V. Minin and O. V. Minin (London: InTechOpen), 97–122.
Koch, C., Kuchenbuch, A., Kracke, F., Bernhardt, P. V., Kromer, J., and Harnisch, F. (2017). Predicting and experimental evaluating bio-electrochemical synthesis - a case study with Clostridium kluyveri. Bioelectrochemistry 118, 114–122. doi: 10.1016/j.bioelechem.2017.07.009
Koók, L., Bakonyi, P., Harnisch, F., Kretzschmar, J., Chae, K.-J., Zhen, G., et al. (2019). Biofouling of membranes in microbial electrochemical technologies: causes, characterization methods and mitigation strategies. Bioresour. Technol. 279, 327–338. doi: 10.1016/j.biortech.2019.02.001
Kraume, M. (2004). Transportvorgänge in der Verfahrenstechnik. Grundlagen und apparative Umsetzungen. (Heidelberg: Springer-Verlag).
Krieg, T., Madjarov, J., Rosa, L. F. M., Enzmann, F., Harnisch, F., Holtmann, D., et al. (2019). “Reactors for microbial electrobiotechnology,” in Bioelectrosynthesis, eds F. Harnisch and D. Holtmann. (Cham: Springer International Publishing), 231–271. doi: 10.1007/10_2017_40
Mayr, J., Grosch, J.-H., Hartmann, L., Rosa, L. F. M., Spiess, A. C., and Harnisch, F. (2019). Resting Escherichia coli as chassis for microbial electrosynthesis: production of chiral alcohols. ChemSusChem 12, 1631–1634. doi: 10.1002/cssc.201900413
Meusel, W., Löffelholz, C., Husemann, U., Dreher, T., Greller, G., Kauling, J., et al. (2016). Recommendations for Process Engineering Characterisation of Single-Use Bioreactors and Mixing Systems by Using Experimental Methods. Frankfurt: DECHEMA Gesellschaft für Chemische Technik und Biotechnologie e.V.
Miller, J. C., and Miller, J. N. (1988). Basic statistical methods for analytical chemistry. part I. statistics of repeated measurements. Rev. Anal. 113, 1351–1356. doi: 10.1039/an9881301351
Moutafchieva, D., Popova, D., Dimitrova, M., and Tchaoushev, S. (2013). Experimental determination of the volumetric mass transfer coefficient. J. Chem. Technol. Metal. 48, 351–356.
Nevin, K. P., Hensley, S. A., Franks, A. E., Summers, Z. M., Ou, J., Woodard, T. L., et al. (2011). Electrosynthesis of organic compounds from carbon dioxide is catalyzed by a diversity of acetogenic microorganisms. Appl. Environ. Microbiol. 77, 2882–2886. doi: 10.1128/AEM.02642-10
Nevin, K. P., Woodard, T. L., Franks, A. E., Summers, Z. M., and Lovley, D. R. (2010). Microbial electrosynthesis: feeding microbes electricity to convert carbon dioxide and water to multicarbon extracellular organic compounds. mBio 1:e00103–10. doi: 10.1128/mBio.00103-10
Rosa, L. F. M., Hunger, S., Gimkiewicz, C., Zehnsdorf, A., and Harnisch, F. (2017). Paving the way for bioelectrotechnology: integrating electrochemistry into bioreactors. Eng. Life Sci. 17, 77–85. doi: 10.1002/elsc.201600105
Rozendal, R. A., Jeremiasse, A. W., Hamelers, H. V. M., and Buisman, C. J. N. (2008). Hydrogen production with a microbial biocathode. Environ. Sci. Technol. 42, 629–634. doi: 10.1021/es071720+
Schmitz, S., Nies, S., Wierckx, N., Blank, L. M., and Rosenbaum, M. A. (2015). Engineering mediator-based electroactivity in the obligate aerobic bacterium Pseudomonas putida KT2440. Front. Microbiol. 6:284. doi: 10.3389/fmicb.2015.00284
Schröder, U., Harnisch, F., and Angenent, L. T. (2015). Microbial electrochemistry and technology: terminology and classification. Energy Environ. Sci. 8, 513–519. doi: 10.1039/C4EE03359K
Schütz, B., Seidel, J., Sturm, G., Einsle, O., and Gescher, J. (2011). Investigation of the electron transport chain to and the catalytic activity of the diheme cytochrome c peroxidase ccpA of Shewanella oneidensis. Appl. Environ. Microbiol. 77, 6172–6180. doi: 10.1128/AEM.00606-11
Sevda, S., Dominguez-Benetton, X., Vanbroekhoven, K., Sreekrishnan, T. R., and Pant, D. (2013). Characterization and comparison of the performance of two different separator types in air–cathode microbial fuel cell treating synthetic wastewater. Chem. Eng. J. 228, 1–11. doi: 10.1016/j.cej.2013.05.014
Sturm-Richter, K., Golitsch, F., Sturm, G., Kipf, E., Dittrich, A., Beblawy, S., et al. (2015). Unbalanced fermentation of glycerol in Escherichia coli via heterologous production of an electron transport chain and electrode interaction in microbial electrochemical cells. Bioresour. Technol. 186, 89–96. doi: 10.1016/j.biortech.2015.02.116
Van't Riet, K. (1979). Review of measuring methods and results in nonviscous gas-liquid mass transfer in stirred vessels. Indust. Eng. Chem. Proc. Design Develop. 18, 357–364. doi: 10.1021/i260071a001
Vasconcelos, J. M. T., Alves, S. S., Nienow, A. W., and Bujalsk, W. (1998). Scale-up of mixing in gassed multi-turbine agitated vessel. Can. J. Chem. Eng. 76, 398–404. doi: 10.1002/cjce.5450760308
Xu, H., Wang, K. J., and Holmes, D. E. (2014). Bioelectrochemical removal of carbon dioxide (CO2): an innovative method for biogas upgrading. Bioresour. Technol. 173, 392–398. doi: 10.1016/j.biortech.2014.09.127
Yang, Z. H., Wu, Z., Zeng, G. M., Huang, J., Xu, H. Y., Feng, J., et al. (2014). Assessing the effect of flow fields on flocculation of kaolin suspension using microbial flocculant GA1. RSC Adv. 4, 40464–40473. doi: 10.1039/C4RA04101A
Keywords: bioelectrochemical engineering, bioelectrosynthesis, bioelectrotechnology, electrobioreactor characterization, fluid dynamics, microbial electrosynthesis
Citation: Rosa LFM, Hunger S, Zschernitz T, Strehlitz B and Harnisch F (2019) Integrating Electrochemistry Into Bioreactors: Effect of the Upgrade Kit on Mass Transfer, Mixing Time and Sterilizability. Front. Energy Res. 7:98. doi: 10.3389/fenrg.2019.00098
Received: 10 June 2019; Accepted: 29 August 2019;
Published: 13 September 2019.
Edited by:
Eileen Hao Yu, Newcastle University, United KingdomReviewed by:
Lars Regestein, Leibniz Institute for Natural Product Research and Infection Biology, GermanyJean-Marie Fontmorin, University of Rennes 1, France
Copyright © 2019 Rosa, Hunger, Zschernitz, Strehlitz and Harnisch. This is an open-access article distributed under the terms of the Creative Commons Attribution License (CC BY). The use, distribution or reproduction in other forums is permitted, provided the original author(s) and the copyright owner(s) are credited and that the original publication in this journal is cited, in accordance with accepted academic practice. No use, distribution or reproduction is permitted which does not comply with these terms.
*Correspondence: Falk Harnisch, ZmFsay5oYXJuaXNjaEB1ZnouZGU=