 Priyadharshini Mani1*
 V. T. Fidal2
 Kyle Bowman1Mark Breheny1T. S. Chandra2
 Taj Keshavarz1
 Godfrey Kyazze1*
- 1School of Life Sciences, University of Westminster, London, United Kingdom
- 2Department of Biotechnology, Indian Institute of Technology Madras, Chennai, India
More than 80% of wastewater from industries is discharged into receiving water bodies without any pollution control. Microbial fuel cells (MFCs) are a promising technology for the simultaneous treatment of wastewater and electricity production. With regard to azo-dye containing wastewater (e.g., from textile manufacturing), the dye may be fed via the anode chamber containing electrochemically active bacteria or via the cathode chamber containing laccase enzyme as catalyst for oxygen reduction. This study investigated which of the two approaches is the best with regard to rate of decolourization of the dye (Acid orange 7), COD reduction and electricity production. The power density was higher for the MFCDye Cathode (50 ± 4 mW m−2, COD reduction 80.4 ± 1.2%) compared with 42.5 ± 2.6 mW m−2 (COD reduction 69 ± 2%) for MFCDye Anode. The time required for decolourization was longer in the MFCDye Anode (Shewanella oneidensis) where only 20% decolourization was obtained after 24 h compared to 80% for the MFCDye Cathode. The anodic dye degradation products were unstable when exposed to air resulting in regaining of color. In case of degradation by laccase in the cathode chamber, the decolourization products were stable and simpler in chemical structure as determined by GC-MS. This work suggests that feeding azo dyes in cathode chambers of MFCs containing laccase is a better way of treating the dyes compared to the commonly used approach of feeding the dye in the anode chamber provided enzyme activity can be sustained.
Introduction
Azo dyes are the most common type of synthetic dyes used in the textile industry. These dyes are known to be xenobiotic compounds that possess electron withdrawing groups that generates electron deficiency thereby making them resistant to degradation (Singh et al., 2014). The dyes go through activated sludge systems unchanged and while there are physical-chemical processes like advanced oxidation, coagulation/flocculation and membrane filtration, these processes are costly and produce a sludge waste which creates a disposal problem.
Microbial fuel cells (MFCs) are extensively explored for treatment of dye containing wastewater and simultaneous electricity production. The major advantages of MFC compared to the conventional wastewater treatment methods are (1) Potential for power production rather than power consumption (2) Low sludge yield (3) Operates at mild temperatures and atmospheric pressure (4) MFCs offer the possibility of carrying out either anodic oxidation or cathodic reduction of the dyes.
In a MFC there are two modes of dye decolourization i.e., at anode and at cathode. At the anode under anaerobic conditions the -N = N- bond is cleaved in the presence of microorganisms to form aromatic amines (Figure 1; Fernando et al., 2014; Mani et al., 2017).
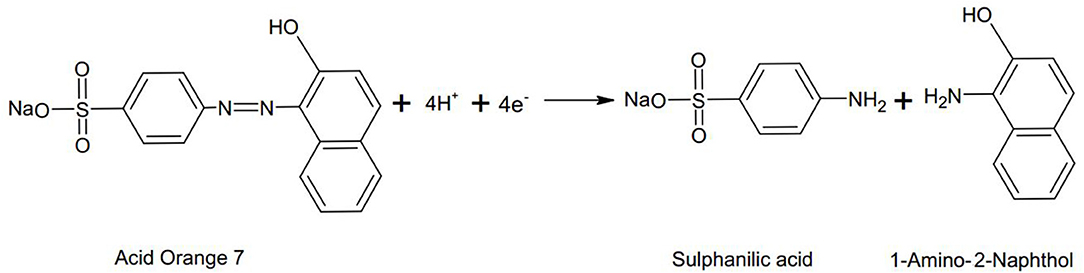
Figure 1. An example illustrating the anaerobic reductive cleavage of azo bond in Acid orange 7 dye (Fernando, 2014).
Some researchers have also reported that the reduction is mediated by reduced compounds e.g., sulfides, or by redox mediators or the dye itself that act as a terminal electron acceptor with electron transfer being aided by cytochromes and ultimately to the azoreductase on the outside of the membrane (Russ et al., 2000; Pandey et al., 2007). The aromatic amines produced during anode dye decolourization are recalcitrant in nature and do not undergo further degradation in that environment. They can be further reduced to less toxic products in the aerobic stage.
Laccase has been widely used for various types of dye decolourization studies (Daâssi et al., 2013; Ramírez-Montoya et al., 2015; Iark et al., 2019). The major advantage of laccase is that it degrades the dye by non-specific free radical mechanism to form phenolic products thereby avoiding the formation of aromatic amines (Chivukula and Renganathan, 1995). In MFC, laccase and its fungal source was employed at cathode for oxygen reduction reaction (ORR) and dye degradation by Savizi et al. (2012), Simões et al. (2019). The aerobic degradation by laccase yielded products that are less toxic than the original dye.
There are various studies that have investigated azo dye decolourization in the anode and others in the cathode (Huang et al., 2017; Lai et al., 2017; Mani et al., 2018). It is not clear which approach is the best as different studies used different organisms, operating conditions, cathode catalyst etc., making a direct comparison of decolourization rates for each system difficult (Table 1). This is the first study to understand the mechanism of dye decolourization in both the processes (anode & cathode), and the nature of products formed, while operating under the same conditions.
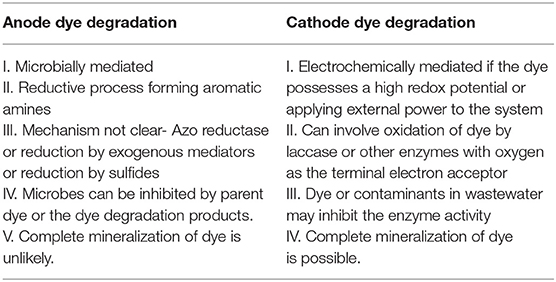
Table 1. Features of dye degradation in the anode vs. cathode of MFCs.
This study compared the performance of MFCs treating Acid Orange 7 under anaerobic condition in the presence of bacteria at the anode of MFC and in aerobic condition in the presence of laccase enzyme at the cathode of MFC. The rate of dye decolourization, power density, COD reduction, degradation products and their toxicity were used as performance indicators.
Materials and Methods
Experimental Design
The MFCs used in the study were the ‘H’-type reactors with a working volume of 200 ml in each chamber. The electrodes were constructed from carbon fiber (non-woven) with a surface area of 25 cm2. The anolyte consisted of minimal salts medium containing (per liter): 0.46 g NH4Cl, 0.22 g (NH)2SO4, 0.117 g MgSO4, 7.7 g Na2HPO4.7H2O, 2.87 g NaH2PO4 along with 1% (v/v) trace minerals as described by Marsili et al. (2008) and 1% (v/v) vitamin mix as described by Wolin et al. (1963). The carbon source was pyruvate at a concentration of 1 g L−1 and casein hydrolysate was added at 500 mg L−1. The pH of the anode solution was adjusted to 7. pH and ionic strength were measured using a calibrated benchtop combined pH and ionic strength meter (pH/CON 700 meter, Cole-Parmer, UK). The concentration of Acid orange 7 dye used was 100 mg L−1.
Three MFC systems were setup. System 1 was dye in the anode with Shewanella oneidensis MR1, and laccase enzyme in the cathode, subsequently to be referred to as “MFC Dye Anode.” System 2 was with S. oneidensis in the anode and laccase in the presence of dye in cathode, subsequently to be referred to as “MFC Dye Cathode” and System 3 with absence of dye in both chambers known as “MFCControl” (Supplementary Figure 1). Crude commercial laccase enzyme (T. versicolor, 10 Units mg−1) obtained from Enzyme India Pvt. Ltd, Chennai was used at an activity of 0.3 U ml−1 freely suspended in 200 ml of 100 mM acetate buffer (pH 4.5).
Operating Conditions
The anode and cathode electrodes were connected to a resistor of 2 kΩ. The anode was inoculated with 10% v/v S. oneidensis MR-1 culture previously grown in Luria Bertani broth to log phase (OD: 0.4). The anode chamber was sparged for 10 min with nitrogen gas to remove any dissolved oxygen and maintain an anaerobic environment.
The cathode chamber was maintained in aerobic conditions by supplying air through an air stone at a rate of 200 ml air per min. Experiments were conducted at a temperature of 30°C. All experiments were performed in triplicates.
Analytical Procedures
Acid Orange 7 Decolourization
The decolourization of AO7 was measured at various time intervals using a UV-visible spectrophotometer at a wavelength of 484 nm which is the maximum absorption wavelength for AO7. The decolourization efficiency (DE) was calculated by
Ao and At are the absorbance units at the initial and each time point, respectively. A time series was plotted for the absorbance values measured.
Electrochemical Analysis
The voltage across the system was recorded every 10 min using a data acquisition system Picolog (Pico Technology, UK). The current through the unit was calculated using Ohm's Law:
The power produced was calculated using the following formula:
where P is power in Watts, I is current in amperes and V is the electric potential in volts.
The power and current per surface area of electrode (25 cm2) was used to calculate the power and current density. To carry out polarization tests, each MFC unit was connected to various external resistances ranging from 10 Ω to 1 MΩ and the potential measured using a multimeter.
Coulombic Efficiency (CE)
The CE was calculated by the following formula (Logan et al., 2006):
where M is the molecular weight of oxygen (32), is the integration of current over the time period in an experiment (C), b number of electrons exchanged per mole of oxygen (4), F is Faraday constant (96485 C mol−1), Vanode is working volume of anode and COD is change in COD over time (g L−1).
Chemical Oxygen Demand (COD)
COD was measured by the standard closed reflux titrimetric method described by Environment Agency (UK), based on APHA method 5220D. The samples obtained from the MFCs were centrifuged at 4,000 g for 10 min and the supernatant was then filtered through 0.2 μm filter to remove suspended biomass. To 2 ml of appropriately diluted samples 4 ml of COD reagent- Ficodox (Fisher Scientific) containing sulphuric acid, K2Cr2O7, Ag2SO4 was added and digested at 150°C for 2 h. The samples were then titrated against Ferrous Ammonium Sulfate (0.025 M) by adding 2 drops of Ferroin indicator to determine the residual K2Cr2O7 present.
The COD was calculated by the following formula:
where, DF is the dilution factor, M is the molarity of FAS (0.025), Vb and Vs are the titrant volumes of FAS for blank and substrate.
Identification of Dye Degradation Metabolites by Gas Chromatography/Mass Spectrometry (GC-MS)
The dye degradation products from both the anode and cathode chamber were analyzed through GC-MS. The samples were extracted with dichloromethane (DCM) using liquid:liquid extraction at a combination of pHs (acidic, neutral, and basic). This modification of pH effectively neutralizes any charged compounds (e.g., phenolics, amines etc.) and allows a better partition into the organic solvent. For the extraction, 2 ml of sample (various pH) was added to 2 ml dichloromethane (DCM) to allow the compounds to separate from the aqueous phase to organic phase. The sample at pH 7 was best extracted into DCM. The extracted sample was introduced into the GC-MS (Agilent) equipped with Restek Rxi-5 ms (20 m × 180 μm × 0.18 μm) column. The initial temperature was held at 40°C for 1 min, and then ramped at 10°C min−1 until 340°C which was then held for 10 min. The interface temperature was 280°C. A 1 μl sample was injected on a pulsed splitless injection at 250°C. The flow rate of carrier gas helium was at 1.1 ml min−1. Electron ionization (EI) was used with MS source temperature at 230°C and Quad temperature at 150°C. The m/z range selected was from 25 to 750 amu. The products were identified using NIST mass spectra database. Internal standards were injected in between the samples to validate the method used.
Microtox Toxicity Analysis
The toxicity of the samples were measured by the Microtox toxicity assay using the bioluminescence bacteria Vibrio fischeri (Hao et al., 1996).
The Shewanella decolourized products (anode); the autooxidation products of Shewanella sp. and laccase dye degradation (cathode) samples were centrifuged at 4000 g, the cells harvested, washed twice with sterile phosphate buffer (100 mM, pH 7.1) and suspended in 2% NaCl. Serial dilutions of the samples with 2% NaCl in the presence of the V. fischeri cell suspension was carried out in a 96 well-plate. The plate was incubated at 15°C for 10 min and the luminescence was measured using a Fluostar Optima plate reader. The absolute light units were recorded and IC50, a concentration which inhibits 50% of light was calculated for each sample.
Cyclic Voltammetry (CV of Dye Degradation Products)
CV measurements were carried out for standards 1-Amino-2-Naphthol, sulfanilic acid, acid orange 7 dye and the dye degradation products. A three-electrode system with the working electrode as glassy carbon, platinum as the counter, and Ag/AgCl as reference electrode was used. The three standard compounds were prepared in deionized water at a concentration of 100 mg L−1. The dye degradation products were filtered to remove any bacterial cells to prevent interference. CV was carried out using a potentiostat Keysight B2900A by cycling between potentials of −1 V to 1.5 V at 50 mV s−1.
Statistical Analysis
All experimental data indicated in the text and graphs are the means of triplicate experiments unless otherwise stated. The error bars in the graphs and values in the text represent the standard deviation of the mean (SD).
Results and Discussion
Power Generation and COD Reduction
The open circuit voltage (OCV) was highest for MFCControl with 1.3 V followed by MFCDye Cathode with 950 and 930 mV for MFC Dye Anode. The maximum power density obtained from MFC Dye Anode was 42.5 ± 2.6 mW m−2 and 50 ± 4 mW m−2 for MFCDye Cathode and 57.8 ± 1.6 mW m−2 for MFCControl (Figure 2A). The lower power density in case of dye in the anode indicates that the presence of AO7 had a significant effect on the growth rate of S. oneidensis. One of the major reasons affecting the cell viability might be the accumulation of anaerobic degradation products of azo dyes such as aromatic amines which are known to be toxic to the bacteria. Moreover, it has been reported that the reduction of azo dyes by S. oneidensis under anaerobic condition is enhanced by mediators such as flavins and quinones (von Canstein et al., 2008; Le Laz et al., 2014). These flavins produced by Shewanella are also responsible for the extracellular electron transfer to the electrode at the anode (Marsili et al., 2008). The competition of electrons from the flavins between dye and electrode might result in lower power in the MFCDye Anode. Another possible mechanism for lower power is as suggested by Sun et al. (2013) that in biological decolourization of dyes in MFCs a portion of the available electrons are transported to electrode while another portion of electrons are used for reductive decolourization of dyes. The absence of dye in both chambers increased the power in MFCControl due to bacteria shuttling electrons to the electrode rather than the dye and at cathode the electrode is the sole electron donor to laccase. The internal resistance of MFCControl was lowest with 1.5 ± 0.07 kΩ followed by the MFCDye Anode with 1.72 ± 0.11 kΩ and highest for MFCDye Cathode with 1.9 ± 0.13 kΩ (Figure 2B).
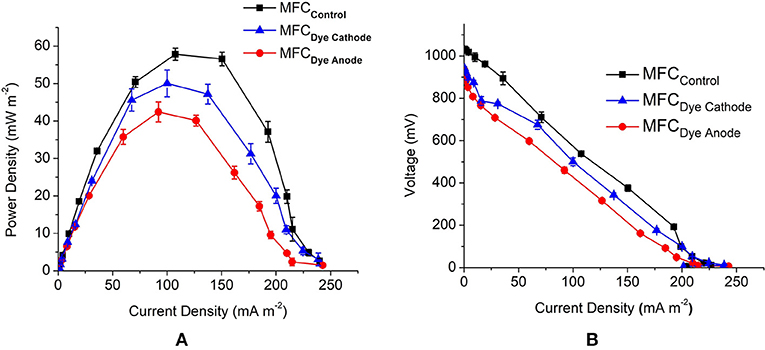
Figure 2. (A) Comparison of MFC performance for all MFC systems obtained by varying the external circuit resistance (10 Ω-1 MΩ) (B) polarization curves for all the systems used in the study.
There was 80.4 ± 1.2% reduction in COD for MFCDye Cathode which was closely followed by the control system with 79.2 ± 1.3% reduction for MFCControl and finally 69 ± 2% for MFCDye Anode on day 3 of the study. The Coulombic efficiency (CE) of the systems also followed the trend with 5% for MFCControl, 4.7 and 3.6% for MFCDye Cathode and MFCDye Anode, respectively. Overall, on comparing the voltage, CE, power density, and COD MFCControl performance was the best.
In the absence of dye at cathode, laccase accepts electrons from the electrode for oxygen reduction reaction. The redox potential of the dye (0.653 V vs. SHE) is lower than that of laccase at 0.78 V vs. SHE, therefore, in the system MFCDye Cathode the dye is oxidized easily for electrons that are used for ORR. The lower power in MFCDye Cathode than MFCControl might be due to the inhibition of the enzyme activity by the dye or its degradation products. Since the bacterial electron transfer is quite slow, the anode reaction acts as a rate limiting step in the MFC. As a result, whilst there is competition between the dye and electrode for electron transfer to laccase or inhibition of laccase by the dye, the power is not significantly affected by the cathode reaction (Supplementary Figure 2).
AO7 Dye Decolourization
The decolourization of Acid Orange 7 was measured at the maximum absorption wavelength for the dye (484 nm). The rate of decolourization was faster in the MFCDye Cathode compared to MFC Dye Anode. There was >80% decolourization within the first 24 h for laccase compared to 20% for MFC Dye Anode (Figure 3). The overall dye decolourization in 96 h was 97 ± 2% for MFCDye Anode and 98 ± 3% for MFCDye Cathode. In MFCDye Anode, the bacteria have an initial lag phase (slower decolourization) followed by a log phase where there is an increased decolourization rate. Hence the time taken to reach maximum power density was also slower in case of dye in the anode as compared to the dye in the cathode.
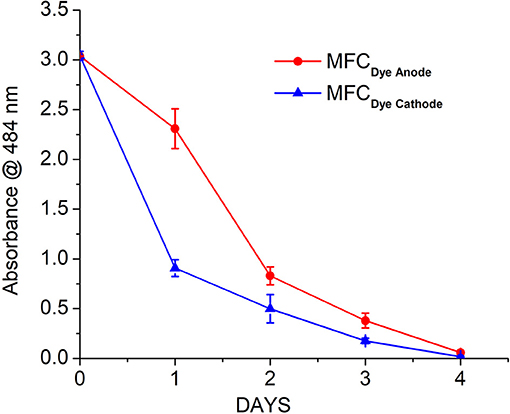
Figure 3. Decolourization of AO7 in the anode (Shewanella oneidensis) and cathode (Laccase) of MFC over a period of 4 days.
Anaerobic treatment of azo dyes involves the reductive cleavage of the N = N to form colorless aromatic amines. In the anode, azo dye under anaerobic conditions is reduced by Shewanella via azoreductase enzyme or by the Mtr respiratory pathway. Initially an azo reductase enzyme was speculated to be responsible for degradation of azo dyes by Shewanella, but these enzymes were effective only with cell extracts and not with intact cells. Thus, establishing that decolourization is mainly an extracellular process (Brigé et al., 2008). Recent studies have shown that Mtr respiratory pathway in S. oneidensis MR1 is responsible for azo dye reduction under anaerobic condition in which OmcA/MtrC plays the role of “azo reductase” (Hong and Gu, 2010). Flavins have been reported to aid and enhance the decolourization process (Cai et al., 2012). This is in concurrence with the lower power obtained for dye in anode due to the dye being the alternative electron acceptor to the electrode. Since azo dyes are large and usually charged, they are likely to be reduced extracellularly or with membrane bound enzymes.
The decolourization by laccase follows an entirely different mechanism than the bacteria. There is production of free radicals by laccase enzyme that carries out non-specific attack of the dye at various positions to yield a number of products. The dye decolourization was faster with enzyme due to the faster reaction kinetics of enzyme compared to the bacteria.
Electrochemical Analysis of Dye Degradation Products
The anode dye degradation products were analyzed using cyclic voltammetry for the presence of reduction end products. The CV was compared with the standard compounds viz. acid orange 7, sulfanilic acid (SA), and 1-amino-2-naphthol (1-A-2-N). Standard sulfanilic acid showed strong oxidation/reduction peaks at 0.94 V/0.811 V and a weak oxidation/reduction couple at 0.27 V/0.211 V vs. Ag/AgCl (Figure 4). The CV of initial AO7 dye produced a redox couple at 0.89 V/0.7 V and 0.11 V /−0.08 V vs. Ag/AgCl, respectively (Figure 4A). The shift in the peak potential is due to the presence of both SA and 1-A-2-N in the parent dye. The S. oneidensis degraded dye product showed a characteristic peak at 0.96 V indicating the presence of sulfanilic acid (Figure 4B). There was no peak observed for 1-A-2-N, which might be the result of limited solubility of the compound in water. Thus, it can be inferred that mechanism of dye degradation in anode is through the cleavage of the N = N azo bond separating the two rings. On the other hand, the laccase dye degradation at the cathode did not show any characteristic redox peaks indicating a completely different mechanism (Figure 4B). Since the redox peaks for both AO7 and sulfanilic acid were absent it can be presumed that the degradation involves a ring cleavage thus releasing the characteristic functional groups.
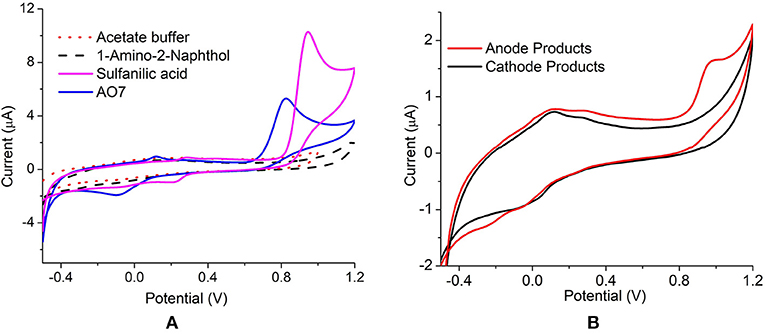
Figure 4. Cyclic Voltammetry of (A) parent dye (AO7), standards SA and 1-A-2-N (B) anode and cathode decolourized products, at 50 mV s−1 vs. Ag/AgCl.
Auto-Oxidation of S. oneidensis (Anode) Decolourized Products
The anaerobic dye degradation products (colorless) on exposure to air regained color. This phenomenon of color formation from decolourized products was referred to as auto-oxidation (Figure 5).
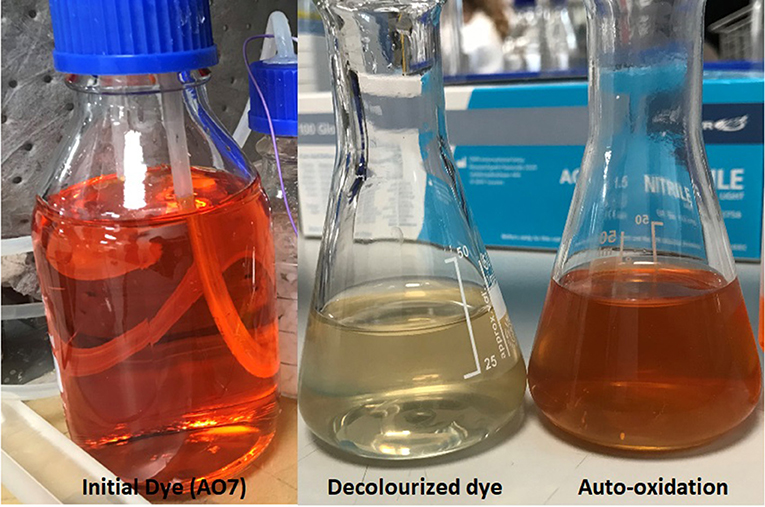
Figure 5. The depiction of initial colored dye together with the decolourized products and the colored auto-oxidation products.
To determine the possibility of auto-oxidation occurring in other azo dyes the anaerobic decolourization of Congo Red (CR), a diazo dye, was carried out in the presence of S.oneidensis to observe the stability of the decolourized products. Similar to AO7, the CR decolourized products were also auto-oxidized on exposure to air. Initially it was hypothesized the color formation might be due to the diazotization (-N = N-) of the auto-oxidized products to form the initial dye. Therefore, a UV-scan of the decolourized products, auto-oxidized products, and the initial dye for both AO7 and CR was performed. The scan results revealed that the color was not due to the formation of -N = N- present in the initial dyes (Figure 6).
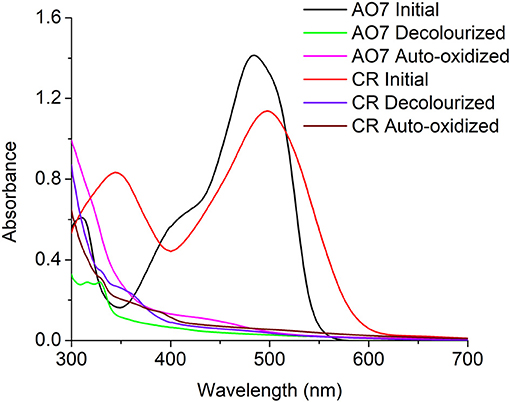
Figure 6. UV-Scan of AO7 and CR initial dye, decolourized products, and Auto-oxidation products indicating the color in the auto-oxidation products was not a result of diazotization.
The auto-oxidation effect on anaerobic azo dye degradation products was first observed by Kudlich et al. (1999). They determined that mono and diazo sulfonated dyes that produced aminohydroxynaphthalenesulfonate (AHNS) by-products were unstable, sensitive to oxygen, and underwent dimerization to form colored products. The auto-catalysis of Acid Orange 7 (AO 7) studied by Carvalho et al. (2008) detected that 1-amino-2-naphthol, formed by reductive cleavage of the dye, when exposed to aerobic conditions yielded products that are brown in color.
The nature of auto-oxidation products of AO7 has not been discussed in literature thus far. A GC-MS analysis of these products was performed to identify and determine the pathway that leads to the formation of color.
GC-MS Analysis of Dye Degradation Products
Shewanella Oneidensis MR1 (Anode) Dye Degradation Products
The mechanism of the dye degradation analyzed by CV was further confirmed with GC-MS. Under anaerobic condition in MFCDye Anode, S. oneidensis was observed to symmetrically cleave the azo bond resulting in the formation of 1-amino-2-naphthalenol (1-A-2-N) (M+H+ = 159, Rt: 18.13) and aminobenzene sulfonic acid (sulfanilic acid) (Figure 7). Sulfanilic acid (SA) being highly polar molecule was not detected in GC-MS. 2-amino-1-naphthalenol (M+H+ = 159, Rt: 18.49) was also present in the degradation products of Shewanella indicating the formation of various aromatic amine metabolites during the reductive decolourization of AO7 (Figure 7). The presence of aminobenzenes under anaerobic dye decolourization of AO7 was also observed by Fernando et al. (2012).
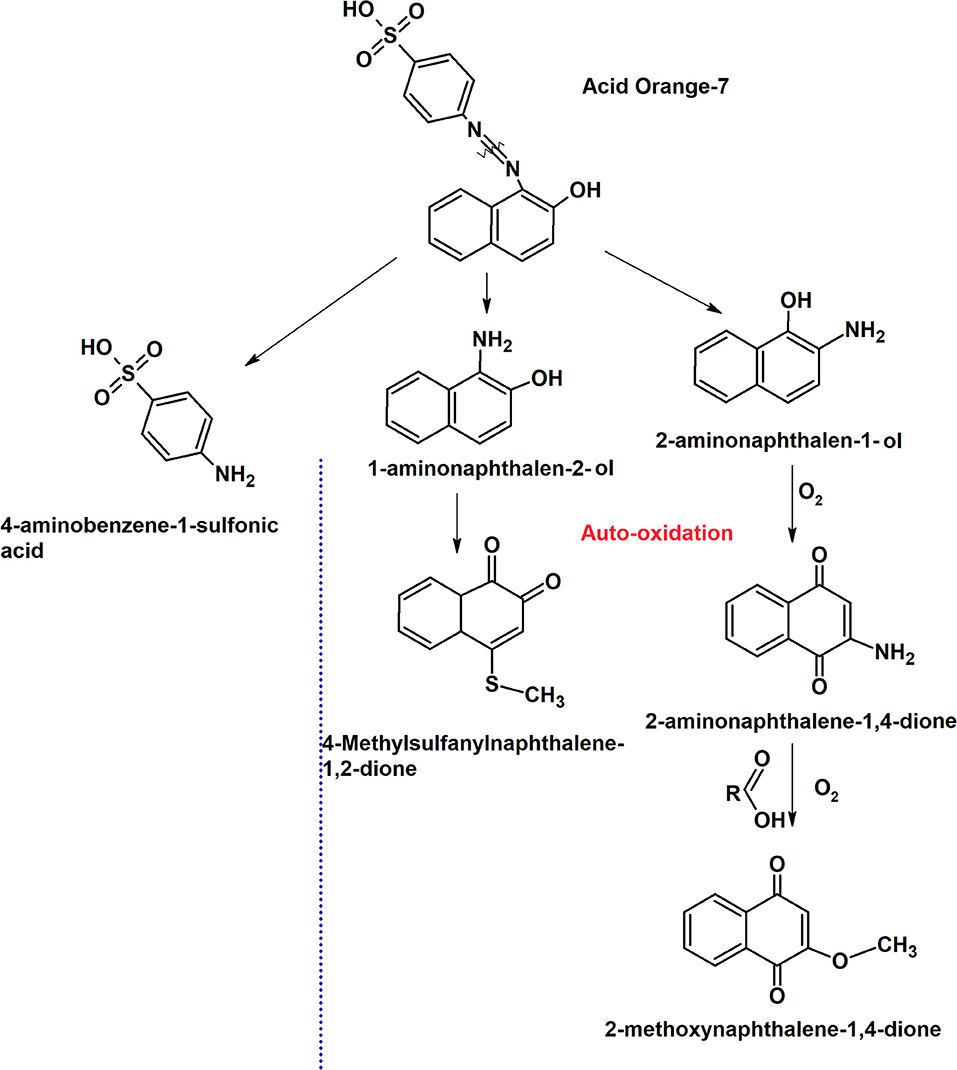
Figure 7. Putative dye degradation pathway by S. oneidensis MR 1 at the anode and the auto-oxidation mechanism based on the intermediate products obtained from GC-MS analysis.
Auto-Oxidation Products and Mechanism
The initial products obtained were the same as in anode dye decolourized i.e., 1-amino-2-naphthalenol (1-A-2-N) (M+H+ = 159, Rt: 18.13), aminobenzene sulfonic acid (sulfanilic acid), 2-amino-1-naphthalenol (2-A-1-N) (M+H+ = 159, Rt: 18.49). On exposure to oxygen, 2-amino-1-naphthalenol was oxidized to 2-amino-1,4-naphthoquinone (2ANQ) (M+H+ = 173, Rt: 15.75; Figure 7). The 2ANQ further underwent substitution reaction with carboxylic acids (acetate from bacterial metabolism) in the reaction medium to produce 2-methoxy-1,4-naphthoquinone (2MNQ) (M+H+ = 188, Rt: 14.84) an orange colored product (Figure 7). 2MNQ is an orange color organic pigment originally derived from the soil (Lambert et al., 1971). The color formation in the auto-oxidized products might be due to the presence of the above pigment.
The other quinones observed in the GC-MS of auto-oxidation products were 4-quinolinecarboxyaldehyde (M+H+ = 157, Rt:11.61) and 4-Thio-methyl-1,2-naphthoquinone (M+H+ = 176, Rt:14.43) with 1,2- naphthoquinone being a product of 1-A-2-N oxidation (Figure 7). A clear mechanism of sulfanyl group (SO2−) addition could not be further explained. Quinones are precursors for anthraquinone dyes and a number of these compounds have a chromophore moiety (Matsuoka, 1990). The production of quinone intermediates during anaerobic degradation of dyes is seen in number of mono and diazo dyes. In general, quinones possess redox mediating properties, and aid in azo dye decolourization by transferring electrons between dye and bacteria (Van der Zee et al., 2000).
The presence of a variety of quinone intermediates and their subsequent conversion products that yield a color clearly indicates the mechanism of color formation due to auto-oxidation.
This was also observed by Kudlich et al. (1999) in which the naphthalene derivatives of azo dye degradation underwent auto-oxidation to form dimers which resulted in color formation. In their study the oxidation of aminohydroxynaphthalenesulfonates (AHNS) to naphthoquinonesulfonates and their subsequent dimerization developed a colored product. The substitution reaction with carboxylic acid might be similar to that of 5-hydroxy-1,4-naphthoquinone when treated with acetic anhydride to form 5-hydroxy-3-methoxy-1,4-naphthoquinone (Blauenburg et al., 2012).
Laccase Dye Degradation Products and Mechanism
The first step in laccase degradation mechanism for system MFCDye Cathode is the decolourization of the Acid Orange 7 dye by asymmetric cleavage of the -N = N- bond to form intermediates Naphthalen-2-ol and (4-sulfophenyl) diazenyl (Figure 8).
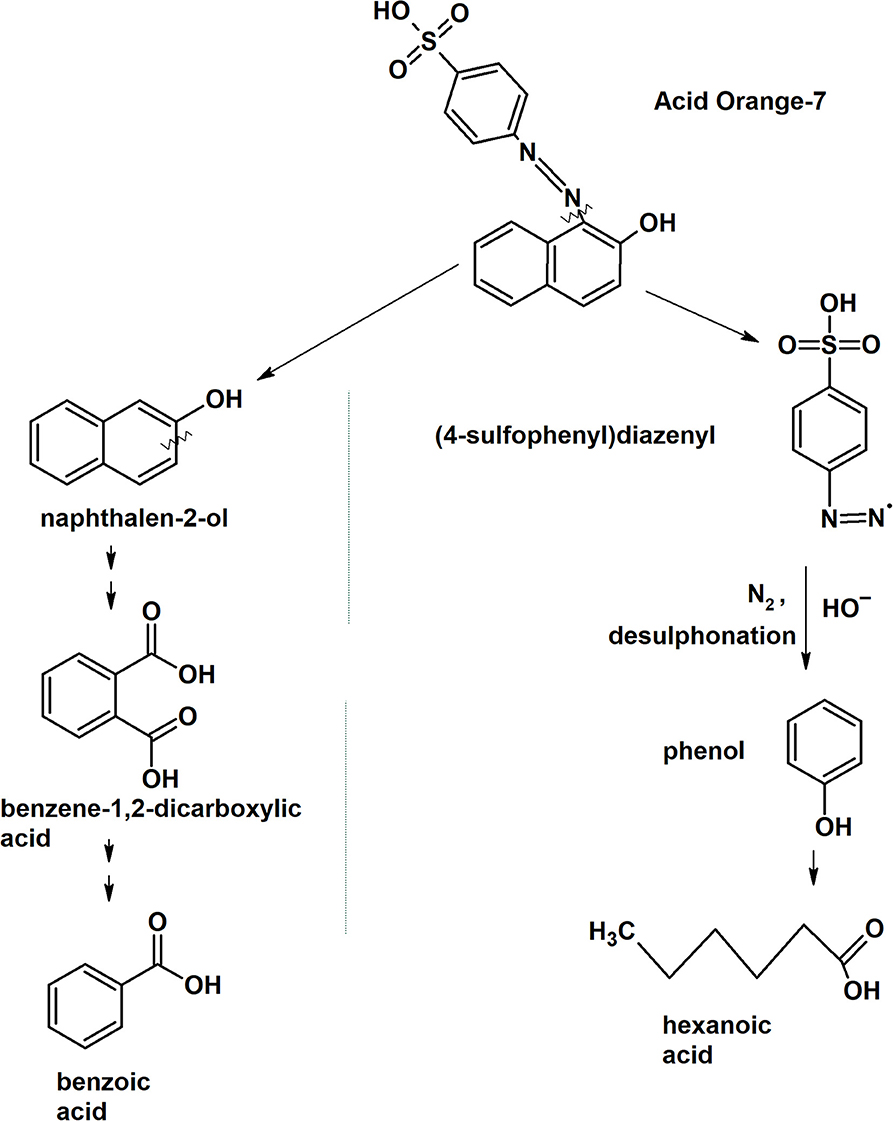
Figure 8. Putative laccase dye degradation pathway deduced from the intermediates form GC-MS analysis.
The intermediate Naphthalen-2-ol undergoes aromatic ring cleavage to produce 1,2-Benzenedicarboxylic acid (Phthalic acid) (M+H+ = 149.1, Rt:9.50). Pthalic acid functional group is further oxidized to form benzoic acid (M+H+ = 105, Rt: 7.89; Figure 8).
The other intermediate (4-sulfophenyl)diazenyl was subjected to oxidative desulfonation to form phenyldiazenyl. Phenyl diazene radical rapidly loses nitrogen (N2) as gas molecule and the nucleophilic substitution of hydroxyl radical (OH−) on the aromatic ring results in the formation of phenol. Phenols are the natural substrates for laccase therefore the oxidative ring cleavage of phenol ring was carried out to form fatty acid such as hexanoic acid (M+H+ = 60, Rt: 4.95; Figure 8). Hexanoic acid is a non-toxic compound that is present in food products available for human consumption.
The benzoic acid pathway was also observed by Fernando et al. (2014) for aerobic degradation of AO7 suggesting that mono-oxygenase enzymes from bacteria were capable of the degradation pathway. Due to the slow bacterial metabolism, only the larger intermediate products were observed in their study. The rapid laccase reaction in this study led to the formation of smaller and simple products.
The symmetric and asymmetric cleavage depends on the dye structure and the type of enzyme used. It is suggested that bacterial laccase with low redox potential are not capable of cleaving the azo bond. Pereira et al. (2009) observed that laccase from Bacillus subtilis oxidized mono azo dye Sudan Orange G to produce oligomers and polymers by radical coupling reactions without the cleavage of the azo bond. Therefore, fungal laccase with high redox potential can effectively cleave the azo bonds to bring about decolourization.
Similar pathway was also observed for degradation of Remazol brilliant blue dye by P. ostreatus laccase with successive deamination, hydroxylation, oxidation followed by the ring cleavage (Zhuo et al., 2019). The formation of phenyl diazene radical and loss of N2 was also observed by Chivukula and Renganathan (1995) for degradation of phenolic azo dyes by P. oryzae laccase. The attack of dioxygen on phenolic ring cleavage by laccase is widely seen in oxidation of lignin products and catechol (Crestini and Argyropoulos, 1998; Chen et al., 2017). Laccase oxidation of dye is through highly reactive free radicals that are involved in the above reactions and since they are non-specific a wide number of products are formed. This mechanism produces phenol-based products thereby avoiding the formation of toxic aromatic amines (Figure 8).
Toxicity Analysis
The toxicity of the samples was analyzed by V. fischeri toxicity assay to determine the percentage inhibition of the dye degradation products to the bacterial cells. The samples were subjected to dilutions and the corresponding inhibition values were plotted against each dilution (Figure 9).
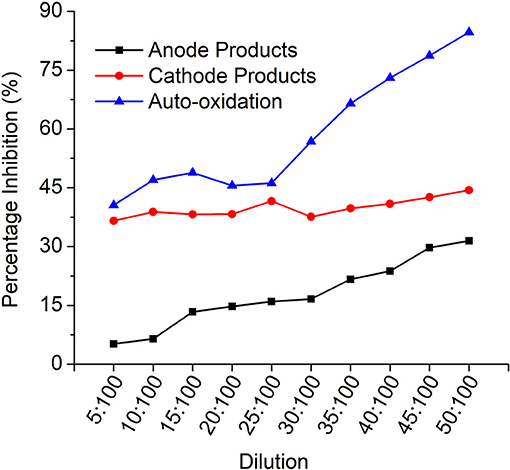
Figure 9. Vibrio fischeri toxicity profile indicating the % inhibition for each dilution for all the products.
It is evident that the auto-oxidation products have higher inhibition compared to anode (MFCDye Anode) and cathode (MFCDye Cathode) treated products. In the initial concentration, cathode treated products are comparatively more inhibitive than the anode products. As seen in the graph on increasing the concentration, the anode products have an upward trend while laccase products are quite constant throughout. As the concentration of the anode effluents increase the toxicity increases. Similar trend was observed for the auto-oxidation products.
Laccase degradation of dye is through a free radical mechanism that produces a huge number of products (phenol, benzoic acid, hexanoic acid) compared to Shewanella degradation. These products are monocyclic hydrocarbons that could be degraded readily in next stages of water treatment. The LD50 concentration of benzoic acid for mammalian cells is 2.3 gm/Kg (MSDS, Sigma Aldrich). The overall concentration of the dye is 100 mg/L in this study. Therefore, the concentration of dye breakdown would be expected to be lower than 100 mg/L, which is a very low concentration to exhibit toxicity. The horizontal curve for cathode products might be due to the formation of phenol-based products by laccase that are toxic to the V. fischeri or the consumption of the dissolved oxygen by laccase enzyme that created anoxic conditions for the bacteria. Vibrio fischeri is a highly sensitive organism and it's EC50 for phenol is 23 mg L−1 (Fernando et al., 2014).
In contrast, 1-amino-2-napthalenol obtained from by reductive cleavage of the dye by S. oneidensis is known to be xenobiotic and are classified as possible human carcinogens by the International Agency for Research on Cancer (Group 1 or 2B) and the European Union (Category 1A or 1B). In Japan, 20% of workers involved in the production of aromatic amines developed uroepithelial cancer (Hamasaki et al., 1996). The auto-oxidation of these amines yielded products that are more toxic than the parent amines.
The auto-oxidation products showed highest toxicity to the Vibrio cells due to the presence of naphthoquinone intermediates (Figure 7). Naphthoquinones are highly reactive oxidative species that are known to cause cellular oxidative stress that affects the signaling pathway in the cells (Klotz et al., 2014). Quinones are used for medicinal purposes due to their anti-fungal, anti-bacterial and antioxidant properties. They are used in cancer drugs due their ability to form Reactive oxygen species (ROS) that attack and destroy the tumor cells (Verrax et al., 2011).
The toxicity measurements are a relative comparison between each system. There are various methods for testing the toxicity depending on the application of the discharged effluents. In this study, Microtox assay was utilized due to its high level of sensitivity compared to methods like MTT.
Conclusion
In the current study two different systems i.e., MFC with dye at the anode in presence of S. oneidensis and MFC with dye at cathode in the presence of laccase, were explored for AO7 degradation. The power density was higher in MFCDye Cathode with 50 ± 4 mW m−2 compared to MFCDye Anode with 42.5 ± 2.6 mW m−2. The same trend was followed for CE (4.7 and 3.6% for MFCDye Cathode and MFCDye Anode) and COD (80.4 ± 1.2% for MFCDye Cathode and 69 ± 2% for MFCDDye Anode), respectively. The time required for decolourization was longer with bacteria (anode) where only 20% decolourization was obtained after 24 h whereas there was >80% for laccase during the same time. The anode decolourized products were found to be unstable when exposed to oxygen resulting in autooxidation and regaining of the color. GC-MS analysis revealed simpler compounds such as benzoic acid and hexanoic acid for laccase, whereas S. oneidensis produced aromatic amines. The color formation in auto-oxidation was likely due to the presence of quinones produced by oxidation of the aromatic amines. These auto oxidized products had higher toxicity than the initial anode and cathode dye degradation products. Therefore, from this study it was observed that laccase based MFC-dye decolourization systems are best suited for degradation and detoxification of azo dyes while producing good power output. Thus, the current study also provides an insight into the different mechanisms and pathways leading to maximal degradation of the azo dyes.
Data Availability
All datasets generated for this study are included in the manuscript/Supplementary Files.
Author Contributions
GK, TC, and TK formulated the design of the experiments. PM, KB, and MB carried out the experiments. VF carried out the data analysis. PM wrote the first draft of the manuscript. GK edited the manuscript to the level at which it was submitted. All authors proof-read the draft.
Funding
This work was part of Newton-Mosharafa Institutional Links project fully funded by the Science and Technology Development Fund in Egypt (ID 27662) and British Council in UK (ID 261690585).
Conflict of Interest Statement
The authors declare that the research was conducted in the absence of any commercial or financial relationships that could be construed as a potential conflict of interest.
Supplementary Material
The Supplementary Material for this article can be found online at: https://www.frontiersin.org/articles/10.3389/fenrg.2019.00101/full#supplementary-material
Supplementary Figure 1. Graphical representation of the study.
Supplementary Figure 2. Relative enzyme activity of laccase in the absence and presence of the dye.
References
Blauenburg, B., Metsä-Ketelä, M., and Klika, K. D. (2012). Formation of 5-hydroxy-3-methoxy-1,4-naphthoquinone and 8-Hydroxy-4-methoxy-1,2-naphthoquinone from Juglone. ISRN Org. Chem. 2012, 1–7. doi: 10.5402/2012/274980
Brigé, A., Motte, B., Borloo, J., Buysschaert, G., Devreese, B., and Van Beeumen, J. J. (2008). Bacterial decolorization of textile dyes is an extracellular process requiring a multicomponent electron transfer pathway. Microb. Biotechnol. 1, 40–52. doi: 10.1111/j.1751-7915.2007.00005.x
Cai, P. J., Xiao, X., He, Y. R., Li, W. W., Chu, J., Wu, C., et al. (2012). Anaerobic biodecolorization mechanism of methyl orange by Shewanella oneidensis MR-1. Appl. Microbiol. Biotechnol. 93, 1769–1776. doi: 10.1007/s00253-011-3508-8
Carvalho, M. C., Pereira, C., Gonçalves, I. C., Pinheiro, H. M., Santos, A. R., Lopes, A., et al. (2008). Assessment of the biodegradability of a monosulfonated azo dye and aromatic amines. Int. Biodeter. Biodegr. 62, 96–103. doi: 10.1016/j.ibiod.2007.12.008
Chen, M., Wang, L., Tan, T., Luo, X. C., Zheng, Z., Yin, R. C., et al. (2017). Radical mechanism of laccase-catalyzed catechol ring-opening. Wuli Huaxue Xuebao/Acta Phys. 33, 620–626. doi: 10.3866/PKU.WHXB201612011
Chivukula, M., and Renganathan, V. (1995). Phenolic azo dye oxidation by laccase from Pyricularia oryzae. Appl. Environ. Microbiol. 61, 4374–4377.
Crestini, C., and Argyropoulos, D. S. (1998). The early oxidative biodegradation steps of residual kraft lignin models with laccase. Bioorg. Med. Chem. 6, 2161–2169. doi: 10.1016/S0968-0896(98)00173-4
Daâssi, D., Zouari-Mechichi, H., Frikha, F., Martinez, M. J., Nasri, M., and Mechichi, T. (2013). Decolorization of the azo dye acid orange 51 by laccase produced in solid culture of a newly isolated Trametes trogii strain. 3 Biotech 3, 115–125. doi: 10.1007/s13205-012-0076-2
Fernando, E. (2014). Treatment of Azo Dyes in Industrial Wastewater Using Microbial Fuel Cells. PhD thesis, Univ. Westminster, UK. Available online at: http://westminsterresearch.wmin.ac.uk/14330/
Fernando, E., Keshavarz, T., and Kyazze, G. (2012). Enhanced bio-decolourisation of acid orange 7 by Shewanella oneidensis through co-metabolism in a microbial fuel cell. Int. Biodeterior. Biodegr. 72, 1–9. doi: 10.1016/j.ibiod.2012.04.010
Fernando, E., Keshavarz, T., and Kyazze, G. (2014). Complete degradation of the azo dye Acid Orange-7 and bioelectricity generation in an integrated microbial fuel cell, aerobic two-stage bioreactor system in continuous flow mode at ambient temperature. Bioresour. Technol. 156, 155–162. doi: 10.1016/j.biortech.2014.01.036
Hamasaki, T., Aramaki, K., Hida, T., Inatomi, H., Fujimoto, N., Okamura, T., et al. (1996). [Clinical study of occupational uroepithelial cancer]. J. UOEH 18, 247–59. doi: 10.7888/juoeh.18.247
Hao, O. J., Chien-Jen, S., Chen-Fang, L., Fu-Tien, J., and Zen-Chyuan, C. (1996). Use of microtox tests for screening industrial wastewater toxicity. Water Sci. Technol. 34, 43–50. doi: 10.2166/wst.1996.0237
Hong, Y.-G., and Gu, J.-D. (2010). Physiology and biochemistry of reduction of azo compounds by Shewanella strains relevant to electron transport chain. Appl. Microbiol. Biotechnol. 88, 637–643. doi: 10.1007/s00253-010-2820-z
Huang, W., Chen, J., Hu, Y., Chen, J., Sun, J., and Zhang, L. (2017). Enhanced simultaneous decolorization of azo dye and electricity generation in microbial fuel cell (MFC) with redox mediator modified anode. Int. J. Hydrogen Energy 42, 2349–2359. doi: 10.1016/j.ijhydene.2016.09.216
Iark, D., Buzzo, A. J., Garcia, J. A. A., Côrrea, V. G., Helm, C. V., and Corrêa, R. C. G. (2019). Enzymatic degradation and detoxification of azo dye Congo red by a new laccase from Oudemansiella canarii. Bioresour. Technol. 289:121655. doi: 10.1016/j.biortech.2019.121655
Klotz, L. O., Hou, X., and Jacob, C. (2014). 1,4-naphthoquinones: from oxidative damage to cellular and inter-cellular signaling. Molecules 19, 14902–14918. doi: 10.3390/molecules190914902
Kudlich, M., Hetheridge, M. J., Knackmuss, H.-J., and Stolz, A. (1999). Autoxidation reactions of different aromatic o-aminohydroxynaphthalenes that are formed during the anaerobic reduction of sulfonated azo dyes. Environ. Sci. Technol. 33, 896–901. doi: 10.1021/es9808346
Lai, C. Y., Wu, C. H., Meng, C. T., and Lin, C. W. (2017). Decolorization of azo dye and generation of electricity by microbial fuel cell with laccase-producing white-rot fungus on cathode. Appl. Energy 188, 392–398. doi: 10.1016/j.apenergy.2016.12.044
Lambert, E. N., Seaforth, C. E., and Ahmad, N. (1971). The occurrence of 2-Methoxy-l,4-naphthoquinone in caribbean vertisols. Soil Sci. Soc. Am. Proc. 35, 7–8. doi: 10.2136/sssaj1971.03615995003500030037x
Le Laz, S., Kpebe, A., Lorquin, J., Brugna, M., and Rousset, M. (2014). H2-dependent azoreduction by Shewanella oneidensis MR-1: involvement of secreted flavins and both [Ni–Fe] and [Fe–Fe] hydrogenases. Appl. Microbiol. Biotechnol. 98, 2699–2707. doi: 10.1007/s00253-013-5208-z
Logan, B. E., Hamelers, B., Rozendal, R., Schroder, U., Keller, J., Freguia, S., et al. (2006). Microbial fuel cells: methodology and technology. Environ. Sci. Technol. 40, 5181–5192. doi: 10.1021/es0605016
Mani, P., Keshavarz, T., Chandra, T. S., and Kyazze, G. (2017). Decolourisation of Acid orange 7 in a microbial fuel cell with a laccase-based biocathode: influence of mitigating pH changes in the cathode chamber. Enzyme Microb. Technol. 96, 170–176. doi: 10.1016/j.enzmictec.2016.10.012
Mani, P., Kumar, V. T. F., Keshavarz, T., Chandra, T. S., Kyazze, G., Mani, P., et al. (2018). The role of natural laccase redox mediators in simultaneous dye decolorization and power production in microbial fuel cells. Energies 11:3455. doi: 10.3390/en11123455
Marsili, E., Baron, D. B., Shikhare, I. D., Coursolle, D., Gralnick, J. A., and Bond, D. R. (2008). Shewanella secretes flavins that mediate extracellular electron transfer. PNAS 105, 6–11. doi: 10.1073/pnas.0710525105
Matsuoka, M. (ed.). (1990). “Quinone Dyes,” in Infrared Absorbing Dyes (Boston, MA: Springer), 35–43. doi: 10.1007/978-1-4899-2046-1_4
Pandey, A., Singh, P., and Iyengar, L. (2007). Bacterial decolorization and degradation of azo dyes. Int. Biodeterior. Biodegrad. 59, 73–84. doi: 10.1016/j.ibiod.2006.08.006
Pereira, L., Coelho, A. V., Viegas, C. A., Santos, M. M. C., dos Robalo, M. P., and Martins, L. O. (2009). Enzymatic biotransformation of the azo dye Sudan Orange G with bacterial CotA-laccase. J. Biotechnol. 139, 68–77. doi: 10.1016/j.jbiotec.2008.09.001
Ramírez-Montoya, L. A., Hernández-Montoya, V., Montes-Morán, M. A., Jáuregui-Rincón, J., and Cervantes, F. J. (2015). Decolorization of dyes with different molecular properties using free and immobilized laccases from Trametes versicolor. J. Mol. Liq. 212, 30–37. doi: 10.1016/j.molliq.2015.08.040
Russ, R., Rau, J., and Stolz, A. (2000). The function of cytoplasmic flavin reductases in the reduction of azo dyes by bacteria. Appl. Environ. Microbiol. 66, 1429–34. doi: 10.1128/AEM.66.4.1429-1434.2000
Savizi, I. S. P., Kariminia, H. R., and Bakhshian, S. (2012). Simultaneous decolorization and bioelectricity generation in a dual chamber microbial fuel cell using electropolymerized-enzymatic cathode. Environ. Sci. Technol. 46, 6584–6593. doi: 10.1021/es300367h
Simões, M. F., Maiorano, A. E., dos Santos, J. G., Peixoto, L., de Souza, R. F. B., Neto, A. O., et al. (2019). Microbial fuel cell-induced production of fungal laccase to degrade the anthraquinone dye Remazol Brilliant Blue R. Environ. Chem. Lett. 17, 1413–1420. doi: 10.1007/s10311-019-00876-y
Singh, R. P., Singh, P. K., and Singh, R. L. (2014). Bacterial decolorization of textile azo dye acid orange by Staphylococcus hominis RMLRT03. Toxicol. Int. 21, 160–166. doi: 10.4103/0971-6580.139797
Sun, J., Li, W., Li, Y., Hu, Y., and Zhang, Y. (2013). Redox mediator enhanced simultaneous decolorization of azo dye and bioelectricity generation in air-cathode microbial fuel cell. Bioresour. Technol. 142, 407–414. doi: 10.1016/j.biortech.2013.05.039
Van der Zee, F. P., Lettinga, G., and Field, J. A. (2000). The role of (auto)catalysis in the mechanism of an anaerobic azo reduction. Water Sci. Technol. 42, 301–308. doi: 10.2166/wst.2000.0528
Verrax, J., Beck, R., Dejeans, N., Glorieux, C., Sid, B., Pedrosa, R. C., et al. (2011). Redox-active quinones and ascorbate: an innovative cancer therapy that exploits the vulnerability of cancer cells to oxidative stress. Anticancer. Agents Med. Chem. 11, 213–21. doi: 10.2174/187152011795255902
von Canstein, H., Ogawa, J., Shimizu, S., and Lloyd, J. R. (2008). Secretion of flavins by Shewanella species and their role in extracellular electron transfer. Appl. Environ. Microbiol. 74, 615–623. doi: 10.1128/AEM.01387-07
Wolin, E. A., Wolin, M. J., and Wolfe, R. S. (1963). Formation of methane by bacterial extracts. J. Biol. Chem. 238, 2882–6.
Keywords: azo dyes, laccase, microbial fuel cells, decolourization, degradation
Citation: Mani P, Fidal VT, Bowman K, Breheny M, Chandra TS, Keshavarz T and Kyazze G (2019) Degradation of Azo Dye (Acid Orange 7) in a Microbial Fuel Cell: Comparison Between Anodic Microbial-Mediated Reduction and Cathodic Laccase-Mediated Oxidation. Front. Energy Res. 7:101. doi: 10.3389/fenrg.2019.00101
Received: 25 June 2019; Accepted: 02 September 2019;
Published: 18 September 2019.
Edited by:
Uwe Schröder, Technische Universitat Braunschweig, GermanyReviewed by:
S. Venkata Mohan, Indian Institute of Chemical Technology (CSIR), IndiaFederico Aulenta, Water Research Institute (IRSA), Italy
Copyright © 2019 Mani, Fidal, Bowman, Breheny, Chandra, Keshavarz and Kyazze. This is an open-access article distributed under the terms of the Creative Commons Attribution License (CC BY). The use, distribution or reproduction in other forums is permitted, provided the original author(s) and the copyright owner(s) are credited and that the original publication in this journal is cited, in accordance with accepted academic practice. No use, distribution or reproduction is permitted which does not comply with these terms.
*Correspondence: Priyadharshini Mani, UHJpeWFkaGFyc2hpbmkuTWFuaUBteS53ZXN0bWluc3Rlci5hYy51aw==; Godfrey Kyazze, Ry5LeWF6emVAd2VzdG1pbnN0ZXIuYWMudWs=