 Lola Gonzalez Olias
 Petra J. Cameron3
 Mirella Di Lorenzo
- 1Centre for Biosensors, Bioelectronics and Biodevices (C3Bio) and Department of Chemical Engineering, University of Bath, Bath, United Kingdom
- 2Water Innovation Research Centre, University of Bath, Bath, United Kingdom
- 3Department of Chemistry, University of Bath, Bath, United Kingdom
The growing use of herbicides in agriculture poses increasing concerns on the pollution of water systems worldwide. To be able to assess the presence of these compounds in waters and limit their impact on human health and ecosystems, the development of effective in-situ monitoring tools is key. Yet, many existing sensing technologies are not suitable for in-situ and remote applications, due to challenges in portability, durability, cost, and power requirements. In this study, we explore for the first time the use of an algae-assisted cathode in a photosynthetic microbial fuel cell (p-MFC) as a self-powered dissolved oxygen probe for herbicides detection in water. The cathode is enriched with the alga Scenedesmus obliquus and two different electrode materials are tested, graphite felt and indium tin oxide, which differ in porosity, surface roughness, and transparency. Despite the much larger specific surface area of graphite felt compared to indium tin oxide, the current generated under light was only 10 times larger (109 ± 2 μA vs. 10.5 ± 0.6 μA) and eight times larger in the dark (37 ± 5 vs. 4.2 ± 0.6 μA). By generating a current output that correlates with the dissolved oxygen in the catholyte, the resulting p-MFCs could detect the EU legal atrazine concentration limit of 0.1 μg L−1. The use of graphite felt led to shorter response times and better sensitivity, as a result of the greater current baseline. In both cases, the current baseline was recovered after exposure of the sensor to frequent toxic events, thus showing the resilience of the cathodic biofilm and the potential of the p-MFCs for early warnings of herbicides pollution in water.
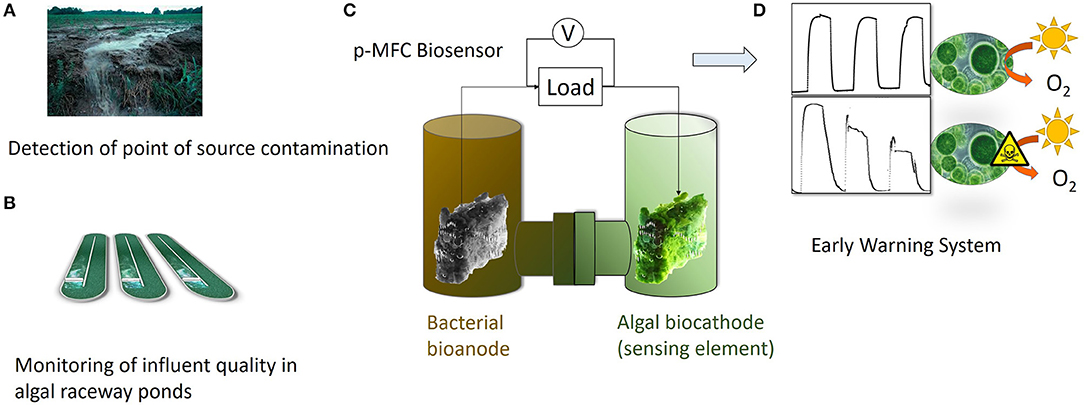
Graphical Abstract. The photosynthetic MFC (p-MFC) presented in this work could target either point source contamination (A) or help monitoring the quality of influents in algal raceway ponds (B). A two-chamber configuration is proposed, in which the algae-assisted cathode acts as a DO probe (C). The presence of a bioactive compound in the catholyte, such as atrazine, will cause a drop in the DO, which is translated into a change in the output signal generated by the p-MFC (D). Therefore, the p-MFC acts as a self-powered early warning tool.
Introduction
Agricultural pollution is one of the major causes of degradation of water systems worldwide. Population growth, and the consequent increase in food demand, has led to an intensified use of pesticides and chemical fertilizers in agriculture that contaminate waters, posing serious risks to aquatic ecosystems and human health (FAO). In the EU, different directives, such as the Ground Water Directive, the Drinking Water Directive and the Water Framework Directive, regulate the maximum concentrations of individual pesticides and their degradation products in waters. To enforce these directives, reliable analytical methods for in situ monitoring of chemical pollutants in water are required (Lepom et al., 2009).
Whole cell electrochemical biosensors represent a promising technology for water quality monitoring, leading to affordable technologies that can be used also in the most remote and poorest areas of the world, while moving away from the need of centralized analytical laboratories and the requirement of specialized personnel (Chouler et al., 2019). Particularly attractive is Microbial Fuel Cell (MFC) technology, which has also the potential benefit of self-powered operations (Labro et al., 2017).
Recently, the use of algae as the biorecognition element in photosynthetic MFC (p-MFC) based sensors has been reported (Chouler et al., 2019). Algae bring the benefits of great susceptibility toward a wide range of pollutants, but are particularly interesting for herbicide detection, as these compounds specifically disrupt the activity of photosynthetic cells. In p-MFCs algae can be used at the anode or at the cathode and act, respectively, as the electron donor or as a source of electron acceptor. In the case of an algae-assisted anode, the presence of a pollutant interferes with the electrons generated, thus causing a change in the baseline current. On this basis, the detection of the herbicide atrazine (Chouler et al., 2019), as well as other pollutants such as Zn, Cu, Ta (Labro et al., 2017), and formaldehyde (Chouler et al., 2019) was recently demonstrated. In these systems, however, the stability of the signal output is greatly influenced by changes in pH and BOD, which challenges their practical applications in field. An algae-assisted cathode as sensing element would instead generate a more resilient signal to operational disturbances, with the result of a more reliable sensor (Jiang et al., 2017). In this case, the pollutant would cause a change in the photosynthetic generation of oxygen at the cathode, thus affecting the oxidation reduction reaction, and consequently the signal output (Zhang and Angelidaki, 2012). As such, in this study we test for the first time the use of an algae-assisted cathode in a p-MFC based sensor for herbicide detection in water. We also investigate the role that the electrode properties have on the performance of the p-MFCs. In particular, two electrode materials, Graphite Felt (GF) and Indium Tin Oxide coated on Polyethylene Terephthalate (ITO/PET), are tested, which differ for surface area, roughness, and transparency. ITO/PET is widely used in Clark based electrochemical biosensors (Shitanda et al., 2005; Brayner et al., 2011), where photosynthetic oxygen is transduced into current, yet, to the best of our knowledge, its use at the cathode in photosynthetic microbial fuel cells has not been investigated yet.
The electrode properties can play an important role in the reliability and sensitivity of the resulting sensor. The porosity and surface roughness would influence the distribution, thickness and stability of the cathodic biofilm (Schneider et al., 2016). On a porous electrode the biofilm is more resilient to detachment, however mass transport limitations may be introduced. Conversely, the biofilm that develops on a smooth planar surface is homogeneously exposed to bulk conditions, but it is more prone to detachment due to shear forces (Li et al., 2019).
In this study, the cathode is inoculated with the microalgae Scenedesmus obliquus. This is a common eukaryotic alga, typically used for tertiary treatment in wastewater treatment plants, which has been previously tested for herbicide detection (Mofeed and Mosleh, 2013). Atrazine is used as the model herbicide, given its widespread use worldwide and the concerns about its high toxicity to aquatic life (Singh et al., 2018). The electrochemical performance of the resulting systems is presented, and their ability to detect atrazine in water, due to changes in the dissolved oxygen, assessed.
Materials and Methods
Materials
All reagents were purchased from Sigma Aldrich, unless otherwise specified.
Bold Basal Medium (BBM) was prepared by adding in 1 L of distilled water (Kakarla and Min, 2014): 0.25 g L −1 NaNO3; 0.075 g L −1 MgSO4·7H2O; 0.025 g L −1 NaCl; 0.075 g L −1 K2HPO4; 0.175 g L −1 KH2PO4; 0.025 g L −1 CaCl2·2H2O; 0.011 g L −1 H3BO3; 1.0 mL of a trace elements solution (8.82 g L −1 ZnSO4·7H2O, 1.44 g L −1 MnCl2·4H2O, 0.71 g L −1 MoO3, 1.57 g L −1 CuSO4·5H2O, 0.49 g L −1 Co(NO3)2·6H2O); a 1.0 mL EDTA solution (Na2 5.0 g, KOH 3.1 g in 1 L of distilled water); and a 1.0 mL Fe solution (4.98 g FeSO4·7H2O, 0.33 mL concentrated H2SO4 in 1 L of distilled water). The BBM was autoclaved (121°C, 1 bar, 15 min) prior to use. The final pH of the BBM solution was 6.75 ± 0.28 and the conductivity 0.97 ± 0.15 mS cm−1.
Anaerobic sludge was provided by Wessex Water from a wastewater treatment plant in Avonmouth, UK. Artificial wastewater (AWW) was prepared as previously described (Chouler et al., 2017) (pH = 7.56 ± 0.21, conductivity 1.46 ± 0.35 mS cm−1), with potassium acetate (9.8 g L −1) as the carbon source, and autoclaved prior to use.
All aqueous solutions were prepared with reverse osmosis purified water.
The pH was measured with a pH-meter (Thermo Scientific Orion ROSS Ultra pH/ATC Triode, USA). Conductivity was measured with a conductivity benchtop cell (Orion, Thermo Scientific). The dissolved oxygen, DO, of the electrolytes was measured with a DO portable meter (RDO Orion 7003, Singapore). The COD was determined by using a commercial reagent for high range samples (0–14000 ppm, HANNA Instruments HI 839800 COD reactor).
Algal Culture
Scenedesmus obliquus (Dept. of Biology and Biochemistry, University of Bath, UK) was grown in 100 mL of autoclaved BBM, in triplicate, with no additional carbon source, in an incubator at 25°C and a 12/12 h light/dark cycle, on white light (5 lm m−1). The cultures were inoculated at a seeding concentration of 3.8·105 cells mL−1 and maintained within the exponential phase (Figure S1) by discontinuous dilution with BBM. Algal cell biomass was determined by flow cytometry (Guava Easy Cyte, Millipore) and the optical density (OD) by spectroscopy (Spectronic 200, Thermo Scientific) at 750 nm.
Configuration and Operation of the Photo-Microbial Fuel Cell Sensor (p-MFC)
The photo-microbial fuel cell (p-MFC) consisted of a standard H-cell configuration made in glass. Each chamber had a total volume of 26 mL. The two chambers were separated by a Nafion 115 membrane, with an exposed area of 1.13 cm2, and the two electrodes were kept at a fixed distance of 4 cm.
Carbon graphite felt (GF, Online Furnace Services Ltd.) was used as both the anode and cathode electrode, with a projected surface area of 13.6 cm2 (2 × 2 × 0.7 cm). Prior to be used, the GF electrodes were acid treated to enhance both the hydrophilicity and the specific surface area of the graphite fibers, as previously described (Martinez and Di Lorenzo, 2019). For comparison, Indium Tin Oxide, coated with Polyethylene Terephthalate Film (ITO/PET, 60 Ω cm−1, Sigma Aldrich), was also tested as cathode. The ITO/PET electrodes had a projected surface area of 5 cm2 (5 × 1 cm). The p-MFC with GF cathode is hereafter named as p-MFCGF, while the device with ITO/PET as p-MFCITO.
The anode and cathode were connected with Ti wire (25 mm, Advent Research Materials, Oxford, UK) to an external resistance (Rext) of 510 Ohms to polarize the cells and to a data logger (PicoLog High Resolution Data Logger, Pico Technology) to monitor the voltage over time. The voltage (V) across the electrode terminals was measured every minute during normal operation and every 15 s during the toxic events.
The anolyte consisted of a 20% v/v AWW, inoculated with anaerobic sludge for a total COD of 7.41 ± 0.76 mg L −1 (n = 3). The solution was purged for 10 min with N2 prior to use. After the enrichment period (~25 days), the anode was fed only on with AWW and no bacteria, which was replaced on a 4 day basis. During the operation, the anode chamber was sealed with a rubber septum to ensure anaerobic conditions and covered with aluminum foil to prevent the growth of photosynthetic microorganisms.
The catholyte consisted on the algae inoculum in BBM, prepared as detailed above, at a concentration of 4.4 × 10⁵ cells mL−1. The initial conditions of the catholyte were: pH = 7.22; Conductivity = 0.871 mS cm−1; Abs750 = 0.176; DO = 8.45 mg L−1. The cathode chamber was open to air and operated under light/dark cycles of 12/12 h with LEDs lights (light intensity 1 mW cm−1, 4.8 W m−3 warm white, 6,000 K, Lighting Ever, UK.), placed at ~5 cm distance from the cathodes (Figure S2).
After the initial algal inoculation, tap water was added every 2 days to compensate for the evaporation losses. The catholyte was replaced by fresh algae (in the same seeding conditions) after 20 days of operation. After the toxic event, to allow the recovery of the biocathode, the catholyte was replaced by BBM.
The p-MFC cells were operated in batch mode, thus allowing the pH and DO of the catholyte to rise along with the planktonic growth of algae, to mimic the conditions of stagnant eutrophic waters and raceway ponds. Dissolved oxygen, conductivity and pH were monitored during the start-up period. The temperature during operation was 23.9 ± 2.3°C.
The current (I) was calculated according to Ohm's Law (I = V/ Rext) and power (P) was calculated as P = I × V. The internal resistance was calculated from the slope of the middle section of the polarization curves, as previously described (Verstraete and Rabaey, 2006). Maximum power output was obtained from the power curve. For comparison with other studies, power density was normalized by the cathode projected surface area.
Polarization tests were conducted by using a resistance box (RS Components, UK), from Open Circuit Voltage (OCV) to short-circuit across a loading range of 10 MΩ to 500 Ω, and a benchtop multi-meter (RS PRO RS-14 Digital Multimeter). Single electrode potentials were measured against an Ag/AgCl reference electrode (EDAQ, USA), which was placed inside the chamber of the electrode to be tested. Cyclic Voltammetry (CV) measurements were performed in a three-electrode system by using a potentiostat (Autolab Metrohm Potstat 126N AUT85001). In these tests, the anode or the cathode served as the working electrode, a Pt wire (0.5 mm diameter) was used as the counter electrode and Ag/AgCl as the reference electrode. The CVs were carried out at a scan rate of 1 mV s−1, swiping from 0.3 to −0.8 V when the cathode was investigated and from 0.6 to −0.8 V when the anode was tested, with 10 s of stabilization.
Scanning electron microscopy (SEM) was performed as previously described (Chouler et al., 2017) to visualize the biofilm on the electrodes. The resulting images were digitized using a JEOL SEM6480LV scanning electron microscope (JEOL, UK).
Simulating the Toxic Event
Atrazine was used as model substance for the toxic event because of its well-known inhibitory effects on algal photosynthetic activity (Tucci et al., 2019). This was simulated by adding the toxicant to the catholyte for a final concentration ranging from 0.1 μg L−1 up to 10 mg L−1, under agitation (45 rpm). The volume of toxicant injected was small enough to avoid significant changes of conductivity or pH (Figure S3). All experiments were performed in duplicate, unless otherwise specified, and at room temperature.
The sensors' response to atrazine was assessed in terms of response time, tr, and recovery time, trec, calculated as:
Where: tr (h) is the response time, when the current output has reached 95% of its steady state (point C) response after exposure to the pollutants; tD (h) is the time when the initial baseline current is re-established and it is assumed that the p-MFC has recovered from the toxicant event.
The rate of reduction of the signal, SR, in (μA h−1) was calculated as Feng et al. (2013):
Where Ib is the current baseline under light before the event (μA); Ir is the current at tr; and tA is the time of injection of the toxicant.
The response was also assessed in terms of inhibition ratio (%) in both the short and long term, which was calculated as:
Where Inb (μA) is the current baseline established after the toxic event, either in the short or long term. A graphic description of these parameters is provided in Figure S4.
Results and Discussion
Electrochemical Performance of the p-MFCs
This study explores the use of a photosynthetic cathode as the sensing element in a photo microbial fuel cell (p-MFC) sensor for atrazine in water via the detection of dissolved oxygen changes in the catholyte. To evaluate the effect that the electrode porosity and transparency have on the sensing performance, two electrode materials were tested at the cathode: graphite felt (GF), used in p-MFCGF; and ITO/PET (from here on simply referred to as ITO), used in p-MFCITO.
Firstly, the anode and cathode were enriched, respectively, with bacteria and algae. Figure 1A shows the current trend over time for the two p-MFCs. As shown, for the case of p-MFCITO, after only 3 days of operation, a photosynthetic pattern in the output current was observed, which was characterized by current increase under light and current decrease under dark conditions. In the case of p-MFCGF, this light/dark current cycle started after 7 days. This result suggests that that on the ITO electrode the cell attachment and biofilm formation is much more rapid than on GF, which could be a consequence of the higher hydrophilicity and lower porosity of ITO compared to GF (Bombelli et al., 2012; Li et al., 2019).
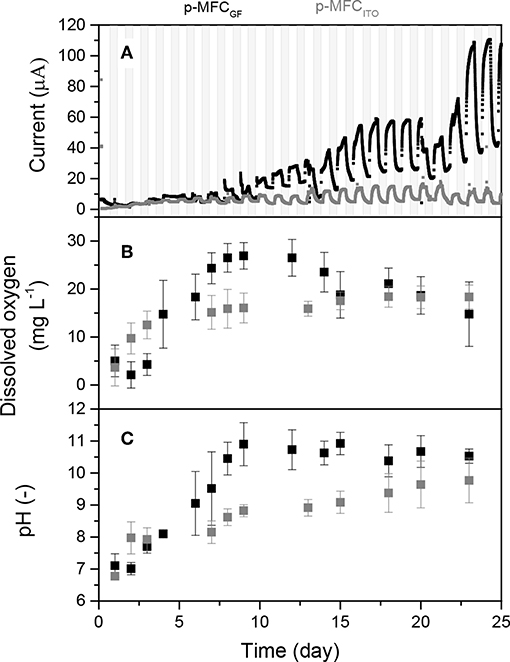
Figure 1. (A) Output current over time generated by the p-MFCs during the first 25 days of operation (start-up period). Data is the average of six replicates. Shadowed areas indicate the operation during the dark cycle. Figure S5 shows data with error bars and data normalized by projected surface area. (B) Dissolved oxygen in the catholyte during the start-up period. (C) pH and conductivity evolution of the catholytes during start-up. In all the graphs, data related to p-MFCITO are reported in gray and data related to p-MFCGF are in black.
In both systems the formation of a green biofilm on the cathode surface was observed after the first week of operation. With p-MFCGF, a current growth curve, typical for anodic biofilm enrichment in microbial fuel cells (Lobato et al., 2013), is observed during a period of over 20 days. After that, the catholyte was replaced with a fresh algal solution. This caused a drop in the current output followed by an increase until reaching a higher steady-state current output (Figure 1A). As shown in Figures 1B,C, pH and DO of the catholyte was quickly recovered after this change. For the case of p-MFCITO, the catholyte replacement on day 20 did not cause marked changed in the current output.
The exponential current increase is not as obvious for p-MFCITO, which suggests that in this system the cathode limits the reaction also at early stages of the enrichment, due to the lower surface area.
After 13 days, a steady-state current was reached for p-MFCITO, while for p-MFCGF 23 days were necessary. The longer time required for p-MFCGF may be the result of the much larger specific surface area available for cell attachment in the case of GF (3D electrode) compared to ITO (2D electrode) (Li et al., 2019). Despite the great difference in the specific surface area, the current obtained with p-MFCGF was, however, only 10 times larger than p-MFCITO under light (109.4 ± 2.6 vs. 10.47 ± 0.63 μA) and eight times larger under dark (36.8 ± 4.9 vs. 4.24 ± 0.57 μA). Similarly, the charge produced by p-MFCGF during the first 24 days of operation was only 2.7 times larger than p-MFCITO (156 and 57 mC, respectively). This result indicates that, for this particular system, ITO is much more efficient than GF as cathodic material for energy production. Nevertheless, maximizing the power performance of the p-MFC would not necessarily lead to better sensing performance or better long term stability.
During the dark cycle, the current baseline generated by p-MFCGF increases over time, probably as a consequence of the increasing oxygen produced and accumulated during the day. As shown in Figure 1B, the DO in the catholyte increases during the first days, to stabilize at a value of 16.4 ± 5.4 mg L−1 once a steady-state light/dark output current trend is reached and an algal biofilm is developed at the cathode (Commault et al., 2014; Colombo et al., 2017). The DO of the catholyte is influenced by multiple factors, i.e., light intensity (Zhao et al., 2013), temperature (Mowjood and Kasubuchi, 1998), algae concentration (Hou et al., 2016), and pH (Colombo et al., 2017). Following the DO trend, the pH of the catholyte also increases with time to reach a value of 10.1 ± 0.5 at steady state (Figure 1C). The increase in the catholyte pH during operation, with respect to the control in which no electrochemical reactions occur (Figure S6), suggests that hydroxide is being produced (Ge et al., 2015). This high value of pH may be the reason why the levels of DO reported in this study are higher than previously observed in other p-MFCs (Table S1). Alkaline conditions at the cathode would prevent the growth of heterotrophic bacteria, which, although tolerating pH values up to 10, grow optimally at neutral pH (He et al., 2008). Consequently, high pH would limit the risk of oxygen consumption in the catholyte not associated to electricity generation (Rago et al., 2017). There is in fact a good correlation between DO and pH of the catholyte (R2 = 0.8), with an increase of 0.144 mg L−1 of DO per unit of pH for both materials. On the other hand, the high pH of the catholyte could be the reason for the relative low power output obtained in this study (Figure S7) compared to similar studies (Table S1), because it affects the cathode potential (Zhang et al., 2017).
In alkaline conditions, the theoretical OCV is 0.45 mV, in agreement with the value obtained in our study and other similar studies on GF (Table S1).
The electrochemical performance of the p-MFCs was assessed by polarization tests and cyclic voltammetry. In order to investigate whether the cathode is the limiting electrode under external load, polarization studies were performed not only on the fuel cell but also on the individual electrodes. Since in this study the cathode is the sensing probe, it should be the limiting electrode, and in order to obtain a direct correlation between DO in the catholyte and current, the limiting reaction should be the cathodic oxygen uptake. To minimize any influence of DO variations, the polarization tests were carried out once the current output reached a steady value during the light cycle (5 h after the start of the light cycle). Figure 2A reports the results obtained for both p-MFC configurations tested. Assuming that the rate of variation of the individual electrode potentials is an indicator for the limiting electrode (Babauta et al., 2012), it can be concluded that in p-MFCITO the cathode limits the reaction in the whole potential window. This result is expected if the relative surface areas of the anode and cathode electrodes are considered. Moreover, SEM images of the cathodes in the two p-MFC configurations (Figure S8) show a much denser biofilm onto the ITO electrode surface, which may lead to greater oxygen diffusion limitations compared to GF. The open structure of the latter could facilitate oxygen transport through the fibers.
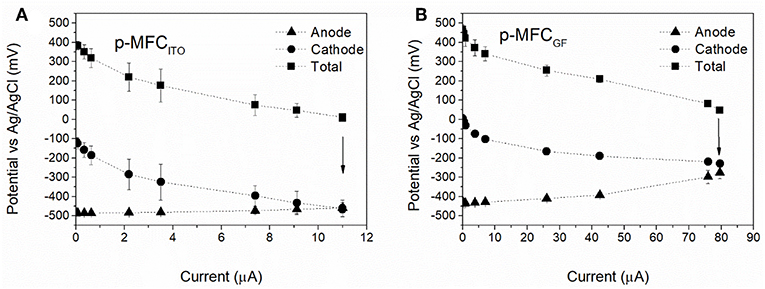
Figure 2. Electrochemical characterization of the p-MFCs by polarization studies performed after 30 days of operation. (A) p-MFCITO, (B) p-MFCGF. The fuel cells were left in OCV for 2 h before the polarization studies. These were carried out after 5 h from the beginning of the light cycle, when the current reaches a steady value. Arrows indicate the potential and current value under the external resistance of 510 Ω.
In p-MFCGF both the anode and the cathode contribute to the overpotential (Figure 2B), which may be a consequence of the fact that the two electrodes are made of the same material and have the same projected area. Future studies should therefore assess the impact of a relatively larger anode area on the performance of this system.
The analysis by cyclic voltammetry of the GF cathode (Figure S9) reveals a mass transport limited process with an onset potential for oxygen reduction at −0.21 V vs. Ag/AgCl and a maximum peak of current at around −0.5 V vs. Ag/AgCl, in agreement with previous studies (Darus et al., 2015; Rimboud et al., 2015). Such a negative potential is due to the high pH of the catholyte (Zhang et al., 2017). The onset potential on the ITO electrode is around 0.3 V vs. Ag/AgCl, suggesting a lower overpotential for the ORR at the ITO, or an alternative electron reduction pathway. The maximum current achieved is lower than for GF under similar DO concentration (around 10 mg L−1) and the diffusion limitations was not as obvious in the CV of the ITO electrode which also suggests that the reduction reaction at the ITO cathode could be due to other mechanisms rather than the ORR.
The external load of 510 Ω used in this work, leads to higher current baselines (point indicated with the arrow in Figure 2), which would benefit both sensitivity and range of detection of the p-MFCs used as sensor (Stein et al., 2012), while maximizing the rate of oxygen consumption. Low resistances increase the rate of the ORR, which could alter the oxygen concentration on the surface of the electrode (Zhang and Angelidaki, 2012). Due to the high concentration of DO in our system we assume that the diffusion gradient is sufficient to maintain a homogeneous profile of DO from the electrode to the bulk. The current output obtained at 510 Ω corresponds to the maximum current output for p-MFCITO and p-MFCGF as determined by the polarization test (~11 and 80 μA).
p-MFCs Performance During the Light Cycle, Influence of the DO on Current Output
Several studies have correlated the power generated by photosynthetic MFCs with the DO in the catholyte (Table S1), however sensitivity values usually are not reported. The energy performance of our system appears to be low. The lack of catalyst at the cathode electrode, oxygen crossover to the anode, due to high values of DO reached in the catholyte, low conductivity of the electrolytes, and high cathodic pH are the most likely reasons for the higher internal resistance and hence, poorer performance of our system. On the other hand, for sensing purposes, stability, and robustness of the electrodes used are more important than power output. Therefore, the use of a catalyst that may leach or deactivate over time is not advised. Likewise, if from one hand the high pH and relative low conductivity typical of algal systems are detrimental for power production, these operational conditions are important to assess the suitability of the biosensor performance in real scenarios.
To assess the performance of the p-MFCs as DO sensor, the DO was monitored hourly over a 12 h light cycle and its value was correlated to the current generated.
As shown in Figure 3, during the light cycle, the current output increases until a steady state value and then rapidly decreases once the light is off. In the case of p-MFCGF, this trend is followed by the DO. The current output generated during the 12 h of light correlates well with the catholyte DO (R2 = 0.96, Figure S10), with a sensitivity of 3.66 ± 0.35 μA L within the DO range 15–25 mg L−1 (Figure 3B).
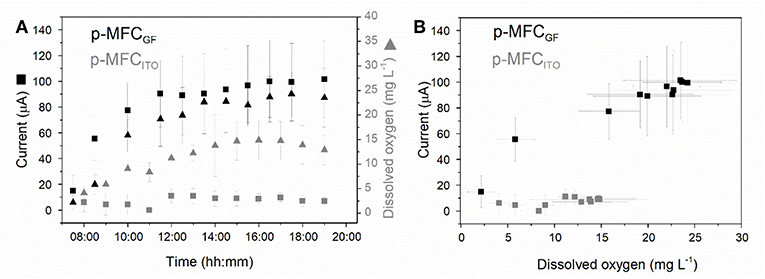
Figure 3. Investigating the relationship between dissolved oxygen in the catholyte and current generated by the p-MFCs under light. (A) Dissolved oxygen (triangles) and current (squares) evolution with time over the 12 h of light for p-MFCGF (black) and p-MFCITO (gray) (B) Correlation between the catholyte DO and the current, derived from (A). Data is the average of six replicates.
In the case of p-MFCITO, there is no apparent correlation between current generated and DO (Figure 3B). This result could be either caused by the ITO saturation at lower concentrations of DO, due to the lower electrode area, or by the presence of other reduction mechanisms at the cathode via direct or mediated electron transfer from the biofilm (Wang et al., 2010), involving CO2 reduction (Cao et al., 2009). The latter would occur when oxygen availability is limited at the electrode surface, as may be the case for the ITO electrode. The dense electrode coverage by the cathodic biofilm, observed from the SEM images, may in fact limit the access of bulk reactants to the electrode surface (Figure S8).
Response of the p-MFCs to Atrazine
Atrazine, an herbicide commonly used to control grassy leaves and broadleaf weeds in crops, was tested as the model toxicant in this study. Concentrations of atrazine and its metabolites in groundwater and surface water rarely exceed 2 μg L−1 and are commonly below 0.1 μg L−1, although concentrations may be higher in agricultural areas where large amounts of pesticides are used (WHO, 2010). In Europe, the Water Framework Directive (WFD) limits the level of atrazine to 0.1 μg L−1 in environmental waters.
Since its mode of action toward freshwater algae is well-understood, atrazine is frequently used as a model pollutant for the development of algal biosensors (Shitanda et al., 2005). It binds specifically the Qb site of the PSII within the photosynthetic electron transport chain of algae. The result is an inhibition of the light-induced oxygen produced by the algal cells (Jeuken, 2016). In the p-MFCs, the presence of atrazine in the catholyte would produce a change in the current output caused by a drop in the photosynthetic oxygen (Shitanda et al., 2005). Several studies report the inhibition of pesticides, including atrazine, on the oxygen production by Sc. obliquus (Mofeed and Mosleh, 2013; Chalifour et al., 2016; Zhu et al., 2016).
Initially, the p-MFCs were exposed to a concentration of 0.1 μg L−1 to assess the suitability of the sensor to detect the threshold legal limit. Since point of source and groundwater concentrations are likely to be higher (Manamsa et al., 2016), concentrations up to 10 mg L−1 were also tested. The performance of the p-MFCs as sensor for atrazine detection was assessed in terms of rate of reduction, reproducibility, inhibition ratio, response time, and recovery of the baseline signal over time.
Cyclic voltammetry tests at the anode before and after atrazine injection confirmed that the electrode performance was unaffected by the toxic event, and, therefore, that the response was caused by changes at the cathode only (Figure S11).
When the sensors were exposed to a concentration of 0.1 μg L−1 of atrazine (Figure 4), an IRshort−term of 25.5% (p-MFCGF, Figure S12A) and 23.2% (p-MFCITO, Figure 4B), with a response time of 2.6 h (p-MFCGF) and 3.6 h (p-MFCITO) was observed. The rate of reduction, SR, of p-MFCGF to atrazine was superior to p-MFCITO: 66.2 vs. 0.6 μA h−1 (Figure S12). The larger current drop obtained with p-MFCGF is also associated to a larger drop in the DO of the catholyte. In this case, in fact, the DO dropped from 17.5 to 7.7 mg L−1 when exposed to 0.1 μg L−1 of atrazine, while in p-MFCITO it only dropped from 15.1 to 13 mg L−1. p-MFCGF, however, gave a much poorer reproducibility than p-MFCITO, as demonstrated by the larger error bars obtained (Figure S12B), which is probably due to trapped oxygen within the GF porous structure. Interestingly, when p-MFCGF was exposed to 8 μg L−1 (Figure 5), the photosynthetic pattern was lost on the next cycle showing the potential of the pMFC as shock sensor.
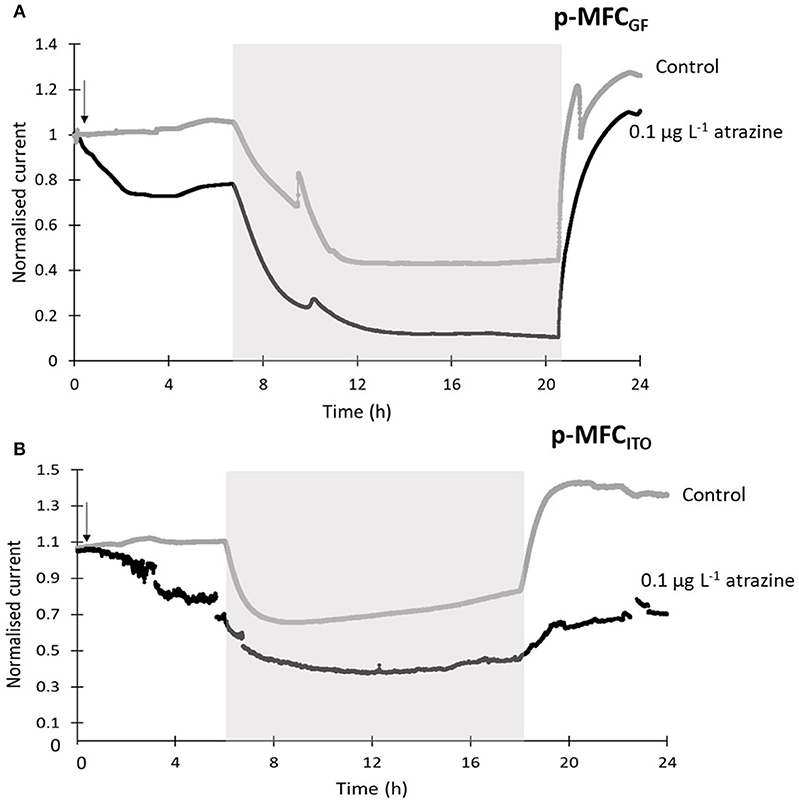
Figure 4. Sensors response to 0.1 μg L−1 of atrazine for p-MFCGF (A) and p-MFCITO (B) during the first 24 h after intoxication. The current output was normalized by the baseline current before the injection, Ib. Black lines correspond to the fuel cells exposed to atrazine and gray lines correspond to the control p-MFCs. The arrow indicates the point of atrazine injection. Error bars (referring to two replicates) are presented in Figure S12. Shadowed areas indicate the operation during the dark cycle.
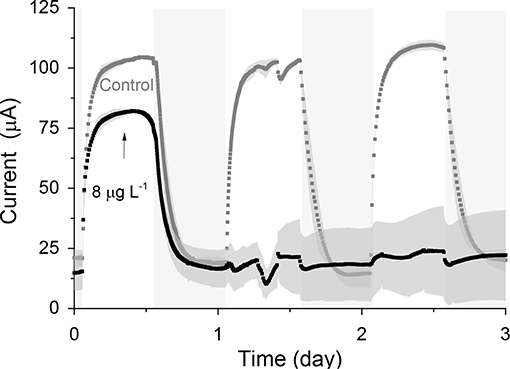
Figure 5. Response of p-MFCGF to 8 μg L−1 of atrazine. The arrow indicates the point of atrazine injection. Shadowed areas indicate the operation during the dark cycle. Data is the average of two replicates. Error bars represent the absolute error between the two replicates.
Both p-MFC devices showed a response to atrazine concentrations in the mg L−1 range. When the systems were exposed to 0.5 mg L−1 an immediate drop in the signal was observed (Figures 6, 7). p-MFCGF showed a higher SR rate (23.54 μA h−1) compared to p-MFCITO (0.715 μA h−1), with IRshort−term of 53% (Figure 6A) and 27.3% (Figure 7A). Subsequent additions of atrazine in the cathode chamber caused further decreases in the current output, however, the IRshort−term did not correlate with the concentration. Moreover, the extent of the current decay depended on the history of the sensor. For example, when p-MFCITO was firstly exposed to 10 mg L−1 (Figure 7B) an IRshort−term of 52% was observed. Nonetheless, an IRshort−term of only 8% to the same concentration was recorded with device previously exposed to the pollutant (Figure 7A), thus suggesting that the biofilm may develop resistance to the toxicant (Patil et al., 2010). The acclimation of the biofilm to the toxic event means that a dose-response curve could not be representative of the performance of this type of sensor. The current drop was however correlated with a concomitant drop in the DO of the catholyte thus, the low reproducibility of the sensor is due to an uneven response of the algae to the toxicant. The anodic potential influences the sensitivity of the p-MFC sensor to the DO in the catholyte. The lower the anodic potential, the higher the current generated by the p-MFC and the higher the level of DO that saturates the sensor amperometric response.
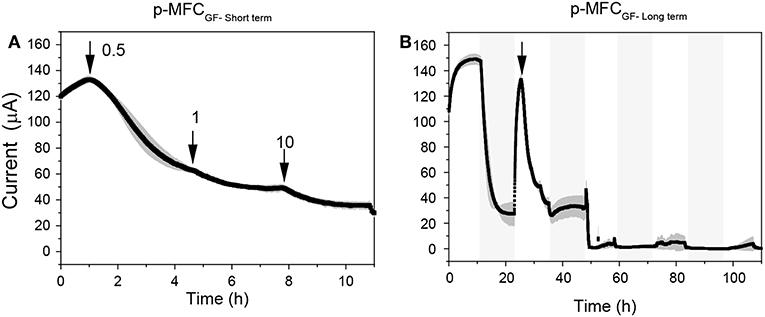
Figure 6. Response of p-MFCGF to atrazine injection in the mg L−1 range. (A) Short term response. (B) Long term response. The arrows indicate the point of atrazine injection. Shadowed areas indicate the operation during the dark cycle.
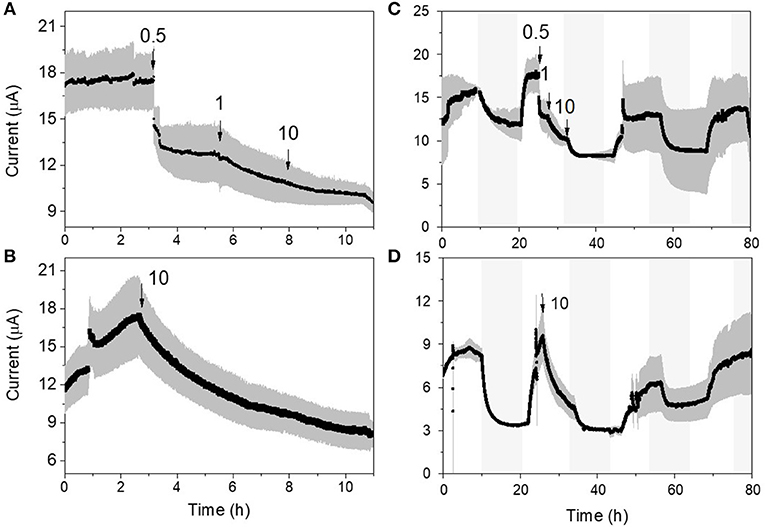
Figure 7. Response of the p-MFCITO sensor to atrazine. (A) and (C) response to subsequent injections of atrazine for concentrations ranging between 0.5 and 10 mg L−1. (B) and (D) response to a single atrazine injection of 10 mg L−1. (A,B) show the short-term response (i.e., up to 10 h), while (C,D) the response up to 80 h. Shadowed areas indicate the operation during the dark cycle.
The response time of the p-MFCs to atrazine was in the range of hours, instead of minutes as reported for other algae biosensors (Shitanda et al., 2005; Tahirbegi et al., 2016). Mass transfer limitations, especially within the porous structure of the GF cathode, and low electrode surface-area-to-volume-ratio, may be a reason for this (Rimboud et al., 2017).
Recovery of the Sensors After the Toxic Event
After exposure to 0.1 μg L−1 of atrazine, the baseline current generated by p-MFCGF recovered during the next dark/light cycle (Figure 4A). In the case of p-MFCITO, this recovery did not occur and a 36% decay in the current baseline was observed (Figure 4B). This result suggests that the p-MFC can be used as an early warning system to detect the limit concentration imposed by law. When p-MFCGF was exposed to higher concentrations of atrazine, however, the baseline current signal did not recover (Figure 6B), while p-MFCITO (Figures 7C,D) recovered the baseline current in the next cycles without changing the electrolyte. The denser biofilm developed onto the ITO electrode (Figure S8) may protect it from the atrazine action. On the other hand, the uneven biofilm distribution on the GF electrode would facilitate atrazine access also to the cells closer to the electrode surface. In addition, atrazine could be adsorbed on the GF structure and released also after the completion of the simulated toxic event.
The SEM images (Figures S8C,D) suggest that the cathodes exposed to atrazine may be contaminated by fungi (Lopez-Llorca and Hernandez, 1996; Lopez-Llorca et al., 1999). The toxic effect of atrazine toward photosynthetic species would allow pathogens and opportunistic species to thrive and change the consortia within the biofilm. Not only is this detrimental for the health of the bioreceptor, but also for the stability of the baseline over time.
Maintaining sterile conditions at the cathode, would probably minimize baseline fluctuations over time and lead to a more stable sensor. Nevertheless, this approach is incompatible with practical applications, where the cathodic probe would be exposed to the water samples to be analyzed. Future studies should include in-depth analyses of the microbial and algal communities at the cathode to try and relate the sensor performance over time with the cathodic biofilm evolution.
Conclusions
Algae are the ideal bioreceptors for the development of herbicides biosensors, given their high sensitivity to these compounds. Yet, their practical use is still limited by the development of reliable and portable systems for effective in situ operations. In this work, we investigated for the first time the use of photosynthetic microbial fuel cells, with algae-assisted cathodes, for the detection of atrazine in water systems. Two cathode materials were tested, graphite felt and ITO to investigate the effect of the electrode properties on performance, and long-term exposure studies with this technology were reported. When both devices were exposed to the limiting concentration imposed by the Water Framework Directive of 0.1 μg L−1, a detectable change in the photosynthetic pattern was obtained. In the case of p-MFCGF, higher concentration of atrazine, however, highly affected the current generation light/dark cycle permanently, while p-MFCITO recovered the day/night cycle after the toxic events, for all concentrations tested.
The electrode porosity allows the built-up of a 3D cathodic biofilm, but the accumulation of oxygen within the fibers slows down the response time and affects the reproducibility of the sensor. On the other hand, the high cell density biofilm generated by the ITO surface prevents oxygen access to the electrode, which leads to a low sensitivity to DO changes in water.
Based on our results, both p-MFCs could be used for point of source detection of a toxic event or as early warning system to avoid contamination in algal raceway ponds fed with wastewater.
Further studies are required to investigate the effect of environmental factors (i.e., temperature, pH, light intensity, flow rate) and particularly the cathode potential on the sensitivity, detection limit, and range of application of the p-MFC system as DO sensor for environmental monitoring. The sensor performance in the co-presence of several other pesticides along with atrazine should be tested in future studies.
Data Availability Statement
The datasets generated for this study are available on request to the corresponding author.
Author Contributions
LG performed the experiments and wrote the manuscript. MD and PC provided guidance and supervision on the experiment design and results interpretations, and wrote the article.
Conflict of Interest
The authors declare that the research was conducted in the absence of any commercial or financial relationships that could be construed as a potential conflict of interest.
Acknowledgments
The authors thanks the Water Informatics, Science and Engineering (WISE) Center for Doctoral Training (CDT), funded by the UK Engineering and Physical Sciences Research Council (EP/L016214/1) to support LG's Ph.D. Scholarship; Aidan Barry from the Department of Biology, University of Bath for supplying the algae strain and assisting with the culture growth.
Supplementary Material
The Supplementary Material for this article can be found online at: https://www.frontiersin.org/articles/10.3389/fenrg.2019.00105/full#supplementary-material
References
Babauta, J., Renslow, R., Lewandowski, Z., and Beyenal, H. (2012). Electrochemically active biofilms: Facts and fiction. A review. Biofouling. 28, 789–812. doi: 10.1080/08927014.2012.710324
Bombelli, P., Zarrouati, M., Thorne, R. J., Schneider, K., Rowden, S. J., Ali, A., et al. (2012). Surface morphology and surface energy of anode materials influence power outputs in a multi-channel mediatorless bio-photovoltaic (BPV) system. Phys. Chem. Chem. Phys. 14, 12221–12229. doi: 10.1039/c2cp42526b
Brayner, R., Couté, A., Livage, J., Perrette, C., and Sicard, C. (2011). Micro-algal biosensors. Anal. Bioanal. Chem. 401, 581–579. doi: 10.1007/s00216-011-5107-z
Cao, X., Huang, X., Boon, N., Liang, P., Fan, M., Zhang, L., et al. (2009). A completely anoxic microbial fuel cell using a photo-biocathode for cathodic carbon dioxide reduction. Energy Environ. Sci. 2, 1754–5692. doi: 10.1039/b901069f
Chalifour, A., LeBlanc, A., Sleno, L., and Juneau, P. (2016). Sensitivity of Scenedesmus obliquus and Microcystis aeruginosa to atrazine: effects of acclimation and mixed cultures, and their removal ability. Ecotoxicology 25, 1822–1831. doi: 10.1007/s10646-016-1728-5
Chouler, J., Bentley, I., Vaz, F., O'Fee, A., Cameron, P. J., and Di Lorenzo, M. (2017). Exploring the use of cost-effective membrane materials for Microbial Fuel Cell based sensors. Electrochim. Acta. 231, 319–326. doi: 10.1016/j.electacta.2017.01.195
Chouler, J., Monti, M. D., Morgan, W. J., Cameron, P. J., and Di Lorenzo, M. (2019). A photosynthetic toxicity biosensor for water. Electrochim. Acta 309, 392–401. doi: 10.1016/j.electacta.2019.04.061
Colombo, A., Marzorati, S., Lucchini, G., Cristiani, P., Pant, D., and Schievano, A. (2017). Assisting cultivation of photosynthetic microorganisms by microbial fuel cells to enhance nutrients recovery from wastewater. Bioresour. Technol. 237, 240–248. doi: 10.1016/j.biortech.2017.03.038
Commault, S., Lear, G., Novis, P., and Weld, R. J. (2014). Photosynthetic biocathode enhances the power output of a sediment-type microbial fuel cell. N. Zeal. J. Bot. 52, 48–59. doi: 10.1080/0028825X.2013.870217
Darus, L., Lu, Y., Ledezma, P., Keller, J., and Freguia, S. (2015). Fully reversible current driven by a dual marine photosynthetic microbial community. Bioresour. Technol. 195, 248–253. doi: 10.1016/j.biortech.2015.06.055
Feng, Y., Kayode, O., and Harper, W. F. (2013). Using microbial fuel cell output metrics and nonlinear modeling techniques for smart biosensing. Sci. Total Environ. 449, 223–228. doi: 10.1016/j.scitotenv.2013.01.004
Ge, X., Sumboja, A., Wuu, D., An, T., Li, B., Goh, F. W. T., et al. (2015). Oxygen reduction in alkaline media: from mechanisms to recent advances of catalysts. ACS Catal. 5, 4643–4667. doi: 10.1021/acscatal.5b00524
He, Z., Huang, Y., Manohar, A. K., and Mansfeld, F. (2008). Effect of electrolyte pH on the rate of the anodic and cathodic reactions in an air-cathode microbial fuel cell. Bioelectrochemistry. 74, 78–82. doi: 10.1016/j.bioelechem.2008.07.007
Hou, Q., Pei, H., Hu, W., Jiang, L., and Yu, Z. (2016). Mutual facilitations of food waste treatment, microbial fuel cell bioelectricity generation and Chlorella vulgaris lipid production. Bioresour. Technol. 203, 50–55. doi: 10.1016/j.biortech.2015.12.049
Jeuken, L. J. C.(ed.). (2016). Biophotoelectrochemistry: From Bioelectrochemistry to Biophotovoltaics, Vol. 158. Leeds, UK: Springer Nature. doi: 10.1007/978-3-319-50667-8
Jiang, Y., Liang, P., Liu, P., Wang, D., Miao, B., and Huang, X. (2017). Biosensors and Bioelectronics a novel microbial fuel cell sensor with biocathode sensing element. Biosens. Bioelectron. 94, 344–350. doi: 10.1016/j.bios.2017.02.052
Kakarla, R., and Min, B. (2014). Photoautotrophic microalgae Scenedesmus obliquus attached on a cathode as oxygen producers for microbial fuel cell (MFC) operation. Int. Hydrogen Energy J. 39, 1027–10283. doi: 10.1016/j.ijhydene.2014.04.158
Labro, J., Craig, T., Wood, S. A., and Packer, M. A. (2017). Demonstration of the use of a photosynthetic microbial fuel cell as an environmental biosensor. Int. J. Nanotechnol. 14, 213. doi: 10.1504/IJNT.2017.082467
Lepom, P., Brown, B., Hanke, G., Loos, R., Quevauviller, P., and Wollgast, J. (2009). Needs for reliable analytical methods for monitoring chemical pollutants in surface water under the European Water Framework Directive. J. Chromatogr. A 1216, 302–315. doi: 10.1016/j.chroma.2008.06.017
Li, J., Hu, J., Yang, C., Pu, W., Hou, H., Xu, J. K., et al. (2019). Enhanced detection of toxicity in wastewater using a 2D smooth anode based microbial fuel cell toxicity sensor. RSC Adv. 9, 8700–8706. doi: 10.1039/C8RA10337B
Lobato, J., González Del Campo, A., Fernández, F. J., Cañizares, P., and Rodrigo, M. A. (2013). Lagooning microbial fuel cells: a first approach by coupling electricity-producing microorganisms and algae. Appl. Energy. 110, 220–226. doi: 10.1016/j.apenergy.2013.04.010
Lopez-Llorca, L. V., Carbonell, T., and Salinas, J. (1999). Colonization of plant waste substrate by entomopathogenic and mycoparasitic fungi - A SEM study. Micron 30, 325–333. doi: 10.1016/S0968-4328(99)00031-1
Lopez-Llorca, L. V., and Hernandez, P. (1996). Infection of the green alga Oocystis lacustris chod with the chytrid fungus Diplochytridium deltanum (Masters) Karling. An SEM study. Micron 27, 355–358. doi: 10.1016/S0968-4328(96)00037-6
Manamsa, K., Crane, E., Stuart, M., Talbot, J., Lapworth, D., and Hart, A. (2016). A national-scale assessment of micro-organic contaminants in groundwater of England and Wales. Sci. Total Environ. 568, 712–726. doi: 10.1016/j.scitotenv.2016.03.017
Martinez, S. M., and Di Lorenzo, M. (2019). Electricity generation from untreated fresh digestate with a cost-effective array of floating microbial fuel cells. Chem. Eng. Sci. 198, 108–116. doi: 10.1016/j.ces.2018.12.039
Mofeed, J., and Mosleh, Y. Y. (2013). Toxic responses and antioxidative enzymes activity of Scenedesmus obliquus exposed to fenhexamid and atrazine, alone and in mixture. Ecotoxicol. Environ. Saf. 95, 234–240. doi: 10.1016/j.ecoenv.2013.05.023
Mowjood, M. I. M., and Kasubuchi, T. (1998). Dynamics of dissolved oxygen (DO) in ponded water of a paddy field. Soil Sci. Plant Nutr. 44, 405–413. doi: 10.1080/00380768.1998.10414462
Patil, S., Harnisch, F., and Schröder, U. (2010). Toxicity response of electroactive microbial biofilms-a decisive feature for potential biosensor and power source applications. ChemPhysChem. 11, 2834–2837. doi: 10.1002/cphc.201000218
Rago, L., Cristiani, P., Villa, F., Zecchin, S., Colombo, A., Cavalca, L., et al. (2017). Influences of dissolved oxygen concentration on biocathodic microbial communities in microbial fuel cells. Bioelectrochemistry. 116, 39–51. doi: 10.1016/j.bioelechem.2017.04.001
Rimboud, M., Barakat, M., Bergel, A., and Erable, B. (2017). Different methods used to form oxygen reducing biocathodes lead to different biomass quantities, bacterial communities, and electrochemical kinetics. Bioelectrochemistry 116, 24–32. doi: 10.1016/j.bioelechem.2017.03.001
Rimboud, M., Desmond-Le Quemener, E., Erable, B., Bouchez, T., and Bergel, A. (2015). The current provided by oxygen-reducing microbial cathodes is related to the composition of their bacterial community. Bioelectrochemistry. 102, 42–49. doi: 10.1016/j.bioelechem.2014.11.006
Schneider, K., Thorne, R. J., and Cameron, P. J. (2016). An investigation of anode and cathode materials in photomicrobial fuel cells an investigation of anode and cathode materials in photomicrobial fuel cells. Philos. Trans. R. Soc. A Math. Phys. Eng. Sci. 374, 1–22. doi: 10.1098/rsta.2015.0080
Shitanda, I., Takada, K., Sakai, Y., and Tatsuma, T. (2005). Compact amperometric algal biosensors for the evaluation of water toxicity. Anal. Chim. Acta. 530, 191–197. doi: 10.1016/j.aca.2004.09.073
Singh, S., Kumar, V., Chauhan, A., Datta, S., Wani, A. B., Singh, N., et al. (2018). Toxicity, degradation and analysis of the herbicide atrazine. Environ. Chem. Lett. 16, 211–237. doi: 10.1007/s10311-017-0665-8
Stein, N. E., Hamelers, H. V. M., and Buisman, C. N. J. (2012). Influence of membrane type, current and potential on the response to chemical toxicants of a microbial fuel cell based biosensor. Sensors Actuators B Chem. 163, 1–7. doi: 10.1016/j.snb.2011.10.060
Tahirbegi, I. B., Ehgartner, J., Sulzer, P., Zieger, S., Kasjanow, A., Paradiso, M., et al. (2016). Fast pesticide detection inside microfluidic device with integrated optical pH, oxygen sensors and algal fluorescence. Biosens. Bioelectron. 88, 188–195. doi: 10.1016/j.bios.2016.08.014
Tucci, M., Grattieri, M., Schievano, A., Cristiani, P., and Minteer, S. D. (2019). Microbial amperometric biosensor for online herbicide detection: Photocurrent inhibition of Anabaena variabilis. Electrochim. Acta. 302, 102–108. doi: 10.1016/j.electacta.2019.02.007
Verstraete, W., and Rabaey, K. (2006). Critical Review Microbial Fuel Cells: Methodology and Technology. Environ Sci Technol. 40, 5181–5192. doi: 10.1021/es0605016
Wang, X., Feng, Y., Liu, J., Lee, H., Li, C., Li, N., et al. (2010). Sequestration of CO2 discharged from anode by algal cathode in microbial carbon capture cells (MCCs). Biosens. Bioelectron. 25, 2639–2643. doi: 10.1016/j.bios.2010.04.036
WHO (2010). Atrazine and Its Metabolites in Drinking-water; Background Document For Development of WHO Guidelines For Drinking-Water Quality. WHO/HSE/WSH/10.01/11.
Zhang, H., Lin, C., Sepunaru, L., Batchelor-McAuley, C., and Compton, R. G. (2017). Oxygen reduction in alkaline solution at glassy carbon surfaces and the role of adsorbed intermediates. J. Electroanal. Chem. 799, 53–60. doi: 10.1016/j.jelechem.2017.05.037
Zhang, Y., and Angelidaki, I. (2012). A simple and rapid method for monitoring dissolved oxygen in water with a submersible microbial fuel cell (SBMFC). Biosens. Bioelectron. 38, 189–194. doi: 10.1016/j.bios.2012.05.032
Zhao, F., Zheng, Y., Wang, Z., Yang, Z., Xiao, Y., and Wu, Y. (2013). Light intensity affects the performance of photo microbial fuel cells with Desmodesmus sp. A8 as cathodic microorganism. Appl. Energy. 116, 86–90. doi: 10.1016/j.apenergy.2013.11.066
Keywords: photosynthetic microbial fuel cell, biosensor, water quality, algae, atrazine, ITO, graphite felt
Citation: Gonzalez Olias L, Cameron PJ and Di Lorenzo M (2019) Effect of Electrode Properties on the Performance of a Photosynthetic Microbial Fuel Cell for Atrazine Detection. Front. Energy Res. 7:105. doi: 10.3389/fenrg.2019.00105
Received: 06 July 2019; Accepted: 19 September 2019;
Published: 09 October 2019.
Edited by:
Uwe Schröder, Technische Universitat Braunschweig, GermanyReviewed by:
Sunil A. Patil, Indian Institute of Science Education and Research Mohali, IndiaMohanakrishna Gunda, Qatar University, Qatar
Copyright © 2019 Gonzalez Olias, Cameron and Di Lorenzo. This is an open-access article distributed under the terms of the Creative Commons Attribution License (CC BY). The use, distribution or reproduction in other forums is permitted, provided the original author(s) and the copyright owner(s) are credited and that the original publication in this journal is cited, in accordance with accepted academic practice. No use, distribution or reproduction is permitted which does not comply with these terms.
*Correspondence: Mirella Di Lorenzo, bS5kaS5sb3JlbnpvQGJhdGguYWMudWs=