 Agnetha Flore
 Marie Clausen
 Mathias Uslar
- Department Energy, OFFIS – Institute for Information Technology, Oldenburg, Germany
This contribution will deal with the topic of migration paths in the Smart Grid domain. Migration paths—defined as development steps from one development stage to the next—will be investigated to support network operators in planning the processes and technologies necessary to meet the future requirements of the energy system transformation. For this purpose, a process model was developed which is presented and applied on the basis of a case study. The dependencies and influences between the dimensions considered are investigated and an algorithm is developed and used for their qualitative evaluation. By analyzing and evaluating the migration paths, particularly critical development steps on the entire roadmap that require special control can be shown to the distribution grid.
Introduction
The issue of energy system transformation and achieving climate targets is currently of crucial importance for politics and society. By energy system transformation, we mean the transition from the non-sustainable use of fossil fuels and nuclear energy to a sustainable energy supply using renewable energies. In order to be a successful energy supplier in the future, it is important to move from a previously centrally controlled network infrastructure to a decentralized, dominated structure. Only a decentralized grid infrastructure can guarantee an ever stronger feed-in of renewable energies into the grid (Appelrath et al., 2010, 2012).
This decentralization of the grid infrastructure can be achieved by increased measurement, control and automation of the electricity flow as well as regional high-resolution monitoring and control of the electricity grid. To this end, the electricity grid is to be modernized and made more intelligent through new information and communication technologies.
More and more research and development projects (R & D projects) are focusing on the smart grid of the future, innovative technologies, the expansion of storage facilities, etc. The aim of these R & D projects is to develop new technologies for the generation of electricity from renewable sources. This shows that the topic is of great interest for practice and science.
In our contribution, a procedure model for the development of migration paths is used to show energy suppliers a roadmap to a modern and intelligent energy network. The procedure model will be evaluated in a case study in chapter 4 according to Yin (2002). After presenting the process model in Chapter 2, however, in this article (Chapter 3) we will concentrate only on one phase of the process model. It is a matter of examining the dependencies and influences of the dimensions to be considered in the energy domain and evaluating them. The aim of the evaluation is to find out which development steps are to be classified as particularly critical.
Thereby we strive to answer the following two research questions (RQ):
• What are the dependencies and influences between the different dimensions of an energy operator to be considered (RQ1)?
• How can these dependencies and influences be evaluated qualitatively and quantitatively (RQ2)?
Our contribution is structured as follows: Chapter 2 presents the procedure model for the development of migration paths. Chapter 3 explains the methodology for the qualitative evaluation of influences of the different dimensions considered. Chapter 4 uses a case study to illustrate the relationships and influences as well as their evaluation and visualization. It is worked out which findings the qualitative evaluation provides. This article concludes with a presentation of the results for those two main questions and future research work in Chapter 5 (Mehmann et al., 2015).
Migration Paths for Smart Grids
Definition
The concept of a migration path describes a (defined) path from one development step to the next. For the consideration of migration paths, the necessary development steps of the different dimensions and their interdependencies are described in order to move from one maturity level to another (Appelrath et al., 2012).
Related Work
The foundation for the development of migration paths was a literature review on the topic and the study of related work.
From the point of view of sustainability, it is important to also focus on this in the development of migration paths. In our opinion, this includes three aspects: the dependencies on the dimensions to be considered, the Technology Readiness Level (TRL) as well as costs and benefits of development steps (Flore and Marx Gómez, 2019).
For the topic of migration paths and dependencies of individual dimensions, we have studied literature such as the acatech study (2012) (Appelrath et al., 2011, 2012; Appelrath, 2012) and others (Pfeffer and Sutton, 1999; Appelrath et al., 2010; Luhmann, 2012), and (Winter and Aier).
Since it is important in the sense of sustainability for individual development steps of the migration paths only to use technologies that are promising, i.e., have a certain stage of development, the topic of the TRL was added (Mankins, 1995, 2002, 2009; Graerringer et al., 2002; Tugurlan et al., 2011; Kirkham and Marinovici, 2013; Horizon, 2014; Campbell, 2018).
We also came across “maturity models” via the term “maturity,” for which we also conducted a literature search (both generally valid and domain-specific) (Biberoglu and Haddad, 2002; Fraser et al., 2002; Ahlemann et al., 2005; De Bruin et al., 2005; Becker et al., 2008, 2009, 2010a,b; BPM Maturity Model EDEN e.V., 2009; Hogrebe and Nüttgens, 2009; Mater and Drummond, 2009; Mettler and Rohner, 2009; Gresse von Wangenheim et al., 2010; Mettler et al., 2010; Widergren et al., 2010; Grid-Interop, 2011; Lahrmann et al., 2011; Mettler, 2011; Poeppelbuss et al., 2011; Rohjans et al., 2011; Software Engineering Institute, 2011; Steenbergen, 2011; Sun et al., 2011; The GridWise Architecture Council, 2011; García-Mireles et al., 2012; Marx et al., 2012; Software Engineering Institute the GridWise Architecture Council, 2012; Antunes et al., 2014; Hankel et al., 2014; Stevens, 2014; U.S. Department of Energy, 2014; Khan, 2015; Uebernickel et al., 2015; Uslar and Masurkewitz, 2015; Wittstock et al., 2016).
The issue of costs and benefits of migration paths is indispensable for the aspect of sustainability, but is not the focal topic of this contribution. Conducting the literature research, it has become apparent that there is only little literature on the subject of technical migration paths. The literature on the maturity model is very diverse, but not in the domain-specific Smart Grid area and especially not for the European unbundled electricity market.
Pfeffer and Sutton (1999) argues that there is a big knowing-doing gap. There are many assessment models for maturity that only reveal gaps and problems in the organization, but mostly do not describe how they can be closed (Pfeffer and Sutton, 1999). This is also confirmed by Mettler in his studies on “Maturity Assessment Models” (Mettler, 2011).
This indicates a research gap to which this article should contribute.
Approach to the Development of Utility Migration Paths
In order to develop migration paths, various process steps must be reached. This is illustrated exemplarily in the methodological approach for the development of migration paths in Figure 1. This approach is based on the findings and approach of the German Acatech study “Future Energy Grid” (Appelrath et al., 2012).
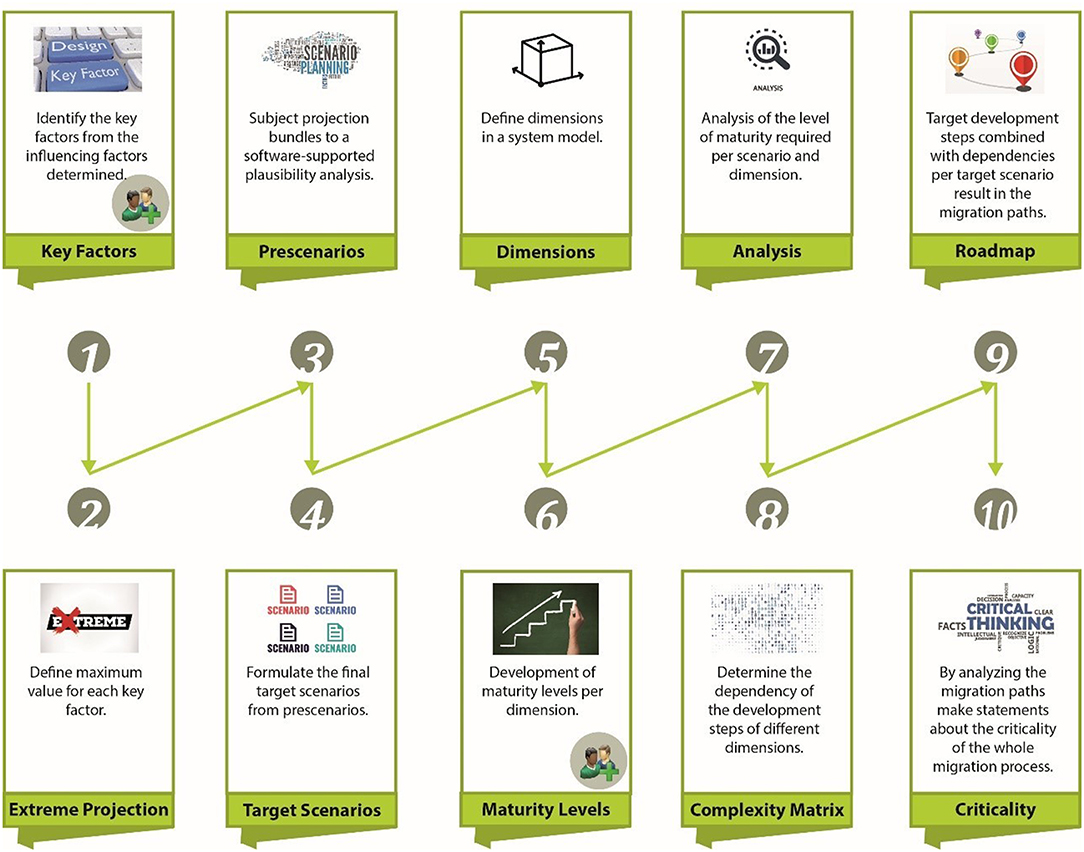
Figure 1. Methodological approach for the development of Migration Paths (source: own illustration).
In total, the approach includes 10 steps. The first four steps relate to scenario building, steps five and six to the design of the dimensions to be considered (dimensions are understood here as specific capabilities, process areas and other design objects that structure an area of interest). Steps seven to 10 deal with the analysis of dimensions and develop the actual migration paths.
The methodological approach envisages working together with experts to identify influencing factors that will have a particular influence on the development of a domain in the coming years. After prioritization, key factors are derived from this set of influencing factors which have a particularly large influence on the development of the Smart Grid domain and are recorded in a key factor catalog (Gausemeier et al., 1996; Appelrath et al., 2012). The key factor catalog is a compilation of all key factors for the domain to be considered and the period to be considered.
Utilizing literature research, the maximum values for the key factors are worked out in cooperation with experts. The extreme value describes the maximum value of a key factor in the target year of the analysis period (Gausemeier et al., 1996; Appelrath et al., 2012).
Projection bundles are formed from the individual projections of the key factors, which are condensed into pre-scenarios in a plausibility analysis. This is done because not all projections comply with each other. Software-supported plausibility analyses, which compress the analysis into raw scenarios (Mayer et al., 2012), can be a possible solution here.
The final target scenarios are derived from the pre-scenarios. In general, a scenario describes consistent and conclusive images of possible futures for companies. They are based on hypothetical sequences of events.
For further consideration, dimensions are determined that are to be considered specifically in the further course and to give the whole a structure. The dimensions that are important for consideration can be determined on the basis of literature research. However, if, for example, there is a maturity model for which these migration paths are to be created, the dimensions of the maturity model should be selected (Software Engineering Institute, 2011; Uslar et al., 2012; Stevens, 2014; U.S. Department of Energy, 2014).
According to Marx et al. (2012), dimensions include specific skills, process areas and other design objects to structure an area of interest. Dimensions should be complete and well-distinguishable. According to De Bruin et al. (2005), they are specified either by means of evaluation elements/measurement criteria (practices, objects, or activities) or qualitative descriptions.
For the next step, up to five maturity levels are worked out for all dimensions in cooperation with experts again (as in Step 1). Maturity levels are development steps (“maturity levels”). The same applies to the maturity levels: if you have a maturity level model for which the migration paths are created, the maturity levels of the maturity level model are adopted. If not, they can be determined on the basis of a literature search (Software Engineering Institute, 2011).
The target scenarios derived in an earlier step require different maturity levels for each dimension. It is therefore necessary to analyze which maturity levels must be available per dimension and per target scenario in order to achieve them (Mayer et al., 2012).
In step seven, for each dimension and development step, it is checked which technological components must be used in order to achieve the next development step. On this basis, the next step is to analyse which dependencies exist between the development steps. For example, what are the prerequisites for the development of the organizational structure, corporate IT, risk management and standardization of communication protocols before certain technologies that can be controlled via radio or the like can be used to protect against cyber-attacks. From these previously analyzed dependencies, sequences of the individual development steps can be defined, which can then be presented in the form of a roadmap over time in step 9 (Appelrath et al., 2012).
It is thus analyzed which preconditions must be fulfilled for the individual development steps of all dimensions. By referring to the development step to be achieved for each target scenario, the development needs required for one dimension becomes clear. The analysis of the mutual dependencies is undertaken with a view to a continuous further development of the “Smart Grid Readiness” of the network operators.
For each dimension assigned to a system level, the dependencies on other dimensions are described using the corresponding sequence of development steps 1–5. For the cross-sectional dimensions, it is shown for which development steps these are assumed as prerequisites. Cross-sectional dimensions comprise technological aspects that come into play at all system levels and whose development thus has an influence on all system levels (Appelrath et al., 2012).
The dependencies as well as the influences are examined and evaluated quantitatively and the influences qualitatively. For the qualitative evaluation of the influence the formula is presented in chapter 3 of this contribution.
In a next step, the target development steps necessary for a scenario are combined with the complexity matrix, resulting in migration paths for each scenario in the form of a roadmap (Mayer et al., 2012).
Finally, these migration paths are analyzed to determine whether there are particularly critical developments of individual dimensions that have an influence on the overall migration process (Mayer et al., 2012). Therefore, critical paths per dimensions are worked out.
In principle, it must be said that any delay naturally has an influence on other co-dependent development steps. In the following, however, only those development steps are to be emphasized that can only be further developed later due to dependencies i.e., that have forced breaks.
Qualitative Evaluation on Influences of Development Steps
To help decision makers in organizations, not only the migrations paths of the dimensions shall be illustrated, but also the importance of their influence. This is achieved through the evaluation. For the qualitative evaluation, numeric values shall be given by a method in order to compare the results of different development steps. We first need to define some general assumptions to apply the evaluation method.
General Assumptions on Qualitative Evaluations
To define a qualitative evaluation method, we first need to clarify some general assumptions. Figure 2 shows an example for a migration path to illustrate our assumptions.
1. Paths to less mature development steps in other dimensions are possible: Each dimension has development steps from 1 to 5. These follow consecutively on each other. Nevertheless, it is possible to reach lower development steps in other dimensions as in the example from 1.3 to 2.2.
2. Only necessary dependencies are regarded: If an element of the migration path is depending on another element that is already included in the path, the included dependency is left unregarded. In our example, the path from 1.3 to 2.4 is not regarded, because that dependency is included in the path from 1.3 via 2.2 and 2.3 to 2.4. Yet, the path from 1.4 to 2.4 will be regarded, because the other predecessor of 2.4 can be reached without developing the step 1.4.
3. There exist no loops: the predecessors of an element are interpreted as absolutely and completely necessary, so if 1.2 would be a successor of 2.2 in the example, there would be a never-ending loop between 1.2, 1.3 and 2.2.
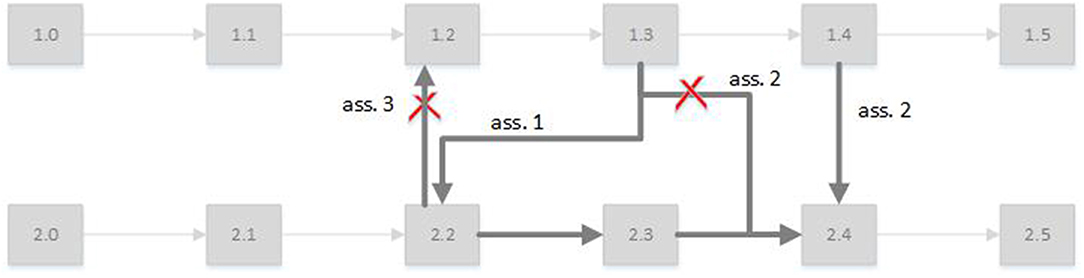
Figure 2. General example of a generic Migration Path (source: own illustration).
Assumptions on Evaluation Effects
Next, we want to clarify the effects of the qualitative evaluation. In general, the evaluation shall evaluate each development step with a development capability and consider thereby the effort needed for the development itself. Furthermore, the capability for other development steps that get enabled shall affect the evaluation, too. This leads to the following three assumptions on the development capability of a step:
1. If two steps have the same contextual conditions despite the effort that is needed for the development, the resulting value shall reflect this and rate the step with less effort better.
2. If two steps have the same contextual conditions despite the number of new steps they enable, the step enabling more successors (assuming equal effort) shall be rated better.
3. If two steps have the same contextual conditions, but one enables more successors directly and the other the same number of successors indirectly in the next development stage, the direct enabling shall be rated better.
This assumptions can be formalized as follows:
1. The effort e(s) represents the effort that is needed to develop a new and shall be inversely proportional to the development capability of s.
2. The development capability of a step shall be influenced by their successors and their development capability.
3. The reduction factor r shall realize a better rating of direct successors and influence the development capability of the indirect steps multiplicatively. Therefore, 0 < r < 1.
Evaluation Formula for Qualitative Evaluation of Development Steps
Regarding the first assumption from the last section, we first determine the development capability c(s) of a development step s with no successors as , where e(s) is the effort needed for the step s. To meet the other assumptions, we define the sets of successors for the step s with i = 1, …, n the order of the successors (i = 1 for direct successors), n the highest order of successors and m the number of successors of the same order. Furthermore, let ri be the reduction factor for successors of order i. Then we meet the second and third assumption from the previous section by adding up the term with j = 1, …, m. So in total, we have
This formula is a recursive function that calculates all development capabilities of all successors until no successor is left. The formula meets the first assumption by dividing through the effort for a development step. Furthermore, the formula bases on the successors and their development capabilities, so the second assumption is met, too. Finally, the reduction factor ensures that directly following successors affect the development capability stronger than indirect successors.
The resulting development capabilities always result in a value higher or equal to 1, whereby higher values indicate more enabling development stages in regard of other development steps. There exists no concrete upper bound to the development capability because it depends on the given migration path.
Note that there is the risk of counting successors multiple times. This can appear in the case of indirect successors if they succeed two or more successors of the development step in question. An example is given in Figure 2, where the development step 2.4 is a successor of 1.4 and 2.3, which themselves are a direct or indirect successor of the step 1.3. In this case, the higher order is considered. So in the example, 2.4 is a successor of 1.4 in third order.
Example
To demonstrate the formula, we will calculate the development capacities of selected steps from Figure 2. For a general application of the formula, we assume that e(s) = 1 for all steps. Furthermore, we calculate with , so reduction factor is for successors of first order, for successors of second order, for successors of third order and so forth. A sensitivity analysis for other e(s) and ri is conducted in Chapter 4.4.
The steps 1.5 and 2.5 have no successors, so their development capability is and c(2.5) = 1. The step 2.4 has one successor, , so , while the step 1.4 has two direct successors and one successor of second order , so .
One interesting example is the step 1.3 that has two different paths to the successor 2.4. In the formula, the higher order is taken, so we have the successors , , and . This leads to the following development capability:
In the given example, the development step 1.3 has the highest development capability and 1.4 still reaches a relatively high value. This represents the fact that the steps 1.3 and 1.4 are connectors from dimension 1 to dimension 2 and 1.3 has more successors than 1.4 in total.
Case Study for Step 8: Complexity Matrix
The migration paths were constructed based on a previously developed maturity model. The following dimensions were present in the maturity model (Flore and Uslar, 2019):
• Dimension 1: Organization in general
• Dimension 2:Strategy, Management, and Regulation
• Dimension 3: Asset Management for decentralized Power Plants
• Dimension 4: Value Chain
• Dimension 5: Plant, Change and Configuration Management
• Dimension 6: Grid Operation
• Dimension 7: Grid Components
• Dimension 8: Grid Control System
• Dimension 9: Grid Control System
• Dimension 10: Technology in general
• Dimension 11: Information and Communication Technology (ICT) connectivity
• Dimension 12: Data Management
• Dimension 13: Forecasting Systems
• Dimension 14: Plant Communication and Control Modules
• Dimension 15: Information Exchange and Communication
• Dimension 16: Business Continuity Management (BCM)
• Dimension 17: Threat and Vulnerability Management
• Dimension 18: Risk Management
First, it was evaluated which dimensions are influenced from which other dimensions.
The Dimensions and Their Dependencies
In the following subchapters we describe the interdependencies between the different dimensions mentioned in order to answer research question RQ1.
The dependencies are represented in the form of simplified networks. This can be seen in Figure 3 as an example for dimension 1; the networks of all other dimensions can be looked up in the Supplementary Material.
Figure 3. Dependencies of dimension 1 “organization in general” (source: own illustration).
Dimension 1: Organization in General
Although dimension 1: Organization in general is a cross-sectional dimension, only a small influence by other dimensions can be determined due to the missing technological conditions of this dimension. These are dimensions 2 (strategy, management, and regulation), 6 (network operation), and 8 (network control system).
The individual development steps of dimension 1 are (Software Engineering Institute, 2011):
1.1: The distribution system operator (DSO) takes the first steps of implementing Smart Grid in a domain. The company has identified key performance indicators to be improved by Smart Grid. There is an initial vision for network modernization. Strategies for Smart Grid implementation may already be under development.
1.2: The DSO implements functions that enable it to achieve and maintain a modernization of the network. Modernization strategies already exist. There are initial pilot projects or proof-of-concept projects.
1.3: Smart Grid implementations already exist company-wide. There is an enterprise-wide network modernization strategy. Performance is measurably improved.
1.4. The implementation of Smart Grid is already being refined in individual domains to further increase the company's performance. Collaboration and the exchange of information within the organization and externally to customers and stakeholders are increasing.
1.5: In individual domains, a company is already treading the highest levels through new paths and advancing the state of the art in practice. The company offers industry-leading innovations and is involved in the development of smart grid standards and best practices. There are novel and collaborative strategies, extensive external exchange of information and alignment of strategies and visions with national, regional and local interests. Before a company takes the first steps toward implementing Smart Grids (1.1: Organization in general), possible automation options for network operation must be evaluated (6.1: Grid Operation). A Smart Grid vision must be developed before the next step of the first pilot projects can begin (1.2: Organization in general). Before the third development step, the company-wide Smart Grid implementations with a company-wide network modernization strategy (1.3: Organization in general), the company must have started with the introduction of functions for network monitoring and control that are linked to the Smart Grid vision (6.2: Grid Operation) as well as switching in the voltage network must be possible (8.2: Grid Control System). Before the fourth step, the refined implementation of Smart Grid in individual domains (1.4), Smart Grid modernization must be an integral part of the business strategy (2.3: Strategy, Management, and Regulation). Before the last development step, in which a company is already at the highest level in individual areas (1.5: Organization in general), both the increased observability and control in network operation must drive innovation within the company (6.5: Grid Operation) and the network system must be largely automated and have achieved a form of self-healing (8.5: Grid Control System).
Dimension 2: Strategy, Management, and Regulation
For the same reasons, this dimension can only be influenced to a limited extent. This includes dimensions 6 (network operation) and 10 (general information on technology).
The individual development steps of dimension 2 are (Software Engineering Institute, 2011):
2.1: The DSO develops and begins implementing a Smart Grid vision. Smart Grid concepts are implemented experimentally and the first pilot projects take place.
2.2: The DSO is working across divisions on the implementation of a Smart Grid vision with a clear budget. To implement the Smart Grid vision, relationships are established with internal and external stakeholders.
2.3: The Smart Grid vision is integrated into management processes across all industries. There is a company-wide commitment and increased cooperation with stakeholders for an integrated network modernization strategy and planning. Company-wide expectations are set for the Smart Grid and these are communicated, controlled, and monitored.
2.4: Smart Grid modernization is an integral part of the business strategy and offers opportunities for improved business models and synergetic external relations. Information exchange and collaboration within the organization and with external stakeholders is increasing. The Smart Grid vision determines the company's direction at the highest level: this includes investments, the design of operations and services, cooperation with key external players, and the evaluation and integration of new technologies. The costs and benefits of investments are measured and managed.
2.5: The ultimate goal of all those involved in the company (including stakeholders) is innovation. Smart grid strategies are used as a basis for the introduction of new services and product offerings. The company provides sufficient financial resources to realize the Smart Grid vision. In addition, the company also invests in the maintenance and further expansion of the Smart Grid. New business models will be realized through the expansion of the Smart Grid.
Before the first development step with the planning of Smart Grid concepts can take place (2.1: Strategy, Management, and Regulation), the first automation possibilities in network operation must be examined (6.1: Grid Operation) and IT systems must be examined that can serve as the technical basis for the development of a robust Smart Grid information infrastructure (10.1: Technology in general).
Dimension 3: Asset Management for Decentralized Power Plants
The dimension of asset management for decentralized power plants is strongly linked to other dimensions and their development steps. These are dimension 2 (strategy, management and regulation), 7 (network components), 8 (network control system), 11 (Information and Communication Technology (ICT) connectivity), 12 (data management), 13 (forecasting systems), 14 (plant communication and control modules), 15 (information exchange and communication), 16 (event and reaction; continuity of operation), 17 (threat and vulnerability management), and 18 (risk management).
The individual development steps of dimension 3 are (Acatech and EIT ICT Labs, 2012):
3.1: Asset management is operated for large decentralized plants (e.g., block heat and power station, electronic vehicle (EV), medium voltage (MV)-decentralized generation plant, MV/low voltage (LV)-wind energy plants, LV-photovoltaic (PV), stationary storage tanks and heat pumps). Operation is efficient.
3.2: In addition to large conventional plants, there is also an asset management system for medium-sized plants. Operation is optimized from a business point of view.
3.3: Additional regional asset management data surveys are used to optimize the deployment plans.
3.4: Bi-directional communication channels between asset management and decentralized plants are established [e.g., via remote technical unit (RTU), actuator box (aBox)].
3.5: High distribution of asset management systems and comprehensive linking to other systems with defined interfaces [e.g., RTU, aBox, measuring box (mBox), PV inverter, PV gateway, MV/LV-controller, MV/LV-sensor].
Before the first development step (3.1: Asset Management for decentralized Power Plants), a Smart Grid concept of the company (2.1: Strategy, Management, and Regulation), a first equipment of devices with ICT (11.1), a data management (12.1), first communication interfaces for plants (14.1: Plant Communication and Control Modules), first planning to the Business Continuity Management (BCM) (16.1), threat and weak point management (17.1: Threat and Vulnerability Management) and risk management (18.1) as well as standardized interfaces in the asset management (7.2: Grid Components) and possible switches in the medium voltage network (8.2: Grid Control System) are required. Before asset management can be further expanded (3.2), smaller systems also require Intelligent Electronic Devices (IED) (14.2: Plant Communication and Control Modules). Regional ICT expansion (11.2) and the use of simple forecasting systems (13.2: Forecasting Systems) are required prior to possible regional data collection (3.3: Asset Management for decentralized Power Plants). Before expanding the bi-directional communication channels in asset management (3.4: Asset Management for decentralized Power Plants), the company must have introduced communication standards (15.4: Information Exchange and Communication) and use various forms of controllers, boxes and sensors, so that there are standardized plug-and-play ICT solutions for all components used (11.4).
Dimension 4: Value Chain
The value chain is only influenced by a few dimensions. These include dimension 2 (strategy, management and regulation), 3 (asset management for distributed generation), 10 (general information on technology), and 14 (plant communication and control modules).
The individual development steps of dimension 4 are (Software Engineering Institute, 2011):
4.1: The DSO determines the supply and distribution requirements for its products and services. Strategic plans address the need for communication/information exchange across the profit centers of the value chain. The company identifies assets and programs required to facilitate load management. The company has identified the energy storage capabilities and capabilities required. The organization has a strategy to develop, enable and manage a diverse resource portfolio. The company's resource portfolio consists of a number of energy sources and includes opportunities to reduce or balance the burden holistically.
4.2: Investments, decisions and systems are implemented to benefit from a network of alternative generation sources managed for downstream load management. The company provides support for energy management systems for its residential customers. The company's value chain has been redefined based on its Smart Grid capabilities. The company has conducted pilot projects to support a diverse resource portfolio. These include distributed generation, demand management, and energy storage. The company works with suppliers and customers to identify new and innovative ways to automate and integrate processes that enable efficiency gains. The company identifies opportunities to introduce new products and services.
4.3: The organization's business systems are aligned and interconnected to drive dynamic management and profitability through network interaction with the value chain. An integrated resource plan is in place and includes new, targeted resources and technologies. Energy management solutions for customers with market and usage information are enabled. Additional resources are available to replace market products to support reliability or other goals. The company is introducing new models for efficient energy trading as new procurement capacity is created through customer-oriented management and distributed generation, new transmission and distribution connectivity and control, and innovative tariff and pricing options. There are energy trading mechanisms that use some of these functions.
4.4: The DSO's business processes support the dynamic capture and use of information that is relevant for distributed generation and the associated load management. The company's energy resources can be planned and traded. Distributed generation and load management can be used to sell additional electricity. The company has implemented portfolio optimization models that include available resources and real-time markets. Optimization models enable rapid response to dynamic market and supply conditions. The company leverages real-time modeling of all generation and load management potential, including the ability to scale distributed generation resources as needed.
4.5: The dynamic management and automation of the utility's value chain enables higher value creation and benefits and provides a leading role in regional and national network management functions. The optimization of power plants is automated across the entire value chain. Resources are adequately disposable and controllable, enabling the company to take advantage of granular market options. The organization's automated control and resource optimization programs consider and support regional and/or national network optimization. The company's control of the supply chain enables increased supply and demand stability and increases the reliability of the service. The utility promotes a broader exchange of information at regional and national levels, enabling rapid management of events and price stability.
Before the first development step of facilitating load management, energy storage options and a strategy for a diverse resource portfolio (4.1: Value Chain), the following steps are needed: the company must have a Smart Grid vision, technologies must be selected for the Smart Grid vision or a process must exist how this is selected and evaluated (10.1: Technology in general) and large plants must already be equipped with communication interfaces (14.1: Plant communication and Control Modules). As a condition for the next step of supporting energy management systems for customers and pilot projects to support a diverse resource portfolio (4.2: Value Chain), first implementations of the Smart Grid vision (2.2: Strategy, Management, and Regulation) and a defined technology strategy to achieve the Smart Grid goals (10.2: Technology in general) are required. As a prerequisite for there can be an integrated resource plan with new, targeted resources and technologies, the Smart Grid vision must already be anchored throughout the company, cooperation with external parties must be intensified (2.3: Strategy, Management, and Regulation), and the technology strategy must be implemented in a targeted manner (10.3: Technology in general). Before the fourth step in the development of business processes, which supports the dynamic capture and use of information (4.4: Value Chain), the Smart Grid vision must be an integral part of the company, with the possibility of improved business models (2.4: Strategy, Management, and Regulation), there must be additional data collection for optimized deployment plans (3.3: Asset Management for decentralized Power Plants), cooperation with external providers must be accelerated in order to develop new and innovative technology solutions (10.4: Technology in general), and all systems in the market must be equipped with intelligent electronic devices (14.4: Plant Communication and Control Modules). For the final development step, e.g., the optimization of energy systems across the entire value chain through automation (4.5: Value Chain), the company's top priority must be innovation (2.5: Strategy, Management, and Regulation), which is to be achieved facilitating advanced technologies (10.5: Technology in general).
Dimension 5: Plant, Change, and Configuration Management
Plant, change and configuration management is dependent only on a few development steps from other dimensions. These include 2 (strategy, management, and regulation) and 10 (technology in general).
The individual development steps of dimension 5 are (U.S. Department of Energy, 2014):
5.1: The DSO has identified, inventoried and adequately managed its assets.
5.2: The DSO can react ad hoc to other circumstances by configuring the assets.
5.3: Change and configuration options are documented and stakeholders are involved.
5.4: The documents became standards and guidelines company-wide. The processes were improved.
5.5: Change and configuration activities are now only carried out according to guidelines and compliance with the guidelines is regularly checked. The processes have been further improved.
Only when relationships with internal and external stakeholders are established through the implementation of the Smart Grid vision (2.2: Strategy, Management, and Regulation) should these also be involved within the framework of plant change and configuration management (5.3: Plant, Change, and Configuration Management). Similarly, Smart Grid modernization must first become an integral part of the business strategy (2.4: Strategy, Management, and Regulation) before the change and configuration activities can only be carried out according to guidelines (5.5: Plant, Change, and Configuration Management). Similarly, technologies must first be selected in the company to implement the Smart Grid vision (10.1: Technology in general) before the system can be adequately used and configured (5.1: Plant, Change, and Configuration Management).
Dimension 6: Grid Operation
Grid operation is more dependent on progress in other dimensions. These include 2 (strategy, management, and regulation), 3 (asset management for distributed generation), 9 (grid automation), 10 (technology in general), 11 (ICT connectivity), and 13 (forecasting systems).
The individual development steps of dimension 6 are (Software Engineering Institute, 2011):
6.1: The DSO evaluates possible automation possibilities in network operation and examines the possibilities for process optimization offered by a Smart Grid. This study contributes to the formulation of an overall vision for an intelligent power grid. New sensors, switches and communication technologies for network monitoring and control are evaluated. Component tests for network monitoring and control are underway. Failure and distribution management systems associated with substation automation will be investigated and evaluated.
6.2: The DSO begins to implement network monitoring and control functions linked to the Smart Grid vision. The focus is on communication to support network automation. Distribution stations are automated and connected to some form of remote distribution automation (e.g., intelligent switching in the field). Distribution to substation automation is bidirectional and includes features such as advanced fault and event logging to support detailed electrical fault analysis, remote switching and advanced power grid monitoring capabilities, and advanced automation features such as intelligent load shedding capabilities. Advanced failure recovery programs are implemented that automatically resolve (self-heal) or reduce the severity of unplanned failures. Investments in and expansion of data communications networks to support network operation are underway.
6.3: Integration of analytics, automation, and control across multiple systems and organizational functions. The use of smart grid functions provides information to support analysis and decision making for network operation. This can lead to new processes due to increased automation and observability. Intelligent measurement systems (e.g., smart meters) are installed and their data can be retrieved and support decision making in network management.
6.4: The network operation is integrated into the business processes and drives them forward. This enables the transition from personal decision making to automated decision making (e.g., through control systems and decision systems). Network operations management is based on real-time data (i.e., dynamic network management). Network operation is continuously monitored. Operational forecasts are based on data collected through Smart Grid capabilities.
6.5: The increased observability and control in network operation drives innovations within the company. The goal is now a system-wide dynamic control of the networks (e.g., through grid monitoring and analysis platforms). The reliability of the networks is increased. Self-healing powers are available. System-wide analytical and automated grid decisions are available.
The DSO can only work on the introduction of network monitoring and control functions (6.2: Grid Operation) if the Smart Grid vision is already being implemented (2.2: Strategy, Management, and Regulation) and intelligent safety edges are being used (11.3: ICT connectivity). Only when additional regional data collections from asset management can be used to optimize deployment plans (3.3: Asset Management for decentralized Power Plants) this information can be used, among other things, to support analysis and decision-making for network operation (6.3: Grid Operation). But here too, of course, new technologies must first be tested (10.1: Technology in general) before new automation options can be evaluated in network operation (6.1: Grid Operation), pilots can be set in motion (10.2: Technology in general), in order to be able to begin with the introduction of functions for network monitoring and control, these new technologies must be integrated (10.3: Technology in general), in order to enable an integration of automation and control in network operation (6.3: Grid Operation). This requires intelligent measurement systems (13.3: Forecasting Systems). Pursuing cooperation with external providers for new, innovative technology solutions (10.4: Technology in general) is needed in order to be able to implement truly automated network operation (6.4: Grid Operation). It also plays a role that the control system is developed into a Smart Grid control system (9.2: Grid Automation) and finally the advanced technologies help to adapt quickly and serve as a basis for future innovations (10.5: Technology in general) in order to realize a system-wide dynamic control of the networks (6.5: Grid Operation).
Dimension 7: Grid Components
The grid components are already depending on many other dimensions and their development progress. These include 2 (strategy, management and regulation), 5 (plant, change and configuration management), 8 (network control system), 9 (network automation), 11 (ICT connectivity), 12 (data management), 14 (plant communication and control modules), 15 (information exchange and communication), 16 (event and response; continuity of operations), 17 (threat and vulnerability management), and 18 (risk management).
The individual development steps of dimension 7 are (Acatech and EIT ICT Labs, 2012):
7.1: Use of asset management for central operating facilities. There is also automatic capture for central elements and partial capture of dynamic data for automated asset management.
7.2: There are standardized interfaces in asset management. In addition, there is an extension of asset management to other non-central assets.
7.3: The current asset states are used for resource planning. The asset management systems are linked to the control systems (e.g., the Smart Grid control system and decision systems) and parameters for plant control are transferred.
7.4: External costs are included in the asset management.
7.5: There is an asset management system (ECG equipment). Thus, all resource data of the plants are available in the asset management. The ECG equipment allows age and condition to be taken into account for optimum plant operation.
There must be a smart grid concept (2.1: Strategy, Management, and Regulation) before the asset management of network components can begin (7.1: Grid Components). This also applies to plant, change and configuration management (5.1), network control systems (8.1), ICT connectivity (11.1), data management (12.1), plant communication and control modules (14.1), information exchange and communication (15.1), BCM (16.1), threat and vulnerability management (17.1) and risk management (18.1). In all these dimensions, the first step must have been taken before the network components can be started with the first step. For network control systems, it is crucial that the network control technology has interfaces (8.4: Grid Control System) before asset management can be linked to the network control system (7.3: Grid Components). The Smart Grid control system must also be introduced by then (9.2: Grid Automation). Similarly, the expansion of ICT must already be pushed regionally (11.2: ICT connectivity) so that standardized interfaces can be used in asset management (7.2: Grid Components). The communication channels must follow standards (15.4) before asset management can be connected to the control system (7.3: Grid Components), there must also be process flows or standards and guidelines for event and reaction; continuity of operations (16.3), for threat and vulnerability management (17.3) and for risk management (18.3).
Dimension 8: Grid Control System
The grid control system is also dependent in several of its development stages on progress in many other dimensions. It can also be seen as a key component for the closed system level. This is influenced by dimensions 2 (strategy, management and regulation), 3 (asset management for distributed generation), 9 (network automation), 10 (general technology), 11 (ICT connectivity), 12 (data management), 13 (forecasting systems), 15 (information exchange and communication), 16 (event and response; continuity of operations), 17 (threat and vulnerability management), and 18 (risk management).
The individual development steps of dimension 8 are (Acatech and EIT ICT Labs, 2012):
8.1: There are still no business processes between producers and consumers. There is an intelligent electronic device (IED) application at medium-voltage level. The load flows are also recorded at medium-voltage level.
8.2: Switchovers in the medium-voltage network are possible. Power flow regulating systems are used to optimize and prevent voltage band violations. A real-time simulation within the network control system is available.
8.3: The use of process-oriented systems for predicting operating resources takes place. Modularized network control systems (NCS) with open interfaces (e.g., via intelligent safety edges) are available.
8.4: Modern NCS systems require new interfaces and open technical standards for the connection of decentralized plants of different manufacturers. There are dependencies to forecasting systems, asset management systems as well as technologies for feed-in management (e.g., via data platforms for monitoring or dedicated Smart Grid control systems).
8.5: The NCS is sensibly fully automated. Operating paradigms with Microgrids can be supported on a case-by-case basis. The step supports operation management under a complex sensor and intervention situation as well as resilient operation management with the possibility of problem identification and elimination using technologies such as artificial intelligence (AI).
Therefore, before the use of intelligent electronic devices can begin as a first step (8.1: Grid Control System), the company must develop a smart grid concept (2.1: Strategy, Management, and Regulation), the medium-voltage level must already be connected to the control system (9.1: Grid Automation), it must be possible to equip devices with ICT (11.1), there must be data management (12.1) and the first plans for BCM (16.1), for vulnerability and threat management (17.1) and risk management (18.1). In addition, the Smart Grid vision must already be increasingly planned company-wide (2.3: Strategy, Management, and Regulation), there must be external interfaces between the market participants (11.3: ICT connectivity) and further data based on intelligent measurement systems (e.g., smart meters) (13.3: Forecasting Systems) must be supplied for the forecast of operating resources (also 8.3: Grid Control System) before work can begin in the control system with open interfaces (8.3: Grid Control System). For the development step of referring the network control system to the forecasting system and asset management (8.4: Grid Control System), there must be bidirectional communication paths between asset management and decentralized facilities (3.4: Asset Management for decentralized Power Plants), grid monitoring and analysis platforms must be introduced (10.5: Technology in general), there must be extensions to consumption forecasts (13.4): Forecasting Systems and communication paths must be introduced as standard in the company (15.4). For the final development step of a largely automated network control system (8.5: Grid Control System), all power supply components must be integrated and networked via plug-and-play interfaces (11.5: ICT connectivity).
Dimension 9: Grid Automation
Grid automation is almost as strongly linked as the grid control system with individual advances in other dimensions. It is also an important component. Dependent dimensions include 2 (strategy, management and regulation), 6 (network operation), 7 (network components), 10 (general technology), 11 (ICT connectivity), 12 (data management), 15 (information exchange and communication), 16 (event and response; continuity of operations), 17 (threat and vulnerability management), and 18 (risk management).
The individual development steps of dimension 9 are (Acatech and EIT ICT Labs, 2012):
9.1: The medium-voltage level is connected to the control system. Transmitters with field computers are used in the medium-voltage network. Isolated actuators are also used in the distribution network.
9.2: The switchgears in the medium voltage range are equipped with controllable IEDs (the control system becomes a Smart Grid control system). IEDs in the low voltage range are used for measurements. The control concept used is no longer distributed control, but StatCom, autonomous or central control1.
9.3: IEDs with actuators are used in the low-voltage range (where necessary). The increased use of control units can be countered, for example, by intelligent safety edges. Ten to twenty percent of all measuring nodes of the medium and low voltage network are equipped with sensors2. The control concept used is no longer distributed control or StatCom, but autonomous or central control3.
9.4: Autonomous network agents are used in local network stations (i.e., adjustable local network transformers instead of local network transformers). At least 20% of all measuring nodes of the medium and low voltage network are equipped with sensors4. Only the central control system is still used as the control concept5.
9.5: All network technology components in the low-voltage range are IEDs. An automated and learning control of all components takes place (e.g., in the form of a grid monitoring and analysis platform, as well as the use of measured local network transformers instead of adjustable local network transformers).
For the first development step of connecting the medium-voltage network to the control system (9.1: Grid Automation), the following steps of other dimensions must first be fulfilled: the company must have a Smart Grid concept (2.1: Strategy, Management, and Regulation), the company must already have examined automation options (6.1: Grid Operation) the first devices must be equipped with ICT (11.1), there must be data management (12.1) and first plans for regulated information exchange (15.1: Information Exchange and Communication), BCM (16.1), threat and vulnerability management (17.1) and risk management (18.1). For the third development step of using actuators with IEDs in the low-voltage range (9.3: Grid Automation), asset management must be connected to the control system (7.3: Grid Components). For the fourth development step of using intelligent local network stations (9.4: Grid Automation), the Smart Grid vision must already exist company-wide with network modernization strategy and planning (2.3: Strategy, Management, and Regulation) as well as automated interaction between market participants through external interfaces (11.3: ICT connectivity). In order to achieve holistic, automated and learning control of all components (9.5: Grid Automation), the grid monitoring and analysis platform must first be introduced (10.5: Technology in general).
Dimension 10: Technology in General
Since only the general technical infrastructure of a network operator is seen in this dimension (and no energy-specific technologies), this dimension is also only slightly influenced by dimensions 2 (strategy, management and regulation) and 6 (network operation).
The individual development steps of dimension 10 are (Software Engineering Institute, 2011):
10.1: The DSO is investigating standardized but flexible IT systems that can serve as a solid technical foundation for building a robust smart grid information infrastructure. An enterprise IT architecture exists or is under development. The company evaluates its existing or planned IT architecture according to quality characteristics (e.g., interoperability, security, modifiability) that support Smart Grid applications. Possibilities for using technologies to improve functional department services are identified (e.g., for cost reduction, improvement of workflows, automation of recurring tasks, risk reduction). There is a process for evaluating and selecting technologies in line with the Smart Grid vision and/or strategy of the company.
10.2: The DSO has a defined technology strategy to achieve the Smart Grid goals. Initial technologies are used to support Smart Grid pilots and applications. The company develops an IT investment plan that is aligned with the Smart Grid strategy. Pilots based on connectivity to distributed IEDs are underway.
10.3: The DSO is implementing its Smart Grid technology strategy and integrating its organizational systems. Smart Grid-influenced business processes are aligned with the company-wide IT architecture. The company has a robust concept for a portfolio of Smart Grid services and a clear focus on implementing strategic applications that support the Smart Grid portfolio. The company's systems follow a company-wide IT architecture framework for Smart Grid (e.g., through a control system). The use of advanced distributed intelligence and analysis capability is enabled by Smart Grid technology.
10.4: Optimizing organizational systems are linked by a strategic, enterprise-wide IT architecture that has been optimized to support Smart Grid services. Visibility extends across all business units and business functions across the enterprise, and security, privacy, and performance issues have been addressed in IT implementations across the enterprise. The organization works with vendors to develop new and innovative technology solutions that meet the company's smart grid needs (e.g., VPP gateway).
10.5: Advanced technologies help the company to adapt quickly and serve as a basis for future innovations. Organizational systems and processes are able to adapt with sufficient speed and flexibility to internal and external influences in order to achieve the goals of the smart Grid despite a rapid occurrence of adverse circumstances and to take advantage of new business opportunities arising as a result of the company's Smart Grid capabilities. In an autonomous system with machine learning capabilities, the human operator takes on a new role by defining policies and rules that serve as input for the self-management process managed in real time by the computer system. State-of-the-art network stability systems are used (e.g., via grid monitoring and analysis platforms). Business processes are automatically re-optimized by advanced technology solutions.
Before stage three—the implementation of the technology strategy for Smart Grids in the organization—can begin (10.2: Technology in general), the implementation of the Smart Grid vision must already have been worked on (2.2: Strategy, Management, and Regulation) and possible automation options in network operation evaluated (6.1: Grid Operation). For the final development step, the rapid adaptability of the company through advanced technologies (10.5: Technology in general), the ultimate goal of innovation must be achieved (2.5: Strategy, Management, and Regulation).
Dimension 11: ICT Connectivity
ICT connectivity is influenced by eight other dimensions. These are 2 (strategy, management and regulation), 9 (network automation), 10 (general technology), 12 (data management), 15 (information exchange and communication), 16 (BCM), 17 (threat and vulnerability management), and 18 (risk management).
The individual development steps of dimension 11 are (Acatech and EIT ICT Labs, 2012):
11.1: Devices over 100 kw are ICT technically connected and controllable. There are point-to-point ICT connections to other Smart Grid players. A directory service for systems is used in individual cases. There is an experimental use of actuators and sensors in the network to control and maintain network stability.
11.2: There is a regional expansion of ICT communication to island solutions.
11.3: External interfaces of the regional systems allow a supra-regional use as data hub. There is an automated interaction between market participants (e.g., by RTU, intelligent safety edges).
11.4: Standardized plug and play solutions allow access to information for all authorized participants (e.g., through the use of aBox, mBox, MV-controller, MV-sensor, LV-actuator, LV-sensor, PV gateway, PV inverter). Communication takes place via power line communication (PLC) and long term evolution (LTE).
11.5: All power supply components are integrated and networked via plug and play interfaces (e.g., by using a Smart Grid control system and adjustable local network transformers). Communication now mainly takes place via LTE.
Again, there are some dependencies before the first development step (11.1: ICT connectivity): there must be a Smart Grid concept in the company (2.1: Strategy, Management, and Regulation), there must be data management (12.1) as well as initial planning for BCM (16.1), threat and vulnerability management (17.1) and risk management (18.1). The company must also have already developed a defined technology strategy in the area of technology with which it wants to achieve the Smart Grid vision (10.2: Technology in general). For the third development step of external interfaces for automated interaction between market participants, the company must already have communication standards (15.4: Information Exchange and Communication). In order to achieve the last development step of a Smart Grid control system (11.5: ICT connectivity), this control system must already be set up (9.2: Grid Automation).
Dimension 12: Data Management
Due to its cross-sectional function, data management is linked to several other dimensions and is therefore dependent on their development. These are 2 (strategy, management and regulation), 10 (technology in general), 16 (BCM), 17 (threat and vulnerability management) and 18 (risk management).
The individual development steps of dimension 12 are (Acatech and EIT ICT Labs, 2012):
12.1: Data management takes place in traditional technologies (databases). There is a use of data stream management and data warehouse.
12.2: In addition to the actual data, meta information such as data origin and data quality is stored and processed.
12.3: The semantic enrichment of the data takes place via meta information. The data is decoupled from its physical origin, ensuring that the origin of the data is secure.
12.4: Data access in real-time is possible. The data is semantically integrated and analyzed coherently.
12.5: Data management has been moved to the cloud.
For the first step of the introduction of data management (12.1), the implementation of the Smart Grid vision must be worked on (2.1: Strategy, Management, and Regulation), the company must have a defined technology strategy to achieve the Smart Grid goals (10.1: Technology in general), and first plans for BCM (17.1), threat and vulnerability management (17.1) and risk management (18.1) must be available.
Dimension 13: Forecasting Systems
Forecast management is co-dependent on eight other dimensions in a total of three development steps. These dimensions are 2 (strategy, management and regulation), 10 (technology in general), 11 (ICT connectivity), 12 (data management), 15 (information exchange and communication), 16 (event and response; continuity of operations), 17 (threat and vulnerability management), and 18 (risk management).
The individual development steps of dimension 13 are (Acatech and EIT ICT Labs, 2012):
13.1: Forecasting systems are used in only a few areas of the energy industry and support energy procurement and investment planning.
13.2: There is a use of rudimentary forecasting systems, e.g., for calculating the profitability of PV systems. High-resolution forecasting systems for wind and weather are also used.
13.3: Based on intelligent measuring systems (e.g., smart meters), high-resolution consumption forecasts are created and used for planning.
13.4: There is an extension of the consumption forecast by forecasting the effect of variable tariffs and feedback systems. Correlations between different forecasting systems must be taken into account.
13.5: The use of plant-specific data such as age to improve forecasting systems for decentralized generation takes place.
In order for the first development to proceed, first steps must be taken in Smart Grid Strategy (2.1), General Technology (10.1), Data Management (12.1), BCM (16.1), Threat and Vulnerability Management (17.1), and Risk Management (18.1). For rudimentary forecasting systems to be used (13.2: Forecasting Systems), there must be external interfaces in the regional systems (11.3: ICT connectivity). Intelligent measurement systems are introduced for high-resolution consumption forecasting (13.3: Forecasting Systems), which allow access to them through standardized plug-and-play solutions (11.4: ICT connectivity) and standardized communication protocols are also required for this (15.4: Information Exchange and Communication).
Dimension 14: Plant Communication and Control Modules
The dimension plant communication and control modules is dependent on eight other dimensions in only a few development advances. These dimensions are 2 (strategy, management, and regulation), 9 (network automation), 11 (ICT connectivity), 12 (data management), 15 (information exchange and communication), 16 (BCM), 17 (threat and vulnerability management), and 18 (risk management).
The individual development steps of dimension 14 are (Acatech and EIT ICT Labs, 2012):
14.1: Proprietary interfaces are supported. Renewable energy and combined heat and power (CHP) plants with an installed capacity > 100 kW always provide a communication interface. The generation plants between 30 and 100kW have the possibility of a standardized communication connection. The control concepts for plants above > 30 kW are supported.
14.2: All systems over 30 kW have IEDs.
14.3: The Intelligent Electronic Devices (IED) used become intelligent and react independently to the environment (e.g., connection via intelligent safety edges in stations).
14.4: IEDs are available on the market for all systems that allow autonomous control and a standardized communication connection (e.g., RTU). This connection can be made via directional Plug & Play.
14.5: The IEDs are capable of autonomous system intelligence. Seamless integration into VPP systems, regional energy markets, control systems etc. takes place (e.g., through Smart Grid control systems).
Before the first development step (14.1: Plant Communication and Control Modules), a first Smart Grid strategy (2.1), first steps on ICT connectivity (11.1), data management (12.1), information exchange and communication (15.1), BCM (16.1), threat and vulnerability management (17.1), and risk management (18.1) are required.
Next, the third development step (14.3: Plant Communication and Control Modules) depends on the use of intelligent safety edges in the stations (11.3: ICT connectivity) and standardized communication paths (15.4: Information Exchange and Communication). Only then is the final development step (14.5: Plant Communication and Control Modules) dependent on the introduction of the Smart Grid control system again (9.2: Grid Automation).
Dimension 15: Information Exchange and Communication
The exchange of information and communication is only slightly dependent on the development steps of other dimensions, since it is all about the communication interface and its protocols. The dependent dimensions are 2 (strategy, management, and regulation), 17 (threat and vulnerability management), and 18 (risk management).
The individual development steps of dimension 15 are (U.S. Department of Energy, 2014):
15.1: The DSO exchanges information with internal and external bodies for the purpose of analyzing and coordinating tasks and work processes.
15.2: Communication channels across interfaces are used for ad hoc situations.
15.3: Communication channels for demand situations are documented and stakeholders are involved.
15.4: Standards and guidelines are created for the communication channels and the communication channels are improved (e.g., IEC 60870-5-104 and IEC 61850-8-2).
15.5: Communication channels are only used according to guidelines and compliance with the guidelines is checked regularly. The communication channels will continue to be improved (successors of the IEC 60870.5-10X and X 61850-8-X series of standards will be used after introduction).
Before the second development step—regulating ad hoc situations via communication channels via interfaces (15.2: Information Exchange and Communication)—can be achieved, work must already be done on the development of a security standard (17.2: Threat and Vulnerability Management) and it must be possible to react ad-hoc to events with the already established risk management system (18.2). Before the third step of documentation of communication channels and stakeholder involvement (15.3: Information Exchange and Communication), there must be an integrated security solution (17.3: Threat and Vulnerability Management) and documented processes/recommendations for risk management (18.3). Before standards are drawn up for communication channels (15.4: Information Exchange and Communication), smart grid modernization must have become an integral part of the business strategy and the exchange of information with internal and external parties must have increased as a result (2.4: Strategy, Management, and Regulation).
Dimension 16: Business Continuity Management (BCM)
The Dimensions 16–18, which are part of the “Security” theme, have an influence on many other dimensions as a cross-sectional dimension, but are dependent on a few. Dimension 16 includes dimensions 2 (strategy, management, and regulation), 15 (information exchange and communication), 17 (threat and vulnerability management), and 18 (risk management).
The individual development steps of dimension 16 are (U.S. Department of Energy, 2014):
16.1: The DSO is beginning to think about plans, procedures and technologies for detecting, analyzing and responding to cyber security incidents and maintaining critical functionality during a cyber-event, according to the risk to critical infrastructure and business objectives.
16.2: It is possible to react ad-hoc to initial incidents.
16.3: Process sequences/recommendations for action are written down.
16.4: The process flows become standards and guidelines. The processes are further improved.
16.5: Events are only processed according to the guidelines. Compliance with the guidelines is checked regularly. Processes will continue to be improved.
Before the first step can be taken, namely the first thoughts on the subject of reaction to cyber security incidents (16.1: BCM), there must have been an exchange of information for the purpose of analyzing and coordinating tasks and work processes (15.1: Information Exchange and Communication), and there must be initial plans for threat and vulnerability management (17.1) and risk management (18.1). Before the second step of the ad hoc response to incidents (16.2: BCM) there must be communication channels for ad hoc situations (15.2: Information Exchange and Communication), there must already be an experimental use of domain-specific security standards (17.2: Threat and Vulnerability Management) and risk management must react ad hoc to incidents (18.2: Risk Management). For the third development step of the preparation of process flows/recommendations for action (16.3: BCM), integrated safety solutions must be available (17.3: Threat and Vulnerability Management) and documented processes / recommendations for action for risk management must exist (18.3: Risk Management). Before process flows can become standards (16.4: BCM), smart grid modernization must have become an integral part of the business strategy (2.4: Strategy, Management, and Regulation), there must be standards for communication channels (15.4: Information Exchange and Communication) and risk management standards (18.4: Risk Management). For the last step, in which events are only processed according to guidelines and further improved (16.5: BCM), only standardized communication channels must be used and this must also be checked regularly (15.5: Information Exchange and Communication).
Dimension 17: Threat and Vulnerability Management
The dimensions 16–18, which are part of the “Security” theme, have an influence on many other dimensions as a cross-sectional dimension, but are dependent on a few. For dimension 17, these include dimensions 2 (strategy, management, and regulation), and 18 (risk management).
The individual development steps of dimension 17 are (Acatech and EIT ICT Labs, 2012; U.S. Department of Energy, 2014):
17.1: General safety standards are applied and maintained. Experimental use of monitoring systems for IT security.
17.2: Development and experimental use of domain-specific security standards. The functional reliability of the entire ICT system is guaranteed in the event of power failures.
17.3: Integrated security solutions available, support of domain-specific design patterns (security patterns) and standards.
17.4: Prototypical application of the principle “Security by Design” and “Privacy by Design.” Best practice evaluations are available, which are implemented in libraries and frameworks.
17.5: IT attacks can be fought semi-automatically. There is self-healing after attacks as well as the use of cyber forensics.
Before the first development step of the experimental use of monitoring systems for IT security can be started (17.1: Threat and Vulnerability Management), a first risk management system is required (18.1: Risk Management). Before the third step of the existence of integrated security solutions (17.3: Threat and Vulnerability Management), Smart Grid modernization must have become an integral part of the business model (2.4: Strategy, Management, and Regulation), and risk management standards must be in place (18.4: Risk Management).
Dimension 18: Risk Management
Dimensions 16–18, which are part of the “Security” theme, have an influence on many other dimensions as a cross-sectional dimension, but are dependent on a few. For dimension 18, this only includes dimension 2 (strategy, management, and regulation).
The individual development steps of dimension 18 are (U.S. Department of Energy, 2014):
18.1: A risk management system is set up, put into operation and maintained.
18.2: With the risk management system in place, it is possible to react ad hoc to unforeseen events.
18.3: Risk management has documented processes/recommendations for action.
18.4: Risk management prepares standards and guidelines. Processes are further improved.
18.5: Risk management only works according to guidelines and compliance with the guidelines is regularly checked. The processes are being further improved.
Before risk management is introduced (18.1: Risk Management), smart grid concepts are needed (2.1: Strategy, Management, and Regulation). The documentation of processes and procedures in risk management (18.3: Risk Management) depends on the cross-industry implementation of the Smart Grid vision and increased cooperation throughout the company (2.3: Strategy, Management, and Regulation). The fourth development step, the introduction of standards (18.4: Risk Management), requires a Smart Grid modernization that has become an integral part of the business strategy (2.4: Strategy, Management, and Regulation).
The Dimensions and Their Influences
In the previous subchapters the dimensions of the model and their dependencies were presented. These dependencies can also be represented in the opposite direction—as influence. This expresses how strong the influence of other dimensions is on an examined dimension. Table 1 shows the quantitative influence of the dimensions at a glance and their ranking. By rank is meant the order in which the qualitative influence is expressed as a percentage. The dimension with the greatest influence therefore has the first rank.
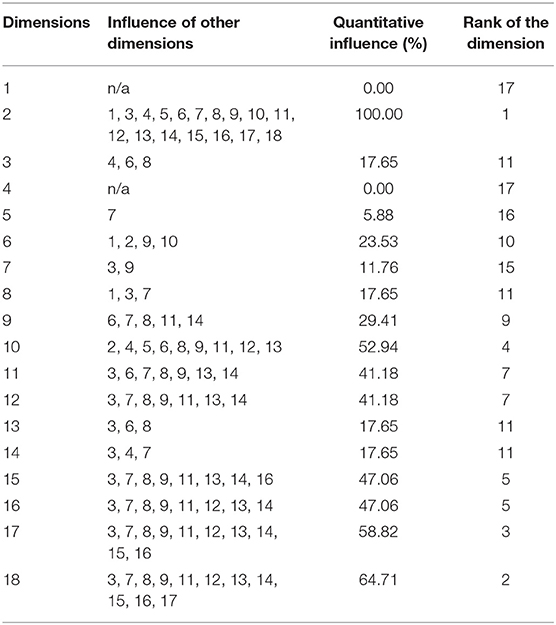
Table 1. The dimensions and their quantitative influences.
This is also illustrated in the diagram in Chapter 4.5.
The evaluation formula presented in Chapter 3 shows the qualitative influences of the dimensions on each other. By applying the formula, research question RQ2 is answered. A comparison of the two approaches and an interpretation is provided in Chapter 4.3.
The following results are achieved with the formula:
Threshold values were defined which were divided into three categories: little influence (light gray, values < 2), medium influence (medium gray; values > 2 < 5) and great influence (dark gray; values > 5).
For example, in this application case only six development steps have a calculated value above 5. These are development steps 2.1 and 2.2 (general information on organization), 11.1 and 11.3 (ICT connectivity), 12.1 (data management), and 15.4 (information exchange and communication). This means that these development steps have a particularly large influence on the overall development of the utility. The continuous further development in these dimensions as well as the controlling of implementation progress are decisive for a positive overall development on the roadmap for the overall success of a Smart Grid initiative.
Basically, it can be observed that the first development steps per dimension are rather medium gray or dark gray (at the beginning there are many more possible successors) and in the course of the development become rather light gray (the number of possible successors decreases), which seems logical.
The development steps 11.3 and especially 15.4, which are still dark gray, but are already further on the development level of the dimensions, are conspicuous. This means that something important happens in these development steps, which is a prerequisite for many other dimensions for further developments and that also does not happen on the same level (e.g., development steps 3.4, 8.4 and 16.4 are dependent on 15.4 and not 7.4 but even 7.3 and 11.3, 13.3 and 14.3). This suggests that these dark gray steps must also be worked through at an early stage in the development of the entire network plan in order to enable development in other dimensions.
This result is shown in the diagram in Chapter 4.5.
Comparison of Qualitative vs. Quantitative Influences
Comparing the results of the tables in Chapters 4.1 and 4.2, it is striking that the high dimensions of quantitative influence in the ranking are not the same dimensions that have a calculated value >5 in the qualitative influence.
For example, dimension 2 (Strategy, Management, and Regulation) is ranked first in the ranking and also has two development steps with a value of > 5 (2.1 and 2.2).
But the dimensions 17 and 18, which are ranked 2nd and 3rd in the ranking, have no calculated values >5.
And dimension 11, which also has two calculated values > 5, only ranks 7th in the ranking.
This can be explained as follows: in the quantitative analysis, the ranking is only measured by the number of dimensions on which one dimension has an influence. However, it is not taken into account at which stage of development this influence has an effect and how many successors there are after that as well as how often one dimension has influence on another. So there is no such detailed information about the degree of influence. The qualitative evaluation is better suited for this kind of analysis and focus.
For distribution system operators (DSO), it is important to have a precise impression during the planning and execution of the individual development steps of the migration paths which dimensions, but also which individual development steps are particularly exposed and require close monitoring. This is given to a greater extent by the results of the qualitative consideration of the influences.
Sensitivity Analysis for Effort and Reduction Factor
In the following, a short sensitivity analysis is given on the influence of the effort e(s) and the reduction factor ri of the formula introduced in Chapter 3.3. Therefore, the capability c(s) is calculated for the dimension 11 in different combinations. The dimension 11 was chosen because it has two development steps with a capability >5 as well as a development step with a relatively low capability of 2.5. The results from Table 2 were calculated with a reduction factor of . In Table 3, the results for another exponential reduction factor of as well as a linear reduction factor of are shown.
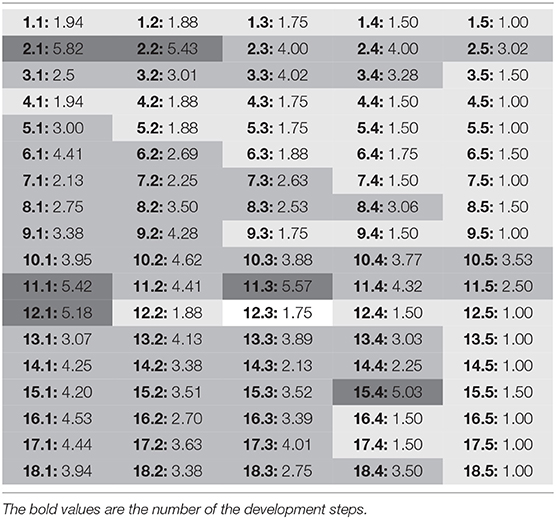
Table 2. The dimensions and their qualitative influences.
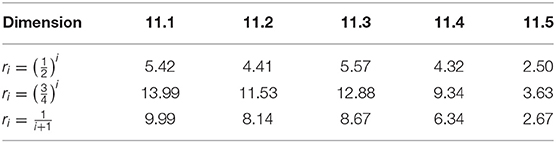
Table 3. Capabilities for dimension 11 “ICT connectivity” with different reduction factors.
It can be seen that the resulting capabilities are higher in both cases, because the ri are higher, too. has always the lowest value, while is higher than until i = 8. Yet still the order of the resulting values within dimension 11 is almost the same: 11.5 has always the lowest value, followed by 11.4 and 11.2. Only the ranking of 11.1 and 11.3 slightly differs and the distances between the capabilities vary.
Besides the reduction factor, the effort for a development step e(s) can be varied, too. Until now, we assumed e(s) = 1 for all development steps. In the next two Tables, we assumed a linear growing as well as decreasing value for the effort between the stages. The interpretation for growing effort is a higher effort for more complex and mature development stages, the interpretation for decreasing effort is a higher effort for the first stages as cutting edges. This means we assume for all dimensions the first stage to have e(d.1) = 1, for the second stage e(d.2) = 2, for the third stage e(d.3) = 3, for the fourth stage e(d.4) = 4, and for the fifth stage e(d.5) = 5, as well as an effort decreasing from 5 to 1 in the other showcase. This results in the following capabilities for dimension 11.
In Table 4 with the growing efforts we can see decreasing capabilities from 11.1 to 11.5 independent of the reduction factor. So if the difference between the efforts is high enough (between first and second development stage factor 2), it is always more promising to develop the technology at lower development stages. In Table 5 with the decreasing efforts we can see a maximum capability result for the third (or fourth) stage. So until the breaking point, it is more promising to evolve technologies with high efforts that enable more successors than evolving late technologies with little efforts (even though the factor of effort between the fourth and fifth development stage is again 2).
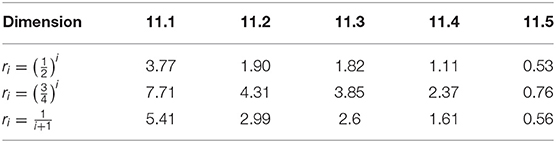
Table 4. Capabilities for dimension 11 “ICT connectivity” with growing effort (more complexity at higher stages).
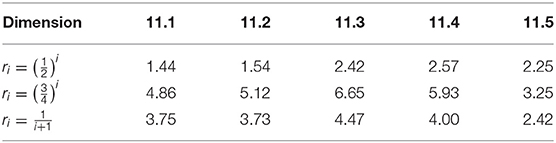
Table 5. Capabilities for dimension 11 “ICT connectivity” with decreasing effort (cutting edges in the beginning).
The Quantitative Consideration of the Influences
The influence shown so far in Table 1 is only a quantitative determination. This can also be illustrated as follows using chord diagrams (Figure 4). In a chord diagram one can recognize by means of the different colors of the dimension, from which dimension the influence proceeds and on which dimension the influence is directed.
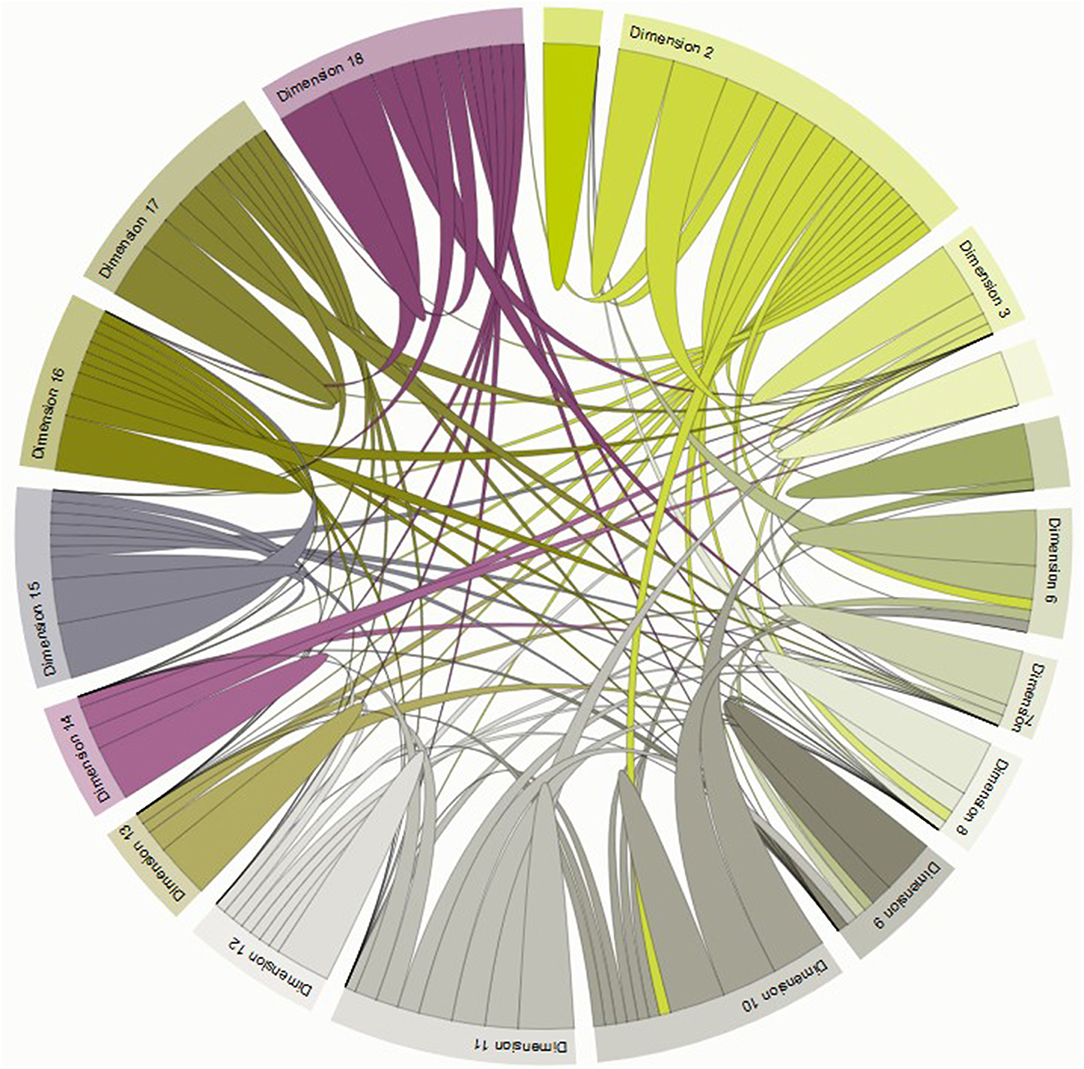
Figure 4. Chord-diagram of quantitative evaluation.
The chord diagrams show by means of the colors whether the influence is on the respective dimension or whether it is aimed from one dimension to another.
For example for our case study, in dimension 18 all connections are in the color of dimension 18. This means that the influence goes from dimension 18 to the other dimensions. Only one connection is green, namely that of dimension 2. Here the influence is to be understood the other way round from dimension 2 to dimension 18. The other illustrations are to be understood analogously.
The Qualitative Consideration of the Influences
The qualitative evaluation can be visualized in a Map Tree-Diagram (Figure 5). All five development steps are shown for each dimension (e.g., 1.1, 1.2, 1.3, 1.4, and 1.5). According to the calculated values from Table 2, the quantities are displayed in relation to each other. This means that the larger the calculated value from Table 2, the larger the box in the Map Tree-Diagram.
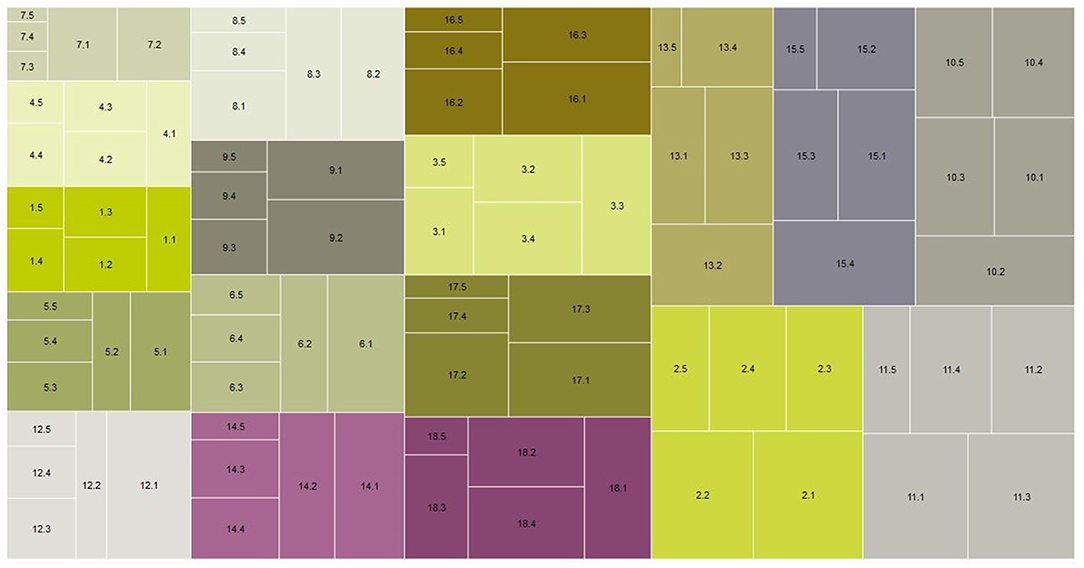
Figure 5. Map tree-diagram of qualitative evaluation.
The calculated value from the algorithm indicates that the higher the value, the more “dense” successors there are to this process. This means the more operations depend on it time-critically and a delay of the operation would delay many other operations. Or the other way around: if the processes with high values are completed particularly quickly, this has a positive influence on the further course of the process.
This approach enables the company to focus its controlling attention on the processes with high values when developing the roadmap. These are critical processes that require special attention and control.
Conclusions and Outlook for Future Work
In this article, we have presented migration paths for planning the development steps for DSO into a Smart Grid that meets the requirements of energy system transformation. A procedure model for the development of migration paths was developed and presented and the development was presented in a case study.
The dependencies between the different considered dimensions, for which the migration paths were developed, were shown (RQ1). For each individual dimension, the interdependencies to the others were pointed out and exemplarily presented on the basis of individual development steps.
An evaluation of these dependencies and influences was also carried out both quantitatively and qualitatively (RQ2). In Chapter 4.3, a comparison and interpretation of the various dependencies was also carried out, in which it was recognized that a qualitative analysis would provide more targeted results for the DSO and should therefore be preferred. This is due to the fact that the quantitative evaluation of the migration paths acts at the dimensional level and the qualitative evaluation of the migration paths starts one level lower—at the level of the development steps.
In principle, the statement is true that any delay in a development step has an influence on other development steps that depend on it. Especially serious are “forced pauses” that can occur as a result.
The calculation of qualitative influences has shown that development steps with high values in particular have the strongest influence and therefore require special observation. These particularly critical development steps are 2.1, 2.2 (both Strategy, Management, and Regulation), 11.1, 11.3 (both ICT connectivity), 12.1 (Data Management), and 15.4 (Information Exchange and Communication). With the method of qualitative consideration of the influences of the development steps, particularly critical development steps on the roadmap—the totality of all migration paths—can be pointed out. For the network operators, these are to be placed at the center of attention as being particularly risky. Equally important development steps (e.g., 15.4), which are already far advanced in their dimension, but have very many successors to early development steps of other dimensions, are to be placed in the roadmap at an early point in time and especially to be controlled.
The migration paths are based on the current state of research and technology and are therefore limited in time. If there are major technological advances, i.e., if other technologies are to be used, this must be taken into account in the development of the individual development steps of the migration paths. Similarly, dependencies and influences must be re-examined on this basis. This means that it is recommended as further scientific research work to review the topicality of migration paths every 2–3 years and, if necessary, to adapt them or even develop them anew.
Basically it can be stated that the basis of the development steps and migration paths is scalable to other DSOs. However, this has two limitations: on the one hand, it is focused on the unbundled European electricity market and on the other hand, further emerging technologies (e.g., distributed ledger technologies) may have to be incorporated in future case studies and their influence on the overall process examined.
Data Availability Statement
All datasets generated for this study are included in the article/Supplementary Material.
Author Contributions
AF: conceptualization, methodology, formal analysis, investigation, and project administration. MC: algorithm. AF and MC: resources, writing—original draft preparation, and visualization. AF, MC, and MU: writing—review and editing.
Conflict of Interest
The authors declare that the research was conducted in the absence of any commercial or financial relationships that could be construed as a potential conflict of interest.
Acknowledgments
The results described above are part of the activities of the Green Access project, which is funded by the Federal Ministry of Economics and Energy (BMWi) and the Federal Ministry of Education and Research (BMBF) as part of the Sustainable Electricity Grids research initiative. For further information see http://forschung-stromnetze.info/. The authors, representing the entire project consortium, are responsible for the content of the contribution. The consortium is made up of: Bergische Universität Wuppertal, BTC AG, DLR Institute for Networked Energy Systems, EWE NETZ GmbH, Fraunhofer Institute for Solar Energy Systems (ISE), OFFIS e. V., PHOENIX CONTACT Energy Automation GmbH, SMA Solar Technology AG, SPIE SAG GmbH.
Supplementary Material
The Supplementary Material for this article can be found online at: https://www.frontiersin.org/articles/10.3389/fenrg.2019.00134/full#supplementary-material
Footnotes
1. ^CF. Fraunhofer ISE control concepts from the Green Access project.
2. ^According to statement of the BUW in the project Green Access.
3. ^CF. Fraunhofer ISE control concepts from the Green Access project.
4. ^According to statement of the BUW in the project Green Access.
5. ^CF. Fraunhofer ISE control concepts from the Green Access project.
References
Ahlemann, F., Schroeder, C., and Teuteberg, F. (2005). Kompetenz- und Reifegradmodelle für das Projektmanagement: Grundlagen, Vergleich und Einsatz. Osnabrück.
Antunes, P., Carreira, P., and Mira da Silva, M. (2014). Towards an energy management maturity model. Energy Policy 73, 803–814. doi: 10.1016/j.enpol.2014.06.011
Appelrath, H. J. (2012). Interview mit Henning Kagermann zum Thema “Smart Grids – Informations- und Kommunikationstechnologie als Schlüsselfaktor für ein zukunftsfähiges Energiesystem” Wirtschaftsinformatik 54, 49–50. doi: 10.1007/s11576-011-0305-z
Appelrath, H. J., Behrendt, F., Bognar, K., Mattern, F., Mayer, C., and Weiss, M. (2011). “Forschungsfragen im 'Internet der Energie',” in acatech Materialien, Vol. 1 (Berlin: Springer Verlag), 23.
Appelrath, H. J., Mayer, C., Breuer, A., Drzisga, T., König, A., Luhmann, T., et al. (2010). Deutschlands Energiewende kann nur mit Smart Grids gelingen. Berlin.
Appelrath, H. J., Mayer, C., and Rohjans, S. (2012). Future Energy Grid - Migrationspfade ins Internet der Energie. Berlin: Springer Verlag. doi: 10.1007/978-3-642-27864-8_4
Becker, J., Knackstedt, R., and Poeppelbuss, J. (2008). Arbeitsberichte Institut für Wirtschaftsinformatik. Münster.
Becker, J., Knackstedt, R., and Poeppelbuss, J. (2009). Developing maturity models for IT management. Bus. Inf. Syst. Eng. 1, 213–222. doi: 10.1007/s12599-009-0044-5
Becker, J., Knackstedt, R., and Poeppelbuss, J. (2010a). Vergleich von Reifegradmodellen für die hybride Wertschöpfung und Entwicklungsperspektiven. Multikonferenz Wirtschaftsinformatik (Göttingen), 2109–2121.
Becker, J., Niehaves, B., Poeppelbuss, J., and Simons, A. (2010b). “Maturity models in IS research,” in European Conference on Information Systems (Pretoria), 1–14.
Biberoglu, E., and Haddad, H. (2002). A survey of industrial experiences with cmm and the teaching of cmm practices. JCSC 18, 143–152.
BPM Maturity Model EDEN e.V. (2009). EDEN – Reifegradmodell Prozessorientierung in Unternehmen. Report, 1–24.
Campbell, R. J. (2018). The smart grid: Status and outlook. U.S. Infrastructure: Government Programs and Economic Impacts), 1–24.
De Bruin, T., Freeze, R., Kaulkarni, U., and Rosemann, M. (2005). “Understanding the main phases of developing a maturity assessment model,” Australasian Conference on Information Systems (Sydney, NSW), 8–19.
Flore, A., and Marx Gómez, J. (2019). “Nachhaltigkeit von Migrationspfaden für Smart Grids,” in Proceedings of the 33rd EnviroInfo Conference (Kassel), 176–182.
Flore, A., and Uslar, M. (2019). “Organisationsentwicklung mit Smart Grid Reifegradmodellen für Versorger,” in Realisierung Utility 4.0, Veröffentl, ed O. D. Doleski (Ottobrunn: Springer), 15. doi: 10.1007/978-3-658-25332-5_41
Fraser, P., Moultrie, J., and Gregory, M. (2002). “The use of maturity models/ grids as a tool in assessing product development capability,” in IEEE (Cambridge), 244–249. doi: 10.1109/IEMC.2002.1038431
García-Mireles, G. A., Ángeles Moraga, M., and García, F. (2012). “Development of maturity models: a systematic literature review,” in 16th International Conference on Evaluation & Assessment in Software Engineering (EASE 2012) (Novi Sad), 279–283. doi: 10.1049/ic.2012.0036
Gausemeier, J., Fink, A., and Schlake, O. (1996). Szenario Management - Planen und Führen mit Szenarien, 2nd Edn. München: Carl Hanser Verlag.
Graerringer, C., Garcia, S., Sivily, J., Schenk, R. J., and Van Syckle, P. (2002). Using the Technology Readiness Levels Scale to Support Technology Management in the DoD ' s ATD / STO Environments A Findings and Recommendations. Pittsburgh, PA. doi: 10.21236/ADA407785
Gresse von Wangenheim, C., Carlo, J., Hauck, R., Salviano, C. F., and von Wangenheim, A. (2010). “Systematic literature review of software process capability/maturity models,” in Proceedings of the 12th International Conference on Profes '11 Product-Focused Software Process Improvement (Pisa), 2–5.
Hankel, A., Oud, L., Saan, M., and Lago, P. (2014). “A maturity model for green ICT : the case of the SURF green ICT maturity model,” in 28th EnviroInfo Conference 2014 (Oldenburg, 1–8.
Hogrebe, F., and Nüttgens, M. (2009). Business Process Maturity Model (BPMM): Konzeption, Anwendung und Nutzenpotenziale. HMD Prax. der Wirtschaftsinformatik 46, 17–25. doi: 10.1007/BF03340339
Horizon 2020 (2014). “Technology readiness levels (TRL),” in Work Programme 2014-2015 General Annexes, Extract from Part 19 – Commission Decision C (2014)4995 (Brussels).
Khan, A. (2015). Innovationsmanagement in der Energiewirtschaft: Entwicklung eines Reifegradmodells (Dissertation) Bremen: Springer Gabler. doi: 10.1007/978-3-658-13584-3
Kirkham, H., and Marinovici, C. (2013). “Technology readiness and the smart grid,” in 2013 IEEE PES Innovative Smart Grid Technologies Conference (ISGT 2013) (Washington, DC). doi: 10.1109/ISGT.2013.6497804
Lahrmann, G., Marx, F., Mettler, T., Winter, R., and Wortmann, F. (2011). “Inductive design of maturity models: applying the rasch algorithm for design science research,” in Service-Oriented Perspectives in Design Science Research, eds H. Jain, A. P. Sinha, and P. Vitharana (Berlin; Heidelberg: Springer), 176–191. doi: 10.1007/978-3-642-20633-7_13
Luhmann, T. (2012). Herausforderung, Future Energy Grid Herausforderung : Neues Energiesystem. Bremen.
Mankins, J. C. (2002). Approaches to strategic research and technology (R&T) analysis and road mapping. Acta Astronaut. 51, 3–21. doi: 10.1016/S0094-5765(02)00083-8
Mankins, J. C. (2009). Technology readiness assessments: a retrospective. Acta Astronaut. 65, 1216–1223. doi: 10.1016/j.actaastro.2009.03.058
Marx, F., Wortmann, F., and Mayer, J. H. (2012). Ein Reifegradmodell für Unternehmenssteuerungssysteme. Wirtschaftsinformatik 54, 189–204. doi: 10.1007/s11576-012-0325-3
Mater, J., and Drummond, R. (2009). A Smart Grid Interoperability Maturity Model Rating System Development.
Mayer, C., Breuer, A., Drzisga, T., König, A., Luhmann, T., Maerten, M., et al. (2012). “Technologische Migrationspfade in das Smart Grid,” in VDE-Kongress 2012 (Stuttgart), 3–8.
Mehmann, J., Frehe, V., and Teuteberg, F. (2015). “Crowd logistics – a literature review and maturity model,” in Proceedings of Innovations and Strategies for Logistics and Supply Chains, Vol. 20 (Hamburg), 117.
Mettler, T. (2011). Maturity assessment models: a design science research approach. Int. J. Soc. Syst. Sci. 3, 81–98. doi: 10.1504/IJSSS.2011.038934
Mettler, T., and Rohner, P. (2009). “Situational maturity models as instrumental artifacts for organizational design,” in Proceedings of the 4th International Conference on Discrete. Scientific Research and Information Technology- DESRIST '09 (Malvern), 1. doi: 10.1145/1555619.1555649
Mettler, T., Rohner, P., and Winter, R. (2010). Towards a Classification of Maturity Models in Information Systems. Berlin-Heidelberg. doi: 10.1007/978-3-7908-2404-9_39
Pfeffer, J., and Sutton, R. I. (1999). Knowing ‘What' to Do Is Not Enough: turning knowledge into action. Calif. Manage. Rev. 42, 83–108. doi: 10.2307/41166020
Poeppelbuss, J., Niehaves, B., Simons, A., and Becker, J. (2011). Maturity models in information systems research : literature search and analysis. Commun. Assoc. Inform. Syst. 29, 30. doi: 10.17705/1CAIS.02927
Rohjans, S., Uslar, M., Cleven, A., Winter, R., and Wortmann, F. (2011). “Towards an adaptive maturity model for smart grids,” 17th International Power Systems Computation Conference (Stockholm).
Software Engineering Institute (2011). SGMM Model Definition. Technical Report, Pittsburgh, PA, United States.
Software Engineering Institute and the GridWise Architecture Council (2012). Maturity Models 101: A Primer for Applying Maturity Models to Smart Grid Security, Resilience, and Interoperability. Pittsburgh, PA.
Stevens, J. (2014). Electricity Subsector Cybersecurity Capability Maturity Model (ES-C2M2) (Case Study). Pittsburgh, PA.
Sun, Q., Ge, X., Liu, L., Xu, X., Zhang, Y., Niu, R., et al. (2011). Review of Smart Grid comprehensive assessment systems. Energy Proc. 12, 219–229. doi: 10.1016/j.egypro.2011.10.031
The GridWise Architecture Council (2011). Smart Grid Interoperability Maturity Model Beta Version, 1–46.
Tugurlan, C., Kirkham, H., and Chassin, D. (2011). “Software technology readiness for the smart grid,” in PNSQC 2011 Proceedings (Portland, OR), 1–11.
Uebernickel, F., Stölzle, W., Lennerts, S., Lampe, K., and Hoffman, C. P. (2015) Das St. Galler Business-Innovation-Modell. St. Gallen. doi: 10.1007/978-3-658-07167-7_1
Uslar, M., Dänekas, C., and Specht, M. (2012). Technische Reifegradmodelle für EWE – Fokus Smart Grids @ EWE und BMWi Future Energy Grid. Oldenburg.
Uslar, M., and Masurkewitz, J. (2015). “A survey on application of maturity models for smart grid: review of the state-of-the-art,” in Proceedings EnviroInfo and ICT for Sustainability 2015, Vol. 22 (Kopenhagen), 261–270. doi: 10.2991/ict4s-env-15.2015.30
Widergren, S., Levinson, A., Mater, J., and Drummond, R. (2010). “Smart grid interoperability maturity model,” in IEEE PES General Meeting (Minneapolis, MN), 1–6. doi: 10.1109/PES.2010.5589785
Winter, R., and Aier, S. (2019). “Designing evolution paths for enterprise-wide information systems,” in DSR Cases, eds J. vom Brocke, A. Mädche, and A. R. Hevner (Springer), 29.
Wittstock, R., Warnecke, D., and Teuteberg, F. (2016). Development of an Ontology of Sustainability Assessment Methods for the ICT Sector. Lüneburg.
Keywords: migration paths, maturity, smart grid, algorithm, DSO
Citation: Flore A, Clausen M and Uslar M (2019) Migration Paths for Smart Grids and Their Evaluation Using a Case Study. Front. Energy Res. 7:134. doi: 10.3389/fenrg.2019.00134
Received: 19 August 2019; Accepted: 08 November 2019;
Published: 26 November 2019.
Edited by:
Yang Li, Northeast Electric Power University, ChinaReviewed by:
Young Li, North China Electric Power University, ChinaShuichi Ashina, National Institute for Environmental Studies, Japan
Copyright © 2019 Flore, Clausen and Uslar. This is an open-access article distributed under the terms of the Creative Commons Attribution License (CC BY). The use, distribution or reproduction in other forums is permitted, provided the original author(s) and the copyright owner(s) are credited and that the original publication in this journal is cited, in accordance with accepted academic practice. No use, distribution or reproduction is permitted which does not comply with these terms.
*Correspondence: Agnetha Flore, YWduZXRoYS5mbG9yZUBvZmZpcy5kZQ==