 Binh Nam Nguyen
 Van Tan Nguyen
 Minh Quan Duong
 Kim Hung Le
- The University of Danang–University of Science and Technology, Da Nang, Vietnam
Smart grids are considered as key solutions to solve current power security issues. Among these suggestions, microgrid is proposed to integrate distributed generations (DGs) such as photovoltaic (PV) system into the network and the control of DGs output power is getting more attention. The output power of PV arrays with nonlinear characteristics is affected by temperature, solar irradiation and load. Various maximum power point tracking (MPPT) methods for photovoltaic (PV) power systems have been considered and developed to maximize the delivered possible power. In this paper, a modelized photovoltaic source is introduced, based on the Thevenin equivalent circuit. An ordinarily employed solar system model is linearized into simple Thevenin source-resistance representation. Next, a control algorithm associated with the relationship between controller's PWM duty cycle of the MPPT boost converter and solar array output power, namely proposed MPPT algorithm, is introduced. This proposed method is compared with an existing popular MPPT algorithm to confirm its superior performance by using the MATLAB/SIMULINK® simulation. The results show an improvement in the power generation from a PV array in any weather condition, and also help to reduce the impact of rapid change of solar irradiation on the output power variation within the time duration of change. Therefore, the proposed algorithm reduces the effect on grid frequency and motivate the PV generation penetration into the microgrids. Finally, a 50W DC-DC boost converter prototype is implemented and tested to verify the feasibility of the proposed control scheme.
1. Introduction
The use of solar energy is increasingly encouraged because of its outstanding advantages in comparison with the conventional fossil fuel resources such as gasoline, coal, etc. Solar energy is costless, eco-friendly and do not contribute to air pollution. Instead of depending on fossil fuels, which are becoming exhausted, the use of solar energy will guarantee a boundless supply of energy for the future generation (Ram et al., 2017; Yousri et al., 2018). Photovoltaic systems are being used in a variety of applications which may be grouped into two categories: “stand-alone systems” (lighting, satellite communication, electric vehicles, etc.) (Leva and Zaninelli, 2006; Duong et al., 2018) and “utility interactive systems” (or grid-connected systems) (hybrid systems, power plants, etc.; Schaefer, 1990).
In recent years, maximum power point tracking techniques (MPPT) have been being used extensively in photovoltaic generation systems in order to maximize the output power of the PV array varying with ambient conditions such as solar irradiation and temperature. The output voltage is mainly affected by temperature, while the output current is mainly affected by solar irradiation. The characteristic curves of the IPV-VPV and the PPV-VPV are different and nonlinear for different solar radiation and temperature (Patangia et al., 2010; Chatterjee and Keyhani, 2011; Turhan et al., 2013; Yousri et al., 2019). For each ambient condition, there is a typical maximum power point which will change along with the variation of solar radiation and temperature. MPPT means that the PV panel will be set to operate at maximum output power point and transfer the whole PV power to the load.
A variety of MPPT methods were employed for tracking the maximum power point in the literature. For example, the Perturbation and Observation method (P&O) and the Incremental Conductance method (INC) are being used widely in MPPT controllers since their simplicity and easy in implementation (Hua and Shen, 1998; Hohm and Ropp, 2000; Wu et al., 2003; Femia et al., 2006; Esram and Chapman, 2007). These MPPT methods use various techniques and algorithms which significantly differ in performance, such as convergence speed, implementation complexity, accuracy, and investment costs for the whole product.
P&O is one of the most widely used MPPT algorithms because of its simple structure and the few required parameters. However, the P&O algorithm has some drawbacks mentioned in Hussein et al. (1995) such as slow response rate, oscillation around the MPP in steady state, and even wrong tracking under quick-changed atmospheric conditions. This algorithm also poses a large ratio of output power fluctuation and the time duration of power change (ΔP/Δt) due to the rapid increase of solar irradiation. This large ratio has negative effects on the stability of microgrid's frequency (Lam et al., 2016). When microgrids operate in stand-alone mode with high penetration of PV power sources, the grid frequency could be easily unstable or it fluctuates beyond the limit (Delille et al., 2012).
Another approach to develop MPPT controller is to propose a Thevenin equivalent model of PV arrays (Patangia et al., 2010; Chatterjee and Keyhani, 2011; Turhan et al., 2013). In these studies, the error in Thevenin equivalent model of PV arrays can be negligible at the MPP, and this model can be used for analyzing the behavior of the PV arrays (Chatterjee and Keyhani, 2011). Hence, several MPPT algorithms based on the Thevenin equivalent model were proposed as in Turhan et al. (2013), Chatterjee and Keyhani (2011) and (Patangia et al., 2010). In Chatterjee and Keyhani (2011) and Turhan et al. (2013), the MPPT controller for the PV arrays is implemented by continuously measuring parameters of solar irradiation and temperature and then determining the duty cycle value at the MPP from these measured parameters. Meanwhile, in Patangia et al. (2010), an analog MPPT controller is based on the Thevenin model in which the open circuit voltage of the PV panel is considered as the Thevenin voltage (VTH). However, in these MPPT methods, the output responses of MPPT circuit during the change of ambient conditions have not been taken in to consideration.
Therefore, this paper aims to propose an algorithm that has been applied to a step-up boost MPPT based on the relationship between PV output power and MPPT controller duty cycle derived from the Thevenin's equivalent circuit of the PV source. The change of solar irradiation and ambient temperature, which is not mentioned in Turhan et al. (2013), Chatterjee and Keyhani (2011), and Patangia et al. (2010), will be considered.
The proposed MPPT algorithm by the authors can track the maximum power point in several weather condition, especially in the case of rapid change of solar irradiation, that help to improve the efficiency of PV system, which is a limitation of the P& O method. Furthermore, by applying the proposed MPPT algorithm, the ratio ΔP/Δt is much smaller than that when in the case where the P&O algorithm is employed when the solar irradiation change rapidly. Therefore, the proposed method helps to minimize the grid's frequency negative effects and enhance the PV source penetration into microgrids. Finally, this algorithm can also be used generally for other MPPT converter topologies such as buck, boost or buck-boost converters.
2. Mathematical Model Study
2.1. PV Array Characteristics
In term of analyzing PV's output power with respect to its output voltage for a specific PV panel under various solar irradiation or temperature conditions, there is a unique point where maximum power can be achieved, namely maximum power point (MPP) (Subudhi and Pradhan, 2013). This MPP can also be identified by considering an IPV-VPV characteristic curve, as shown in Figure 1A. Regardless of the approaches, PPV-VPV or IPV-VPV, the tracking of gradient variation of IPV or VPV always shows the MPP from a PV panel.
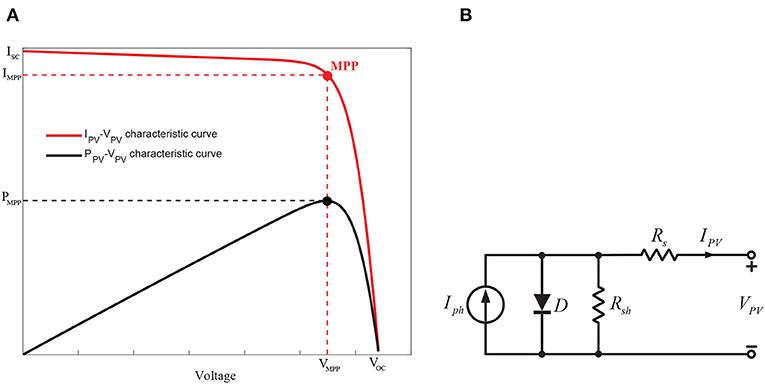
Figure 1. (A) PV module VPV-IPV and PPV-VPV characteristic curves; (B) Equivalent model of a PV source.
A PV source including a non-linear current-voltage IPV-VPV characteristic as shown in Figure 1A can be modeled by a current source, single-diode and resistors connected in series and parallel shown in Figure 1B and output current can be calculated using Kirchhoff's current law as in Equation (1) (Huang et al., 2018; Norouzzadeh et al., 2019; Yousri et al., 2019; Zhu et al., 2019).
where VPV and IPV are the PV module output voltage and current, respectively; Iph and Irs are the photo-generated current and the dark saturation current of the diode, respectively; q is the elementary charge constant (1.602 × 10 − 19C); k is Boltzmann constant (1.38 × 10⁻²³J/oK), n is a dimensionless factor; T is operating temperature in Kelvin; Rs and Rsh are the series and parallel resistances, respectively.
From Equation (1), it is essential to note that the output current of a PV panel connected to a load R is highly dependent on the current-voltage characteristic of this load. Moreover, Equation (1) shows that the operating point of the PV panel changes not only with the load, but also with solar irradiation and ambient temperature. Consequently, for each solar irradiation and temperature condition, it is necessary to track the corresponding MPP. Figure 1 illustrates the existence of the MPP on the PPV-VPV characteristic of PV source, with variable solar irradiation and temperature according to Equation (1).
2.2. Thevenin Equivalent Circuit
The non-linear characteristic of the diode is linearized by piecewise linearization approximation as shown in Figure 2A (Batushansky and Kuperman, 2010; Turhan et al., 2013). The characteristic curve is divided into three different linear regions where the actual non-linear function is approximated to a straight line in each region. The PV model, where the diode is linearized, is shown in Figure 2B. The value of RD and VF will depend on the region of operation.
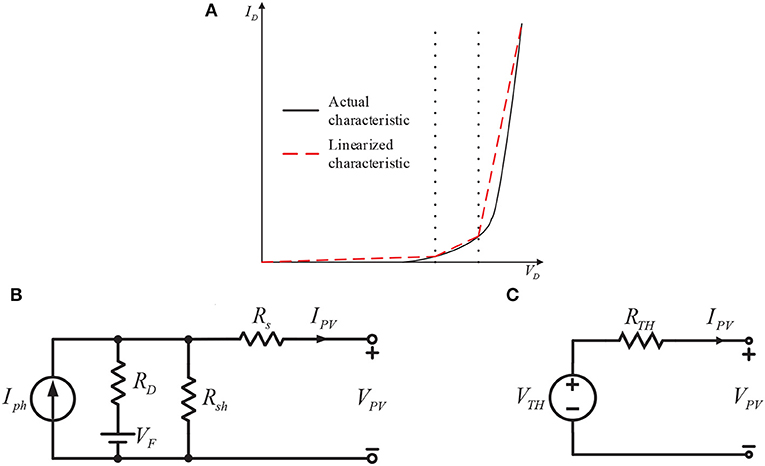
Figure 2. (A) Voltage-current characteristic of diode showing actual characteristic and the piecewise linearized characteristic; (B) Equivalent PV model with diode voltage drop VD and diode resistance RD; (C) Thevenin equivalent circuit of PV source.
A Thevenin equivalent circuit may be derived in order to further simplify the PV model. Since the PV model in Figure 1B is non-linear, the Thevenin theorem cannot be applied in general. Nevertheless, every nonlinear system may be represented by a linearized model with variable parameters by using linearization. The equivalent PV model in Figure 2B with respect to the linearized diode characteristic in Figure 2A now can be represented by Thevenin's equivalent voltage and resistance as shown in Figure 2C. Referring to Figure 1B, the Thevenin equivalent voltage VTH and resistance RTH are not constant and depend on the solar irradiation and temperature, but at a particular ambient condition and load, the solar panel's current-voltage I-V characteristic may be represented by a linear voltage source for a single operating point (Batushansky and Kuperman, 2010). When the irradiation or temperature or load changes, the linear characteristic of the PV array's Thevenin model also changes.
Thevenin voltage and resistance values can be calculated applying Equations (2) and (3), and the PPV-VPV and IPV-VPV characteristic curves of the Thevenin's equivalent circuit obtained from the single-diode model is virtually approximate the actual PV characteristics.
where VTH and RTH are the Thevenin voltage and Thevenin resistance respectively.
From Chatterjee and Keyhani (2011), the error between the actual and Thevenin characteristics of the PV panel is approximately equal to zero at the point of linearization that also includes the MPP. Therefore, if the PV panel is set to operate at the MPP, its Thevenin equivalent circuit also operates at this right MPP.
2.3. The MPPT Model
In order to install the PV system to operate at MPP according to the variation of solar irradiation and temperature, it is necessary to integrate a maximum power point tracking (MPPT) circuit between the PV module and load as shown in Figure 3. The MPPT circuit consists of a controller circuit and a DC-DC converter which can be buck, boost, or buck-boost converter. In this study, the step-up boost converter has been selected. The boost DC-DC converter is driven by the MPPT controller that adjusts the parameters to transfer maximum power from the PV source, in whatever the load and ambient conditions (Rai et al., 2016).
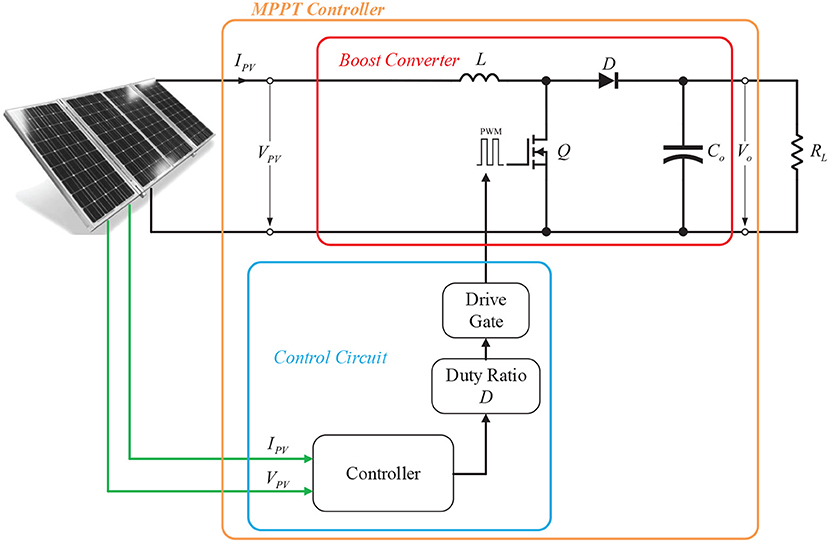
Figure 3. PV maximum power point tracking structure.
The task of the boost converter composed of the switch Q, the inductor L, the output diode D and the output capacitor Co is to convert the fluctuant input voltage to a higher output value. Ideally, since the power consumption of all these devices is very low, which is the reason for the high efficiency of DC-DC converters (Farahat et al., 2012; Allouache1 et al., 2018). The metal oxide semiconductor field effect transistor (MOSFET) is considered as the switching device Q since it is easily controlled by using a pulse width modulation (PWM) signal generated by the controller. The operation of the boost converter is done by turning on off switch Q during every switching period. When the switch Q is turned on during the on-time Ton = DTs of a period Ts, the inductor L will store the energy. When Q is turned off, the polarity of inductor L reserves. The energy stored inside inductor L will be transferred to output capacitor Co via diode D, causing output voltage higher than input voltage. The operating principle is analyzed only in continuous conduction mode (CCM) because high gain of the proposed converter is achieved in CCM (Zhang et al., 2013). So the proposed converter is analyzed in CCM mode. The detailed analysis is as follow (Choi et al., 2001).
Since the boost converter operate under CCM mode, the mathematical equation illustrating the relationship between the output and input voltage of the step-up Boost converter in steady-state mode is as following Equation (4).
where VPV and Vo are the input voltage and output voltage of the MPPT boost converter respectively; D is the duty cycle of the PWM signal. The Thevenin equivalent circuit of PV source connected with the MPPT boost converter is shown as in Figure 4A.
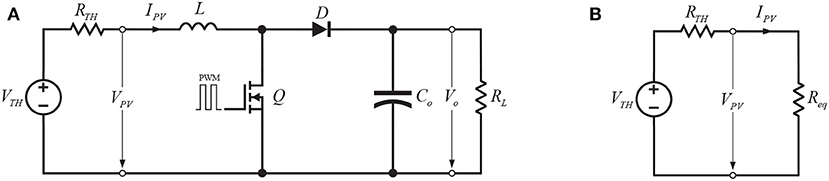
Figure 4. (A) PV source's equivalent Thevenin circuit with MPPT boost converter; (B) The equivalent impedance of MPPT boost converter in connected with PV source.
The output current of the PV source:
where Req is the equivalent resistance of the MPPT boost converter received from its input terminal. Assuming that the boost converter devices are optimal, this means the converter efficiency is 1. Hence,
Substitute Equation (5) into Equation (6), Req is achieved as:
The maximum power point tracking is achieved if the maximum power transfer theorem is satisfied. This happens when the input impedance of the MPPT boost converter Req is equal to the Thevenin source impedance RTH.
The power delivered by PV source can be easily determined from Figure 4B and described as follow:
The Figure 5 shows the association of PV output power and duty cycle (PPV − D curve) in the PV system with boost converter as power conditioner. As the Thevenin impedance RTH of the solar cell and the load resistance Req cannot be controlled, the equivalent input impedance of the MPPT circuit will be adjusted to obtain the maximum power transfer theorem. This activity will be carried out by changing the duty cycle D of the converter's controller in the MPPT control algorithm.
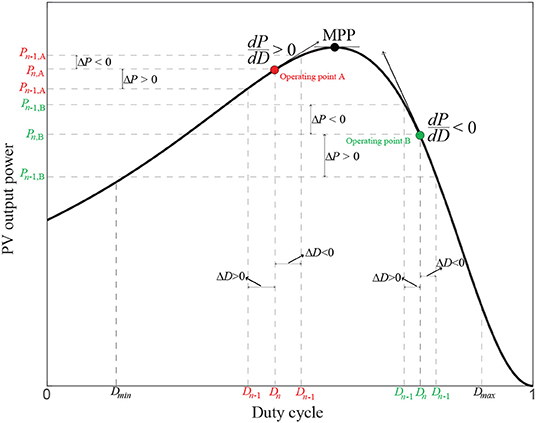
Figure 5. The relationship between PV power and the duty cycle of the MPPT boost converter.
2.4. Proposed MPPT Algorithm
From Figure 5 which describes the variation of PV power PPV following the change of duty cycle D of the MPPT boost converter, an MPPT control algorithm based on duty cycle perturbation is proposed for rapid responding with the ambient condition's variation on the PV array. In this proposed method, the duty cycle is varied according to perturbation power and operating point oscillating around the MPP and can be expressed as follows: The tracking process is outset with an initial duty cycle. Although the duty cycle D is a continuous variable from zero to unity, the initial duty cycle will be chosen in an interval [Dmin, Dmax] where Dmin > 0 and Dintial could be on the left or right side of the maximum power point. However, to prevent high peak current, Dinitial should be chosen on the left side of the maximum power point. In the first step, the PV current IPV[n] and voltage VPV[n] are periodically measured and computed PPV[n]. At stage two, the existing PV power PPV[n] and MPPT controller's duty cycle D[n] (operating points A or B) are compared with the these values calculated in previous measurement, PPV[n − 1] and D[n − 1], respectively. The change of PV power and the MPPT controller's duty cycle are ΔPPV = PPV[n] − PPV[n − 1] and ΔD = D[n] − D[n − 1], respectively. After processing the previous and the current information of these parameters, the controller decides whether to increase or decrease the duty cycle D depending on the location of the operating point. As can be seen from Figure 5, in case the MPPT controller is at the operating point A, which is in the left side of the MPP, the differences of power (ΔPPV) and duty cycle (ΔD) are same sign, it means that , the next period duty cycle D[n + 1] will be upgraded by adding a value of Dstep, D[n + 1] = D[n] + Dstep. By that way, the operating point will move toward the MPP from the left side as in Figure 5. On the contrary, if the MPPT controller is at the operating point B, which is in the right side of the MPP, ΔPPV and ΔD are opposite sign, that means , a reduction in the next duty cycle is taken by subtracting a value of Dstep, D[n + 1] = D[n] − Dstep. This tracking process reiterates itself until the peak power point is reached. The flowchart of the proposed MPPT algorithm is illustrated in Figure 6. Obviously, in this algorithm, the duty cycle D is directly used as the control parameter and only one control cycle is needed so that the complexity of controller is significantly decreased.
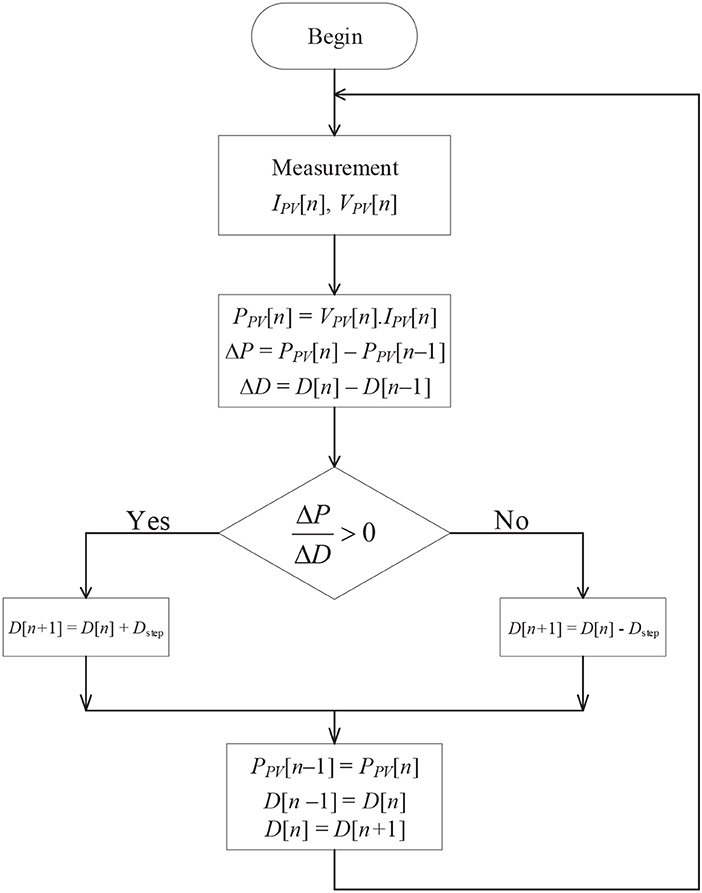
Figure 6. The flowchart for the proposed MPPT algorithm.
3. Extraction of the MPP Using P&O and Proposed Algorithm
The P&O (Perturb and Observe) approach has been the most widely used and briefly illustrated as in Figure S5 in Supplementary Material (Wu et al., 2003). This method operation is based on the detection of the operating point on the I-V characteristics of the PV array and comparing it with the previous iteration. The controller calculates the PV's output power P[n] = V[n] × I[n] at the moment n and compares the P[n], V[n] values with the previous ones P[n − 1], V[n − 1] at time n − 1, and do the action of tracking the MPP by adjusting the duty cycle D of the DC-DC boost converter. If the perturbation of voltage and power have an opposite sign, the next duty cycle D perturbation will be positive and vice versa.
In this paper, the MPPT performance of the conventional P&O method is compared with the proposed algorithm.
4. Simulation Results
This session presents how the MPPT algorithms are implemented and evaluated by using MATLAB/SIMULINK®. The effectiveness and advantage of the proposed MPPT algorithm is verified by the way of simulation results.
The simulation provides the valuable opportunity to evaluate various MPPT techniques presented previously and analyze their behavior under the exact same operating conditions. The main focus will be on the fast determination for MPP.
The simulation shows a comparison of the output powers in the PV system in which two different MPPT algorithms are employed, namely P&O and proposed MPPT algorithm.
The PV system is configured to 100kW output with 64.2 V open-circuit voltage and consists of 66 strings of 5 series connected 305.2 W modules connected in parallel (66 × 5 × 305.2W = 100.7kW). The detailed simulation conditions and configuration are summarized in Table 1. The solar irradiation is programmed to change rapidly or gradually. One case is that the rapidly changing of solar irradiation will be represented as shown in Figure 7A. This kind of rapidly changing of irradiation could be caused by established, rapid moving cloud cover. Another case is designed to verify tracking performance with gradually changing of solar irradiation, which is illustrated by waveform shown in Figure 7B.
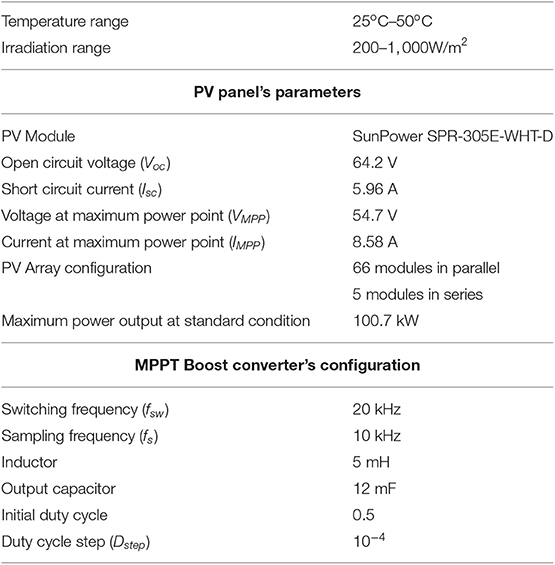
Table 1. Table of simulation conditions.
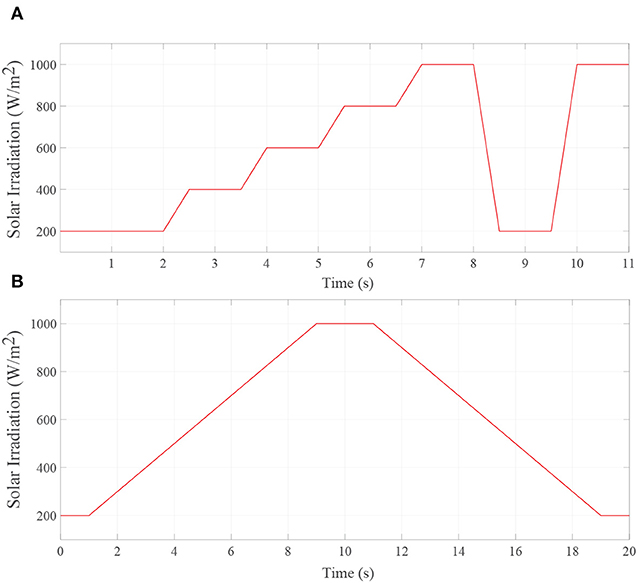
Figure 7. Simulated signal waveform of (A) the rapid change of solar irradiation; and (B) the slow change of solar irradiation.
4.1. Simulation Results for Fixed Temperature and Rapid Change of Solar Irradiation
In this case, the performance of the P&O algorithm and proposed algorithm is compared at fixed temperature values (25oC or 50oC). The rapid changes of solar irradiation are considered in three different conditions. As illustrated in Figure 7A, in the beginning, the solar irradiation increases dramatically in a sequence of 0.5 s ramp functions during 5 s from 200W/m2 at t = 2 s to 1, 000W/m2 at t = 7 s with the size of each ramp step is 200W/m2. Next, the higher slope ramp function for the solar irradiation rapid increase is introduced from 200W/m2 at t = 9.5 s up to 1, 000W/m2 at t = 10 s. In the last condition, the PV system experiences a rapid fall of solar irradiation in a half of second from 1, 000W/m2 at t = 8 s down to 200 W/m2 at t = 8.5 s.
From Figure 8, in term of the PV system output power, the simulation results are basically consistent with the output characteristics of PV panel and they are proportional with the solar irradiation. As can be seen from the results, in the same conditions, during the period of constant temperature (at 25oC and/or 50oC) and stable or rapidly declined solar irradiation, the performances of the MPPT systems using two different algorithms are approximately the same when the MPP can be tracked with both algorithms. However, in the case of the PV system experiences a rapid increase of solar irradiation, while the proposed MPPT tracker is able to response and track excellently to the MPP, the P&O algorithm is exhibiting a very poor dynamic tracking performance for the considered solar irradiation change until it remains stable.
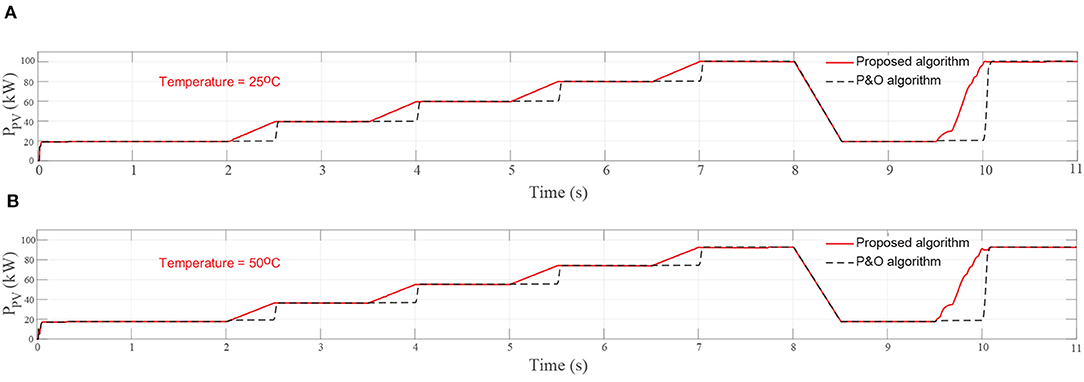
Figure 8. Simulation results for rapid change of solar irradiation and fixed temperature at (A) 25oC and (B) at 50oC.
4.2. Simulation Results for Temperature Change and Rapid Change of Solar Irradiation
In this case, the rapid change of solar irradiation in section 4.1 still be considered. In reality, PV cell's temperature changes extremely slowly. Therefore, gradual changes of temperature are introduced in two different conditions. In the first condition, the temperature increases gradually in a period of 9.5 s, from 25oC at t = 1 s to 40oC at t = 10.5 s as shown in Figure 9A. The simulation result in this case is shown in Figure 9B. Another condition is that the temperature decreases gradually from 50oC at t = 1 s to 25oC at t = 10.5 s, shown in Figures 9C,D presents the simulation result for this condition.
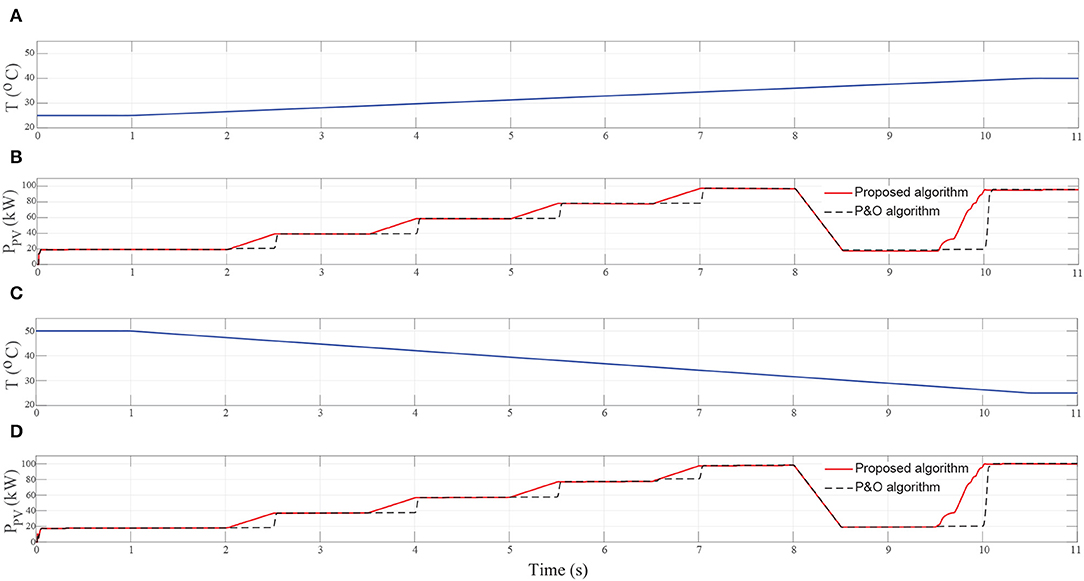
Figure 9. Simulation results for rapid change of solar irradiation and slow change of temperature. (A) Temperature increases gradually. (B) The simulation result in case temperature increases. (C) Temperature decreases gradually. (D) The simulation result in case temperature decreases.
From Figures 9B,D, it is obvious that at fixed or rapidly decreased solar irradiation conditions while the temperature is slowly changing, the simulation results for both P&O and proposed algorithms are closely the same and demonstrate good performances when the MPPT controller can follow the irradiation very fast. Nevertheless, when the solar irradiation is increasing rapidly, the proposed algorithm shows much better performance and achieves MPP extremely faster than the P&O algorithm. The proposed algorithm responds to solar irradiation change instantaneously and PV output power is always proportional with the solar irradiation. In the meantime, P&O algorithm is confused by sudden change of solar irradiation and give wrong control signals.
The simulation results in sections 4.1 and 4.2 show that when P&O algorithm is applied, the rapid increase of solar irradiation will lead to a large ratio of output power fluctuation and the time duration in which the power variation happens (ΔP/Δt), compared with significantly smaller one in proposed algorithm, as can be seen in Figure 10. This is also an advantage of proposed method based on Thevenin approach that is not considered in previous studies.
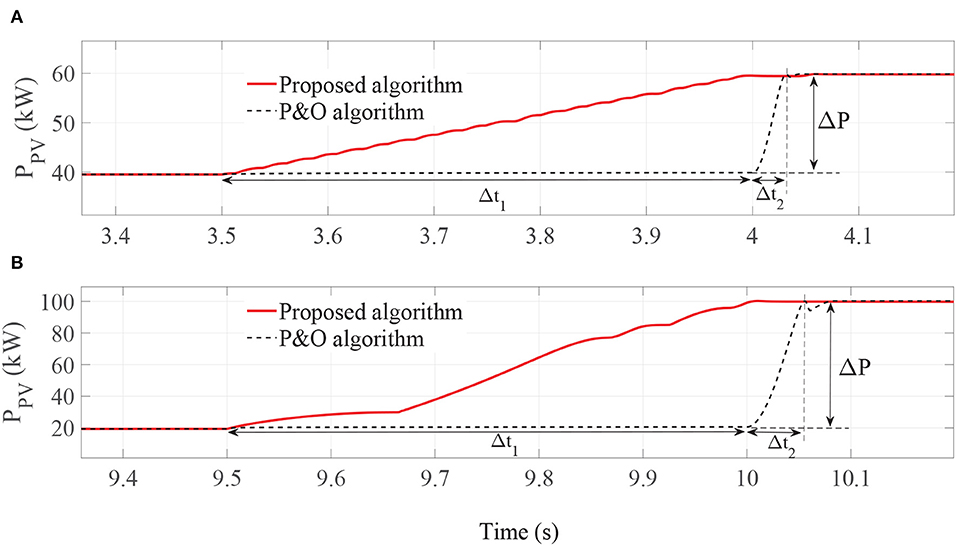
Figure 10. PV output power responses when solar irradiation increase rapidly. (A) from 400W/m2 to 600W/m2. (B) from 200W/m2 to 1000W/m2.
4.3. Simulation Results for Fixed Temperature and Slow Change of Solar Irradiation
In this case, the solar irradiation increases gradually from 200W/m2 to 1, 000W/m2 and vice versa in two 8 s periods, while keeping temperature constant at 25oC or 50oC. As illustrated in Figure 7B, the solar irradiation increases from 200W/m2 at t = 1 s up to 1, 000W/m2 at t = 9 s and changes in the opposite direction between t = 11 s and t = 19s.
The results are showed in Figure 11. In this case, we see that both controllers show almost similar good performance.
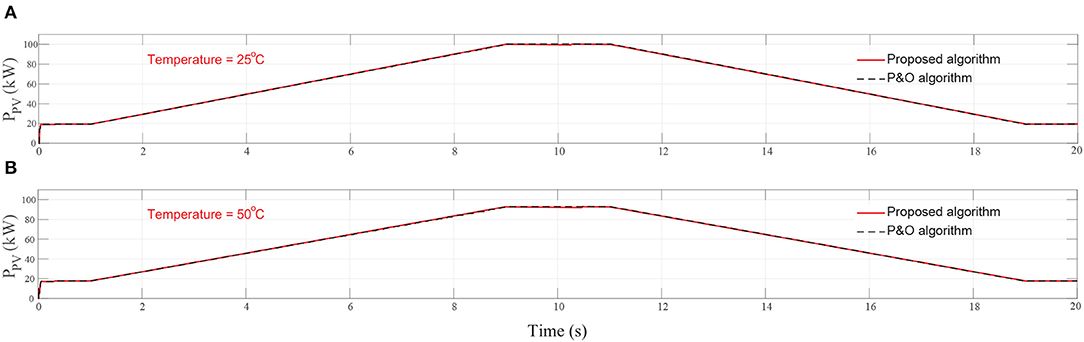
Figure 11. Simulation results for slow change of solar irradiation and fixed temperature at (A) 25oC and (B) at 50oC.
Overall, the average power and energy harvested from the PV system employing P&O and proposed algorithm is shown in Table 2. It is shown that the PV system using proposed method collects much larger energy than that when P&O method is applied.
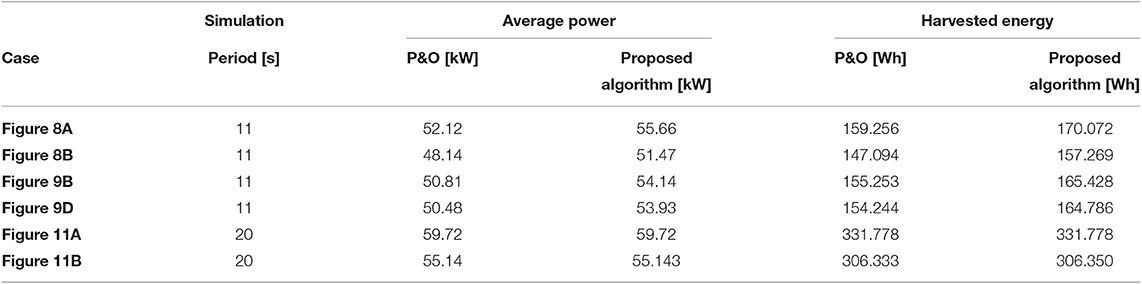
Table 2. Average power and harvested energy from PV system under considered conditions using P&O and proposed algorithm.
5. Experimental Results
In order to verify the MPP tracking speed and tracking accuracy of the proposed algorithm, a hardware evaluation prototype was installed. The PV system is configured to 44 W output with two PV panels SV-22W connected in parallel. A 50W DC-DC boost converter used as the interface to maximized the output power of the PV array is implemented to verify the feasibility of the proposed control algorithms. The specifications of the boost converter are listed in Table 3. The processor that is used in this study is STM32103C8T6. The operating point of the PV array's PPV − VPV curve was controlled by adjusting the duty cycle of the PWM signal. Meanwhile, the output voltage VPV and output current IPV of the PV array were measured with the measurement circuits.

Table 3. Specifications of the MPPT DC-DC boost converter.
Figure 12 shows the experimental results of the two identical MPPT boost converters operating under the same ambient conditions. These figures compares the PV output power with respect to two MPPT algorithms, P&O algorithm and proposed one. The experiment was implemented within a period of 3,600 s. At the time of the experiment, the temperature of the PV panels is about 51.6oC. The square waveform of solar radiation is created by artificial method using covers on solar panels. Solar irradiation was decreased rapidly by covering the PV panels with a cover plate in a very short time, and it was increased dramatically by uncovering the PV panels again.
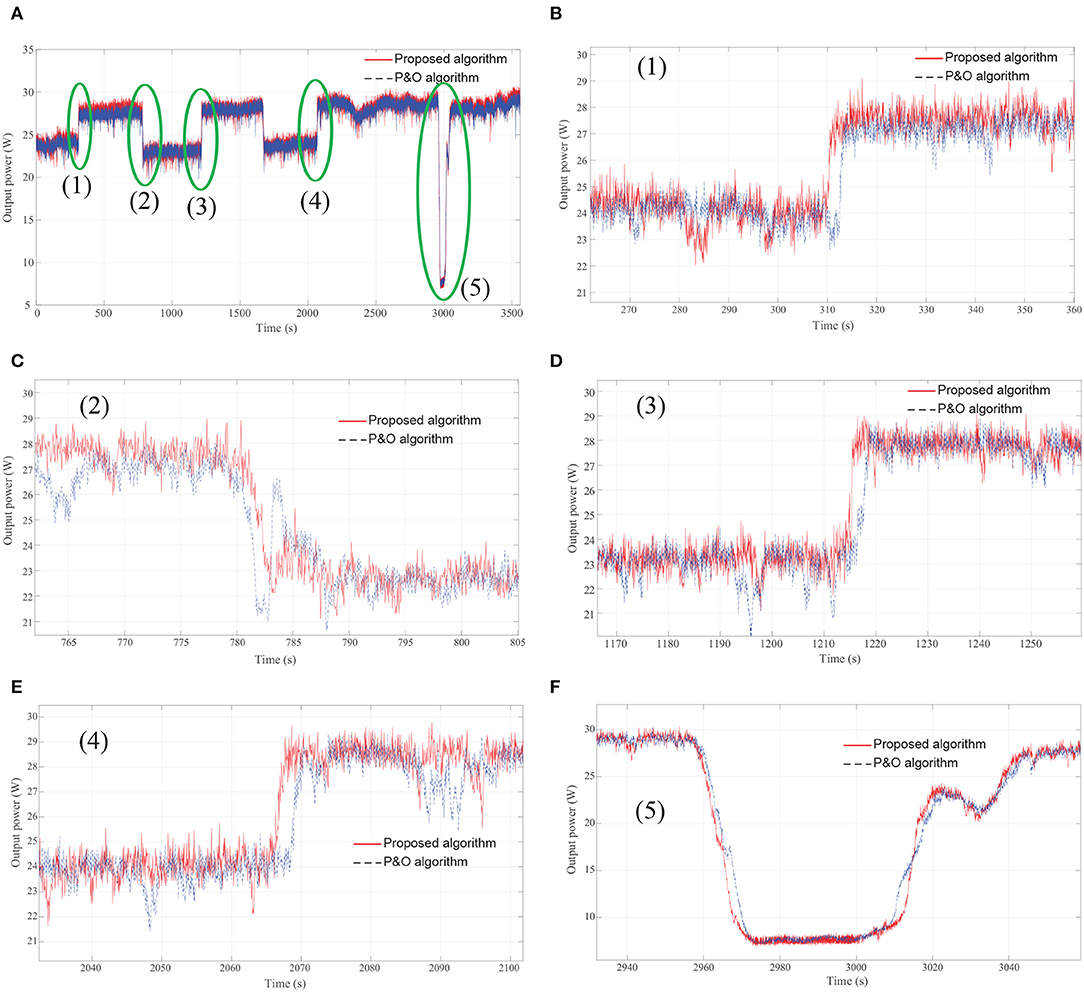
Figure 12. (A) Experimental results; (B) Solar irradiation increases rapidly at t = 310 s; (C) Solar irradiation decreases rapidly at t = 780 s; (D) Solar irradiation increases rapidly at t = 1215 s; (E) Solar irradiation increases rapidly at t = 2066 s; (F) Slow changes of solar irradiation.
Overall, in case of the rapid changes of solar irradiation, the results from experiment provide an outstanding performance of proposed algorithm compared to P&O when the output power of a PV panel using proposed algorithm is much more than those using P&O. Whereas, with the stable or slow change solar irradiation, there is approximately equivalent performance between both of algorithms. Hence, the experimental results verified the simulated one mentioned above.
6. Conclusion
In this paper, an algorithm for maximum power point tracking controller in solar energy source system is introduced by deriving the Thevenin equivalent model of the PV panel and the boost converter operating under CCM mode is selected as the circuit configuration of the MPPT. Maximum power point tracking model has been developed in a simulation setup using MATLAB/SIMULINK®. The conventional MPPT P&O algorithm is considered and compared with this proposed one, and their simulation results are shown. With the same switching frequency, sampling frequency and duty cycle step, the convergence speeds of conventional MPPT algorithms as well as proposed algorithms are the same as the PV panels operate at identical ambient condition. However, when the ambient conditions change, different MPPT algorithms will show different convergence speeds to the MPP in spite of identical operating parameters. In all considered simulation conditions, the MPPT controller's operation primarily dependent on solar irradiation, while the effect of temperature is negligible in the case of fixed or slowly change temperature. The proposed algorithm can track the MPP in all considered cases.
In order to perform proposed control algorithms, the 32-bit microcontroller STM32F103C8T6 from STMicroelectronics is employed. A practical 50W DC-DC Boost converter prototype is implemented to demonstrate the improvement of tracking power. Experimental results show that the PV output power is significantly improved.
The proposed algorithm improves dynamic performance as well as the efficiency of the photovoltaic system, especially in the microgrids operating in stand-alone mode. It is well-known that microgrid has high capability for renewable energies integration such as wind and solar energies. When the microgrids is operated in stand-alone mode, the large power fluctuation ΔP within a short time duration has negative impacts on the microgrids frequency stability. By applying the proposed MPPT algorithm, when the solar irradiation change rapidly, the ratio of power variation and the duration of power change (ΔP/Δt) is much smaller than that when the P&O algorithm is employed. Therefore, the proposed methods help to minimize the grid frequency effects and enhance the solar energy penetration into the microgrids. As a result, the proposed algorithm can be applied in practice instead of the conventional MPPT techniques for any ambient condition and the analysis in this paper should be useful for MPPT users, designers, and commercial PV manufacturers.
Data Availability Statement
The raw data supporting the conclusions of this article will be made available by the authors, without undue reservation, to any qualified researcher.
Author Contributions
All authors listed have made a substantial, direct and intellectual contribution to the work, and approved it for publication.
Funding
This research was funded by Ministerial Program of Science and Technology Researching and development of hybrid energy system combining biogas–solar suitable for rural areas in Vietnam under project number CTB2018-DNA03 and by the Ministry of Education and Training under project number B2019-DNA-11.
Conflict of Interest
The authors declare that the research was conducted in the absence of any commercial or financial relationships that could be construed as a potential conflict of interest.
Supplementary Material
The Supplementary Material for this article can be found online at: https://www.frontiersin.org/articles/10.3389/fenrg.2020.00014/full#supplementary-material
References
Allouache1, H., Zegaoui, A., Boutoubat, M., Bokhtache1, A. A., Kessaissia1, F. Z., Charles, J.-P., et al. (2018). “Distributed photovoltaic architecture powering a dc bus: impact of duty cycle and load variations on the efficiency of the generator,” in AIP Conference (Beirut). doi: 10.1063/1.5039193
Batushansky, Z., and Kuperman, A. (2010). “Thevenin-based approach to pv arrays maximum power prediction,” in 2010 IEEE 26-th Convention of Electrical and Electronics Engineers in Israel (Eliat), 598–602. doi: 10.1109/EEEI.2010.5662149
Chatterjee, A., and Keyhani, A. (2011). “Thevenin's equivalent of photovoltaic source models for mppt and power grid studies,” in 2011 IEEE Power and Energy Society General Meeting (Detroit, MI), 1–7. doi: 10.1109/PES.2011.6039203
Choi, B., Hong, S. S., and Park, H. (2001). Modeling and small-signal analysis of controlled on-time boost power-factor-correction circuit. IEEE Trans. Indust. Electron. 48, 136–142. doi: 10.1109/41.904573
Delille, G., Francois, B., and Malarange, G. (2012). Dynamic frequency control support by energy storage to reduce the impact of wind and solar generation on isolated power system's inertia. IEEE Transact. Sustain. Energy 3, 931–939. doi: 10.1109/TSTE.2012.2205025
Duong, Q., Leva, S., Mussetta, M., and Le, K. (2018). A comparative study on controllers for improving transient stability of dfig wind turbines during large disturbances. Energies 11:480. doi: 10.3390/en11030480
Esram, T., and Chapman, P. L. (2007). Comparison of photovoltaic array maximum power point tracking techniques. IEEE Transact. Energy Convers. 22, 439–449. doi: 10.1109/TEC.2006.874230
Farahat, M., Metwally, H., and Mohamed, A. (2012). Optimal choice and design of different topologies of dc-dc converter used in pv systems, at different climatic conditions in egypt. Renew. Energy 43, 393–402. doi: 10.1016/j.renene.2011.10.021
Femia, N., Granozio, D., Petrone, G., Spagnuolo, G., and Vitelli, M. (2006). Optimized one-cycle control in photovoltaic grid connected applications. IEEE Trans. Aerospace Electr. Syst. 42, 954–972. doi: 10.1109/TAES.2006.248205
Hohm, D. P., and Ropp, M. E. (2000). “Comparative study of maximum power point tracking algorithms using an experimental, programmable, maximum power point tracking test bed,” in Conference Record of the Twenty-Eighth IEEE Photovoltaic Specialists Conference - 2000 (Cat. No.00CH37036) (Anchorage, AK), 1699–1702.
Hua, C., and Shen, C. (1998). “Comparative study of peak power tracking techniques for solar storage system,” in APEC '98 Thirteenth Annual Applied Power Electronics Conference and Exposition (Anaheim, CA), 679–685.
Huang, Y.-P., Ye, C.-E., and Chen, X. (2018). A modified firefly algorithm with rapid response maximum power point tracking for photovoltaic systems under partial shading conditions. Energies 11:2284. doi: 10.3390/en11092284
Hussein, K. H., Muta, I., Hoshino, T., and Osakada, M. (1995). Maximum photovoltaic power tracking: an algorithm for rapidly changing atmospheric conditions. IEE Proc. Generat. Trans. Distrib. 142, 59–64. doi: 10.1049/ip-gtd:19951577
Lam, Q. L., Antoneta, I. B., and Delphine, R. (2016). “Frequency robust control in stand-alone microgrids with pv sources : Design and sensitivity analysis,” in Symposium de Genie Electrique (SGE 2016): EF-EPF-MGE 2016 (Grenobe).
Leva, S., and Zaninelli, D. (2006). Technical and financial analysis for hybrid photovoltaic power generation systems. WSEAS Trans. Power Syst. 5, 831–838.
Norouzzadeh, E., Ale Ahmd, A., Saeedian, M., Eini, G., and Pouresmaeil, E. (2019). Design and implementation of a new algorithm for enhancing mppt performance in solar cells. Energies 12:519. doi: 10.3390/en12030519
Patangia, H., Gourisetti, S. G., Siddiqui, A., and Sharma, S. (2010). “A simplified pv model for low power mppt controller design,” 2010 IEEE Asia Pacific Conference on Circuits and Systems, Kuala Lumpur (Kuala Lumpur), 680–683. doi: 10.1109/APCCAS.2010.5774873
Rai, A., Awasthi, B., Singh, S., and Dwivedi, C. (2016). A review of maximum power point tracking techniques for photovoltaic system. Int. J. Eng. Res. 5, 539–545. doi: 10.17950/ijer/v5s6/625
Ram, J. P., Babu, T. S., and Rajasekar, N. (2017). A comprehensive review on solar pv maximum power point tracking techniques. Renew. Sustain. Energy Reviews 67, 826–847. doi: 10.1016/j.rser.2016.09.076
Schaefer, J. C. (1990). Review of photovoltaic power plant performance and economics. IEEE Trans. Energy Convers. 5, 232–238.
Subudhi, B., and Pradhan, R. (2013). A comparative study on maximum power point tracking techniques for photovoltaic power systems. IEEE Trans. Sustain. Energy 4, 89–98. doi: 10.1109/TSTE.2012.2202294
Turhan, M., Dai, B., and Yildirim, D. (2013). “Analytical mppt solution using thevenin approach for solar panels,” in Eurocon 2013 (Zagreb), 803–808.
Wu, W., Pongratananukul, N., Qiu, W., Rustom, K., Kasparis, T., and Batarseh, I. (2003). “Dsp-based multiple peak power tracking for expandable power system,” in Eighteenth Annual IEEE Applied Power Electronics Conference and Exposition, 2003. APEC '03 (Miami Beach, FL), 525–530.
Yousri, D., Babu, T. S., Allam, D., Ramachandaramurthy, V. K., Beshr, E., and Eteiba, M. B. (2018). Fractional chaos maps with flower pollination algorithm for partial shading mitigation of photovoltaic systems. Energies 12:3548. doi: 10.3390/en12183548
Yousri, D., Babu, T. S., Allam, D., Ramachandaramurthy, V. K., and Eteiba, M. B. (2019). A novel chaotic flower pollination algorithm for global maximum power point tracking for photovoltaic system under partial shading conditions. IEEE Acsess. 7, 1214–121445. doi: 10.1109/ACCESS.2019.2937600
Zhang, W., Zhang, W., Yang, J., and Al-Naemi, F. (2013). Comparisons between crm and ccm pfc. Energy Power Eng. 5, 864–868. doi: 10.4236/epe.2013.54B165
Keywords: renewable energy source, photovoltaic (PV), maximum power point tracking (MPPT), perturbation and observation method (P&O), thevenin equivalent circuit
Citation: Nguyen BN, Nguyen VT, Duong MQ, Le KH, Nguyen HH and Doan AT (2020) Propose a MPPT Algorithm Based on Thevenin Equivalent Circuit for Improving Photovoltaic System Operation. Front. Energy Res. 8:14. doi: 10.3389/fenrg.2020.00014
Received: 03 June 2019; Accepted: 23 January 2020;
Published: 18 February 2020.
Edited by:
G. M. Shafiullah, Murdoch University, AustraliaReviewed by:
Henry Schriemer, University of Ottawa, CanadaSudhakar Babu Thanikanti, Universiti Tenaga Nasional, Malaysia
Copyright © 2020 Nguyen, Nguyen, Duong, Le, Nguyen and Doan. This is an open-access article distributed under the terms of the Creative Commons Attribution License (CC BY). The use, distribution or reproduction in other forums is permitted, provided the original author(s) and the copyright owner(s) are credited and that the original publication in this journal is cited, in accordance with accepted academic practice. No use, distribution or reproduction is permitted which does not comply with these terms.
*Correspondence: Van Tan Nguyen, dGFuNzhkaGJrQGR1dC51ZG4udm4=; Minh Quan Duong, ZG1xdWFuQGR1dC51ZG4udm4=