 Simon Roussanaly
 Jabir A. Ouassou1
 Rahul Anantharaman
 Martin Haaf
- 1SINTEF Energy Research, Trondheim, Norway
- 2Department of Mechanical Engineering, Institute for Energy Systems and Technology, Technische Universität Darmstadt, Darmstadt, Germany
Uncertainties are an inherent and important element of novel systems with limited large-scale industrial experience and must be taken into account in order to enable the design of cost-efficient energy systems. This paper investigates the optimal design of carbon capture and storage from a waste-to-energy plant under uncertainties. With the aim of providing a better understanding of the impact of uncertainties on the design and cost of CCS chains, as well as the capture technology selection, the case of a hypothetical 40 MW waste-to-energy plant located in Norway is considered. The impact of key technical and cost uncertainties on the cost of different CO2 capture and CCS chain options are investigated using an in-house techno-economic CCS assessment tool combined with an uncertainty quantification framework. When the different capture options are compared on a deterministic basis, the advanced amine yields the best performances (CO2 avoidance cost of 153 €/tCO2, avoided), followed by the membrane process based on partial capture (200 €/tCO2, avoided) and MEA-based capture (217 €/tCO2, avoided). However, in contrast with the advanced amine, the partial capture considered in the membrane process does not enable net negative CO2 emissions. Once technical and cost uncertainties are taken into account, the advanced amine-based capture remains the best option, however the MEA-based capture outperform the membrane process. Finally, the stochastic optimization showed that the uncertainties considered do not impact the optimal capture capacity in this case. The full CCS chain perspective is then included through two chain options: a nearby offshore saline aquifer or an offshore CO2 EOR storage located further away. The EOR-based chain leads to the best performances (187 vs. 202 €/tCO2, avoided) both on a deterministic basis and when different uncertainty scenarios are considered. However, as a shared transport and storage infrastructure is considered, uncertainty regarding the amount of CO2 coming from nearby industries leads to a different optimal design of the chain (pipeline diameter and ship capacity). Finally, uncertainties on the EOR response to CO2 injection can significantly reduce the potential of the CO2 EOR-based chain and lead to cases in which the saline aquifer-based chain would be optimal.
Introduction
The International Energy Agency forecasts that Carbon Capture and Storage (CCS) will contribute to 14% of the reduction in anthropogenic CO2 emissions in the 2 Degree Scenario (2DS) (IEA, 2016). CCS is a key measure to enable decarbonization of non-power related industrial emitters such as cement plants, refineries, metal production, etc. (IEAGHG, 2017, 2018; Gardarsdottir et al., 2019). In several of these cases, CO2 is a by-product of the production process, which makes it difficult to reach the required deep decarbonization of the industrial sector without CCS. Additionally, CCS from biogenic sources, such as waste-to-energy, is foreseen as a critical pathway to limit the global warming to 1.5°C above pre-industrial levels (IPCC, 2018), as specified in the Paris Agreement.
Two of the main barriers to the implementation of CCS are the current high cost and uncertainties. The CO2 capture section is the largest contributor to the cost of CCS, compared to the cost of transport and storage. Solvents such as monoethanol amine (MEA), considered to be the most mature CO2 capture technology are still in the demonstration phase. Novel capture technologies (advanced solvent, membrane, low-temperature, absorption, calcium looping) that show potential for cost reduction are at a lower technology readiness level (TRL) (Boot-Handford et al., 2014). There is always some uncertainty in certain parameters when designing these separation processes—related to physical properties, performance or cost. The lower the TRL of a process the greater the uncertainty associated with its performance due to insufficient testing at the different scales required. Choosing a particular capture technology for an application without considering the uncertainties related to their respective levels of development can lead to misleading conclusions and financial risks.
The CCS value chain is a complex system consisting of one or more emission sources with CO2 capture and conditioning at each capture location. These feed into a CO2 transport infrastructure that includes a pipeline network and/or ships for transport leading to possibly multiple locations for CO2 storage or EOR in saline aquifers, depleted gas or oil fields, etc. Even the simplest CCS value chain with one emission source with CO2 capture, conditioning, pipeline transport, and storage in a saline aquifer is a complex system that may involve several operators along the chain. The uncertainties in a system increase with its complexity. Thus, considering uncertainties when designing CCS chains is critical.
Uncertainties are an inherent and important element of novel systems with limited large-scale industrial experience and must be taken into account in order to enable the design of cost-efficient energy systems (Rubin, 2012). Uncertainty is not a well-defined concept. One aspect of uncertainty is its use to identify that there is a probability that some assumptions made during design and modeling are incorrect. Another aspect is related to external risks where the presence of entirely unknown facts that might have a bearing on the future state of the system. Uncertainties throughout the CCS value chain include technology, engineering performance, economics, policy, and market forces.
Uncertainties have typically been taken into account in many studies via simple, single-parameter sensitivity analyses to understand the impact of a given parameter on the overall cost and identify the most critical parameters. However, more complex approaches such as uncertainty quantification approaches can be used to understand the impact of underlying uncertainties on the overall costs of a CCS chain, as well as to enable better design at the chain level. These approaches present several advantages compared to sensitivity analyses. First, it enables the integration of several uncertainties simultaneously to take into account synergies and canceling effects, which cannot be taken into account through simple sensitivity analyses. For example, having strong uncertainties on both membrane properties (permeance and selectivity) and membrane cost can have a very strong impact on the performance of a membrane-based CCS chain. Secondly, such approaches provide a cost performance probability, instead of a single fixed value, which provides a stronger understanding of the performance probability of a given chain and its associated financial risk. For instance, a given CCS chain might be preferred due to low uncertainty in its cost despite being more expensive. Uncertainty quantification has been used earlier in the field of CCS to identify the effect of uncertainties of capture processes from technical and economic perspectives (Rao and Rubin, 2002; Nord et al., 2010; Hanak et al., 2016; Raksajati et al., 2018). An extensive approach to study the effect of various uncertainties, discussed above, in CCS chains has not yet been undertaken.
In this paper, we investigate the optimal design of a CCS chain from a Waste-to-Energy (WtE) plant under uncertainty. The uncertainties will be applied in a layered stepwise approach to better understand their impact on the capture, as well as a simple and a more complex CCS chain. The emphasis of this work is to provide a better understanding of the impact of uncertainties on the design of CCS chains and capture technology selection. In order to do so, the impact of key technical and cost uncertainties on the cost of different CO2 capture and CCS chain options are investigated using an in-house techno-economic CCS assessment tool (Jakobsen et al., 2014, 2017) combined with an uncertainty quantification framework.
This paper is structured as follow. First, the case study including the CCS chain options is presented. The methodology adopted in this study is then presented. The results are split into two sections. The first looks at the WtE plant with only CO2 capture and conditioning, while the full CCS chain perspective is considered in the second. Finally, key findings are provided in the conclusion section.
Case Study
This section introduces the waste-to-energy plant considered for the analysis. The three CO2 capture options for post-combustion capture included, and different CCS transportation and storage options in the CCS chain investigated in the study are also presented.
Waste-to-Energy Plant
With the potential implementation of CCS on the Klemenstrud waste-to-energy plant as part of the Norwegian full-scale CCS project (Ministry of Petroleum and Energy, 2016), interest in retrofitting CCS on waste-to-energy has been rising in Europe, especially in Norway and Netherlands (Ministry of Petroleum and Energy, 2016; Stuen, 2019).
In the present study, a hypothetical waste-to-energy plant able to process 70 t/h of municipal solid waste (MSW) and resulting in an installed power production capacity (without CCS) of 40 MWe is considered. The MSW characteristics considered in this study (Haaf et al., under review), as well as the typical origins of MSW (Vainikka et al., 2012) are presented in Table 1. The plant emits a flue gas containing 10% CO2 leading to, on average1, 502 kt of CO2 (biogenic and non-biogenic) released to the atmosphere every year (Haaf et al., under review). The CO2 emissions to the atmosphere associated with this power production are thus 1.684 tCO2/MWh, of which 65% are biogenic (Haaf et al., under review). Despite the CO2 concentration being lower than that of non-power industrial sources like cement or steel, CCS from a WtE plant offers several advantages. First, the plant produces steam that could be used for CO2 regeneration when using solvent-based CO2 capture. This compared positively with other industrial CO2 capture cases where the steam requirement is met with, for example, a natural gas boiler (Roussanaly et al., 2017). Furthermore, CCS from such a plant could be used to unlock negative emissions as nearly two-thirds of the plant emissions are biogenic in nature.
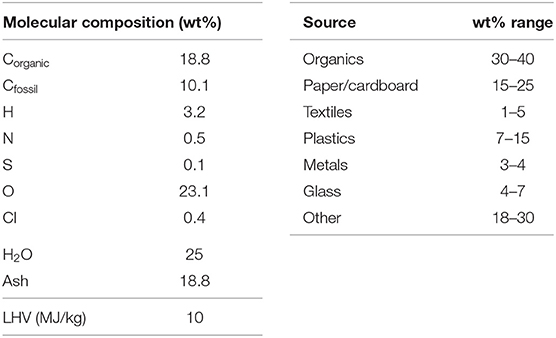
Table 1. (A) Key characteristics of the MSW considered in this study (Haaf et al., under review) and (B) typical origins of MSW (Vainikka et al., 2012).
In this work, the waste-to-energy plant is assumed to be located on the coast of the Bergen area (Norway), as shown in Figure 1. Two storage options are considered. The first option is an offshore saline aquifer, on the Norwegian continental shelf, located about 100 km from the WtE plant. The second option is CO2 storage associated with enhanced oil recovery (EOR) in a Norwegian reservoir located 250 km from the WtE plant. Although this storage option is located further away than the first one, the higher cost associated with transport could be offset by revenues associated with the value creation through CO2 EOR (Roussanaly and Grimstad, 2014). The foreseen locations of both storage options are shown in Figure 1.
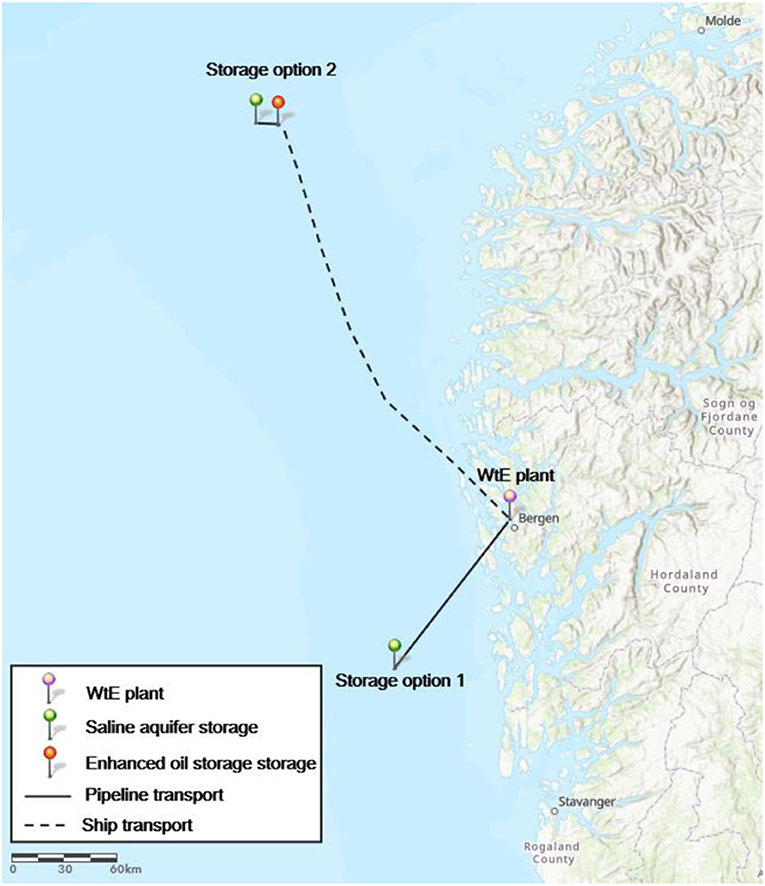
Figure 1. Locations of the waste-to-energy plant and potential storage sites.
CO2 Capture and CCS Chain Options
In order to better understand the potential of CCS from WtE plants, as well as the impact of uncertainties and fluctuations on its cost and design, five CCS “chain” options are considered. The three first focus solely on different CO2 capture options and thus only consider CO2 capture and conditioning from the WtE plant (i.e., CO2 transport and storage are not included in these CCS “chains”). These three chains are henceforth referred to as capture chains rather than CCS chains. The last two chains include CO2 capture, conditioning, transport and storage. The operations considered in each of the five CCS chains are illustrated in Figure 2.
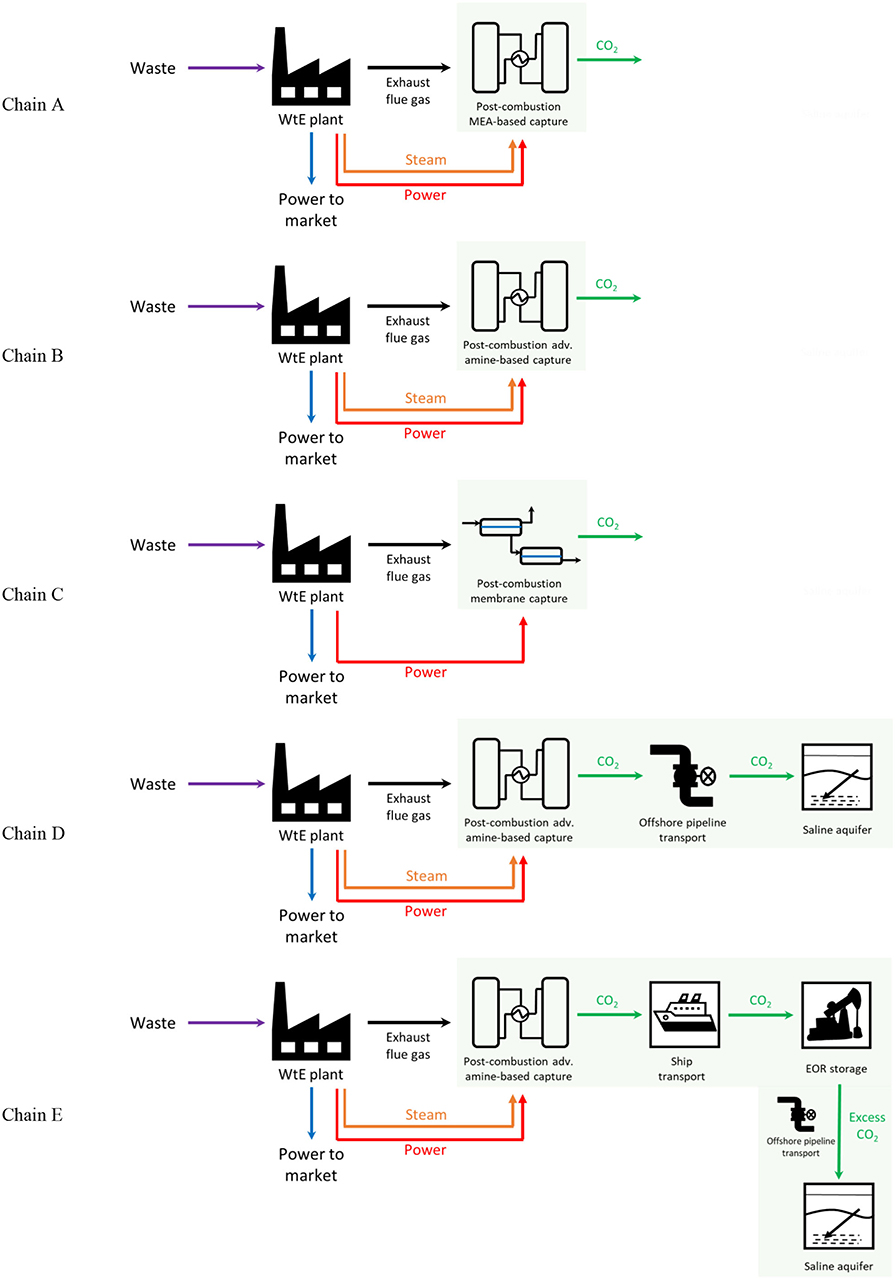
Figure 2. Operations considered in each of the five capture/CCS chains.
In the first capture chain, referred as chain A, the WtE plant is retrofitted with monoethanol amine-based (MEA) post-combustion CO2 capture. While MEA-based CO2 capture is not the most energy efficient CO2 capture technology option, it is one of the most mature and well-characterized CO2 capture technologies. It thus presents limited uncertainties (Morgan et al., 2015; Kuncheekanna et al., 2019).
The second capture chain, referred as chain B, investigates the cost reduction potential which would be achieved through an advanced amine. The amine is assumed to achieve a 20% reduction in steam consumption associated with CO2 regeneration and an overall investment cost increase of 10% (Adams et al., 2017; Roussanaly et al., 2019). Larger uncertainties compared to the MEA solvent case are expected in the advanced amine case.
The third capture chain, referred as chain C, considers the decarbonization of the WtE plant based on post-combustion CO2 capture membranes. While membrane-based CO2 capture from a flue gas with a CO2 content around 10% has been shown be less competitive than solvent-based technologies at high CO2 capture ratios, membranes with high performances have been shown to exhibit a stronger potential when partial capture is considered (Roussanaly et al., 2018). Here, an advanced membrane with a CO2/N2 selectivity of 75 and a CO2 permeance of 15 /(m2.h.bar) is considered. This membrane is based on expected material developments at NETL and is not currently available at implementation scale (Budhathoki et al., 2019).
The first full CCS chain, referred as chain D, considers CCS from the WtE plant with saline aquifer storage at the S1 location (see Figure 2). After an advanced amine-based capture and conditioning, the CO2 captured from the WtE plant is combined with 1 MtCO2/y coming from other nearby sources before being transported to the storage location. Based on the distance and volume involved, the most cost-efficient option to transport the CO2 to the storage location is via pipeline (Roussanaly et al., 2014).
Meanwhile, the second full CCS chain, referred as chain E, considers CCS from the WtE plant with CO2 EOR storage at the S2 location (see Figure 2). Like chain D, the capture process is based on the advanced amine-based capture and the emissions of the WtE plant are combined before transport and storage with 1 MtCO2/y coming from other nearby sources. While CO2 EOR enables revenues associated with the produced oil, a drawback of such storage option is that the amount of CO2 which can be injected for storage decreases over the years2. To ensure that the emissions of the WtE plant and the nearby plants are handled appropriately, the excess CO2 which cannot be stored in the oil reservoir is stored in a nearby saline aquifer located 10 km from the oil reservoir. Based on the distances and volumes considered, the most cost-efficient option to transport the CO2 from the capture site to the oil reservoir is via ship while the transport of CO2 from the oil reservoir to the saline aquifer is via pipeline (Roussanaly et al., 2014).
Finally, it is worth noting that unless otherwise specified, a 90% CO2 capture ratio (CCR) of the WtE plant's emissions is sought for all five CCS chain options.
Methodology
The following section describes the methodology adopted to evaluate the cost of CCS from the WtE plant with and without uncertainties. The CCS infrastructure is modeled using the iCCS3 tool developed by SINTEF Energy Research for integrated techno-economic modeling of CCS (Jakobsen et al., 2014, 2017). The iCCS tool is combined with an uncertainty quantification framework in order to understand the impact of uncertainties on cost and design as shown in Figure 3. For a specified set of uncertainties, the integration of the uncertainty framework with the iCCS tool enables the possibility to generate performance probability distributions, multi-parameter global sensitivity analyses, and optimal design of the CCS chains under uncertainties.
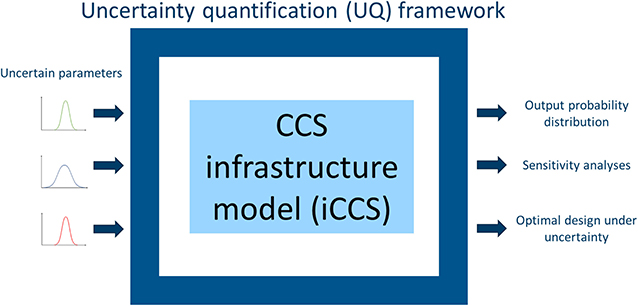
Figure 3. Framework for evaluation of CCS infrastructure under uncertainties.
WtE Plant and CCS Value Chain Modeling
The techno-economic performances of the WtE plant without CCS are considered to be known. The techno-economic modeling of the different CCS chain options are performed with the iCCS tool (Jakobsen et al., 2017). This tool is based on a flexible and modular approach in which each module is developed based on detailed technical and cost modeling. The different building blocks present in the library can be connected together to model the techno-economic performances of the targeted CCS value chain as illustrated in Jakobsen et al. (2017).
A summary of the content of each module and their technical and cost basis is available in Jakobsen et al. (2017). Details on the technical and cost basis of each of the modules of the iCCS tool can be found in previously published studies: post-combustion amine-based CO2 capture (Husebye et al., 2012; Roussanaly et al., 2013a), post-combustion membrane-based CO2 capture (Roussanaly et al., 2016, 2018; Roussanaly and Anantharaman, 2017), CO2 transport via pipeline or ship (Roussanaly et al., 2013b, 2014), CO2 storage in saline aquifer and EOR storage (Roussanaly and Grimstad, 2014). Key technical and cost aspects considered in the evaluation of each of the element of the WtE plant with the CCS chain are summarized in Table 2 in the context of the present study.
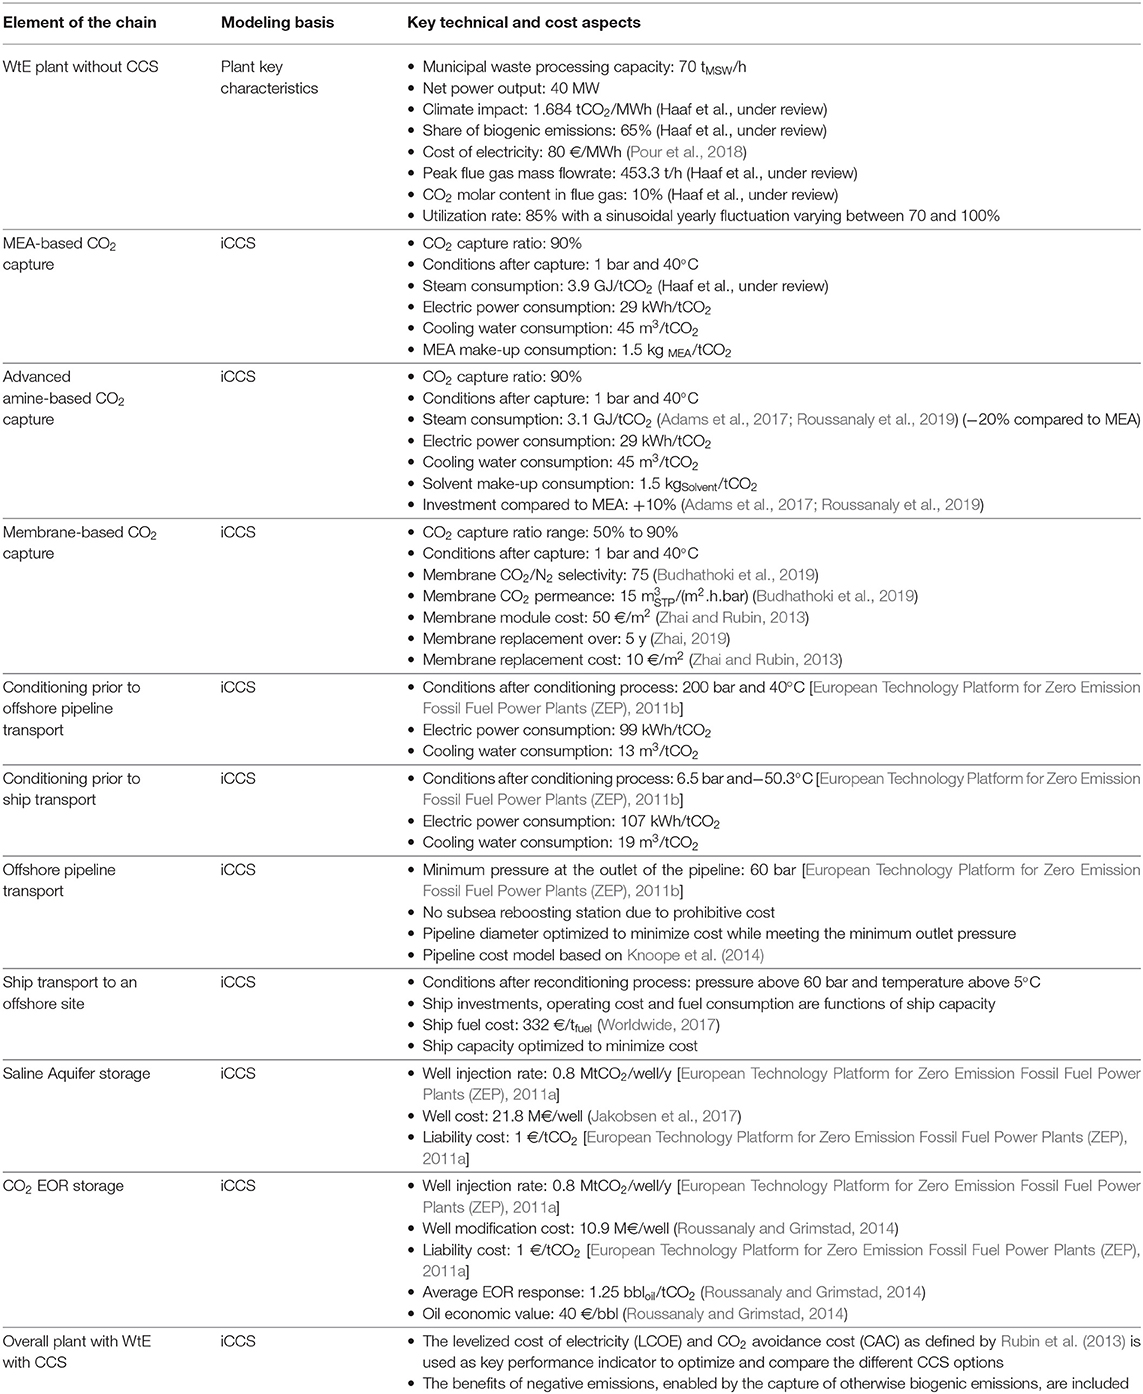
Table 2. Key technical and cost characteristics considered in the evaluation of each element of the WtE plant with CCS chain.
Monte Carlo Simulations Modeling
Many real-world processes can be modeled in the form of a simple input-output relationship y = f(x), where x = (x1, …, xn) describes all relevant inputs to the process, y = (y1, …, yn) describes all relevant outputs from the process, and the function f is the process model itself. For instance, in the case of MEA-based capture, the relevant input parameters x would include the flue gas concentration, the annual CO2 capture capacity and average volume, utility prices, etc.; while the relevant outputs would include the different utilities consumption, investment costs, and operating costs. The model f used to calculate these outputs can be implemented in many ways. Here, the iCCS tool is used to model each element of the chain where the relationships between the inputs and outputs are defined. These sets of models have been used in earlier work in a deterministic setting to evaluate the targeted outputs for the given set of inputs (Jakobsen et al., 2017), for sensitivity analyses (Roussanaly et al., 2013b), or for optimization purposes (Roussanaly and Anantharaman, 2017).
In this work, the CCS chain component models in iCCS are used for stochastic modeling with Monte Carlo simulation to take into account uncertainties in input data. Instead of assuming a given value for each input parameter xn, a probability distribution P(xn) is used to describe each uncertain parameter. The simulation program then picks random values for each input from these distributions, feeds them into the process model f, and collects the results obtained for the process outputs yn. After the simulation is complete, the results are used to estimate the probability distributions P(yn) for each output yn. Due to the large amount of cases to be evaluated, stochastic modeling requires significantly more time than deterministic modeling. However, such an approach is crucial when looking at ex-ante system such as carbon capture and storage, as it can be used to better understand the impact of uncertainties on design, cost, and comparison of options. The principle of a Monte Carlo modeling framework is illustrated in Figure 4.
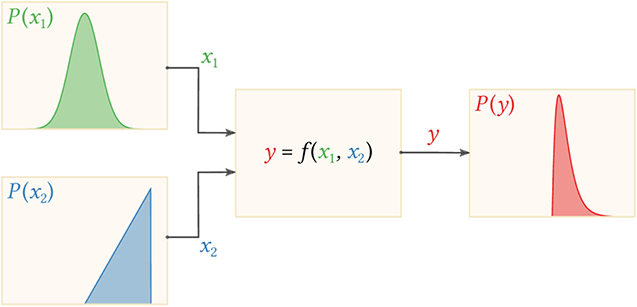
Figure 4. Illustration of the principle of a Monte Carlo modeling framework. Random values for the inputs x1 and x2 are sampled from their probability distributions P(xn), the model f is evaluated for each random value and used to estimate the output distribution P(y).
Oracle Crystal Ball is used as the stochastic modeling and optimization framework in the present study (2014). This program allows to set distribution type (normal, log-normal, uniform, etc.) and associated characteristics on input variables xn, and generate an estimated probability distribution of output variables yn, statistical distribution data and global sensitivity analyses. The program also enables optimization of an objective function both on a deterministic and a stochastic basis via the OptQuest function. The CO2 avoidance cost is the key performance indicator used as the objective function to be minimized in this work. In the case of stochastic optimization, Crystal Ball is used to minimize the mean CAC of the distribution.
Uncertainties Considered and Fluctuations
Key elements of the evaluation of the impact of uncertainties are defining the uncertain parameters and their associated probability distribution. Table 3 summarizes the uncertain parameters and probability distribution characteristics4 for each of the value chain elements considered in the studies.

Table 3. Description of statistical distributions used in the present study.
For investment costs (CAPEX5) along the chain, a beta type of uncertainty distribution is considered. This typically represents the uncertainties of the cost evaluation approaches associated with such projects, especially in the case of technologies with limited large scale experience (Bechtel Infrastructure Power and Corporation, 2018). Log-normal distributions are used for technical performances and prices to also account for the uncertainties in performances prediction, abnormal operation periods, unlikely events, sub-optimal performances during fluctuation periods. Furthermore, in the case of solvent-based CO2 capture, possible worsening of performances over time associated with solvent degradation, prior to periodic solvent reclaiming, also leads to significant uncertainties on utilities consumptions.
For mature technologies (MEA-based capture, transport, storage), the investment costs consider a −30%/+50% uncertainty range while a 10% standard deviation is considered on technical performances. However, higher uncertainties are considered for novel technologies (advanced amine-based and membrane-based captures) to reflect the lower level of current knowledge. In this case, the investment costs consider a −50%/+70% uncertainty range while a 25% standard deviation is considered on technical performances.
Furthermore, in the case of membrane-based capture, uncertainties on the membrane characteristics (selectivity, permeance, and lifetime) are also included. Membrane properties are assumed to follow a min-extreme distribution in which the deterministic properties [selectivity of 75 and permeance of 15 /(m2.h.bar)] are set as maximum values while the properties of the Polaris membrane [selectivity of 50 and permeance of 6 /(m2.h.bar)] (Merkel et al., 2010) are set as minimum values in order to represent the state of current technology development. The membrane module lifetime also considers a min-extreme distribution ranging from 1 to 7 years. The uncertainties in membrane properties can be due to manufacturing issues, inherent or environmentally induced degradation overtime, as well as uncertainties in properties achievable at industrial scale. Meanwhile, uncertainties in membrane module lifetime are due to limited experience on the impact of inherent or environmentally induced degradation overtime on the optimal amount of time between membrane module replacement.
Uncertainties in shipping fuel prices and oil economic value are due to uncertainties in future prices as well as potential fluctuations within a given year.
Beyond the above uncertainties, scenario-based uncertainties are also considered in some of the evaluations. For instance, normally distributed uncertainties on the amount of CO2 coming from nearby industries and different uncertainty scenarios for CO2 EOR storage are considered in some cases. More detail discussions on these uncertainties are take place in section Impact of Uncertainties on the Design and Cost of the WtE Plant with CCS.
In addition to uncertainties, the power output of the WtE plant and thus the flue gas mass flowrate is assumed to vary throughout the year. The emissions without CCS is considered to follow a sinusoidal profile with an annual average equivalent to 85% of the peak emission. With a capture ratio of 90%, the captured amount of CO2 thus varies between 0.413 and 0.590 MtCO2/y in the course of the year. Due to the temporal evolution of emissions, it is worth noting that an installed capacity below the peak flowrate (100% capacity) may be optimal, although this means not all emissions would be captured in this case as illustrated in Figure 5. While the optimal captured capacity is sought in some cases, a full-scale capture capacity is assumed in the result sections unless otherwise indicated.
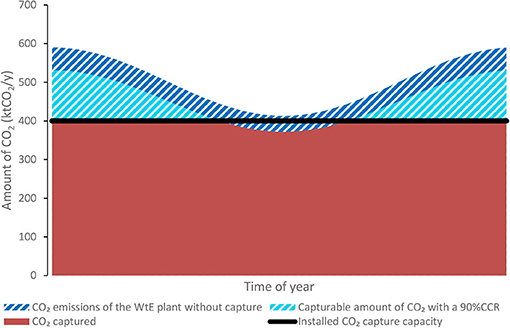
Figure 5. Evolution of the amount of capturable CO2, with a 90% CCR, within a year.
Results for the WtE Plant With CO2 Capture
Performances and Cost on a Deterministic Basis
This section illustrates the performances of the waste-to-energy plant without and with CO2 capture on a deterministic basis, i.e., no uncertainty is considered. The key characteristics of the WtE plant without and with CO2 capture6 are presented in Table 4. The levelized cost of electricity and CO2 avoidance cost are illustrated in Figure 6.
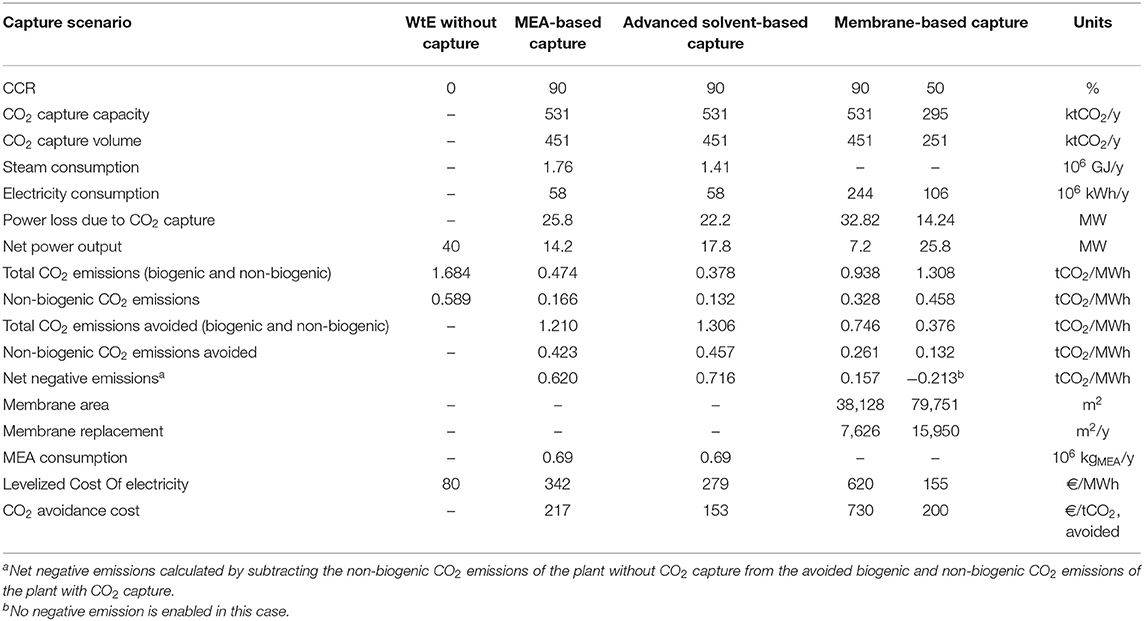
Table 4. Key characteristics of the WtE plant without and with CO2 capture.
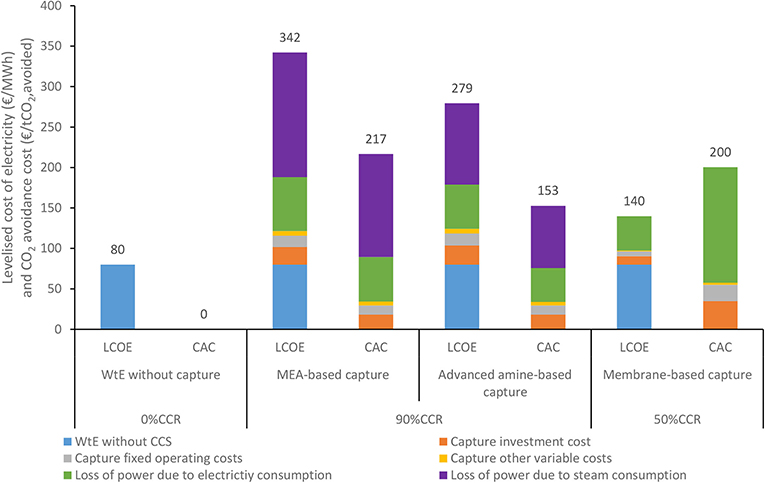
Figure 6. Levelized cost of electricity and CO2 avoidance cost breakdown of the WtE plant without and with CO2 capture.
In all cases aiming at capturing 90% of the emissions, implementing CO2 capture results in significant losses in the net power output of the plant (between 55 and 70% lower than without capture). This is primarily due to the very high amount of CO2 captured (90% of both biogenic and non-biogenic emissions) and the low efficiency of the plant. However, as large quantities of biogenic CO2 emissions are captured, large quantities of negative CO2 emissions are enabled, especially in the solvent-based cases: from 0.157 tCO2/MWh with membrane to 0.716 tCO2/MWh with advanced amine.
The low CO2 concentration in the flue gas (10%vol CO2) results in extremely high power losses for membrane-based capture with 90% capture ratio. Considering partial capture can significantly reduce this energy penalty. Indeed, a CO2 capture ratio of 50% (i.e., a reduction of 45% in the amount of CO2 captured), leads to a power loss associated with CO2 capture 55% lower than at 90% CCR. However, a significant drawback of this option is that there are no net negative emissions. The total CO2 emissions (biogenic and non-biogenic) captured correspond to 73% of the non-biogenic CO2 emissions without capture, which is slightly below the CO2 avoided ratio (~80%) obtained in the case of coal and gas power plants with CCS (Anantharaman et al., 2011).
From a cost perspective, the implementation of CO2 capture at 90% CCR results in LCOEs7 from 279 to 620 €/MWh, depending on the capture options, while the LCOE of the WtE without capture was estimated to be 80 €/MWh. The solvent-based capture technologies yield the best performances. The LCOE of the MEA-based capture is 342 €/MWh, while the advanced amine-based capture, with an LCOE of 279 €/MWh, lead to a 19% reduction compared to MEA. The membrane-based capture at 90% CCR leads to an LCOE that is nearly 7 times higher than the case without capture. This is due to the extremely large reduction in net power output of the plant in this case. However, the LCOE in the 50% CCR case is 93% higher than the case without CO2 capture. The increase in LCOE is considerably lower in the 50% CCR because less CO2 is captured, and the capture process is more energy efficient. In all capture cases, the power losses associated due to steam and/or electricity consumption for the capture contributes to most of the LCOE increase (74–84%).
Similar trends are observed for the CAC. Except for the 90% CCR membrane capture case, the CAC ranges between 153 and 217 €/tCO2, avoided depending on the capture option considered and is mainly due to the loss of power associated with CO2 capture. Compared to the MEA-based CO2 capture, the advanced amine and the 50% CCR membrane capture options enable a cost reduction of, respectively, 30 and 8%. While the CACs evaluated here are higher than those of typical power and industrial plants, they are on the low range of cost estimates for negative emission technologies such as bioenergy with CCS (BECCS) and direct air capture (DAC), which are in the range 50-250 €/tCO2, avoided and 100–2,000 €/tCO2, captured, respectively (Bui et al., 2018). Furthermore, compared to BECCS, the negative emissions enabled by CCS from the WtE are due to the biological part of the waste thus overcoming the shortcoming typically associated with BECCS (availability, land use, waster user, fertilizer consumption). CCS from WtE plants could thus be a cost-efficient option to deliver the negative emissions often identified as crucial to meet the ambitions of the Paris Agreement.
Overall, the high LCOEs obtained emphasize the importance of a financial credit for the negative emissions enabled by installing CO2 capture in WtE plant and a higher fee charged for the decarbonization of the treatment of municipal waste which is the main purpose of a WtE plant. For this reason, the LCOE with CCS is not deemed to be a good key performance indicator for decarbonization of WtE and only the CAC is considered in subsequent sections.
Finally, the fact that most of the increase in LCOE and CAC is due to a decrease in plant power output emphasizes that capture technologies with low energy penalty for the CO2 concentration considered will be key to reach cost-efficient CO2 capture from WtE.
Impact of Uncertainties on CAC and Comparison of the Different Technologies
The impact of uncertainties on the CAC for the three capture technologies considered is shown in Figure 7. The statistical distributions of the different parameter uncertainties were presented in Table 3 while the CO2 avoidance cost distribution is presented in Table 5.
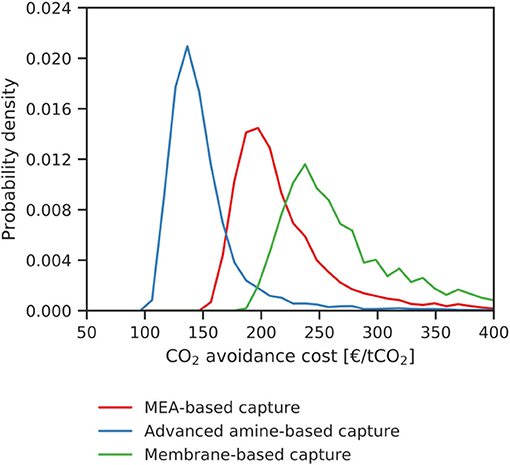
Figure 7. CO2 avoidance cost distribution of the WtE plant with CO2 capture.
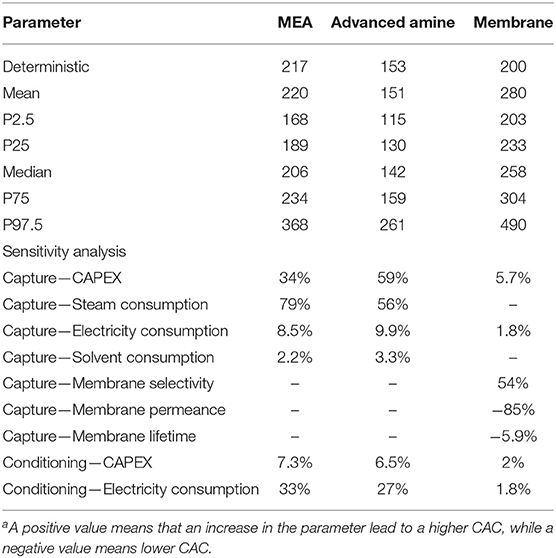
Table 5. Key characteristics and global sensitivity analysisa of the CO2 avoidance cost distribution (€/tCO2, avoided) of the WtE plant with CO2 capture.
The CAC cost distribution for all technologies are skewed to the right, with the skew being most prominent for the membrane case. The MEA case CAC distribution shows a mean value 220 €/tCO2, avoided, while the first quartile, the median and third quartile are 189, 206, and 234 €/tCO2, avoided, respectively. The mean CAC is very similar to the deterministic CAC of 217 €/tCO2, avoided. In the case of the advanced amine CAC distribution, the mean CAC is 151 €/tCO2, avoided, while the first quartile, the median and third quartiles are 130, 142, and 159 €/tCO2, avoided, respectively. The mean CAC in the advanced amine case is very similar again to the deterministic CAC of 153 €/tCO2, avoided. While the median and mean CAC of the advanced amine case are lower than those of the MEA case, the advanced amine CAC distribution shows a slightly higher relative spread8, indicating greater uncertainty.
The membrane case CAC distribution has a mean value of 280 €/tCO2, avoided. The median value is 258 €/tCO2, avoided while the first and third quartiles are 233 and 304 €/tCO2, avoided, respectively. Both the mean and median CACs are significantly greater than the deterministic CAC of 200 €/tCO2, avoided, calculated with no uncertainties. The deterministic evaluation assumed a membrane with good properties (selectivity and permeance). However, the simulations with uncertainty use membranes with selectivity and permeance ranges below the ones of the deterministic evaluation as shown in Table 4. This leads to higher costs than in the deterministic case as can be seen in the CAC distribution of the membrane case. Also, although the membrane case CAC distribution shows the smallest spread of the three cases, it is worth noting that its cost distribution is flatter meaning that wide range of cost is similarly probable.
From a technology selection or comparison perspective, given the results of the deterministic analysis, the advanced amine showed the most promise, followed by the membrane and then MEA cases. However, with the inclusion of uncertainties, while the advanced amine shows the largest potential to have a low CAC, the order is reversed between the membrane and MEA cases. The MEA will more likely have a lower CAC than the membrane case.
A global sensitivity analysis was also performed as part of the study based the uncertainty distributions considered. The global sensitivity of the CAC to the different parameters for the three capture technology cases as shown in Table 5. For the MEA and advanced amine cases, steam consumption followed by the CAPEX and then the electricity consumption for conditioning process have the largest impact on the CAC. The effects of electricity consumption in the capture plant and the solvent consumption are minimal. The effects of these different parameters can be inferred from the breakdown of the CAC for the deterministic case shown in Figure 7, where loss of power in the WtE plant due to steam consumption in the CO2 capture plant is the largest contributor.
In the case of the membrane-based capture process, the membrane properties (selectivity and permeance) have the largest impact on the CAC. The membrane permeance and CAC are negatively correlated in that as the membrane permeance increases the CAC decreases. The membrane permeance has a sizeable impact on the CAC, while the membrane lifetime has a small impact. The remaining parameters do not have much of an impact.
Impact of Uncertainty in CO2 Emission Penalties on the Design and Cost
In the earlier section, results of the impact of uncertainties on the CAC of the three CO2 capture technologies were presented. Another relevant question is how uncertainties affect the design or the optimal capacity of the capture process. The optimal capacity of the capture process does not change with the inclusion of uncertainties for the three capture processes evaluated. The optimal capacity for the solvent cases—MEA and advanced amine—is 78%, which is the same as the value evaluated for the deterministic case. For the membrane case, the optimal capacity is 50%, similar to the deterministic case.
Appendix B in Supplementary Material shows the CO2 avoidance cost breakdown and share of avoided emissions for the three CO2 capture processes as a function of the installed capacity factor. As can be seen from the figures for the solvent processes, the optimum CAC is around 80% capacity factor. The reason for this is that the CAPEX contribution to the CAC decreases with increasing capacity factor, while the loss of power due to steam consumption and electricity consumption, the main contributors to the CAC, increase slightly with increasing capacity factor. The optimal capacity is close to the utilization rate (85%) of the WtE plant.
For the case of membranes, the electricity contribution to the CAC increases significantly with increasing capacity factor even though the CAPEX contribution to the CAC decreases slightly (see Appendix B in Supplementary Material). With the electricity consumption being the largest contributor to the CAC, this results in the CAC increasing with increasing capacity factor. The optimal capacity is thus at 50% capacity factor.
Results for the WtE With CO2 Capture, Transport, and Storage
Design and Costs on a Deterministic Basis
The design and cost evaluation of reducing the CO2 emissions of the WtE plant, including the full CCS chain is presented in this section. For both CCS chains considered (chains D and E), the CO2 capture options are based on the advanced amine. This section shows the performance of the WtE plant with CCS on a deterministic basis, similar to the CO2 capture chains in section Performances and Cost on a Deterministic Basis. While the technical performances of the WtE including the entire CCS chain are similar to the WtE plant with CO2 capture, the CAC increases as a result of the inclusion of CO2 transport and storage and is illustrated in Figure 8.
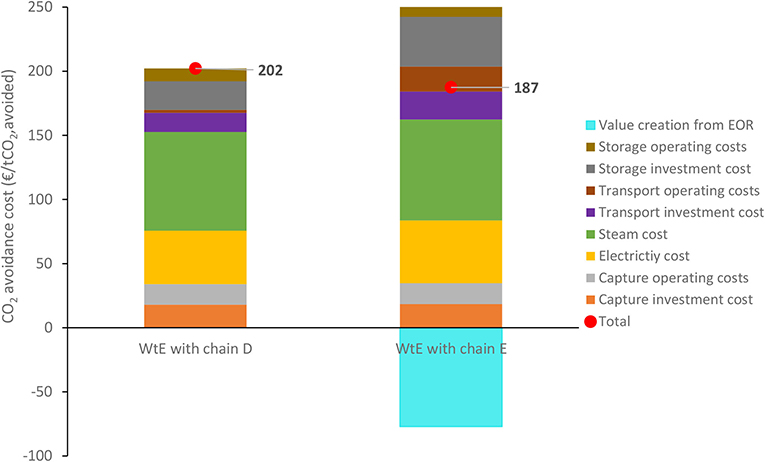
Figure 8. CO2 avoidance cost breakdown of the WtE plant with CCS for chains D and E.
For chain D, based on CO2 transport via a shared 100 km pipeline and storage in a nearby shared saline aquifer (Chain D), a CAC of 202 €/tCO2, avoided is obtained. Most of the increase compared to the case with only CO2 capture is linked with the storage costs (two-thirds of the increase). A pipeline diameter of 8.625′′ was found9 to be cost-optimal based on the CO2 emissions captured from the WtE and nearby industries.
Chain E considers a 250 km transport via a shared ship to an EOR storage site. Due to the gradual reduction in the amount of CO2 which can be injected in the EOR storage over time, a nearby saline aquifer was considered to store the excess CO2. The profiles of CO2 injected in the EOR storage and saline aquifer over the years is presented in Appendix C (Supplementary Material). As a result of the longer transport distance and the two storage facilities, the transport and storage costs are higher in chain E than chain D. However, the value creation associated with the oil production of the EOR storage significantly offsets this cost increase, leading to a CAC for chain E of 187 €/MWh (7% lower than chain D). An optimal ship size of 8,000 m3 was evaluated for the transport to the EOR storage, based on transport capacity and distances, while an optimal pipeline diameter of 5.5625′′ was identified for transport from the EOR storage site to the nearby aquifer.
Impact of Uncertainties on the Design and Cost of the WtE Plant With CCS
This section discusses the impact of different uncertainty scenarios on the CO2 avoidance cost, design and comparison of WtE plant with CCS chains D and E. Three groups of uncertainties are considered. First the impact of “internal” uncertainties, referring to uncertainties not directly linked to the decision of an agent, is considered in section Impact of Internal Uncertainties. The additional impact of “external” uncertainty linked directly through the decision of an agent, here considered to be amount of CO2 coming from nearby industries, is then considered in section Impact of Uncertainty in the Amount of CO2 Coming from Nearby Industries. Finally, the impact of the uncertainty in the EOR response of chain E, in addition to the internal uncertainties, is investigated in section Impact of the EOR Response on Comparison of Chain.
While these three groups of uncertainties are investigated in the three following sections, the key characteristics and global sensitivity analyses are gathered in Table 6.
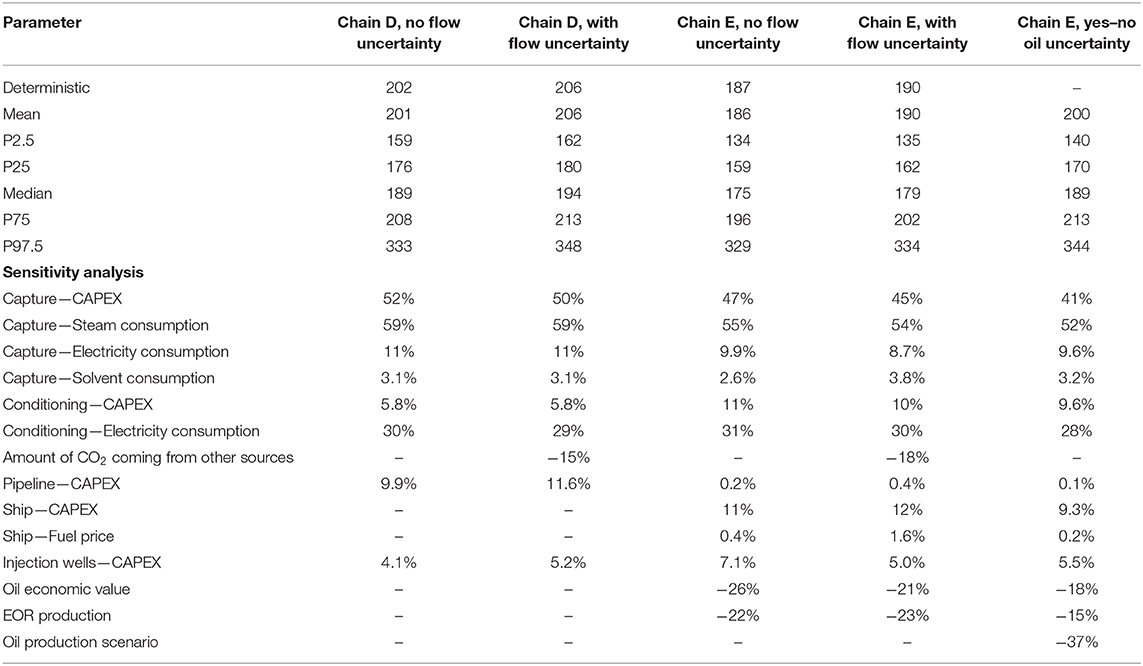
Table 6. Key characteristics and global sensitivity analysis of the CO2 avoidance cost distribution (€/tCO2, avoided) of the WtE plant with CCS chains D and E under the different uncertainty scenarios.
Impact of Internal Uncertainties
The “internal” uncertainties of the two chains (CAPEX of the different parts of the chain, steam consumption, EOR production, oil economic value, etc. but no uncertainty on the amount of CO2 coming from nearby industries) are first compared, as illustrated in Figure 9. The chain D shows a mean CAC value of 201 €/tCO2, avoided, while the first quartile, the median and the third quartiles are 176, 189, and 208 €/tCO2, avoided, respectively. For chain E, the mean value is 186 €/tCO2, avoided, while the first quartile, the median and the third quartile are 159, 175, and 196 €/tCO2, avoided, respectively. In both cases, the mean CAC value of the distributions matches the deterministic value, which implies that chain E remains in average cheaper than chain D even once uncertainties are taken into account. Although chain E results in more uncertain costs, as can be observed from the wider spread, the CAC associated with the key percentiles (P2.5, P25, Median, P75, P97.5) of chain E are always lower than for chain D and is thus more cost-efficient even when internal uncertainties are taken into account.
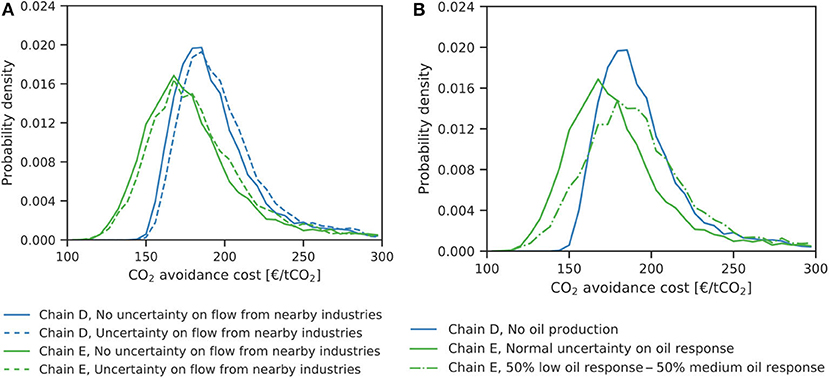
Figure 9. CO2 avoidance cost distribution of the WtE plant with CCS chains D and E (A) without and with uncertainties on the amount of CO2 coming from nearby industries (B) with different types of uncertainty on the EOR response of chain E.
Impact of Uncertainty in the Amount of CO2 Coming From Nearby Industries
The impact of uncertainty in the flow of CO2 coming from nearby industries, in addition to the internal uncertainties, is also analyzed. When doing so, the re-optimization of the ship size and pipeline diameters is considered.
Once the uncertainty on flow from nearby industries included, the mean CAC of chains D and E are 206 and 190 €/tCO2, avoided, respectively, as illustrated in Figure 9. This corresponds to an increase of 4–5 €/tCO2, avoided compared to the case without uncertainty on the CO2 flow from nearby industries. Although this cost increase is small related to the overall CAC, this correspond to an 10–15% increase for the transport and storage contribution to the CAC for the two chains. It is important to note that the design of the CCS chain changes when the uncertainty on the CO2 flow from nearby industries are included. The optimal pipeline diameters of chains D and E increase to 10.75′′ and 6.625′′, respectively, while the ship capacity increases to 10,500 m3. The main reason for this is that the transport infrastructure design points identified in section Design and Costs on a Deterministic Basis have maximum capacities10 of 1.77 and 1.68 MtCO2/y, respectively for the two chains D and E. As a result, without redesign the CCS infrastructure would be unable to ensure transport and storage in 35 and 1.8% of the cases for chains D and E, respectively.
For chain D, the first quantile, the median and the third quartile are 180, 194, and 213 €/tCO2, avoided respectively. Meanwhile, for chain E, the first quantile, the median and the third quartile are 162, 179, and 202 €/tCO2, avoided, respectively. Thus, despite an increase in CAC in both cases, it is worth noting that the CAC profiles remain similar in shape compared to the case without uncertainty on the flow from nearby industries.
Impact of the EOR Response on Comparison of Chain
In addition to the uncertainties discussed above, a key uncertainty in the case of an CO2 EOR project is the response to CO2 injection. Although CO2 EOR developments are often based on oil fields in the secondary or ternary recovery phase, which is thus better known than a completely new development, significant uncertainties remain. Thus, the impact of the EOR response uncertainties on the costs of chain E and its comparison to chain D is investigated. Two EOR uncertainty cases are considered. First, as earlier, a normally distributed uncertainty on the oil production is considered. This case corresponds to a situation in which the storage response is expected to be very well-known. A second case in which the EOR response is more uncertain is considered. This scenario considers an additional “Yes-No” type of uncertainty in which the EOR response has a 50% probability of being identical to the first uncertainty scenario (medium response scenario) and 50% likelihood to be 39% lower (low response scenario). In both cases, the other uncertainties present along the chain are considered, except uncertainties on the amount of CO2 coming from nearby industries. The impact of these uncertainties on the CAC of these chains E are presented and compared to chain D in Figure 9.
As before, the different probability distributions are skewed to the right, although the second chain E case is less skewed and more spread than the other two. Compared to the case of a normally distributed uncertainty on the EOR response, chain E with the “Yes-No” type of uncertainty results in higher CAC as the revenues associated with the CO2 EOR storage injection are reduced. As a result, the mean CAC in the second case is 10 €/tCO2, avoided (5%) higher than in the normally distributed case. Thus, the second EOR uncertainty case results in an on par CAC of the chain E and chain D (0.5% difference, while chain E is 7.5% cheaper on a deterministic basis) thus potentially impacting the selection of the option transport and storage strategy.
Conclusions
The objective of this study was to investigate the optimal design of carbon capture and storage from a waste-to-energy plant under uncertainties. Using an in-house techno-economic CCS assessment tool combined with an uncertainty quantification framework, the case of CCS from a hypothetical 40 MW waste-to-energy plant located in Norway was considered.
When the different capture options are compared on a deterministic basis, the advanced amine option yield the best performances with a CO2 avoidance cost of 153 €/tCO2, avoided, followed by the membrane process based on partial capture (200 €/tCO2, avoided) and MEA-based capture (217 €/tCO2, avoided). While these CACs are higher than those of typical power and industrial plants, they are on the low range of cost estimates for negative emission technologies such as BECCS and DAC. CCS from WtE plants could thus be a cost-efficient option to deliver the negative emissions often identified as crucial to meet the ambitions of the Paris Agreement.
Once technical and cost uncertainties are taken into account, the advanced amine-based capture remains the best option, however the MEA-based capture outperforms the membrane process, as the membrane properties considered in the deterministic comparison are optimistic when considering the current status of membrane development. However, the stochastic optimization performed showed that the uncertainties considered do not impact the optimal capture capacity in this case.
The full CCS chain perspective was then included through two chain options: a nearby offshore saline aquifer or an offshore CO2 EOR storage located further away but which could add an additional economic benefit to the project. The EOR-based chain would lead to the best performances both on a deterministic basis and when different uncertainty scenarios are considered. However, as a shared transport and storage infrastructure is considered, uncertainties on the amount of CO2 coming from nearby industries led to a different optimal design of the chain (pipeline diameter and ship capacity). Finally, uncertainties on the EOR response to CO2 injection significantly reduce the potential of the CO2 EOR-based chain and can result in cases in which the saline aquifer-based chain would be optimal.
These results show that taking into account uncertainties, beyond the traditional sensitivity analysis commonly used in the literature, can enable a deeper understanding of the CO2 avoidance cost, better technology comparison and better CCS chain designs. Given the ex-ante nature of CCS, this could be crucial in unlocking more cost-efficient CCS implementations. However, to obtain meaningful results, further work to better understand and characterize underlying uncertainties will also be required.
Data Availability Statement
All datasets generated for this study are included in the article/Supplementary Material.
Author Contributions
All authors listed have made a substantial, direct and intellectual contribution to the work, and approved it for publication.
Funding
This publication has been produced with support from the NCCS Centre, performed under the Norwegian research program Centres for Environment-friendly Energy Research (FME) and with support from the German Ministry of Economic Affairs and Energy based on a resolution of the German Parliament (MONIKA, FKZ: 03ET7089). The authors acknowledge the following partners for their funding contributions to the NCCS Centre: Aker Solutions, ANSALDO Energia, CoorsTek Membrane Sciences, Gassco, KROHNE, Larvik Shipping, Norcem, Norwegian Oil and Gas, Quad Geometrics, Statoil, TOTAL, and the Research Council of Norway (257579/E20).
Conflict of Interest
The authors declare the following partners for their funding contributions to the NCCS Centre: Aker Solutions, ANSALDO Energia, CoorsTek Membrane Sciences, Gassco, KROHNE, Larvik Shipping, Norcem, Norwegian Oil and Gas, Quad Geometrics, Statoil, TOTAL, and the Research Council of Norway (257579/E20). The funders were not involved in the study design, collection, analysis, interpretation of data, the writing of this article, or the decision to submit it for publication.
Supplementary Material
The Supplementary Material for this article can be found online at: https://www.frontiersin.org/articles/10.3389/fenrg.2020.00017/full#supplementary-material
Abbreviations
2DS, 2 Degree Scenario; BECCS, bioenergy with CCS; CAC, CO2 avoidance cost; CCR, CO2 capture ratio; CCS, carbon capture and storage; DAC, direct air capture; EOR, Enhanced oil recovery; LCOE, levelized cost of electricity; MEA, monoethanol amine; MSW, municipal solid waste; TRL, technology readiness level; UQ, uncertainty quantification; WtE, waste to energy.
Footnotes
1. ^Considering an average utilization rate of 85%.
2. ^Over the years the reservoir produces more and more CO2 which need to be rejected, after separation. This limits the amount of CO2 which can be imported if the injection rate is to be constant over the project duration.
3. ^iCCS stands for Integrated techno-economic and environmental modeling of CCS.
4. ^An overview of the different types of probability distribution considered in this study is presented in Appendix A (Supplementary Material).
5. ^CAPEX stands for capital expenditure.
6. ^Conditioning prior to a pipeline transport is here included, even if transport and storage cost are not part of the performance and cost estimate in this section.
7. ^It is important to note that the LCOE calculation does not consider any financial credit for the negative emissions enabled and that at least part of the additional cost related to CCS may be charged to household producing the waste being treated by the plant.
8. ^The relative spread is here defined by comparing the percentile range P97.5 – P2.5 to the mean value.
9. ^Pipeline diameter and ship capacity are selected in the iCCS tool to minimize costs.
10. ^Considering a utilization rate of 100%.
References
Adams, T. I. I., Hoseinzade, L., Madabhushi, P., and Okeke, I. (2017). Comparison of CO2 capture approaches for fossil-based power generation: review and meta-study. Processes 5:44. doi: 10.3390/pr5030044
Anantharaman, R., Bolland, O., Booth, N., Dorst, E. V., Ekstrom, C., Franco, F., et al. (2011). D1.4.3 European Best Practice Guidelines for Assessment of CO2 Capture Technologies (DECARBit Project). Trondheim.
Bechtel Infrastructure and Power Corporation (2018). Retrofitting an Australian Brown Coal Power Station with Post-Combustion Capture: A Conceptual Study. CO2CRC.
Boot-Handford, M. E., Abanades, J. C., Anthony, E. J., Blunt, M. J., Brandani, S., Mac Dowell, N., et al. (2014). Carbon capture and storage update. Energy Environ. Sci. 7, 130–189. doi: 10.1039/C3EE42350F
Budhathoki, S., Ajayi, O., Steckel, J. A., and Wilmer, C. E. (2019). High-throughput computational prediction of the cost of carbon capture using mixed matrix membranes. Energy Environ. Sci. 12, 1255–1264. doi: 10.1039/C8EE02582G
Bui, M., Adjiman, C. S., Bardow, A., Anthony, E. J., Boston, A., Brown, S., et al. (2018). Carbon capture and storage (CCS): the way forward. Energy Environ. Sci. 11, 1062–1176. doi: 10.1039/C7EE02342A
European Technology Platform for Zero Emission Fossil Fuel Power Plants (ZEP) (2011a). The Costs of CO2 Storage, Post-Demonstration CCS in the EU
European Technology Platform for Zero Emission Fossil Fuel Power Plants (ZEP) (2011b). The Costs of CO2 Transport, Post-Demonstration CCS in the EU.
Gardarsdottir, S., De Lena, E., Romano, M., Roussanaly, S., Voldsund, M., Pérez-Calvo, J.-F., et al. (2019). Comparison of technologies for CO2 capture from cement production – part 2: cost analysis. Energies 12:542. doi: 10.3390/en12030542
Hanak, D. P., Kolios, A. J., and Manovic, V. (2016). Comparison of probabilistic performance of calcium looping and chemical solvent scrubbing retrofits for CO2 capture from coal-fired power plant. Appl. Energy 172, 323–336. doi: 10.1016/j.apenergy.2016.03.102
Husebye, J., Brunsvold, A. L., Roussanaly, S., and Zhang, X. (2012). Techno economic evaluation of amine based CO2 capture: impact of CO2 concentration and steam supply. Energy Procedia 23, 381–390. doi: 10.1016/j.egypro.2012.06.053
IEA (2016). 20 Years of Carbon Capture and Storage: Accelerating Future Deployment. Paris: International Energy Agency.
IEAGHG (2017). 2017-TR5 Evaluating the Costs of Retrofitting CO2 Captured in an Integrated Oil Refinery: Technical Design Basis and Economic Assumptions.
IEAGHG (2018). 2018-TR03 Cost of CO2 Capture in the Industrial Sector: Cement and Iron and Steel Industries.
IPCC (2018). Global Warming of 1.5°C. An IPCC Special Report on the Impacts of Global Warming of 1.5°C Above Pre-Industrial Levels and Related Global Greenhouse Gas Emission Pathways, in the Context of Strengthening the Global Response to the Threat of Climate Change, Sustainable Development, and Efforts to Eradicate Poverty.
Jakobsen, J., Roussanaly, S., and Anantharaman, R. (2017). A techno-economic case study of CO2 capture, transport and storage chain from a cement plant in Norway. J. Clean. Product. 144, 523–539. doi: 10.1016/j.jclepro.2016.12.120
Jakobsen, J. P., Roussanaly, S., Brunsvold, A., and Anantharaman, R. (2014). A tool for integrated multi-criteria assessment of the CCS value chain. Energy Procedia 63, 7290–7297. doi: 10.1016/j.egypro.2014.11.765
Knoope, M. M. J., Guijt, W., Ramírez, A., and Faaij, A. P. C. (2014). Improved cost models for optimizing CO2 pipeline configuration for point-to-point pipelines and simple networks. Int. J. Greenhouse Gas Control 22, 25–46. doi: 10.1016/j.ijggc.2013.12.016
Kuncheekanna, V. N., Jakobsen, J., and Knuutila, H. (2019). “Assessment of solvent properties uncertainties on the performances of a packed column for CO2 capture from industrial sources, in 5th Post-Combustion CO2 Capture conference (PCCC-5) (Kyoto).
Merkel, T., Lin, H., Wei, X., and Baker, R. (2010). Power plant post-combustion carbon dioxide capture: an opportunity for membranes. J. Memb. Sci. 359, 126–139. doi: 10.1016/j.memsci.2009.10.041
Ministry of Petroleum and Energy (2016). Feasibility Study for Full-Scale CCS in Norway. Available online at: https://www.gassnova.no/en/Documents/Feasibilitystudy_fullscale_CCS_Norway_2016.pdf (accessed December 01, 2018).
Morgan, J. C., Bhattacharyya, D., Tong, C., and Miller, D. C. (2015). Uncertainty quantification of property models: methodology and its application to CO2-loaded aqueous MEA solutions. AIChE J. 61, 1822–1839. doi: 10.1002/aic.14762
Nord, L. O., Gong, B., Bolland, O., and McRae, G. J. (2010). Incorporation of uncertainty analysis in modeling of integrated reforming combined cycle. Energy Conver. Manag. 51, 2068–2078. doi: 10.1016/j.enconman.2010.02.040
Pour, N., Webley, P., and Cook, P. (2018). Opportunities for application of BECCS in the Australian power sector. Appl. Energy 224, 615–635. doi: 10.1016/j.apenergy.2018.04.117
Raksajati, A., Ho, M. T., and Wiley, D. E. (2018). Comparison of solvent development options for capture of CO2 from flue gases. Industr. Eng. Chem. Res. 57, 6746–6758. doi: 10.1021/acs.iecr.8b00283
Rao, A. B., and Rubin, E. S. (2002). A technical, economic, and environmental assessment of amine-based CO2 capture technology for power plant greenhouse gas control. Environ Sci. Technol. 36, 4467–4475. doi: 10.1021/es0158861
Roussanaly, S., Aasen, A., Anantharaman, R., Danielsen, B., Jakobsen, J., Heme-De-Lacotte, L., et al. (2019). Offshore power generation with carbon capture and storage to decarbonise mainland electricity and offshore oil and gas installations: a techno-economic analysis. Appl. Energy 233–234, 478–494. doi: 10.1016/j.apenergy.2018.10.020
Roussanaly, S., and Anantharaman, R. (2017). Cost-optimal CO2 capture ratio for membrane-based capture from different CO2 sources. Chem. Eng, J. 327, 618–628. doi: 10.1016/j.cej.2017.06.082
Roussanaly, S., Anantharaman, R., Lindqvist, K., and Hagen, B. (2018). A new approach to the identification of high-potential materials for cost-efficient membrane-based post-combustion CO2 capture. Sustain. Energy Fuels 2, 1225–1243. doi: 10.1039/C8SE00039E
Roussanaly, S., Anantharaman, R., Lindqvist, K., Zhai, H., and Rubin, E. (2016). Membrane properties required for post-combustion CO2 capture at coal-fired power plants. J. Memb. Sci. 511, 250–264. doi: 10.1016/j.memsci.2016.03.035
Roussanaly, S., Brunsvold, A. L., and Hognes, E. S. (2014). Benchmarking of CO2 transport technologies: part II – offshore pipeline and shipping to an offshore site. Int. J. Greenhouse Gas Control 28, 283–299. doi: 10.1016/j.ijggc.2014.06.019
Roussanaly, S., Brunsvold, A. L., Hognes, E. S., and Jakobsen, J. P., Zhang, X. (2013a). Integrated techno-economic and environmental assessment of an amine-based capture. Energy Procedia 37, 2453–2461. doi: 10.1016/j.egypro.2013.06.126
Roussanaly, S., Fu, C., Voldsund, M., Anantharaman, R., Spinelli, M., and Romano, M. (2017). Techno-economic analysis of MEA CO2 capture from a cement kiln – impact of steam supply scenario. Energy Procedia 114, 6229–6239. doi: 10.1016/j.egypro.2017.03.1761
Roussanaly, S., and Grimstad, A.-A. (2014). The Economic Value of CO2 for EOR Applications. Energy Procedia 63, 7836–7843. doi: 10.1016/j.egypro.2014.11.818
Roussanaly, S., Jakobsen, J. P., Hognes, E. H., and Brunsvold, A. L. (2013b). Benchmarking of CO2 transport technologies: part I—onshore pipeline and shipping between two onshore areas. Int. J. Greenhouse Gas Control 19, 584–594. doi: 10.1016/j.ijggc.2013.05.031
Rubin, E. S. (2012). Understanding the pitfalls of CCS cost estimates. Int. J. Greenhouse Gas Control 10, 181–190. doi: 10.1016/j.ijggc.2012.06.004
Rubin, E. S., Short, C., Booras, G., Davison, J., Ekstrom, C., Matuszewski, M., et al. (2013). A proposed methodology for CO2 capture and storage cost estimates. Int. J. Greenh. Gas. Con. 17, 488–503. doi: 10.1016/j.ijggc.2013.06.004
Stuen, J. (2019). CCS from Waste Incineration: From Polluting Industry to Part of the Climate Solution. Oslo: Kolsänka og Negative Utslipp.
Vainikka, P., Tsupari, E., Sipilä, K., and Hupa, M. (2012). Comparing the greenhouse gas emissions from three alternative waste combustion concepts. Waste Manag. 32, 426–437. doi: 10.1016/j.wasman.2011.10.010
Worldwide, B. P. N. (2017). Bunker Prices Worldwide. Available online at: http://www.bunkerportsnews.com/ (accessed December 17, 2018).
Zhai, H. (2019). Advanced membranes and learning scale required for cost-effective post-combustion carbon capture. iScience 13, 440–451. doi: 10.1016/j.isci.2019.03.006
Keywords: carbon capture and storage, waste-to-energy, uncertainties, techno-economic, solvent-based CO2 capture, membrane-based CO2 capture, CO2 enhanced oil recovery
Citation: Roussanaly S, Ouassou JA, Anantharaman R and Haaf M (2020) Impact of Uncertainties on the Design and Cost of CCS From a Waste-to-Energy Plant. Front. Energy Res. 8:17. doi: 10.3389/fenrg.2020.00017
Received: 11 October 2019; Accepted: 03 February 2020;
Published: 25 February 2020.
Edited by:
Sheila Samsatli, University of Bath, United KingdomReviewed by:
John Frederick Tapia, De La Salle University, PhilippinesHari Mantripragada, University of Pittsburgh, United States
Copyright © 2020 Roussanaly, Ouassou, Anantharaman and Haaf. This is an open-access article distributed under the terms of the Creative Commons Attribution License (CC BY). The use, distribution or reproduction in other forums is permitted, provided the original author(s) and the copyright owner(s) are credited and that the original publication in this journal is cited, in accordance with accepted academic practice. No use, distribution or reproduction is permitted which does not comply with these terms.
*Correspondence: Simon Roussanaly, c2ltb24ucm91c3NhbmFseUBzaW50ZWYubm8=