- 1Jiangsu Energy Economy and Management Research Base, China University of Mining and Technology, Xuzhou, China
- 2School of Management, China University of Mining and Technology, Xuzhou, China
This study presents a generation expansion planning by incorporating the impacts of renewable energy on the generation mix. The wind–solar power output and its flexibility requirement are integrated into an optimization model to provide the realistic representation of wind and solar energy resources. The model is then used for the power system optimization planning of Jiangsu Province. A comparison of power demand, electricity price subsidies, and carbon emission intensity scenarios reveals the power planning scheme and optimization path for power system integrating increasing renewable energy. The results suggest that the installed capacity of renewable energy will increase from 21.6 to 133.2 GW in the baseline scenario during the planning period, with its share ranging from 17.9 to 53.7%. Solar photovoltaic power is expected to contribute 72% of renewable capacity and 39% of total capacity by 2050. The impact of electricity price subsidies on solar PV generation expansion is particularly significant. Additionally, the flexibility requirement of power systems can basically be satisfied with the available generation technologies; however, it would become severe if the flexibility requirement grows faster than the flexible generation.
Introduction
In the global Climate Change Action Plan for a 2°C reduction, the Chinese government promised to peak their CO2 emission by 2030. As the main sector responsible for carbon emissions, power generation needs to undertake the primary mission of reducing CO2 emission through a significant transformation from an energy structure where coal is a leading resource to a cleaner energy structure (Zhao et al., 2020). Jiangsu Province, the second highest electricity consumption area in the country, consumed around 6,128.3 TWh electricity in 2018. Its installed capacity was 126.6 GW, with thermal power accounting for 77% of the total (National Bureau of Statistics, 2019). In order to regulate its coal consumption and reduce CO2 emissions, the Jiangsu Province proposed to increase generation capacity of non-fossil energy resources to more than 20% of the total capacity by 2020 (Jiangsu Provincial People's Government, 2017).
Wind and solar energy resources have great potential for utilization in Jiangsu Province. It is estimated that the resource potentials of wind and solar energy reach 2.1 and 15.8 GW, respectively (Zhou et al., 2010; Zou and Yi, 2012), strongly favoring the realization of a renewable power system. However, the large-scale integration of variable renewables can render the power system more complex (Liu et al., 2019). Fluctuations in wind and solar energy power generation can lead to excessive or insufficient power supply in the short term. Moreover, balancing the power supply and demand is difficult owing to limited energy storage facilities. Thus, these uncertainties have to be compensated with high flexibility through real-time dispatch and response.
The traditional power system planning models focus on the optimal combination of power generation technologies to meet the power demand during the planning period. However, the impacts of renewable energy start to be considered into the planning models in recent studies. For example, several scholars have defined flexibility as the system's ability to rebalance the power demand and supply when large amounts of power generation from wind and solar energy are integrated (Deason, 2018). Among others, traditional dispatchable power plants provide generation supplement in times of low wind speed and solar irradiation; transmission grids provide spatial smoothing to match the power supply and demand in different regions; energy storage devices provide a temporal support to balance the fluctuation of VRE; and demand-side management provides flexible load resources to respond to unexpected power undulations (Deng and Lv, 2020).
To investigate the contribution of unit dispatch in long-term planning, some studies analyze the short-term variations in variable renewable energy (VRE) in long-term power systems planning using a combination method of the hourly unit commitment and capacity expansion planning models (Pereira et al., 2017). Gils et al. (2017) and Scholz et al. (2017) examined the correlation between VRE penetration, energy storage, and power transmission. They found that interregional transmission could play a significant role in wind-dominated scenarios, whereas energy storage technologies are adequately applied in solar-dominated scenarios. Zhang et al. (2017) developed an integrated source-grid-load planning model to find an optimal planning scheme for China. All the available resources of generation, transmission, and demand side have been considered to ensure a reasonable integration for renewable energy.
For power system planning at the provincial level, key factors for decision-making in terms of power generation expansion are system cost and decision risk (Fan et al., 2019). Furthermore, the power systems of Hebei and Fujian Provinces in China show great impacts on environmental tax and spatial distribution on the portfolio strategy of generation technologies (Sun et al., 2013; Wang et al., 2018). Especially, Zhang et al. (2015) evaluated the clean energy alternatives in Jiangsu Province and verified the priority of clean energy options such as solar photovoltaic (PV), wind, biomass, and nuclear energy. In order to absorb more wind resource, Zhao et al. (2009) and Hong et al. (2012) considered the use of more wind resources and investigated development strategies for wind integration, including flexible power plants, transmission grids, and energy storage. Nevertheless, a few system planning studies examining the regional power system consider the flexibility requirement brought by renewable energy generation.
This paper presents a planning model for the overall planning and deployment of the power system, integrated with increasing VRE resources, by incorporating the output and flexibility requirement resulting from wind and solar energy. It is significantly different from traditional capacity expansion planning model and is more suitable for the simulation of future renewable-dominated power system. The objective of the study is to provide possible integration options, such as installed and generation mixes, flexible power, and carbon emissions in long-term optimization paths. The results could provide evidence for constructing cleaner power systems by integrating highly variable renewable energy, utilizing available flexible power.
The remainder of this paper is organized as follows. The section Methodology describes the methodology of this study with detailed explanations of the wind–solar output model and the power system planning model. In the section Scenario Settings and Input Data, the input data and scenario setting are depicted. The section Results explains the main results of the wind–solar output and planning models. Finally, discussion and conclusion are presented in the section Discussion and Conclusion.
Methodology
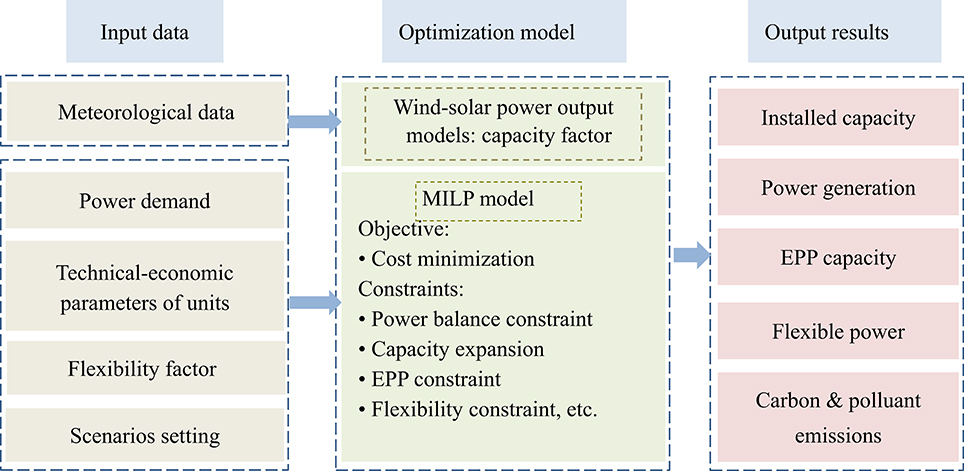
This section establishes the mixed integer linear programming (MILP) model of power systems to study the power structure and the optimization path of the Jiangsu power sector, as shown in Figure 1. The model considers the massive input data of technology and economic restraints, flexibility factors, power demand, etc., in an attempt to minimize the system cost by addressing the main planning constraints.
In order to integrate more renewable energy resources, notably wind and solar energy, it is essential to take into consideration the power output of wind and solar energy as well as the flexibility requirement due to fluctuating power generation in the constraints. We examine the wind and solar generation capability of Jiangsu Province using large amounts of historical meteorological data, reflecting its real power generation capacity of wind and solar. As a result, the actual capacity factor is input into the MILP model to further optimize the development path of low-carbon generation technologies in sustainable scenarios.
Wind–Solar Power Output Models
Wind and solar power generation depends on the magnitude of wind speed and solar radiation characterized by strong randomness. Wind speed is modeled by the Weibull distribution; the probability distribution function is given in Appendix A1.
The expected output power is defined as follows:
where v is the wind speed, f(v) is the probability density function (PDF), P(v) is the output power of a wind turbine, Pr is the rated power, vc is the cut-in wind speed, vr is the rated wind speed, and vf is the cut-out wind speed.
Solar PV power generation depends on the solar radiation intensity fitted by the Beta distribution (Wang, 2017). The PDF of the Beta distribution is given in Appendix A2. The solar to power conversion model is developed on account of the PV panel solar output (Wang et al., 2013), as shown below:
where P(It) is the output power of a PV panel, δ is the panel derating factor, Y is the PV array capacity, It is the radiation intensity, Is is the standard radiation intensity, φ is the temperature power coefficient, Tcell is the PV array surface temperature, and Ts is the standard testing condition of PV cell temperature.
The actual capacity factor is approximated by the actual output power to maximum power production ratio. For a wind turbine or PV panel, the capacity factor is calculated as:
where cf is the capacity factor, P is the output power per unit wind turbine or PV panel, and Pr is the nominal capacity per unit wind turbine or PV panel.
Optimization Model
In this section, the power system planning model is built to make decisions on the capacity expansion of power plants and the efficiency power plant (EPP), as well as flexible power, which determines the least-cost planning path of power systems. The mathematical formulas of the objective function and constraints are explained in the following.
Objective Function
The objective of the model is to minimize the system cost relating to the decision variables during the planning period, that is, from 2018 to 2050. This means that the objective function consists of capital cost, operation cost, and fuel cost of generator units, as well as the demand side investment cost, as shown in Equation (4). In addition, the subsidy of renewable generation is incorporated into the cost system to examine how the subsidy policy affects the power structure.
where T is the length of the planning period, and , , , , and give the generator units' capital cost, operation and maintenance cost, fuel cost, EPP investment cost, and the subsidy in year t, respectively. ϵt is a binary variable with value “0” for no subsidy and “1” otherwise, and r is the discount rate.
Capital cost of generator units
The capital cost is broken down by year for the lifetime of generator units.
where j is the power plant type, such as coal, gas, hydropower, nuclear, wind, PV, and biomass; is the investment cost per unit capacity of power plant type j in year t; is the new installed capacity of power plant type j in year t; and Yj is the expected lifetime of power plant type j.
Operation and maintenance cost
The operation and maintenance (O&M) cost of generator units in year t is calculated as follows:
where is the operation and maintenance cost per unit capacity of power plant type j in year t, is the total installed capacity of power plant type j in year t, εj is the efficiency coefficient of power plant type j, and is the annual operational hours of power plant type j in year t.
Fuel cost
Fuel cost is calculated from the fuel price and power generation in year t.
where is the fuel cost per unit capacity of power plant type j in year t.
Investment cost of EPP
The installation cost of EPP is converted into the annual equivalent cost as follows:
where d is the EPP type, which includes the energy-saving motor, the energy-saving lamp, the ice thermal storage, and the energy-saving transformer; is a binary variable with value “1” if the EPP type d is applied in year t and “0” otherwise; is the investment cost per unit capacity of EPP type d in year t; Rd is the new installed capacity of EPP type d in year t; and Yd is the expected lifetime of EPP type d.
Electricity price subsidy
The electricity price subsidy for each generation technology is calculated as:
where is the electricity price subsidy per kilowatt-hour of power plant type j in year t.
Constraints
Power load constraint
The total power generation, net input power, and EPP load should meet the maximum yearly power load demand.
where is the maximum load coincidence factor of EPP type d in year t; is the total capacity of EPP type d in year t; is the power transmitted from other regions in year t; and is the maximum power load demand in year t.
Power supply and demand constraint
The annual power supply and demand must be balanced. The transmission of power and reduction in power demand should be taken into consideration.
where is the total capacity of EPP type d in year t; is the annual operational hours of EPP type d in year t; is the efficiency coefficient of EPP type d in year t; is the net input power in year t; and Et is the total power demand in year t.
Installed capacity constraint
The total installed capacity is calculated as follows:
where is the available capacity of power plant type j at the end of year t-1; and is the available capacity of EPP type d at the end of year t-1.
The constraint of the total installed capacity is presented as:
where is the installed ceiling of power plant type j in year t.
The expansion potential of generator units is limited by technical maturity and resource capacity. The annual new installed capacity of each power generation technology is limited as follows:
where is the upper limit of the annual new installed capacity of power plant type j in year t.
Flexibility constraint
The flexibility requirement of the power system due to fluctuations in renewable energy generation needs to be met by adjusting the power structure (Sullivan et al., 2013). Besides, part of the power demand is satisfied by flexible generation technologies.
where fj is the flexibility coefficient of power plant type j; and fd is the flexibility coefficient of the demand load.
CO2 emission constraint
The CO2 emission constraint is set in accordance with the Chinese carbon emission peak policy. The upper limit is scheduled to decrease every year after 2030.
where is the carbon emission factor per kilowatt-hour of type j of the power plant in year t; is the upper limit of carbon emission in year t.
NOx and SO2 emission constraints
The pollutant constraints in the power sector are calculated as:
where is the NOx emission factor for power plant type j in year t; is the upper limit for NOx emissions; is the SO2 emission factor for power plant type j in year t; and is the upper limit for SO2 emissions.
Scenario Settings and Input Data
There are six scenarios to examine the impacts of power demand, subsidies, and carbon emission reduction targets on the power technology development path in Jiangsu, as shown in Table 1. The electricity received from the outside is set as low, medium, and high. The electricity price subsidies and carbon price are assumed in Appendix B.
The upper limits of the new installed capacity of the various power generation modes during the planning period are assumed to be subjected to the resource reservation and exploitation limitation. According to Zhang et al. (2017), Ye (2013) and, Wang et al. (2014), the annual maximum installed capacity of each type of unit is calculated as follows. The ceiling for coal and gas power units is 9.36 and 5.2 GW, respectively, whereas the ceiling for wind and solar PV power is 3.64 GW. Once the “Second Nuclear Power Plant” proposed by the “13th Five-Year Plan of Jiangsu Province” commences generation, the construction ceiling of nuclear and hydropower will be 3.12 and 1.56 GW, respectively. The potential of biomass energy is about 0.52 GW.
The power supply planning for east China and the development plan for the state grid corporation expect the power from outside of Jiangsu to gradually increase from 36 GW in 2020 to 56 GW in 2050. The CO2, SO2, and NOx emission factors are considered in accordance with the coal consumption per unit power generation as well as the Jiangsu government's regulation on the desulfurization and out-of-sale rate (Cheng et al., 2015). The fuel prices of coal, natural gas, uranium, and biomass are assumed on the basis of energy price predictions in the IMCTC (2019), CHDN (2019), Mao and Wang (2010), and Gao and Fan (2010). The techno-economic parameters of power generation technologies, such as life time, output factor, annual utilization hours, investment cost, and O&M cost, are listed in Table 2 (Ye, 2013). The annual discount rate is 0.05.
The flexibility factor of each generation technology type represents its flexibility contribution to system operation; this ranges from −1 to 1 (Sullivan et al., 2013). As Table 3 shows, wind and solar power requires great flexibility to smoothen their fluctuating generation; this can make their flexibility factor negative. Gas and hydropower, as well as biomass, could provide rapid responsiveness for fluctuating power; this can make their flexibility factor significant. As a base power source, coal power plants are not suitable for frequent starts and stops; this makes their flexibility factor slightly lower. Nuclear energy production is stable, but it is inconvenient to start and stop, providing flexible power output. Thus, its flexibility is 0. Besides, a part of the power demand needs to be met by flexible power.
Results
The generation capability of wind and solar energy is calculated from the weather data and is substituted into the optimization model to represent the actual output of wind and solar energy. The planning results give the power structure predictions for Jiangsu Province from 2020 to 2050, exploring the transformation scenarios of the future power system, including the optimization path of the generation mixes, the emission path of air pollutants, and the development path of the EPP.
The Power Output of Wind and Solar Energy
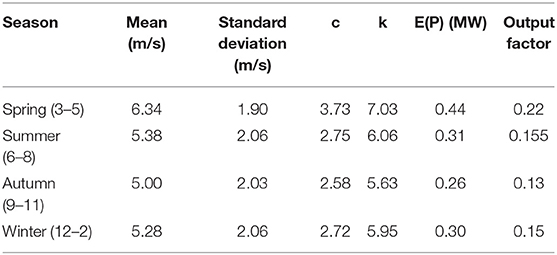
The output factor of wind power shown in Table 4 is calculated taking the 2-MW Vestas V80 onshore wind turbine as an example. The output of wind energy in winter and spring is relatively high, whereas that in autumn is relatively low. The annual average output factor is about 0.1635, just below the output factor in spring. That is, seasonal fluctuations are obvious.
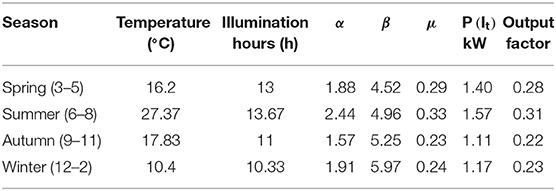
Referring to the Wuxi Suntech standard series of 5-kW polysilicon, the output factor of solar power calculated is shown in Table 5. The illumination time is relatively longer in spring and summer. The actual output of PV modules reaches 1.57 kW in summer with 31% output capability. However, the output of solar energy in autumn and winter is relatively low. The annual average output factor is 0.26, below the potential spring and summer output factor.
Planning Results
Power Generation Capacity Expansion
Figure 2 compares the installed capacity and power generation under three demand scenarios to generally show significant increases in both. The total installed capacity increases from 116 GW in 2018 to 248 GW in the REF and 275 GW in the HD scenarios by 2050. Similarly, power generation reaches 975.7–1,108.1 TWh in 2050 to meet the growing electricity demand.
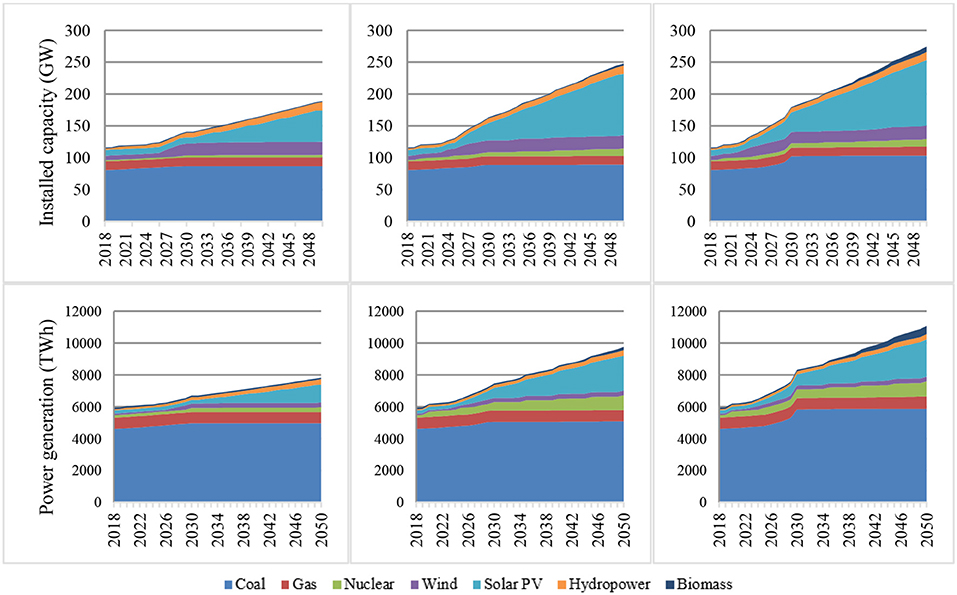
Figure 2. Installed capacity and power generation in different demand scenarios (from left to right: LD, REF, and HD scenarios).
From the perspective of power generation technologies, the generation mix changes from fossil-based energy to clean energy, as shown in Figure 3. The installed capacity of coal-fired technologies dominates initially, accounting for 67% of the total capacity in 2020, but then shows a significant decline in share after 2030, gradually substituted by the generation capacities of clean energy resources such as wind, solar PV, and hydropower technologies. Specially, the installed capacity of wind and solar energy resources increases significantly from 16 GW (14%) in 2020 to 117 GW (47%) in 2050. Correspondingly, the power generation from wind and solar PV reaches 264 TWh (24%) in the HD scenario in 2050, becoming the major power generation technology next to coal.
Resource constraints and policy restrictions have restrained the capacity growth of hydropower and nuclear energy, which increased only slightly, to have a relatively small share in the future capacity expansion. The application of biomass is confined by costly potential. Specially, the generation capacity of coal-fired power plants is higher in HD than in REF, probably due to the higher power demand that has to be satisfied on the premise of fixed total installed capacity.
Figure 3 Installed capacity and power generation (from left to right: LD, REF, and HD scenarios)
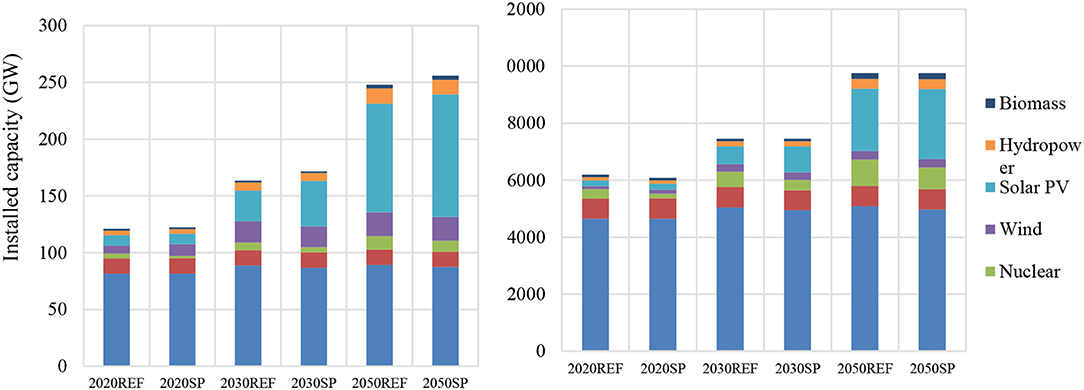
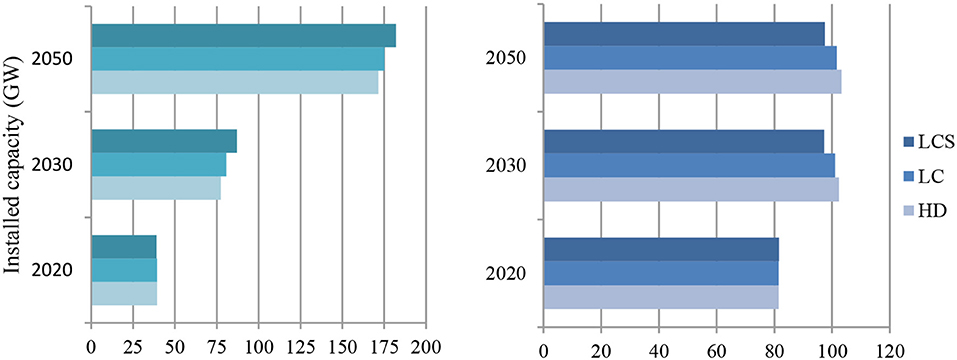
Figure 4 compares the installed capacity and power generation between the REF and SP scenarios. Non-fossil fuel subsidies facilitate the construction and utilization of cleaner energy resources; this is more obvious after 2030 with 17% addition of nonfossil energy installation compared to that in REF. Take a special attention on solar PV; the generation capacity increases from 921 to 10,784 GW, representing explosive growth. However, wind power generation reaches 29.9 TWh by 2050, accounting for only 3% of the total generation due to the fact that the subsidies for wind power will be canceled in 2020. Similarly, in spite of considerable subsidies, gas and biomass show limited development because their high cost is responsible for weak competitiveness.
Carbon emission control policies led to a change in the power generation mix. Coal-fired units have been widely employed to meet the increasing power demand and peak load requirements; however, the need to reduce carbon emissions has led to their regulation. As shown in Figure 5, coal-fired generation shows an increase during 2020–2030 and then remains stable during 2030–2050. The generation capacity in the LCS scenario decreases by 6 GW in 2050 compared to that in HD. Conversely, clean energy, consisted of wind, PV, nuclear, and biomass, will be supported extensively under the emission mitigation policies. By 2050, coal-fired and clean energy generation will reach 555 and 553 TWh, respectively, that is, almost equal, thus replacing coal-fired generation.
EPP
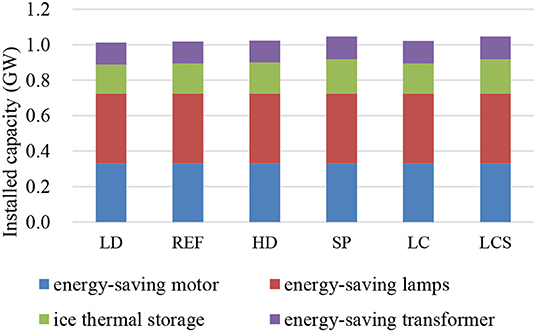
EPP, characterized by environment-friendly energy conservation, is an ideal alternative electricity technology. The increasing demand loads would provide adjustable power demand to respond to the fluctuating power supply under demand-side management measures. Figure 6 demonstrates the capacity of EPP in six scenarios. Taken as a whole, EPP would be incorporated in SP and LCS scenarios on a large scale. In particular, energy-saving lamps and energy-efficient motors will be applied widely, the total capacity of which will reach 0.7 GW in 2050. It is undeniable that load resources will play an important role in the future renewable-based power system with growing power generation from VRE.
System Flexibility
The flexibility requirement of a power system is calculated according to the power generation and flexibility factors. As Figure 7 shows, the flexibility requirement gradually increases in the LD, REF, and HD scenarios to reach 1,017.6, 1,292.8, and 1,394.7 TWh, respectively, in 2050, with growth rates of 46.79, 83.57, and 97.62%, respectively, compared to 2020.
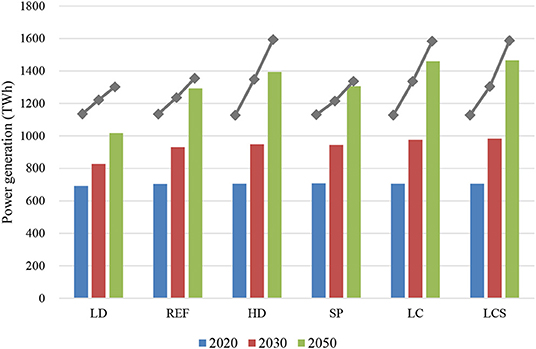
Figure 7. The flexibility requirement and supply in six scenarios (histogram for flexibility requirement, line graph for flexibility supply).
Compared to the REF scenario, the SP scenario shows faster growth in flexibility requirement, which reaches 1,306.3 TWh in 2050. This is mainly due to the government subsidies for renewable energy, which result in rapid development of wind power and photovoltaics and higher flexibility requirement. Furthermore, the flexibility requirements of the LC and LCS scenarios reach 1,489.7 and 1,465.1 TWh in 2050, with growth rates of 106.82 and 107.71% relative to 2020. The power sector would deploy more non-fossil energy, notably renewable energy, to meet the increasing power demand and high emission targets.
The flexibility supply in six scenarios collectively exceeds the flexibility requirement, with fill rates (supply/requirement) of 127.52, 104.52, 114.15, 102.35, 108.47, and 108.34%, respectively. This indicates that the actual available flexible power can basically meet the flexibility requirements, but might become relatively short in the REF, SP, LC, and LCS scenarios.
Carbon and Pollutant Emissions
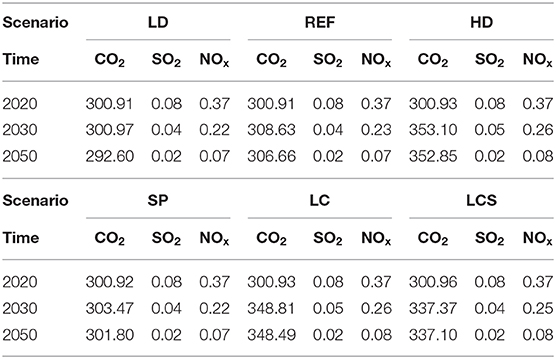
Table 6 compares the emissions of SO2, NOx, and CO2 in six scenarios from 2020 to 2050. The CO2 emissions maintain a certain growth before 2030. In 2030, the total carbon emissions reach 300.9, 308.6, and 353.1 million tons in the LD, REF, and HD scenarios, respectively, indicating a certain increase. However, the carbon emission is slightly lower in the SP scenario because the subsidies for renewable energy will facilitate the replacement of coal-fired power generation with clean energy power generation. Besides, the CO2 emission reductions in the LC and LCS scenarios are 15.75 and 4.36 million tons, respectively, compared with that in the HD scenario in the context of high power demand. It explains why the enhanced low-carbon policy has significant effect on emissions reduction.
Pollutant emissions gradually reduce during the planning period. SO2 emissions will reduce from 0.08 to 0.01 million tons, while those of NOx will reduce from 0.4 to 0.07 million tons in the REF scenario. There are higher emissions in the HD scenario, indicating a positive relationship between electricity demand and pollutant emissions. On the contrary, SO2 and NOx emissions are lower in the SP and LCS scenarios than in the REF and HD scenarios. This is because policy subsidies and enhanced low-carbon constraints have stimulative impacts on pollutant emissions. In the future, the impact of renewable energy instead of thermal power on gas emissions is not significant as the desulfurization and denitrification rate of thermal power units will reach 99% and 95%, respectively.
Discussion and Conclusion
This paper presents a planning method to find the cost-optimal planning path for the power system in Jiangsu Province taking into account the fluctuating power generation of wind and solar energy. Results show that the generation mix is subject to multiple factors, such as resource potential, subsidies, and carbon emission policies. A diversified power supply plan is provided for the whole planning horizon, where non-fossil energy is projected to contribute 58% of the installed capacity by 2050. However, the installed capacity of coal-fired units will reach 103 GW by 2050 under a high power demand scenario, well above the 87 GW in LD and 89 GW in REF. It is proved that the power demand is the major factor in motivating the expansion of coal power generation. Consequently, it is difficult to find a significant substitute for coal power with increasing power demand. Accordingly, carbon emission reduction continues to be a challenge even though carbon emissions will peak before 2030.
As stated above, subsidies facilitate the deployment of clean energy resource by converting coal-based power generation into renewable-based power generation. However, this effect will slow down in the subsequent planning period owing to the cancellation of subsidies for wind and solar power. The learning effect could be an alternative development path to further reduce the generation cost of wind and solar PV expansion. Furthermore, gas and biomass power show no much capacity expansion during the whole planning horizon because subsidies could not greatly offset their high generation costs. In order to boost the non-fossil energy generation, it is vitally important to put the focus on the subsidies for gas and biomass once wind and solar generation technologies become increasingly mature.
The flexibility requirement of wind and solar power as well as the demand side can be basically met by the existing flexible power generation technologies. Nevertheless, no much surplus flexible power will be available to respond to the increasing fluctuating renewable energy generation by 2050, especially in the REF and SP scenarios. That is, more flexibility resources need to be explored to largely integrate the penetration level of renewable energy, such as energy storage technologies and demand side response, as well as interregional transmission. These have not been considered in this paper owing to limited data availability and model computing power. However, flexible generation technologies may carry a greater expectation in scenarios of power demand, subsidies, and carbon emission control, which is attributed to the cost advantage and mature technology.
In the future, carbon capture and storage (CCS) technology will be widely applied in power systems to mitigate climate change, and hence should be included in the next power system planning. In addition, the planning on high temporal resolution should be focused in the future power systems with increasing VRE.
Data Availability Statement
All datasets generated for this study are included in the article/Supplementary Material.
Author Contributions
TL and XD designed the study and wrote the final paper. QY was responsible for the data collection. JX and JG built and calculated the model. All authors have made a significant contribution to this research and read and approved the final manuscript.
Funding
This study was supported by the Humanities and Social Sciences Planning Project of the Ministry of Education (16YJA790037), Social Science Foundation of Jiangsu Province (16JD007), and Key Program of Philosophy and Social Science of Jiangsu Education Department (2017ZDTXM022).
Conflict of Interest
The authors declare that the research was conducted in the absence of any commercial or financial relationships that could be construed as a potential conflict of interest.
Acknowledgments
We are grateful to all our colleagues in the department for numerous discussions on the power system planning model results.
Supplementary Material
The Supplementary Material for this article can be found online at: https://www.frontiersin.org/articles/10.3389/fenrg.2020.00039/full#supplementary-material
References
CHDN (2019). 2018 Natural Gas How Much a Cubic−2018 National Natural Gas Price List Introduction. Available online at: https://www.xyj321.com/zx/67556.html
Cheng, R., Xu, Z., Liu, P., Wang, Z., Li, Z., and Jones, I. (2015). A multi-region optimization planning model for china's power sector. Appl. Energy 137, 413–426. doi: 10.1016/j.apenergy.2014.10.023
China energy medium and long term development strategy research group (2011). China Energy Medium and Long-Term (2030, 2050) Development Strategy Research. Electric Power, Oil and Gas, Nuclear Energy, Environment Volume. Beijing: Science Press.
Deason, W. (2018). Comparison of 100% renewable energy system scenarios with a focus on flexibility and cost. Renew. Sustain. Energy Rev. 82, 3168–3178. doi: 10.1016/j.rser.2017.10.026
Deng, X., and Lv, T. (2020). Power system planning with increasing variable renewable energy: a review of optimization models. J. Clean. Prod. 246, 1–15. doi: 10.1016/j.jclepro.2019.118962
Fan, J. L., Wang, J. X., Hu, J. W., Wang, Y., and Zhang, X. (2019). Optimization of China's provincial renewable energy installation plan for the 13th fve-year plan based on renewable portfolio standards. Appl. Energy 254, 1–16. doi: 10.1016/j.apenergy.2019.113757
Gao, H., and Fan, J. (2010). Economy and Economic Aggregate of Renewable Energy Power Generation in China. Beijing: China Environmental Science Press.
Gils, H. C., Scholz, Y., Pregger, T., Luca de Tena, D., and Heide, D. (2017). Integrated modelling of variable renewable energy-based power supply in Europe. Energy 123, 173–188. doi: 10.1016/j.energy.2017.01.115
Hong, L. X., Lund, H., and Möller, B. (2012). The importance of flexible power plant operation for Jiangsu's wind integration. Energy 41, 499–507. doi: 10.1016/j.energy.2012.02.038
IMCTC (2019). China Thermal Coal Price Index. Available online at: http://www.imcec.cn/zgdm.2019-02-19
Jiangsu Provincial People's Government (2017). The 13th Five-Year Energy Development Plan of Jiangsu Province. Available online at: http://dpc.wuxi.gov.cn/doc/2017/05/16/1323177.shtml
Li, D., Liu, J. Y., Liu, Y. B., and Gao, H. J. (2015). Joint secure & economic dispatch considering wind power, pumped storage and demand response. Electr. Power Autom. Equip. 35, 28–34. doi: 10.16081/j.issn.1006-6047.2015.02.005
Liu, J., Zhang, D., Cai, J., and Davenport, J. (2019). Legal systems, national governance and renewable energy investment: evidence from around the word. Br. J. of Manage. doi: 10.1111/1467-8551.12377. [Epub ahead of print].
Mao, Z., and Wang, C. (2010). Assessing the climate impact of renewable energy targets by bottom-up modeling. International Conference on Intelligent System Design & Engineering Application. IEEE Comput. Soc. 1, 394–399. doi: 10.1109/ISDEA.2010.112
National Bureau of Statistics (2019). National Economic and Social Development Statistics Bulletin 2018. Available online at: http://data.stats.gov.cn/easyquery.htm?cn=C01
Pereira, S., Ferreira, P., and Vaz, A. I. F. (2017). Generation expansion planning with high share of renewables of variable output. Appl. Energy 190, 1275–1288. doi: 10.1016/j.apenergy.2017.01.025
Scholz, Y., Gils, H. C., and Pietzcker, R. C. (2017). Application of a high-detail energy system model to derive power sector characteristics at high wind and solar shares. Energy Econ. 64, 568–582. doi: 10.1016/j.eneco.2016.06.021
Sullivan, P., Krey, V., and Riahi, K. (2013). Impacts of considering electric sector variability and reliability in the MESSAGE model. Energy Strateg. Rev. 1, 157–163. doi: 10.1016/j.esr.2013.01.001
Sun, Y. W., Wang, R., Liu, J., Xiao, L. S., Lin, Y. J., and Kao, W. (2013). Spatial planning framework for biomass resources for power production at regional level: a case study for Fujian Province, China. Appl. Energy 106, 391–406. doi: 10.1016/j.apenergy.2013.02.003
Wang, B., Liu, L., Huang, G. H., Li, W., and Xie, Y. L. (2018). Effects of carbon and environmental tax on power mix planning – A case study of Hebei Province, China. Energy 143, 645–657. doi: 10.1016/j.energy.2017.11.025
Wang, C., Ye, M., Cai, W., and Chen, J. (2014). The value of a clear, long-term climate policy agenda: a case study of china's power sector using a multi-region optimization model. Appl. Energy 125, 276–288. doi: 10.1016/j.apenergy.2014.03.079
Wang, C. S., Hong, B. W., and Guo, L. (2013). Dispatch strategies of PV-battery microgrid in different scenarios. Power Syst. Technol. 37, 1775–1782. doi: 10.1371/journal.pone.0088481
Wang, J. (2017). Research on planning optimization of distributed photovoltaic power plants in connection with distribution network (maeter's thesis). Southeast University, Nanjing, China.
Ye, M. (2013). Regional optimization model and emission control policy simulation for China's power sector (maeter's thesis). Tsinghua University, Beijing, China.
Zhang, L., Zhou, P., Newton, S., Fang, J. X., and Zhou, D. Q. (2015). Evaluating clean energy alternatives for Jiangsu, China: an improved multi-criteria decision making method. Energy 90, 653–964. doi: 10.1016/j.energy.2015.07.124
Zhang, N., Hu, Z., Shen, B., He, G., and Zheng, Y. (2017). An integrated source-grid-load planning model at the macro level: case study for China's power sector. Energy 126, 231–246. doi: 10.1016/j.energy.2017.03.026
Zhao, Y., Hao, L. S., and Wang, Y. P. (2009). Development strategies for wind power industry in Jiangsu Province, China: based on the evaluation of resource capacity. Energy Policy 37, 1736–1744. doi: 10.1016/j.enpol.2008.12.038
Zhao, Y. H., Cao, Y., Shu, X. P., Li, H., Shi, Q. L., and Zhang, Z. H. (2020). How China's electricity generation sector can achieve its carbon intensity reduction targets. Sci. Total Environ. 706, 1–13. doi: 10.1016/j.scitotenv.2019.135689
Zhou, Y., Wu, W. X., Hu, Y., Fang, X., and Liu, G. X. (2010). The assessment of available solar energy resources potential in Jiangsu Province. Renew. Energy Resour. 28, 10–13. doi: 10.13941/j.cnki.21-1469/tk.2010.06.042
Keywords: generation mix optimization, wind–solar power output, flexibility requirement, low-carbon power system, renewable energy
Citation: Lv T, Yang Q, Deng X, Xu J and Gao J (2020) Generation Expansion Planning Considering the Output and Flexibility Requirement of Renewable Energy: The Case of Jiangsu Province. Front. Energy Res. 8:39. doi: 10.3389/fenrg.2020.00039
Received: 24 December 2019; Accepted: 26 February 2020;
Published: 31 March 2020.
Edited by:
Xunpeng Shi, University of Technology Sydney, AustraliaReviewed by:
Martina Siskova, University of British Columbia, CanadaYanfen Zou, Jiangxi University of Finance and Economics, China
Copyright © 2020 Lv, Yang, Deng, Xu and Gao. This is an open-access article distributed under the terms of the Creative Commons Attribution License (CC BY). The use, distribution or reproduction in other forums is permitted, provided the original author(s) and the copyright owner(s) are credited and that the original publication in this journal is cited, in accordance with accepted academic practice. No use, distribution or reproduction is permitted which does not comply with these terms.
*Correspondence: Xu Deng, ZGVuZ3h1eEAxNjMuY29t
 Tao Lv
 Qi Yang1,2
 Xu Deng
 Jie Xu
 Jian Gao