 Zhenghui Li
 Yaya Su
- 1Guangzhou International Institute of Finance and Guangzhou University, Guangzhou, China
- 2College of Finance and Statistics, Hunan University, Changsha, China
We study the time-frequency dynamics of stochastic volatility spillovers between international crude oil markets and China's commodity sectors in the spectral representation framework of generalized forecast error variance decomposition (GFEVD). We find evidence that international crude oil markets has significant volatility spillover effects on China's bulk commodity markets, and the volatility spillovers are sensitive to extreme geopolitical or financial events. The net spillovers of international oil markets are almost positive and driven mainly by short-term components (within a week). However, uncertain financial factors from China such as the market-oriented reform in 2013 and the stock disaster in 2015 adversely affect the net oil-commodity volatility spillovers through the medium-term components (week to a month) and long-term components (month to a year). Moreover, the volatility spillover effects of crude oil prices on different commodity sectors in China are heterogeneous. Metal, coal coke, and steel ore and energy commodity sectors are more affected by crude oil prices, whereas nonmetal building materials and agricultural commodities are less affected. These outcomes implement necessary implications for investors and policymakers.
Introduction
In recent years, the linkages between oil and other commodity prices (including metals, industries, and agriculture) have increased (Ji and Fan, 2012; Wang et al., 2014; Luo and Ji, 2018) owing to the “financialization of commodities” (Vivian and Wohar, 2012; Creti et al., 2013; Fattouh et al., 2013; Adams and Glück, 2015; Basak and Pavlov, 2016; Liu K. et al., 2019; Liu Y. et al., 2019). In addition, the continuous replacement of fossil fuels by biofuels and the large-scale hedging strategies proposed for inflation caused by high oil prices have also enhanced the correlation of oil commodities (Ji and Fan, 2012). Affected by global economic fluctuations and geopolitical events, crude oil prices are prone to severe turbulence. For example, during the 2008 financial crisis, West Texas intermediate (WTI) crude oil prices fell by 75%, and then in the second half of 2014, international oil prices plummeted again, with a total drop of 50%. In China, the world's largest oil consumption economy, crude oil consumption has been increasing significantly. In 2018, it consumed 651 million tons of crude oil. Moreover, since 1993, China has changed from a net oil exporter to a net importer, and its import volume has increased year by year. In 2018, China's annual oil import volume reached 462 million tons, whereas domestic oil production is only 189 million tons. As early as 2013, the United States Energy Information Administration (EIA) has announced that China is the largest net importer of crude oil in the world economy. At the same time, China has maintained high economic growth rates in the past 40 years since reform and opening-up. The considerable energy demand brought about by the rapid growth of China's economy has affected the world's energy and financial markets, attracting widespread attention from international investors. Therefore, research on the volatility spillovers between international crude oil and China's commodity markets is of paramount importance for both policymakers and financial market participants.
Considerable research has focused on the relationship between crude oil prices and the economies of developed countries (Du and He, 2015; Zhang et al., 2017; Apergis et al., 2018), whereas relatively few studies are on developing countries. Fluctuations in crude oil prices can affect both developed and developing countries. More importantly, owing to relatively immature financial policies and investors, the uncertainty of oil prices may even have a more significant impact on developing countries (You et al., 2017). Besides, countries that rely on crude oil imports are more sensitive to changes in oil prices. However, the research on developing countries especially China is inadequate, despite their increasingly economic importance (Caporale et al., 2015; Shi and Sun, 2017; You et al., 2017; Cheng et al., 2019; Wang and Wang, 2019). In this study, we take the Chinese commodity sector as an example to study the dynamic impact of crude oil price fluctuations on the economies of developing countries.
The main objective of the current study is to explore the time-frequency patterns in the relationship between international crude oil volatility and different types of China's commodity price, as well as to quantify the dynamic volatility spillovers. The relationship between crude oil price and commodity markets may change with frequency because of the heterogeneous economic agents that interact in different markets. Specifically, market participants operate at different time frequencies, mainly owing to differences in their beliefs, goals, preferences, and risk tolerance. Long-term, medium-term, and short-term investors take different investment strategies. With the promotion of different types of investors, financial asset price volatility is heterogeneous at different frequencies (Baruník and Krehlík, 2018; Balli et al., 2019; Reboredo et al., 2020). Therefore, it is reasonable to assume that there are persistent relationships at various levels and that the sources of the cross-frequency connection between oil and the Chinese commodity market are different.
Unlike traditional financial assets, such as stocks and bonds, the price behavior of commodities has its characteristics (Balli et al., 2019). Because both the supply side and the demand side of diverse commodities are affected by different processes, their market prices have various movements (Diebold et al., 2017). However, the financialization of commodities has increased the dependence between different commodity markets, such as energy, coal mines, materials, metals, and agricultural products. After controlling for macroeconomic and other factors, even the unrelated commodity prices tend to change together (de Nicola et al., 2016). Crude oil prices are effective in transmitting shocks to other commodity markets (Choi and Hammoudeh, 2010; Nazlioglu et al., 2013; Ahmadi et al., 2016; Luo and Ji, 2018; Lovcha and Perez-Laborda, 2020). However, although literature has focused on the association between crude oil prices and a particular class of commodity (mostly energy or agricultural commodities), the findings are mixed and ambiguous in general, which may due to different modeling techniques and timescales (Tiwari et al., 2020). Moreover, the existing literature pays little attention to the connectedness between crude oil prices and various essential commodities. This lack of research justifies further study.
The idea of volatility connectedness is essential for financial risk management (Liu, 2016; Frahm, 2018; Li et al., 2018) and it appears especially crucial for exploring the investment potential and risk reduction across different commodity categories. Nazlioglu et al. (2013) examine interrelationships between energy and agricultural markets by the Granger causality test on variance and find that the dynamics of volatility transmission change significantly following the food price crisis. Beckmann and Czudaj (2014) use the generalized autoregressive (AR) conditional heteroskedasticity (GARCH) in mean vector AR (VAR) models to investigate the volatility spillover between various agricultural futures markets. Their results provide evidence for the short-term volatility transmission process in agricultural futures markets. Mensi et al. (2014) use both VAR–[Baba–Engle–Kraft–Kroner (BEKK)]–GARCH and VAR–dynamic conditional correlation (DCC)–GARCH models and provide evidence of significant return and volatility spillovers between international energy and cereal commodity markets. Diebold and Yilmaz (2009, 2012) propose the generalized forecast error variance decomposition (GFEVD) framework to construct the volatility spillover index (DY, henceforth). The DY framework provides quantitative measures of the magnitude and direction of the dynamic spillovers and is particularly suitable for studying the evolution of volatility spillovers over time. Then Baruník and Krehlík (2018) extend the DY framework to the time-frequency domain, providing measurements to decompose the volatility spillover index into different frequency components (BK, henceforth). The time-frequency decomposition of volatility spillovers is critical to understanding the propagation mechanism of volatility.
Using the time-series framework, we adopt the methodological approach that comprises the stochastic volatility (SV) estimation proposed by Kastner and Frühwirth-Schnatter (2014) and the time-frequency volatility connectedness estimation proposed by Baruník and Krehlík (2018) in a multivariate framework. Although previous literature mostly used the implied volatility model (Vivian and Wohar, 2012; Efimova and Serletis, 2014; Youssef et al., 2015; Jiang et al., 2019), this study focuses on the SV model, because the volatility of commodity market price is a stochastic process, and the SV model can perform better than the implied volatility or historical volatility measurements (Yang and Hamori, 2018; Balli et al., 2019). The motivation for this study is that it is crucial to measure the dynamic connectedness among the commodity or futures markets and the determinants of volatility spillover effect through novel methodologies. This analysis would be essential for policymakers to formulate relevant policies and would also provide investors more enormous diversification benefits in the commodity market.
Therefore, this study makes several contributions to the literature. First, as far as we know, this study is the first to explore the dynamic volatility spillovers between crude oil price and various China's commodity sectors including precious metals, nonferrous metals, coal coke, and steel ore; nonmetal building materials; energy products; chemical products; grains; oils and fats; and soft commodities. Some empirical studies have investigated the volatility connectedness between crude oil price and commodities of a particular class or group, such as the agricultural commodities (Nazlioglu et al., 2013; Mensi et al., 2014; Wang et al., 2014; Luo and Ji, 2018), the energy commodities (Ng and Donker, 2013; Lovcha and Perez-Laborda, 2020), the precious metals commodities (Ewing and Malik, 2013; Bildirici and Turkmen, 2015), and the industries commodities (Choi and Hammoudeh, 2010). However, the results of the current literature examining the relationship between energy prices and other commodity prices are mixed and generally ambiguous, which may be due to the use of different models based on various assumptions and analysis of different timescales (Tiwari et al., 2020). Because different processes influence both the demand side and the supply side of commodities, various price movements are be observed in different commodity sectors (Balli et al., 2019; Ji et al., 2019). The central position of crude oil in commodity markets and the economy as a whole is crucial. After considering the interactions between widely traded commodities including agriculture, metals, industries, and crude oil, no significant contribution was made in measuring the volatility spillover effects. Given that risk management and the international portfolio diversification strategies are implemented at the sector levels, it is important to study the heterogeneous impact of crude oil prices on different commodity sectors. Therefore, we are trying to fill the research gap by investigating the volatility transmission mechanism between crude oil prices and China's commodity market at the disaggregated sectors level instead of the aggregate market level.
Second, we combine the SV model and the GFEVD framework of the DY (2012) (DY12) to explore the dynamic spillovers between crude oil markets and China's bulk commodity. Previous studies (Vivian and Wohar, 2012; Efimova and Serletis, 2014; Youssef et al., 2015; Jiang et al., 2019; Yang and Hamori, 2018) adopt models that use historical or implied volatility measures. We highlight that the volatility of crude oil and other commodity price is a naturally stochastic process and that the SV model is superior in modeling commodity volatilities due to limited assumptions. Moreover, the GFEVD framework is a simple and intuitive measure of interdependence of volatilities, and the economic interpretation of spillover indicators in the GFEVD framework is closely related to recently developed risk measurements. Thus, our combination of the SV model and the GFEVD framework provides strong evidence for risk management of commodity markets and international portfolio strategies.
Third, we investigate the volatility transmission mechanism between crude oil and commodities, with an emphasis on the volatility spillover effects generated by shocks with heterogeneous frequency response. By adopting the GFEVD framework of the DY12 and the extended time-frequency connectedness measures of the BK (2018) (BK18), we track the long-, medium-, and short-term volatility spillovers from pairwise to systemwide, in a coherent way. It is reasonable and necessary to investigate the oil-commodity volatility spillovers at different time frequencies because multiple economic agents generally operate on diverse investment horizons owing to their differences in beliefs, preferences, levels of information assimilation, or risk tolerance.
Finally, China is a favorable setting to gain insight into volatility spillover effects between international crude oil prices and commodities. With the rapid rise and the increasing importance of developing countries, the impact of crude oil prices on financial markets in developing countries has become an important issue. However, developing countries, in particular China, have not received adequate research attention. To the best of our knowledge, no study is available regarding the dynamic time-frequency spillovers between crude oil markets and China's bulk commodity sectors, and we are trying to fill this research gap.
The remainder of the study is structured as follows. Section 2 introduces the empirical methodology. Section 3 describes the data, whereas Section 4 depicts the empirical results and findings. The conclusions are shown in Section 5.
Empirical Methodology
Stochastic Volatility Models
Previous empirical studies rely mostly on time-series models such as the ARCH and GARCH models (Engle, 1982; Engle and Bollerslev, 1986) to capture volatility structure of commodity prices (Vivian and Wohar, 2012; Efimova and Serletis, 2014; Youssef et al., 2015; Jiang et al., 2019). However, these time-series models do not provide a clear unified methodology to reveal volatility dynamics operating between the involved variables and to identify structural changes (Jebabli et al., 2014). The ARCH or GARCH models aim to model the volatility in a deterministic specification, which may lead the models to be trapped into model misspecification. Even with standard Student t innovations, the performance of ARCH or GARCH models in capturing tail behavior of commodity prices is still limited. Some important attributes are shown in financial time series (e.g. the commodity prices), which may play an essential role in determining the results of estimates and hypothesis tests, including unit roots, cointegration, causality, and structural breaks (Bekiros and Georgoutsos, 2008; Maslyuk and Smyth, 2009; Chen et al., 2014; Liu, 2016). Besides, the ARCH or GARCH models are affected by the shocks to the second moments, which are dependent on the first moments. In many cases, it is difficult for the ARCH or GARCH models to obtain convergence of the optimization algorithms used to estimate the parameters.
Considering the above aspects, we adopt the SV model to characterize crude oil prices and commodity market price volatility. The SV model captures the volatility process probabilistically (Kastner and Frühwirth-Schnatter, 2014) and thus is superior in modeling leverage effect and considering excess skewness and kurtosis of financial time series (Shephard and Andersen, 2009; Yang and Hamori, 2018). Besides, the SV model has significant flexibility in capturing empirical volatility owing to its limited assumptions and ability to capture contemporaneous fluctuations (Hafner and Preminger, 2010). The SV model describes the volatility process as an unobserved component that follows a specific latent stochastic process, such as the AR process of order 1. Let, t = 1, …, T be the natural log return for commodities at time t. Then the SV model is specified as follows:
where εt and ηt are independent standard normal innovations for all t belonging in {1, …, T}. The unobservable process h = (h0, h1, …, hT) appearing in state equation (2) is usually interpreted as the latent time-varying volatility having the initial state distribution ho|r, ϕ, σ ~N(r, σ2/(1 − ϕ2)). The latent sequence controls the value or distribution of the observed data, especially the variance of the observed data. Equations (1, 2) are the SV model in its centered parameterization. Kastner and Frühwirth-Schnatter (2014) propose the centered parameterization of the above model:
Whether the first or second parameterization in the above model is preferred for estimation depends on “true” parameters (Kastner and Frühwirth-Schnatter, 2014). But the Markov chain Monte Carlo (MCMC) sampling techniques are necessary for Bayesian estimation because both of the parameters have intractable likelihoods. The authors also propose the ancillarity-sufficiency interweaving strategy (ASIS) to overcome the efficiency loss problem in the parameter estimation process. Kastner (2019) provides the R package stochvol to implement this method.
Volatility Spillover Measures
Since the global financial crisis (GFC), a growing number of studies are conducted to explore the connectedness between crude oil and commodity markets, and their methods can be broadly classified into several categories: VAR or structural VAR (SVAR) (Wang et al., 2014; de Nicola et al., 2016); GARCH models (Ji and Fan, 2012; Ewing and Malik, 2013; Jiang et al., 2019); Copula models (Koirala et al., 2015); nonparametric causality analysis (Nazlioglu et al., 2013); vector error correction model (VECM); Markov regime switching (MRS) models (Uddin et al., 2018); and forecast error variance decomposition (FEVD) (Diebold et al., 2017; Lovcha and Perez-Laborda, 2020). However, the previous literature generally underestimates connectedness among commodity markets of a particular class or group, while there are few studies focusing on the oil-commodity nexus at the industry level. Our research is different because we take into account commodities in various sectors and decompose the total volatility spillovers into different frequencies. The GFEVD framework, developed in a series of studies including Diebold and Yilmaz (2009, 2012, 2014), provides a simple and intuitive measure of interdependence of different asset returns or volatilities. This new methodology is adopted here because it can measure both the total and directional volatility spillovers between crude oil market and China's commodity sectors and can also reveal the levels of volatility spillovers within different markets. Moreover, the economic interpretation of the volatility spillover indices in the GFEVD framework is closely related to recently developed risk measurements (Diebold and Yilmaz, 2014), like the CoVaR (Adrian and Brunnermeier, 2011) or the marginal expected shortfall (Acharya et al., 2017). This is highly consistent with the goal of commodity market risk management in this article. On the other hand, the time-frequency version of the GFEVD framework developed by Baruník and Krehlík (2018) allows one to simultaneously capture the magnitude and direction of volatility spillovers over time and across frequencies. From an econometric point of view, this novel methodology not only captures time-varying information of volatility spillovers but also provides different frequency domains from aggregated correlations, which can identify specific frequencies that contribute the most to system connectedness.
Thus, we apply the GFEVD framework of DY12 to measure the volatility spillovers between crude oil prices and China's bulk commodity markets. Consider an N-variable VAR(P) system:
where Yt denotes the N × 1 vector at time t;εt is white noise; and ω1, ω2,…, ωp are coefficient matrices. With the N × N matrix lag-polynomial, , where Φ0 is the identity matrix and Φ1, …, Φp are the N × N coefficient matrices, we can rewrite model (5) as follows:
Next, we rewrite model (6) as the moving average process to get the dynamic structure in our system:
where Ψ(L) = [Φ(L)]−1. We employ the GFEVD of H-step forecast to examine how much each volatility variable contributes to explaining other volatility variables:
where H is the forecast horizon and Ψh is a N × N matrix of moving average coefficients at lag h defined above. Following Diebold and Yilmaz (2012), the volatility spillover is then defined by the shares of variance in the forecast contributed by other than own errors or equally as the ratio of the sum of the off-diagonal elements to the sum of the whole matrix:
where is the standardized effects denoted as
Because the generalized impulse responses and variance decompositions are invariant to the ordering of variables, the directional spillovers of the DY12 can be calculated by the normalized generalized variance decomposition matrix. So it is clear that can measure the SV spillover from the commodity market j to k, and SH can measure the total SV spillover in our system. To get the net spillover of international crude oil prices to China's bulk commodity markets, we further calculate the net SV spillover index:
Of course, can also be used to examine net spillovers between different commodity markets in China.
Time-Frequency Decomposition of Volatility Spillover Measures
However, the volatility spillovers among commodity markets are not the same at different time frequencies, because agents with different preferences operate on different investment horizons. Following the BK18, we consider the time-frequency dynamics of the SV spillovers. We use the spectral representation framework of the GFEVD to implement frequency decomposition. We define the generalized causation spectrum over frequency ω ∈ (−π, π) as follows:
where h = 1, …., H, which is the Fourier transform of Ψ, with . As noted by Baruník and Krehlík (2018), the forecast horizon H is not important as the GFEVD implemented here is unconditional. To obtain the generalized variance decompositions on frequency band d, d = (a, b), a, b ∈ (-π, π), we weight (f(ω))k,j by the frequency shares of the variance of the j-th volatility. Thus, the weighting function can be defined as follows:
The generalized variance decompositions on frequency band d are denoted as follows:
With the spectral representation of the generalized variance decompositions, we can easily calculate the scaled generalized variance decompositions:
where . Furthermore, we can calculate the total volatility spillover measures under the frequency band d as follows:
And the aggregate measure under frequency band d is
Thus, is defined as the frequency SV spillovers in our system. It is relatively easy to find the relationship between the frequency spillovers of the BK18 and the original total spillovers of the DY12:
where C is the total spillovers of the DY12.
Therefore, this study combines the SV model with the GFEVD framework and its time-frequency version to study the dynamic spillovers between the crude oil market and China's bulk commodity sectors. Our research framework provides a better understanding of volatility in the commodity price, as previous studies gauge crude oil and commodity prices by only using the historical or implied volatility measures. Based on the SV models, we further adopt the GFEVD framework and its frequency decomposition to evaluate the magnitude and direction of SV spillovers between oil prices and the different commodity sectors over time and across time frequency.
Data and Descriptive Statistics
In this paper, we mainly focus on the time-frequency dynamic spillovers among crude oil prices and China's bulk commodity sectors. Our underlying data are the daily spot closing prices of crude oil and commodity index in China. We adopt the WTI futures of the New York Mercantile Exchange from the EIA as the proxy for the benchmark of the international crude oil markets. We select a group of nine commodity sectors, including precious metals (NMFI), nonferrous metals (NFFI), coal coke and steel ore (JJRI), nonmetal building materials (NMBM), energy (ENFI), petrochemicals (CIFI), grains (CRFI), oils and fats (OOFI), and soft commodities (SOFI). Compared with the sectors in the existing literature (Chen, 2015; Jiang et al., 2019), these nine commodity sectors are comprehensive selections for the analysis of China's commodity markets. They can not only capture the price fluctuations of the entire commodity markets in China but also reflect the supply and demand relationship of different commodity sectors. According to data availability, the daily dataset of commodity sector price indices spans from 1 June 2009 to 31 May 2019, which yields a total of 2,434 observations from the Wind official database (http://www.wind.com.cn/). The Wind commodity sector indices, jointly compiled by Wind Corp., are based on a weighted average of the components selected for each sector. We exclude the Wind agricultural sideline products Index as the index starts at 01 September 2015. If we consider the agricultural sideline products sector, this will lead to a reduction in sample time by half. The selected commodity sectors and the particular components are reported in Table 1.
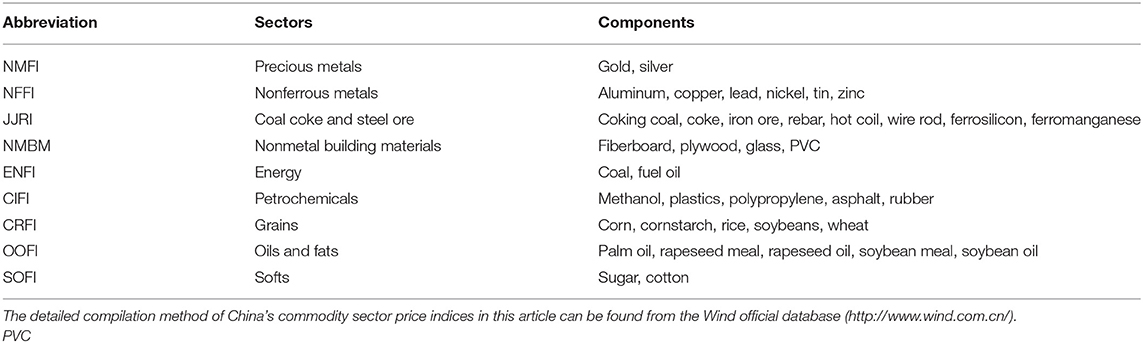
Table 1. China's commodity sectors and the detailed components.
In order to easily observe all price series, we plot the daily WTI oil price and China's commodity sector price indices in Figure 1. From Figures 1A,B, we can find that these indices produced significant fluctuations during the entire sample period. First, after the financial crisis in 2008, the price indices showed an upward trend. Subsequently, during the period 2010–2011, affected by the European sovereign debt crisis, these price indexes experienced the most dramatic fluctuations. The most striking feature is that in the second half of 2014: owing to the impact of imbalance between supply and demand, WTI crude oil prices experienced the largest plunge in the entire sample period, but the decline in China's commodity sector price indexes was relatively flat. Besides, owing to the impact of the Chinese stock market crisis in 2015, China's commodity sector price indexes dropped a lot and then slowly rose back to previous levels.
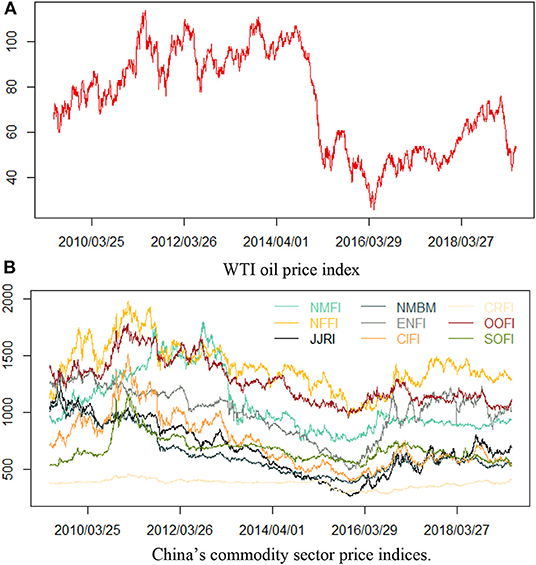
Figure 1. The plot of price indexes. WTI, West Texas intermediate.
Then we calculated their logarithmic returns, that is, rt = ln (pt/pt−1). We provide descriptive statistics for the log returns in Table 2. The mean values of the indexes are nearly zero, and the standard deviation for the crude oil is more significant than that of the nine commodity sector price indices. This shows that the international crude oil market is more unstable. From the skewness and kurtosis values, we can find that China's commodity sector price indices have various dynamic statistical characteristics. Except for JJRI, the skewness of the other variables is <0, which indicates that they have a left-biased distribution. The kurtosis in six commodity markets (NMFI, JJRI, NMBM, ENFI, CRFI, and SOFI) exceeds 3, indicating a leptokurtic distribution. And the kurtosis of the remaining commodity markets is <3, showing a platykurtic distribution. According to the results of the Jarque–Bera (J-B) test, all return series reject the null hypothesis of normal distribution at a significance level of 1%. The augmented Dickey–Fuller (ADF) test results show that all series are stable at a significance level of 1%. At last, according to the Ljung–Box Q(20) statistics, there are high-order autocorrelations in the return series of the six commodity markets (NMFI, NFFI, JJRI, ENFI, CRFI, and SOFI), whereas the remaining sectors do not.
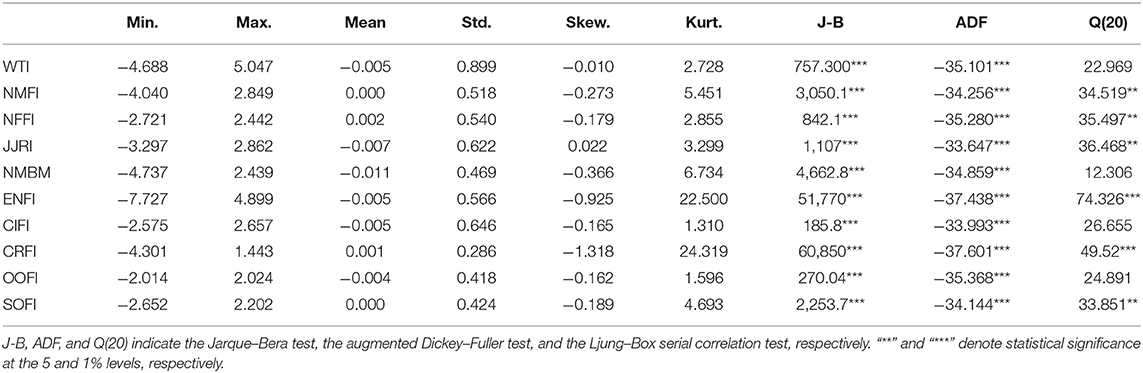
Table 2. Descriptive statistics of variables.
Empirical Results and Findings
The Stochastic Volatility Measures
Before starting MCMC for Bayesian estimation, we should specify the configuration and parameters. Following the Kastner and Frühwirth-Schnatter (2014), we choose the prior between 0 and 100 because it usually carries enough information. The prior variance of the logarithmic hyperparameter is set to 1. The burn-in size of MCMC aging size is set to 1,000, and the number of iterations after burn-in is set to 10,000. Last, to neutralize their possible effects, three thinning parameters are set as 1. Figure 2 is the plot of posterior quantiles of the latent volatilities in percentages.
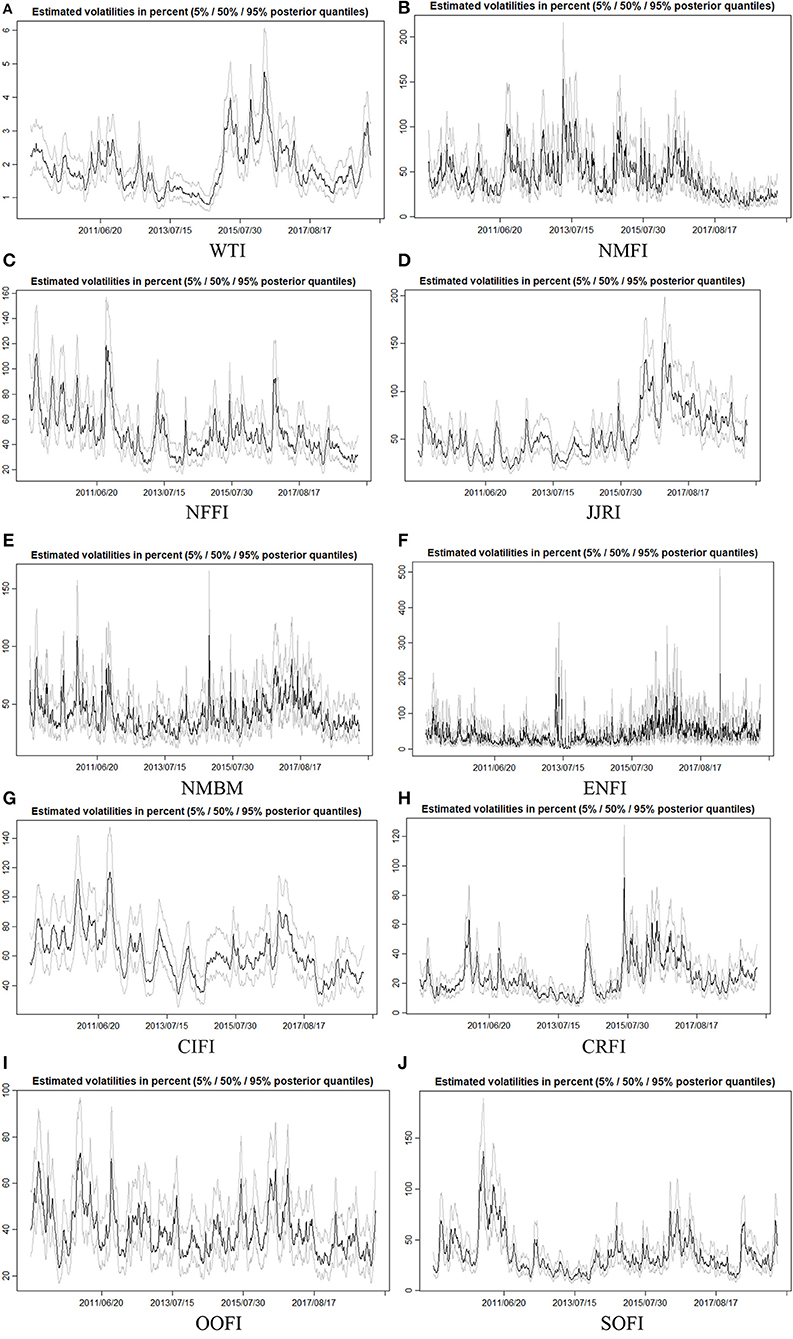
Figure 2. The plots of estimated posterior stochastic volatility levels. (A) WTI, (B) NMFI, (C) NFFI, (D) JJRI, (E) NMBM, (F) ENFI, (G) CIFI, (H) CRFI, (I) OOFI, and (J) SOFI.
Figure 2 summarizes the time-series plots of posterior quantiles of the latent volatilities in percentages.
The posterior 5, 50, and 95% quantiles are plotted. Further study of SV spillovers is based on the 50% quantile level of the latent volatilities, that is, SV. For the sake of brevity, plots of posterior and prior densities are retained. The results show excellent convergence during the estimation process. Additional graphic information is available upon request from the author.
Figure 2 presents that the volatility of WTI oil price and China's commodity sector price indices varies significantly in the time, which reinforces the use of the GFEVD framework with SV to avoid biased estimation because posterior estimates of stochastic volatilities are significant. We observe that SV of most of China's commodity sector price indices has some sub-periods with similar evolutions as WTI oil. In fact, often when high volatilities are observed for WTI oil prices, volatilities in China's commodity sector prices are observed, but with different magnitudes. This observation suggests that there is volatility transmission from international crude oil markets to China's commodity sectors. The GFEVD framework allows us to test for that. Figure 2 also illustrates that during the European sovereign debt crisis in 2011 and the Chinese stock market crisis in 2015, the SV of the variables is higher. This observation reveals the phenomenon of commodity market financialization. Moreover, Figure 2 also shows that the SV of different China's commodity sector prices is significantly heterogeneous. For example, compared with that of other sectors, the SV of precious metals (NMFI) commodities (Figure 2B) is less susceptible to crisis events. This indicates that precious metals can be used to hedge uncertainty and that it is an alternative investment tool. This feature of Figure 2 provides evidence for our subsequent study of the heterogeneous spillover effects of oil prices on different China's commodities sectors.
Dynamic Spillovers Between Crude Oil Prices and China's Bulk Commodity Sectors
We use the framework of GFEVD (DY12) to recover the dynamic spillovers between crude oil prices and China's bulk commodity sectors, and then we use the spectral representation of GFEVD (BK18) to investigate the time-frequency dynamic spillovers. According to Baruník and Krehlík (2018), if the forecasting horizon H < 100, the model is invalid. Consequently, we use a 100-day ahead forecasting horizon for variance decomposition, that is, H = 100. In fact, the forecast horizon H is not as important as the GFEVD implemented here, which is unconditional. Because the static results of the GFEVD framework over the entire sampling period may smooth out the results when the relationship between the variables changes over time (Lovcha and Perez-Laborda, 2020), this paper considers both the static and dynamic spillover effects to obtain more comprehensive estimations. For the dynamics of spillover effects, we employ the moving-window method to analyze the DY12 and BK18. Similar to the existing literature (Toyoshima and Hamori, 2018; Balli et al., 2019; Wang and Wang, 2019) we set the length of the window at 250 trading days, 370 trading days, and 500 trading days. We find that the plots of these trading days have almost the same trends. For the sake of simplicity, we only present the results of a rolling window of 500 trading days. The plots of other window lengths are available upon request from the authors. In addition, we choose the optimal lag order of the VAR according to the Akaike information criterion (AIC). In frequency domain, following Baruník and Krehlík (2018), we use Fourier transform to decompose the spillover measures of the DY12 into three different frequency bands. The frequency bands are up to 1 week, 1 week to 1 month, and 1 month to a year calculated as on the corresponding bands of d1 ∈ [1, 5], d2 ∈ [5, 20], d3 ∈ [20, 200] trading days. We refer to frequency bands accordingly as short-term, medium-term, and long-term frequencies.
First, we measure the total spillovers of the log returns in our system. Figure 3 shows total return spillovers of WTI futures and China's bulk commodity sectors. The left plot (Figure 3A) is measured by the DY(2012), and the right part (Figure 3B) is measured by the BK(2018). As shown in Figure 3A, the overall return spillover is informative and time varying. In the beginning, the total return spillover of the entire system is relatively high, which may be associated with the European sovereign debt crisis of 2010–2011, when financial institutions in some European countries were over-indebted and government debt could not be refinanced. At the same time, the political unrest in the Middle East and North Africa, particularly in countries such as Libya and Egypt, may contribute to the high level of the overall return spillovers. After the commodity markets started to recover from this crisis, the return spillovers slowly dropped back, reaching the lowest point around mid-2014. From the second half of 2014, the overall return spillovers began to increase dramatically, which may be influenced by the 2014 international crude oil crisis. Note that the overall return spillovers are at its second peak during 2015–2016, second only to the European debt crisis period, which may be related to the Chinese stock market disaster. In June 2015, the Chinese stock market experienced massive fluctuations with the Shanghai Composite Index fell from 5,174 points to 3,373 points. The disruption of the Chinese stock market increased the uncertainty of the oil market and commodity sectors, leading to a significant increase in the total return spillovers. The findings complement the finding of Balli et al. (2019) and Wang and Wang (2019), who reported that commodity markets displayed closer interconnectedness during financial crisis periods such as the GFC and China's 2015 financial crisis. After hitting the highest points, the total return spillovers slowly dropped again. Figure 3B displays the time-frequency dynamics of return spillovers. As seen in Figure 3B, the return spillovers of short-term frequency (in dark turquoise) display a similar trend with the total return spillovers in Figure 3A, whereas the return spillovers of medium-term (in deep pink) and long-term (in rosy brown) frequencies are both relatively smooth. Moreover, the return spillovers of the short-term frequency component are almost always more significant than those of the medium-term and long-term frequency components. Thus, it is evident that the return spillover in our system is driven mostly by the high-frequency information within a week. The frequency components of total volatility spillovers indicate that total return spillovers among crude oil and China's commodity sectors are mostly driven by the transmission of shocks in the short term.
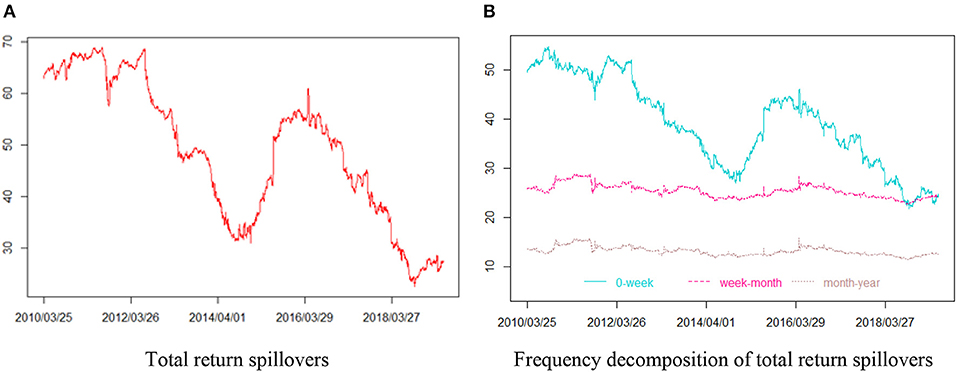
Figure 3. Total return spillovers of West Texas intermediate (WTI) futures and China's bulk commodity sectors. (A) The total return spillovers measured by Diebold and Yilmaz (2012), lag = 2, window size = 200. (B) The frequency decomposition measured by Baruník and Krehlík (2018), lag = 2, window size = 200. Short term: frequencies from 1 to 5 days' period (0 week, dark turquoise). Medium term: frequencies from 5 to 20 days' period (week–month, deep pink). Long-term: frequencies from 20 to 200 days' period (month–year, rosy brown).
We turn next to the overall volatility spillover in our system with the framework of the DY12 and the BK18 on the SV series. As shown in Figure 4, the total volatility spillovers display a “zig” pattern at first glance. Comparing Figure 4 with Figure 3, we see that the total volatility spillovers are more volatile than the total return spillovers and that the total volatility spillovers react more violently to extreme events than returns. In Figure 4A, during the 2010–2011 European sovereign debt crisis and 2015 China stock market disaster, the total volatility spillovers of the entire system are large. And the total volatility spillovers increased most sharply in 2014, which may be caused by the international oil crisis. In addition, we can also identify the impact of other important economic or geopolitical events from Figure 4A, such as Iran's geopolitical tensions in 2012, China's market-oriented reform on July 20, 2013 and Organization of Petroleum Exporting Countries's (OPEC's) production cut agreement at the end of 2017 and so on. Our findings are consistent with the view that these events represent important geopolitical and economic factors affecting risk spillovers or the shocks of oil supply and demand (Krehlík and Baruník, 2017; Wang and Wang, 2019). As displayed in Figure 4B, it is clear that the total volatility spillover in our system is also mainly driven by high-frequency information (in dark turquoise), although the contribution of the medium-frequency and low-frequency components is significant. In other words, the total risk spillover between crude oil and China's bulk commodity sectors is primarily driven by the transmission of shocks in the short term (within a week). This means that the commodity markets process information quickly, so the shocks on any commodity market are usually passed quickly to others within a week. Importantly, this result can help us better understand how financial shocks and geopolitical events affect frequency volatility spillovers among various commodity markets.
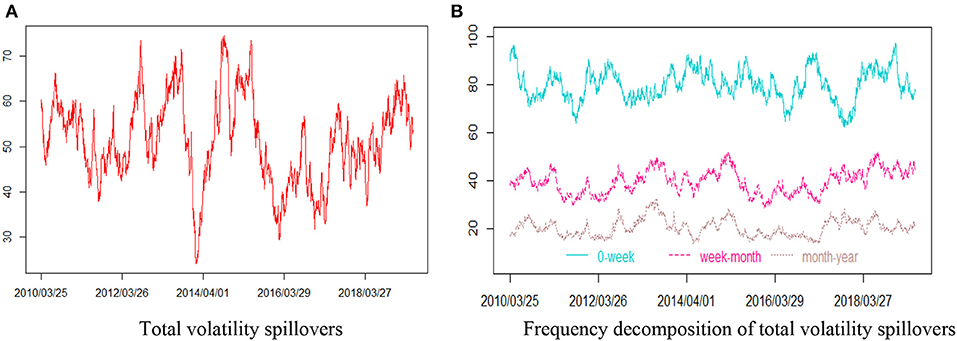
Figure 4. Total volatility spillovers of West Texas intermediate (WTI) futures and China's bulk commodity sectors. (A) The total volatility spillovers measured by Diebold and Yilmaz (2012), lag = 2, window size = 200. (B) The frequency decomposition measured by Baruník and Krehlík (2018), lag = 2, window size = 200. Short-term: frequencies from 1 to 5 days period (0-week, dark turquoise). Medium-term: frequencies from 5 to 20 days period (week-month, deep pink). Long-term: frequencies from 20 days to 200 days period (month-year, rosy brown).
Then, our empirical analysis focuses on the directional spillovers from crude oil prices to China's commodity sectors and their frequency components. As illustrated in Figure 5, the volatility spillovers from crude oil prices to China's commodity sectors also display a “zig” pattern, which implies the volatility spillovers from crude oil prices to China's commodity sectors are highly susceptible to economic and political global shocks. Some local increases or decreases in Figure 5 can be associated with the economic or geopolitical events that are affecting oil-commodity volatility spillovers. For example, volatility spillovers from the crude oil market to China's commodities sector, especially within the frequency band of up to 1 week, increased significantly in 2012, 2014, and 2018, which may be associated with Iran's geopolitical tensions in 2012, the international oil crisis in 2014, and U.S. economic sanctions on Iran in 2018. It is also noteworthy that the results of frequency decomposition in Figure 5B reconfirm that any information shocks from the crude oil market can get transmitted to China's commodity sectors very quickly.
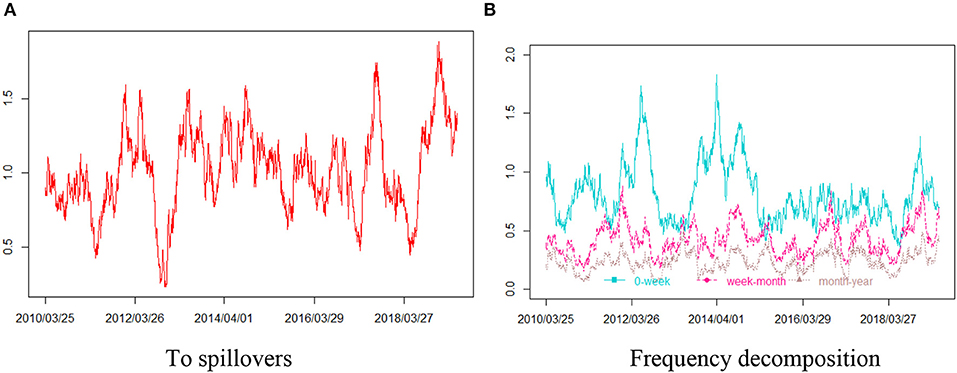
Figure 5. Volatility spillovers from West Texas intermediate (WTI) to China's bulk commodity sectors. (A) The total volatility spillovers from WTI to China's bulk commodity sectors measured by Diebold and Yilmaz (2012), lag = 2, window size = 200. (B) The frequency decomposition measured by Baruník and Krehlík (2018), lag = 2, window size = 200. Short-term: frequencies from 1 to 5 days period (0-week, dark turquoise). Medium-term: frequencies from 5 to 20 days period (week-month, deep pink). Long-term: frequencies from 20 days to 200 days period (month-year, rosy brown).
To provide further insights into the volatility spillovers, Figure 6 offers net volatility spillovers from the oil market to China's commodity sectors. When the value of the net volatility spillovers is positive, it represents that the international crude oil market is a spillover contributor; that is, it transmits net volatility spillovers to China's commodity sectors, and therefore, it is called a “spillover transmitter.” On the other hand, if the net spillover value is negative, it implies that the international crude oil market is a net receiver; that is, it receives the spillovers from China's commodity sectors, and therefore, it is called a “spillover receiver.” As illustrated in Figure 6, the net spillovers from crude oil prices to China's commodity sectors are mostly positive. This means that the fluctuations of international crude oil prices have a significant spillover effect on China's commodity sectors, suggesting that the crude oil market is a spillover transmitter of our system. However, in a few periods, the net spillovers are negative, such as during China's market-oriented reform in 2013 and the Chinese stock market disaster in 2015. This indicates that individual severe shocks from China's bulk commodity markets are likely to increase the uncertainty of international crude oil markets. Our conclusion is consistent with the research on the relationship of crude oil markets and the Chinese stock market (Bai and Koong, 2018; Wang and Wang, 2019). There is no doubt that with the opening and development of China's financial market, its influence on the international financial market is increasing. The local increase or decrease of Figure 6 can even more easily identify some important economic or geopolitical events that affect oil-commodity volatility spillovers than Figure 5. For instance, Iran's geopolitical tensions in 2012 and the international oil crisis in 2014 possibly increase the net spillovers from WTI to China's bulk commodity sectors.
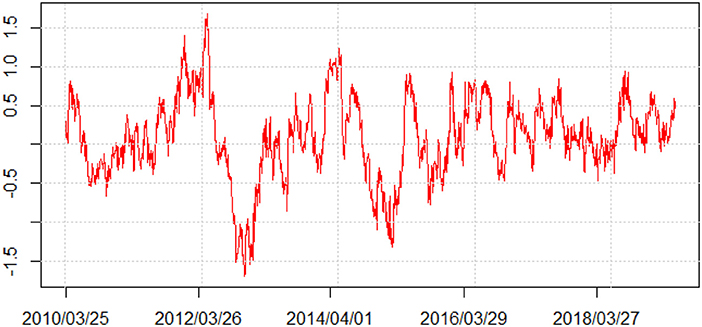
Figure 6. Net volatility spillovers from West Texas intermediate (WTI) to China's bulk commodity sectors.
Accurately, the time-frequency components of the net volatility spillovers are reported in Figure 7. As seen in Figure 7, over most of the sample periods, the signs of different time-frequency net volatility spillovers are consistent, and the short-term net volatility spillovers are larger than the medium-term and long-term components, which reconfirms the importance of short-term factors. This result is also consistent with the conclusion of total return and volatility spillovers (Figures 3, 4), confirming that the net spillovers from the crude oil market to China's commodity sectors are dominated by short-term information (within a week). Meanwhile, the net volatility spillovers of the medium-term and long-term components cannot be underestimated, especially during 2011, 2013, and 2015, which may be associated with the European sovereign debt crisis of 2010–2011, China's market-oriented reform in 2013, and the Chinese stock market disaster in 2015. There are significant differences in the signs of different net volatility spillover components. Even though the short-term net volatility spillovers are positive, the medium-term and long-term components are negative. And the absolute value of the medium-term net spillover is even greater than the short-term net spillover at some extreme moments. This suggests that the negative net spillovers during 2013 and 2015 in Figure 6 are mainly attributable to the medium-term and long-term net spillovers. Therefore, uncertain financial factors such as China's market-oriented reform in 2013 and China's 2015 stock disaster will affect the net oil-commodity volatility spillovers through the medium-term components (week to month) and long-term components (month to year). In addition, the dynamic net volatility fluctuated considerably during the whole sample period for the three time-frequency components, suggesting that crafting well-diversified portfolios with oil and oil-related assets (such as commodities) is an arduous and complicated task. Those frequency results may help investors and portfolio managers with different investment horizons to implement better portfolio diversification.
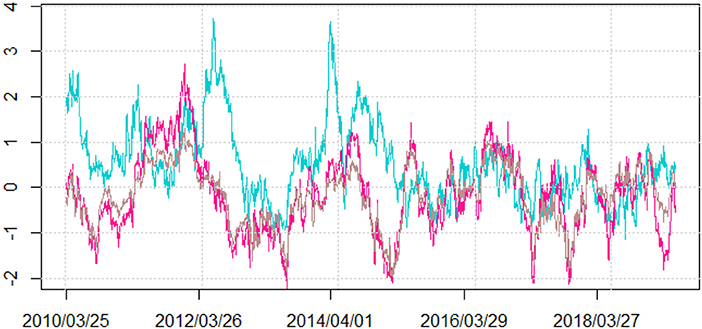
Figure 7. Frequency decomposition of net volatility spillovers from West Texas intermediate (WTI) to China's bulk commodity sectors. The explanation of frequency decomposition is consistent with Figure 1.
Heterogeneous Spillovers From the Crude Oil Market to China's Commodities Sectors
The empirical analysis above has examined the dynamic spillovers of the international oil market and China's commodity sectors in a rolling window. To help the investors make informed decisions about asset allocation, and to help policymakers make effective macroeconomic policies about stabilizing commodity markets, we turn to study whether the oil market poses heterogeneous spillovers to different commodity sectors in China. We examine the pairwise volatility spillovers for the entire sample period. Table 3 displays the values of the volatility spillovers of the DY(2012). When the net spillover value is positive, it means that the particular commodity sector under consideration is a risk contributor: it passes the net volatility spillover to other commodity sectors. On the other hand, if the net spillover value is negative, it means that a particular commodity sector is a net risk receiver; that is, it receives spillovers from other commodity markets. During the full sample period, WTI is the most critical risk contributor to our system, with a net volatility spillover of 0.71. Nonferrous metals (NFFI) and the nonmetal building materials (NMBM) are the other two main risk contributors, with the net volatility spillover of 0.15 and 0.62, respectively. Energy (ENFI), petrochemicals (CIFI), and the agriculture commodity sectors in China (including CRFI, OOFI, and SOFI) are spillover receivers.
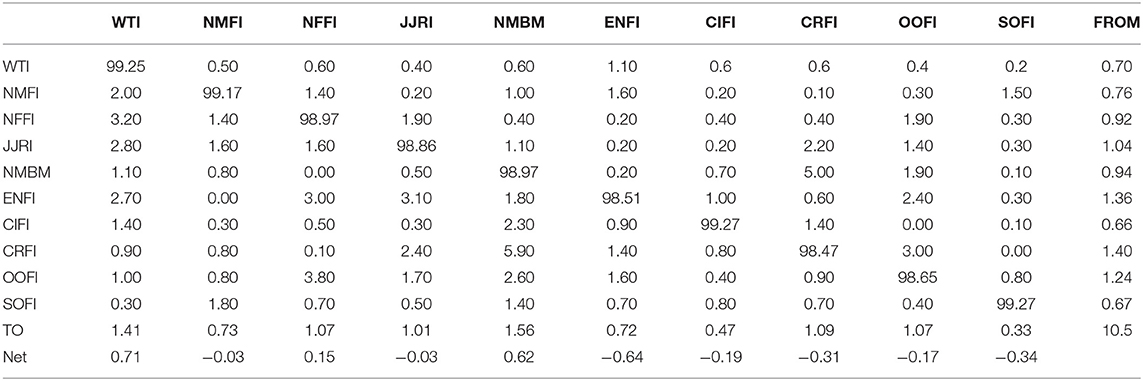
Table 3. Volatility spillover results of the DY(2012).
To obtain more detailed information about the volatility spillovers from the oil market to China's different commodity sectors, we calculate the net pairwise spillover results in Table 4. For one thing, most of the values in the table are positive, indicating that the international crude oil market has a significant positive volatility spillover to China's commodities sectors, and the volatility spillover is mainly caused by short-term components because the values of short-term frequency components are mostly larger than those of the medium-term and long-term components. This result is consistent with the conclusion of Dynamic Spillovers Between Crude Oil Prices and China's Bulk Commodity Sectors. For another thing, the spillover effects from the crude oil market to different commodity sectors are heterogeneous. Specifically, the crude oil market has the strongest volatility spillover effects on nonferrous metals (NFFI), coal coke and steel ore (JJRI), energy (ENFI), and precious metals (NMFI) commodity sectors; followed by petrochemicals, nonmetal building materials, and oils and fats; and the least on grains and soft commodities. For the nonferrous metals sector, some nonferrous metals (e.g., aluminum) have to go through the energy-intensive primary processing. Fluctuations in crude oil prices are often related to inflationary pressures, and expectations for demand for precious metals will change. Therefore, international crude oil prices have a large net spillover effect on China's metals commodity sector. For the energy sector, this result is evident since crude oil and belongs to the energy asset class; therefore, shocks from both oil supply and demand have severely affected the energy sector (Caporale et al., 2015). This reason applies to the coal coke and steel ore sector, as it also belongs to the energy class. Comparing with other sectors, we find that the net spillover effect of oil prices on the agriculture commodity is relatively weak, which may be associated with their less strong and indirect industry correlations. Although the shocks of oil price may be transmitted to the agricultural market by affecting the prices of transportation and agricultural inputs (Du et al., 2011), this spillover effect is relatively insignificant. The results for the agricultural sector are similar to the research of Kaltalioglu and Soytas (2011), who do not find any volatility spillovers from oil to agricultural raw materials. The heterogeneous sectoral impact depends on various factors, such as whether oil or oil-related products are inputs or outputs to the sector, the degree of concentration of the sectors, and the indirect impact of oil prices on the sector (Arouri et al., 2011).
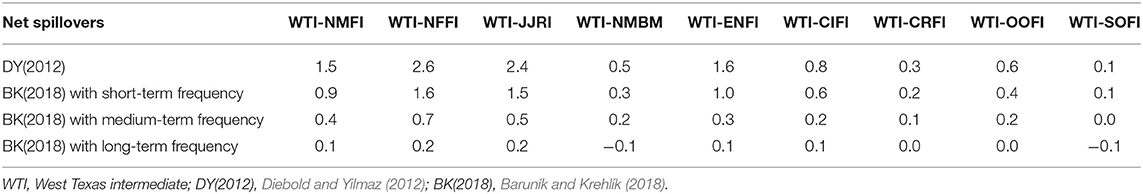
Table 4. Net volatility spillover results from oil market to China's commodity sectors.
Conclusions
This paper seeks to shed new light on the dynamic spillovers between the crude oil market and China's bulk commodity sectors from the time-frequency perspective of SV. We utilized the SV model of Kastner and Frühwirth-Schnatter (2014) to measure the volatility of oil prices and China's commodity sector price indices, and then we investigate the time-frequency dynamic spillovers under the GFEVD framework of Diebold and Yilmaz (2012) and the corresponding spectral representation of Baruník and Krehlík (2018). The key findings of this study can be summarized as follows. First, we find that there are significant return and volatility spillover effects between the international crude oil market and China's commodity sectors and that the volatility spillovers react more violently to extreme geopolitical or financial events than the return spillovers. For instance, the European sovereign debt crisis in 2010–2011, Iran's geopolitical tensions in 2012, and the international oil crisis in 2014 cause a significant increase in volatility spillovers. Second, the total return and volatility spillovers are driven mainly by short-term spillovers (within a week), which means that China's commodity markets process information of international oil market rapidly. Third, the net volatility spillovers between international oil market and commodity sectors in China are almost positive, indicating that the international oil market is almost a net risk transmitter of China's commodity market. Fourth, uncertain financial factors from China such as the market-oriented reform in 2013 and the stock disaster in 2015 will also transmit risk to international oil market, and this risk transmission is attributable to medium-term (week to month) and long-term (month to year) components. Furthermore, there exists heterogeneity in net pairwise spillovers between oil and different China's commodity sectors. International crude oil market has the most potent volatility spillover effects on nonferrous metals (NFFI), coal coke and steel ore (JJRI), energy (ENFI), and precious metals (NMFI) commodity sectors in China; followed by petrochemicals, nonmetal building materials, and oils and fats; and the least on grains and soft commodities. This heterogeneous sectoral impact depends on various factors, such as whether oil or oil-related products are inputs or outputs to the sector, the degree of concentration of the sectors, and the indirect impact of oil prices on the sector (Arouri et al., 2011). Comparing with other sectors, we find that the net spillover effect of oil prices on the agriculture commodity is relatively weak, which may be associated with their less strong and indirect industry correlations.
Our outcomes implement important implications for investors and policymakers. For one thing, it is not appropriate to form short-term investors to combine large amounts of crude oil and related stocks into one investment portfolio. Because volatility is directly converted into risk, huge fluctuations in volatility and its spillover effects in commodity sectors will have a negative impact on risk-averse investors. For another, when formulating effective macroeconomic policies, Chinese policymakers need to consider the heterogeneous impact of the international oil market on different commodity sectors in order to stabilize China's commodity market. It is necessary to introduce regulatory and institutional rules to reduce the cross-market impact of excessive price volatility, especially in the short run.
There are some possible extensions of this study. For example, on the one hand, this paper neglected the breakpoints on oil-commodity spillovers. Breakpoint analysis is also an effective method to explore the impact of financial, economic, and geopolitical events on the dynamic spillovers of oil commodities. Besides, this article does not predict the volatility spillovers, which can provide more accurate tools for policymakers and investors. What is more, the asymmetries of the time-frequency dynamic spillovers between the international oil market and China's commodity sectors would also be of great interest.
Data Availability Statement
The datasets generated for this study are available on request to the corresponding author.
Author Contributions
ZL and YS made substantial contributions to the conception or design of the work; acquired, analyzed, or interpreted of data for the work; drafted the work or revised it critically for important intellectual content; and provided approval for publication of the content.
Funding
This research was funded by the Philosophy and Social Sciences of Guangdong Province, China (no. GD1D8J88JRZ0Z2).
Conflict of Interest
The authors declare that the research was conducted in the absence of any commercial or financial relationships that could be construed as a potential conflict of interest.
Acknowledgments
The authors sincerely thank the editor and the anonymous reviewers of this paper.
References
Acharya, V. V., Pedersen, L. H., Philippon, T., and Richardson, M. (2017). Measuring systemic risk. The Review of Financial Studies 30, 2–47. doi: 10.1093/rfs/hhw088
Adams, Z., and Glück, T. (2015). Financialization in commodity markets: a passing trend or the new normal? J. Bank. Finance 60, 93–111. doi: 10.1016/j.jbankfin.2015.07.008
Adrian, T., and Brunnermeier, M. K. (2011). CoVaR (No. w17454). National Bureau of Economic Research. doi: 10.3386/w17454
Ahmadi, M., Behmiri, N. B., and Manera, M. (2016). How is volatility in commodity markets linked to oil price shocks?. Energy Econ. 59, 11–23. doi: 10.1016/j.eneco.2016.07.006
Apergis, N., Cooray, A., and Rehman, M. U. (2018). Do energy prices affect US investor sentiment?. J. Behav. Finance 19, 125–140. doi: 10.1080/15427560.2017.1373354
Arouri, M. E. H., Jouini, J., and Nguyen, D. K. (2011). Volatility spillovers between oil prices and stock sector returns: implications for portfolio management. J. Int. Money Finance 30, 1387–1405. doi: 10.1016/j.jimonfin.2011.07.008
Bai, S., and Koong, K. S. (2018). Oil prices, stock returns, and exchange rates: Empirical evidence from China and the United States. North Am. J. Econ. Finance 44, 12–33. doi: 10.1016/j.najef.2017.10.013
Balli, F., Naeem, M. A., Shahzad, S. J. H., and de Bruin, A. (2019). Spillover network of commodity uncertainties. Energy Econ. 81, 914–927. doi: 10.1016/j.eneco.2019.06.001
Baruník, J., and Krehlík, T. (2018). Measuring the frequency dynamics of financial connectedness and systemic risk. J. Financial Econ. 16, 271–296. doi: 10.1093/jjfinec/nby0y01
Basak, S., and Pavlov, A. (2016). A model of financialization of commodities. J. Finance 71, 1511–1556. doi: 10.1111/jofi.12408
Beckmann, J., and Czudaj, R. (2014). Volatility transmission in agricultural futures markets. Econ. Model 36, 541–546. doi: 10.1016/j.econmod.2013.09.036
Bekiros, S. D., and Georgoutsos, D. A. (2008). Direction-of-change forecasting using a volatility-based recurrent neural network. J. Forecasting 27, 407–417. doi: 10.1002/for.1063
Bildirici, M. E., and Turkmen, C. (2015). Nonlinear causality between oil and precious metals. Resour. Policy 46, 202–211. doi: 10.1016/j.resourpol.2015.09.002
Caporale, G. M., Ali, F. M., and Spagnolo, N. (2015). Oil price uncertainty and sectoral stock returns in China: a time-varying approach. China Econ. Rev. 34, 311–321. doi: 10.1016/j.chieco.2014.09.008
Chen, P. (2015). Global oil prices, macroeconomic fundamentals and China's commodity sector comovements. Energy Policy 87, 284–294. doi: 10.1016/j.enpol.2015.09.024
Chen, P. F., Lee, C. C., and Zeng, J. H. (2014). The relationship between spot and futures oil prices: do structural breaks matter? Energy Econ. 43, 206–217. doi: 10.1016/j.eneco.2014.03.006
Cheng, D., Shi, X., Yu, J., and Zhang, D. (2019). How does the Chinese economy react to uncertainty in international crude oil prices? Int. Rev. Econ. Finance 64, 147–164. doi: 10.1016/j.iref.2019.05.008
Choi, K., and Hammoudeh, S. (2010). Volatility behavior of oil, industrial commodity and stock markets in a regime-switching environment. Energy Policy 38, 4388–4399. doi: 10.1016/j.enpol.2010.03.067
Creti, A., Joëts, M., and Mignon, V. (2013). On the links between stock and commodity markets' volatility. Energy Econ. 37, 16–28. doi: 10.1016/j.eneco.2013.01.005
de Nicola, F., De Pace, P., and Hernandez, M. A. (2016). Co-movement of major energy, agricultural, and food commodity price returns: a time-series assessment. Energy Econ. 57, 28–41. doi: 10.1016/j.eneco.2016.04.012
Diebold, F. X., Liu, L., and Yilmaz, K. (2017). Commodity Connectedness. National Bureau of Economic Research (No. w2w3685). doi: 10.3386/w2w3685
Diebold, F. X., and Yilmaz, K. (2009). Measuring financial asset return and volatility spillovers, with application to global equity markets. Econ. J. 119, 158–171. doi: 10.1111/j.14688-0297.2008.02208.x
Diebold, F. X., and Yilmaz, K. (2012). Better to give than to receive: predictive directional measurement of volatility spillovers. Int. J. Forecast 28, 57–66. doi: 10.1016/j.ijforecast.2011.02.006
Diebold, F. X., and Yilmaz, K. (2014). On the network topology of variance decompositions: measuring the connectedness of financial firms. J. Econometrics 182, 119–134. doi: 10.1016/j.jeconom.2014.04.012
Du, L., and He, Y. (2015). Extreme risk spillovers between crude oil and stock markets. Energy Econ. 51, 455–465. doi: 10.1016/j.eneco.2015.08.007
Du, X., Cindy, L. Y., and Hayes, D. J. (2011). Speculation and volatility spillover in the crude oil and agricultural commodity markets: a Bayesian analysis. Energy Econ. 33, 497–503. doi: 10.1016/j.eneco.2010.12.015
Efimova, O., and Serletis, A. (2014). Energy markets volatility modelling using GARCH. Energy Econ. 43, 264–273. doi: 10.1016/j.eneco.2014.02.018
Engle, R. F. (1982). Autoregressive conditional heteroscedasticity with estimates of the variance of United Kingdom inflation. Econometrica 50, 987–1007. doi: 10.2307/1912773
Engle, R. F., and Bollerslev, T. (1986). Modelling the persistence of conditional variances. Econometric Reviews 5, 1–50. doi: 10.1080/07474938608800095
Ewing, B. T., and Malik, F. (2013). Volatility transmission between gold and oil futures under structural breaks. Int. Rev. Econ. Finance 25, 113–121. doi: 10.1016/j.iref.2012.06.008
Fattouh, B., Kilian, L., and Mahadeva, L. (2013). The role of speculation in oil markets: What have we learned so far? Energy J. 34, 7–33. doi: 10.5547/01956574.34.3.2
Frahm, G. (2018). How often is the financial market going to collapse? Quant. Finance Econ. 2, 590–614. doi: 10.3934/QFE.2018.3.590
Hafner, C. M., and Preminger, A. (2010). Deciding between GARCH and stochastic volatility via strong decision rules. J. Stat. Plan. Inference 140, 791–805. doi: 10.1016/j.jspi.2009.09.008
Jebabli, I., Arouri, M., and Teulon, F. (2014). On the effects of world stock market and oil price shocks on food prices: an empirical investigation based on TVP-VAR models with stochastic volatility. Energy Econ. 45, 66–98. doi: 10.1016/j.eneco.2014.06.008
Ji, Q., Bouri, E., Roubaud, D., and Kristoufek, L. (2019). Information interdependence among energy, cryptocurrency and major commodity markets. Energy Econ. 81, 1042–1055. doi: 10.1016/j.eneco.2019.06.005
Ji, Q., and Fan, Y. (2012). How does oil price volatility affect non-energy commodity markets?. Appl. Energy 89, 273–280. doi: 10.1016/j.apenergy.2011.07.038
Jiang, Y., Jiang, C., Nie, H., and Mo, B. (2019). The time-varying linkages between global oil market and China's commodity sectors: evidence from DCC-GJR-GARCH analyses. Energy 166, 577–586. doi: 10.1016/j.energy.2018.10.116
Kaltalioglu, M., and Soytas, U. (2011). Volatility spillover from oil to food and agricultural raw material markets. Modern Econ. 2:71. doi: 10.4236/me.2011.22011
Kastner, G. (2019). Dealing with stochastic volatility in time series using the R package stochvol. arXiv preprint arXiv:1906.12134. doi: 10.18637/jss.v069.i05
Kastner, G., and Frühwirth-Schnatter, S. (2014). Ancillarity-sufficiency interweaving strategy (ASIS) for boosting MCMC estimation of stochastic volatility models. Comput. Stat. Data Analysis 76, 408–423. doi: 10.1016/j.csda.2013.01.002
Koirala, K. H., Mishra, A. K., D'Antoni, J. M., and Mehlhorn, J. E. (2015). Energy prices and agricultural commodity prices: testing correlation using copulas method. Energy 81, 430–436. doi: 10.1016/j.energy.2014.12.055
Krehlík, T., and Baruník, J. (2017). Cyclical properties of supply-side and demand-side shocks in oil-based commodity markets. Energy Econ. 65, 208–218. doi: 10.1016/j.eneco.2017.05.003
Li, Z., Dong, H., Huang, Z., and Failler, P. (2018). Asymmetric effects on risks of virtual financial assets (VFAs) in different regimes: a case of bitcoin. Quant. Finance Econ. 2, 860–883. doi: 10.3934/QFE.2018.4.860
Liu, K., Luo, C., and Li, Z. (2019). Investigating the risk spillover from crude oil market to BRICS stock markets based on Copula-POT-CoVaR models. Quant. Finance Econ. 3:754. doi: 10.3934/QFE.2019.4.754
Liu, W. H. (2016). A re-examination of maturity effect of energy futures price from the perspective of stochastic volatility. Energy Econ. 56, 351–362. doi: 10.1016/j.eneco.2016.03.026
Liu, Y., Dong, H., and Failler, P. (2019). The oil market reactions to OPEC's announcements. Energies 12:3238. doi: 10.3390/en1n2173238
Lovcha, Y., and Perez-Laborda, A. (2020). Dynamic frequency connectedness between oil and natural gas volatilities. Econ. Model 84, 181–189. doi: 10.1016/j.econmod.2019.04.008
Luo, J., and Ji, Q. (2018). High-frequency volatility connectedness between the US crude oil market and China's agricultural commodity markets. Energy Econ. 76, 424–438. doi: 10.1016/j.eneco.2018.10.031
Maslyuk, S., and Smyth, R. (2009). Cointegration between oil spot and future prices of the same and different grades in the presence of structural change. Energy Policy 37, 1687–1693. doi: 10.1016/j.enpol.2009.01.013
Mensi, W., Hammoudeh, S., Nguyen, D. K., and Yoon, S. M. (2014). Dynamic spillovers among major energy and cereal commodity prices. Energy Econ. 43, 225–243. doi: 10.1016/j.eneco.2014.03.004
Nazlioglu, S., Erdem, C., and Soytas, U. (2013). Volatility spillover between oil and agricultural commodity markets. Energy Econ. 36, 658–665. doi: 10.1016/j.eneco.2012.11.009
Ng, A., and Donker, H. (2013). Purchasing reserves and commodity market timing as takeover motives in the oil and gas industry. Energy Econ. 37, 167–181. doi: 10.1016/j.eneco.2013.01.010
Reboredo, J. C., Ugolini, A., and Aiube, F. A. L. (2020). Network connectedness of green bonds and asset classes. Energy Econ. 86:104629. doi: 10.1016/j.eneco.2019.104629
Shephard, N., and Andersen, T. G. (2009). “Stochastic volatility: origins and overview,” in Handbook of Financial Time Series (Berlin; Heidelberg: Springer), 233–254. doi: 10.1007/978-3-540-71297-8_10
Shi, X., and Sun, S. (2017). Energy price, regulatory price distortion and economic growth: a case study of China. Energy Econ. 63, 261–271. doi: 10.1016/j.eneco.2017.02.006
Tiwari, A. K., Nasreen, S., Shahbaz, M., and Hammoudeh, S. (2020). Time-frequency causality and connectedness between international prices of energy, food, industry, agriculture and metals. Energy Econ. 85:104529. doi: 10.1016/j.eneco.2019.104529
Toyoshima, Y., and Hamori, S. (2018). Measuring the time-frequency dynamics of return and volatility connectedness in global crude oil markets. Energies 11:2893. doi: 10.3390/en11112893
Uddin, G. S., Rahman, M. L., Shahzad, S. J. H., and Rehman, M. U. (2018). Supply and demand driven oil price changes and their non-linear impact on precious metal returns: a Markov regime switching approach. Energy Econ. 73, 108–121. doi: 10.1016/j.eneco.2018.05.024
Vivian, A., and Wohar, M. E. (2012). Commodity volatility breaks. J. Int. Financial Markets Inst. Money 22, 395–422. doi: 10.1016/j.intfin.2011.12.003
Wang, X., and Wang, Y. (2019). Volatility spillovers between crude oil and Chinese sectoral equity markets: evidence from a frequency dynamics perspective. Energy Econ. 80, 995–1009. doi: 10.1016/j.eneco.2019.02.019
Wang, Y., Wu, C., and Yang, L. (2014). Oil price shocks and agricultural commodity prices. Energy Econ. 44, 22–35. doi: 10.1016/j.eneco.2014.03.016
Yang, L., and Hamori, S. (2018). Modeling the dynamics of international agricultural commodity prices: a comparison of GARCH and stochastic volatility models. Annals Financial Econ. 13:1850010. doi: 10.1142/S2S010495218500100
Yang, L., and Hamori, S. (2018). Modeling the dynamics of international agricultural commodity prices: a comparison of GARCH and stochastic volatility models. Annals of Financial Economics 13:1850010. doi: 10.1142/S2010495218500100
You, W., Guo, Y., Zhu, H., and Tang, Y. (2017). Oil price shocks, economic policy uncertainty and industry stock returns in China: asymmetric effects with quantile regression. Energy Econ. 68, 1–18. doi: 10.1016/j.eneco.2017.09.007
Youssef, M., Belkacem, L., and Mokni, K. (2015). Value-at-Risk estimation of energy commodities: a long-memory GARCH–EVT approach. Energy Econ. 51, 99–110. doi: 10.1016/j.eneco.2015.06.010
Keywords: crude oil prices, bulk commodity markets, stochastic volatility, volatility spillover effects, frequency decomposition
Citation: Li Z and Su Y (2020) Dynamic Spillovers Between International Crude Oil Market and China's Commodity Sectors: Evidence From Time-Frequency Perspective of Stochastic Volatility. Front. Energy Res. 8:45. doi: 10.3389/fenrg.2020.00045
Received: 20 January 2020; Accepted: 05 March 2020;
Published: 21 April 2020.
Edited by:
Qiang Ji, Chinese Academy of Sciences, ChinaReviewed by:
Yan Zeng, Sun Yat-sen University, ChinaJinqiang Yang, Shanghai University of Finance and Economics, China
Jinbo Huang, Guangdong University of Finance and Economics, China
Copyright © 2020 Li and Su. This is an open-access article distributed under the terms of the Creative Commons Attribution License (CC BY). The use, distribution or reproduction in other forums is permitted, provided the original author(s) and the copyright owner(s) are credited and that the original publication in this journal is cited, in accordance with accepted academic practice. No use, distribution or reproduction is permitted which does not comply with these terms.
*Correspondence: Yaya Su, c3V5YXlhQGhudS5lZHUuY24=