 Jan Moestedt
 Bettina Müller
 Yashaswini Nagavara Nagaraj
 Anna Schnürer
- 1Department of Thematic Studies – Environmental Change, Linköping University, Linköping, Sweden
- 2Department of R&D, Tekniska verken i Linköping AB, Linköping, Sweden
- 3Department of Molecular Sciences, Swedish University of Agricultural Sciences, BioCenter, Uppsala, Sweden
Background: In a previous study, single-stage processes were compared with two-stage processes, using either food waste alone or mixed with thin stillage as substrate. Overall methane yield increased (by 12%) in two-stage compared with single-stage digestion when using food waste, but decreased when food waste was co-digested with thin stillage (50:50 on VS basis). The obtained difference in methane yield was likely caused by a higher acetate level in the first stage reactor operating with food waste alone (around 20 g/L) compared to the reactor also treating thin stillage (around 8 g /L). The present study sought to shed additional light on possible causes of the large difference in methane yield by scrutinizing the microbial community in the first- and second-stage reactors, using a combined Illumina sequencing and qPCR approach.
Results: In the first-stage process, acid-tolerant Aeriscardovia and Lactobacillus formed a highly efficient consortium. For food waste with high levels of acetate (20 g/L, equal to 0.14 g acetate/g VS) was produced but when thin stillage was added the pH was lower (<4), resulting in lactate production exceeding acetate production. This difference in hydrolysate composition between the reactors resulted in development of slightly different communities in the second-stage, for both hydrolysis, fermentation, and acetogenesis. High acetate concentration appeared to promote proliferation of different syntrophic consortia, such as various syntrophic acetate oxidizers, members of the genus Syntrophomonas and candidate phylum Cloacimonetes, likely explaining the higher methane yields with two-step compared with single-stage digestion of food waste.
Conclusion: Using food waste as sole substrate resulted in enrichment of Lactobacillus and Aeriscardovia and high acetate yields in the first-stage reactor. This was beneficial for biogas yield in two-stage digestion, where efficient acid-degrading syntrophic consortia developed. Addition of thin stillage contributed to low pH and higher lactate production, which resulted in decreased methane yield in the two-stage process compared with using food waste as sole substrate.
Background
In a two-stage (two-phase) process, anaerobic degradation of organic material is divided by separating the anaerobic food chain metabolically into hydrolysis and acidogenesis (first stage), while acetogenesis and methanogenesis are performed in a second stage (Aslanzadeh et al., 2014; Fontana et al., 2018). During the first stage, complex material is hydrolyzed into smaller molecules and then converted into volatile fatty acids (VFA) in the acidogenesis phase. The outgoing material (hydrolysate) is then fed into a second-stage reactor for methane production. The most important advantage of a two-stage process over a conventional single-stage process is that it allows optimization of process conditions according to the growth conditions and metabolic pathways of the respective microbial groups (Blonskaja et al., 2003). Separation of the stages thus has the potential to give higher methane yield than single-stage digestion, as shown in several previous studies (Luo et al., 2011; Kinnunen et al., 2014; Moestedt et al., 2015a; Wu et al., 2016; Yin et al., 2016). Moreover, two-stage systems has been found to be effective in preventing acidification, which can occur in single-stage systems during biogas production from readily degradable materials such as food waste (Shen et al., 2013).
Two-stage digestion typically involves applying high organic loading rate (OLR) and short hydraulic retention time (HRT) in the first bioreactor, promoting fast-growing hydrolytic and acidogenic bacteria, while slow-growing methanogens are washed out (Aslanzadeh et al., 2014). As a consequence, the hydrogen pressure and content of volatile fatty acids (VFA) increase and the pH decreases (Aslanzadeh et al., 2014). The second stage, which receives the hydrolysate from the first stage, often takes place in a larger reactor, thus giving sufficient time for slower-growing microorganisms, such as the methanogens, to proliferate. The VFA production rate and the composition of VFAs produced in the first stage depend on the selected process parameters and on the substrate used (Strazzera et al., 2018). Process pH, OLR, HRT, and temperature have been shown to be strong regulators of both VFA production and composition (Strazzera et al., 2018; Xiao et al., 2018). Despite differences in operation, the process is typically dominated by mixed acid production, resulting in production of acetate, butyrate, and propionate (Hawkes et al., 2007; Strazzera et al., 2018). In addition, significant amounts of lactate can be produced, but also longer-chain VFAs in larger or smaller quantities (Hawkes et al., 2007; Khan et al., 2016; Gu et al., 2018). Enhanced level of lactate have for example been shown in response to increase in OLR, temperature and ammonium/ammonia levels (Khan et al., 2016; Kim et al., 2016; Zhang et al., 2020).
Different process conditions at each stage and the resulting spatial separation of key metabolic functions cause the microbial population to differ between single-stage and two-stage processes (Kinnunen et al., 2014). Previous studies have shown that the first stage in two-stage processes is often enriched by members of the phyla Firmicutes, Proteobacteria, Actinobacteria, and Bacteroidetes, but in different proportions depending on the nature of the substrate and the process parameters used (Gonzalez-Martinez et al., 2016; Jia et al., 2017; Tang et al., 2017; Fontana et al., 2018). The phylum Firmicutes is often dominated by the orders Clostridia and Lactobacillales (Gonzalez-Martinez et al., 2016; Jia et al., 2017; Fontana et al., 2018). The bacterial population in the second stage resembles that in single-stage processes and has been shown to be dominated by members of the phyla Bacteriodetes, Firmicutes, Synergistales, Chloroflexi, and Thermotoga (Fontana et al., 2018). The methanogenic community has been found to be dominated by the orders Methanobacteriales and Methanomicrobiales, and the genus Methanosarcina (Gonzalez-Martinez et al., 2016; Jia et al., 2017; Fontana et al., 2018).
In a previous study, we compared the performance of a single-stage process and a two-stage process, using either food waste or a combination of food waste and thin stillage, in semi-continuous laboratory-scale reactors (Moestedt et al., 2015a). With food waste as the sole substrate, the separation into two stages led to high VFA concentration (25–27 g/L, i.e., 0.18–0.19 g/g VS) in the first stage, with dominating levels of acetate (82% of total VFA). Overall biogas yield increased by 12% compared with the single-stage process and the methane content in the second stage increased by 6% (Moestedt et al., 2015a). However, when food waste was combined with thin stillage, the VFA and acetate levels decreased over time and the methane yield was 5% lower than in the single-stage process. We suggested that the high levels of acetate achieved when using food waste alone were the result of activities by homoacetogenic bacteria. We also hypothesized that the high acetate load in the second-stage reactor led to stimulation of methane-producing activities. In order to better understand the relationship between acid production patterns and microbial composition, in the present study we analyzed the actual composition of process microbiota. The methodological approach included molecular methods such as 16S rRNA gene amplicon sequencing to identify overall microbial structure and composition, and fhs-t-RFLP profiling and qPCR for characterization of methanogenic and acetogenic subpopulations. We also complemented the VFA analyses reported in our previous study with an additional lactate analysis.
Results
Reactor Performance
The performance of the reactors is discussed in detail in Moestedt et al. (2015a). To assist in interpretation of the microbial results in the present study, key process conditions and key fermentation products from the processes are summarized here for reactors F1/F2 [first stage in two-stage process; hydrolysis reactor fed 50:50 food waste and thin stillage (F1) or only food waste (F2)] and M1/M2 [second stage in two-stage process; methanogenesis reactor fed hydrolysate from F1 (M1) or F2 (M2)] (Figure 1). After inoculation and start-up, pH reached 4.1 ± 0.2 in F1 and 4.2 ± 0.2 in F2 within one HRT (after 10 days). Hydrogen was initially produced in both processes, but at pH below 4.5 it quickly dropped to very low concentrations (<2%) in the biogas produced. Simultaneously, total VFA in the two processes reached a similar concentration of around 25 g/L (0.18 g VFA/g VS), with acetate accounting for about 80–85%, within two HRTs (after 20 days) (Figure 1). The remaining VFAs consisted mainly of propionate (10–13%) and, in the case of F1, some butyrate until day 140 (2–16%) (Figure 1). Thereafter pH, hydrogen, and VFA remained stable at these levels in F2 over the whole experimental period. However, in F1 treating a mixture of food waste and thin stillage, these deceptively stable conditions ended at around day 170, when the pH dropped to below 4 (Figure 1). Increasing hydrogen production and declining VFA production was observed during this pH decrease (Moestedt et al., 2015a). The more detailed analysis of intermediate products performed in the present study showed that, in addition to acetate, lactate was produced in both F1 and F2 during the whole experimental period. At day 160, both reactors had lactate levels of around 5 g/L. However, in F1 an increase in lactate concentration was observed in line with the drop in pH and VFA levels (Figure 1). The levels in F2 did not change and at day 200 the lactate level in F1 and F2 reached 25 and 7 g/L, respectively, equal to 0.18 and 0.05 g lactate/g VS. This resulted in an acetate to lactate ratio of ~1:2 and 3:1 in F1 and F2, respectively, at day 200. Ammonium concentration was below 0.5 g/L in both processes (Figure 1). The free ammonia content was consequently low due to the low pH (Hansen et al., 1998).
Figure 1. Chemical parameters (pH, -N g/L, NH4-N g/L, VFA g/L, lactate g/L, %CH4, %H2) measured from inoculation until end of experiment in (upper left) F1 (hydrolysis reactor, fed 50:50 food waste and thin stillage), (lower left) F2 (hydrolysis reactor fed only food waste), (upper right) M1 (methanogenesis reactor fed hydrolysate from F1), and (lower right) M2 (methanogenesis reactor fed hydrolysate from F2). Modified from Moestedt et al. (2015a).
In the second stage, the conditions were quite similar in both processes and characterized by pH around 7.8. The free ammonia level was slightly higher in M1 (322 mg/L ± 25) compared with M2 (253 mg/L ± 19) from day 170 onward, due to a higher nitrogen concentration in the thin stillage than in the food waste (Figure 1). The release of ammonia nitrogen was almost equal for both reactors, stabilizing at 51–53% from day 140 onward. The overall methane yield was 12% higher in M2, but 5% lower in M1, when comparing two-stage operation with single-stage. The methane content in M2 (63.8 ± 0.1 %) was slightly higher than in M1 (59.4 ± 0.3 %).
Overall Microbial Composition and Structure
To investigate bacterial composition and structure, 16S rRNA gene amplicon sequencing was performed using Illumina sequencing. As expected, the results revealed clear differences between the first-stage and second-stage reactors (Figure 2A). The first-stage reactors (F1 and F2) were both dominated by Actinobacteria (78% in F1 and 61% in F2) at the starting point (day 116 of the whole experimental period), with smaller proportions of Firmicutes (18% in F2 and 21% in F1) and Synergistetes (11.4% in F2 only). However, after conditions stabilized in both F reactors around day 135 (Figure 2A), Actinobacteria decreased to 6–11% and was replaced by Firmicutes (day 158: 93% in F1, 85% in F2) (Figure 2A). These two phyla were represented by two main genera: Aeriscardovia, belonging to the family Bifidobacteriaceae within the order Bifidobacteriales (7% in F1; 11% in F2), and Lactobacillus, belonging to the family Lactobacillaceae within the order Lactobacillales (93% in F1; 81% in F2) (Figures 2B,C, Figure S1). In F2, the relative abundance of Lactobacillus increased further to 90% on day 200, but in F1 the relative abundance of Lactobacillus dropped from 93 to 81%. Simultaneously, the abundance of Aeriscardovia dropped in F2 (7%) and increased in F1 (15%). The alpha diversity in F1 decreased continuously between day 116 and day 200, whereas in F2 the diversity first dropped but increased again between day 168 and day 200 (Figure S1). For both reactors, the same Lactobacillus-related 16S RNA gene variant was recovered from day 200. A phylogenetic tree constructed from the retrieved partial 16S RNA gene and the 16S RNA gene from all characterized Lactobacilli currently present in the NCBI database identified L. intestinalis (96.8%), L. acetotolerans (96.4%), L. pastereurii (96.4%), and L. gigeriorum (96,4%) as the closest relatives (Figures S3, S4).
Figure 2. (A) Relative abundance of 16S RNA gene sequences, grouped by phylum level; (B) Heatmap of 16S RNA gene sequences, grouped by family level; (C) Heatmap of 16S RNA gene sequences, grouped by genus level, after 116, 158, and 200 days of operation. F1 (hydrolysis reactor, fed 50:50 food waste and thin stillage), F2 (hydrolysis reactor fed only food waste), M1 (methanogenesis reactor fed hydrolysate from F1), and M2 (methanogenesis reactor fed hydrolysate from F2). Threshold set to 5%.
Although the M reactors were continuously inoculated with the microbial flora from the F reactors, the differences between the two processes at the same sampling points were significant: At day 200, the M reactors were dominated by the phyla Firmicutes (47–53%) and Bacteroidetes (22–34%) and had only low levels of Actinobacteria (<3%). In addition, M2, receiving hydrolysate from F2, had a high fraction of Cloacimonetes (17%) and Thermotagae (5%). In M1, the phylum Thermotagae was not detected at all (Figure 2A). Within the phyla Firmicutes and Bacteroidetes, Clostridiales (31% in M1, 25% in M2) and Bacteriodales (34% in M1, 20% in M2) were the dominant orders in both M reactors (Figure S1). Firmicutes also comprised the orders Thermoanaerobacterales (15% in M1, 11% in M2) and MAB03 (3% in M1, 7% in M2). The candidate phylum Cloacimonetes was represented by non-classified members of the class W27 in both M1 (5%) and M2 (12%). In M2, the phylum Thermotagae contained the order Petrotogales (5%). No other order was present above a level of 3%. With respect to low abundance orders, M2 appeared slightly more diverse than M1 (Figure S2).
On a lower taxonomic rank, the order Bacteriodales was represented by the families Porphyromonadaceae (16% in M1, 10% in M2), Rikenellaceae (7% in M1, 8% in M2), and Bacteriodaceae (7%, only in M1) (Figure 2B). The order Clostridiales was represented by Ruminococcaceae (13% in M1, 7% M2), Family_XI (9% in M1, 3% in M2), and Caldicoprobacteriaceae (3% in M1, 4% in M2) (Figure 2C, Figure S5). The order Thermoanaerobacterales was represented by the family Thermanaerobacteraceae (14% in M1, 11% in M2). The families Syntrophomonadaceae (order Synergistales, 7%) and Petrotogaceae (order Thermotogales, 5%) were only significantly present in M2. Within those families, the following genera were taxonomically identified at abundance of at least 3% in one or other of the M reactors at day 200 (Figure 2C, Figure S6): Proteiniphilum (6% in M2) and Petrimonas (3% in M1) (Porphyromonadaceae); Caldicoprobacter (3% in M1, 4% in M2) (Caldicoprobacteriaceae); Gelria (5% in M1, 9% in M2) and Syntrophaceticus (9% in M1, 2% in M2) (Thermanaerobacteraceae); Syntrophomonas (1% in M1, 7% in M2) (Syntrophomonadaceae); Bacteroides (7%) (Bacteriodaceae), Fastidiosipila (10% in M1, 3% in M2) (Ruminococcaceae), Defluviitoga (5%, Petrotogaceae) and wastewater sludge group vadinBC27 (7% in M1, 6% in M2) (Rikenellaceae). Minor genera below 1% abundance combined represented 13 and 20%, respectively, of the total relative abundance in M1 and M2 at day 200 (Figure 2C, Figure S6). In general, the M2 reactor showed a slightly higher alpha diversity at day 200 than the M1 reactor (Figure S2).
Composition and Structures of Methanogenic Archaea
Presence and changes in methanogens belonging to Methanosarcina, Methanomicrobiales, Methanoculleus bourgensis, Methanosaeta, and Methanobacteriales were analyzed by qPCR (Figure 3). Despite the low pH and marginal methane production in the F reactors, the level of Methanomicrobiales remained more or less stable over time in both F1 and F2, and only at slightly lower abundance than in the M reactors. However, the absolute abundance of M. bourgensis, belonging to Methanomicrobiales, decreased rapidly to below the detection limit after day 116 (Figure 3). The abundance of Methanosarcina remained more or less stable over time in F1, at levels comparable to those in M reactors, while a drop in abundance was seen in F2 (2 log scales) at day 200 (Figure 3). Methanobacteriales showed steadily decreasing abundances in F reactors and, as for Methanosarcina, the reduction was less pronounced in F1 than F2. Methanosaeta was lacking at day 116, but appeared from day 158 onwards in both F reactors. The absolute abundance dropped slightly at day 200 in F2.
Figure 3. Absolute abundance (in log scale per g concentrated digestate) of Methanoculleus bourgensis, Methanobacteriales, Methanomicrobiales, Methanosaeta, and Methanosarcina at days 116, 158, and 200 in F1 (hydrolysis reactor, fed 50:50 food waste and thin stillage), F2 (hydrolysis reactor fed only food waste), M1 (methanogenesis reactor fed hydrolysate from F1), and M2 (methanogenesis reactor fed hydrolysate from F2).
The M reactors showed similar methanogenic dynamics, but with the M2 reactor being 4-5 log scales more enriched in methanogens at the end of the experiment than M1 (Figure 3). Methanomicrobiales and M. bourgensis kept more or less stable, but with slightly higher absolute abundances in M2. Both Methanosarcina and Methanobacteriales proliferated in both reactors over time and reached slightly higher absolute abundance than Methanomicrobiales at day 200. Methanosaeta was lacking in both M reactors at day 116, but otherwise equally abundant in both M reactors at days 158 and 200 (Figure 3).
Dynamic of the fhs-Carrying Microbial Community
Formyl-tetrahydrofolate synthetase is a key enzyme of the Wood-Ljungdahl pathway and the gene (fhs) has been successfully used as a marker for acetogens and syntrophic acetate-oxidizing communities (Moestedt et al., 2016; Müller et al., 2016). However, the gene may also be present in other bacteria, including Lactobacilli, where it is expressed for biosynthetic purposes. The fhs profiles obtained by t-RFLP revealed significant differences between the first- and second-stage reactors (Figure 4).
Figure 4. t-RFLP profile of the partial formyl tetrahydrofolate synthetase gene (fhs) at days 116, 158, and 200. Terminal restriction fragments (t-RF) fragments are displayed in percentage of relative abundance. For color codes, see text. F1: hydrolysis reactor fed 50:50 food waste and thin stillage, F2: hydrolysis reactor fed only food waste, M1: methanogenesis reactor fed hydrolysate from F1, M2: methanogenesis reactor fed hydrolysate from F2.
In general, the fhs-carrying community was characterized by four clearly distinguishable communities based on their presence. One group of bacteria, mainly represented by terminal restriction fragments (t-RFs) 343, 276, 162, 493, and 645, was exclusively present over time in the hydrolysis reactors F1 and F2 (Figure 4, dark blue). A smaller group was present initially in the F-reactors, but declined quickly (Figure 4, light blue, t-RF 595, 467). Neither of these two groups appeared significantly in the methanogenesis reactors M1 and M2, where instead two groups mainly represented by t-RFs 269, 62, 86, and 282 (Figure 4, light pink) and t-RFs 452, 590, 588, 444, 376, and 637 (Figure 4, red) enriched over time. Some t-RFs of community members belonging to the light pink group were also present at low relative abundance in the early phase of the F reactors (day 116), while the red group was only present in the M reactors. The red group appeared to be more diverse in M2 and also harbored t-RFs that only appeared in one of the reactors (Table S1). A fifth group, represented by t-RFs 296, 643, and 598, appeared during the whole experimental period in both hydrolytic and methanogenic reactors, but at different relative abundances (Figure 4, light green).
Dynamics and Abundance of Syntrophic Acetate-Oxidizing Bacteria (SAOB) and Potential SAOB Candidates
The presence and dynamics of the known mesophilic syntrophic acetate-oxidizing bacteria (SAOB) Tepidanaerobacter acetatoxydans, Clostridium ultunense, and Syntrophaceticus schinkii and of potential SAOB candidates (OTU3-OTU10) identified in previous studies were followed using species-specific primers (Müller et al., 2016). All three known SAOB were present in the methanogenic reactors throughout the processes, with S. schinkii in the highest abundance and with T. acetatoxydans establishing with increasing abundance only in M2 from day 116 to day 200 (Figure 5).
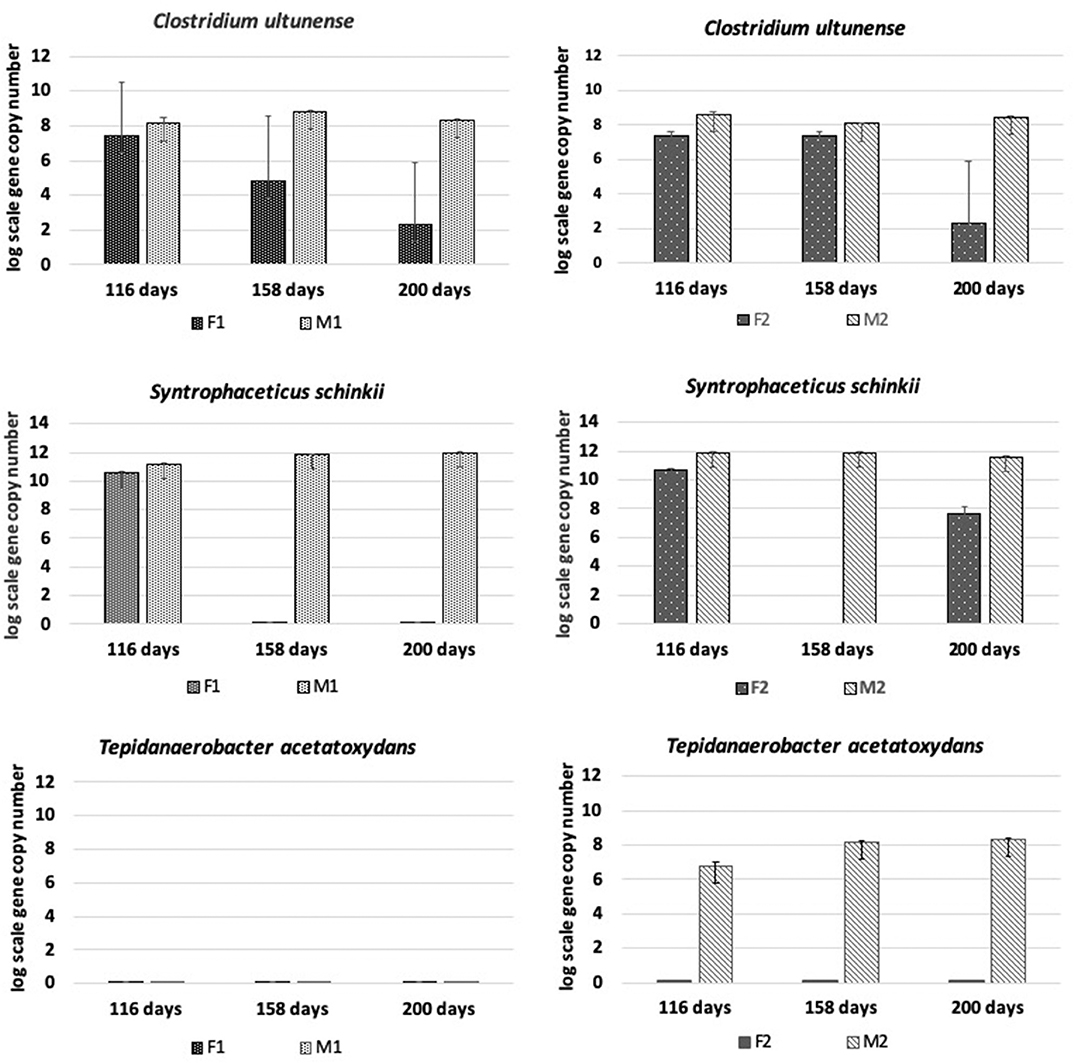
Figure 5. Absolute abundance (log scale per g concentrated digestate) of Tepidanaerobacter acetatoxydans, Clostridium ultunense, and Syntrophaceticus schinkii at days 116, 158, and 200 in F1 (hydrolysis reactor, fed 50:50 food waste and thin stillage), F2 (hydrolysis reactor fed only food waste), M1 (methanogenesis reactor fed hydrolysate from F1), and M2 (methanogenesis reactor fed hydrolysate from F2).
In the hydrolysis reactors F1 and F2, the abundance of C. ultunense and S. schinkii decreased over time down to the detection limit (Figure 5). In F2, S. schinkii established again at day 200 but at 4 log scales lower abundance than in M2. Tepidanaerobacter acetatoxydans was not detectable in either of the F reactors.
The candidate SAOB OTU4, OTU5, and OTU8 behaved dynamically in the same way as observed for the other SAOB, and reached abundances in the M reactors of between 8 and 10 log scale (Figure 6). In the F reactors, these OTUs were either present in low abundances or undetectable. OTU 10 was present in M1 and M2, but also increased over time in F1. In contrast, OTU9 increased in F1 and F2, but was no longer present in M1 and M2 at day 200 (Figure S7). OTU3 was only present at the beginning in M1 and M2, and entirely absent in F1 and F2. OTU7 was detected at day 200 in M1, after it initially dropped from day 116 in both hydrolysis and methanogenic reactors (Figure S7). OTU6 was absent from all samples.
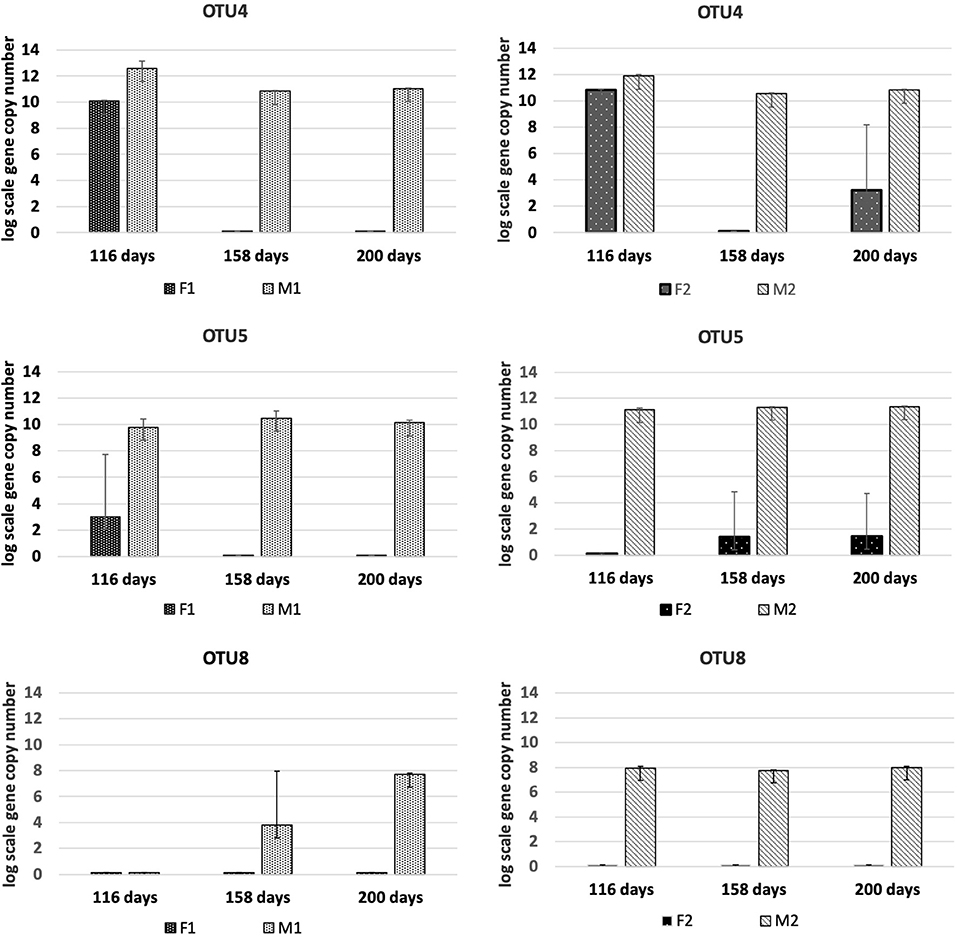
Figure 6. Absolute abundance (log scale per g concentrated digestate) of fhsOTUs 4, 5, and 8 at days 116, 158, and 200 in F1 (hydrolysis reactor, fed 50:50 food waste and thin stillage), F2 (hydrolysis reactor fed only food waste), M1 (methanogenesis reactor fed hydrolysate from F1), and M2 (methanogenesis reactor fed hydrolysate from F2).
Discussion
VFA and Lactate Production
Feeding a mixture of food waste and thin stillage to the F1 reactor led to high production of acetate and increasing levels of lactate, which eventually caused the pH to drop below 4.0, followed by decreasing levels of acetate (Figure 1). When only food waste was used as substrate, the acetate and lactate concentration remained stable over the whole experimental period, resulting also in pH stabilizing at 4.2. In our previous study, we hypothesized that the high acetate concentration was caused by enrichment of bacteria capable of acetogenesis (Moestedt et al., 2015a). Active homoacetogenesis in the first stage was also presumed to scavenge hydrogen, further increasing the acetate levels (Moestedt et al., 2015a). Low levels of hydrogen would allow longer-chain VFAs to be oxidized into acetate by the syntrophic community. However, the complementary analysis performed in this study demonstrated production of large quantities of lactate. Lactate has been shown in a number of studies to be the major product in fermentation of food waste, with increasing levels with decreasing pH (Tang et al., 2017; Gu et al., 2018), as also observed in this study. Recent studies suggest that Lactobacilli plays a key role in this process, due to its greater tolerance to low pH compared with other acidogenic bacteria (Tang et al., 2017). In line with those findings, Lactobacillus (81–93%) and Aeriscardovia (7–15%) dominated in both F reactors from day 158. Lactobacillus can utilize a wide range of sugars as a carbon source, while producing either mainly lactate (homofermentation) or lactate, acetate, and ethanol (heterofermentation) (Hatti-Kaul et al., 2018). Aeriscardovia belongs to the family Bifidobacteriaceae, but clearly separates from the genus Bifidobacterium in the phylogenetic tree and represents the deepest branch within the Bifidobacteriaceae (Lugli et al., 2017). Bifidobacteria can use a wide range of carbohydrates while producing mainly acetate and lactate (Pokusaeva et al., 2011). Aeriscardovia is less well-studied, but growth experiments with the only characterized species (A. aeriphila) suggest that this species can also ferment various sugars to acids (Simpson et al., 2004). Aeriscardovia species have been detected previously in a two-stage reactor treating food-waste-recycled wastewater, in co-occurrence with Lactobacillus (Shin et al., 2010). In that study, Aeriscardovia species and Lactobacillus amylovorus dominated the bacterial community as long as the pH was 4.2–4.4. When the pH dropped down to 3.4 to 3.5, the community composition shifted from Aeriscardovia and L. amylovorus to L. keferi and L. acetotolerans, accompanied by increasing lactate concentration and decreasing acetate concentration (Shin et al., 2010). Lactibacillus amylovorus and L. keferi are both heterofermentative lactic acid bacteria that produce lactic acid and acetic acid from sugars (Nakamura, 1981; Marshall et al., 1984), while the homofermentative L. acetotolerans produces lactate as the sole end-product, explaining the change in fermentation products (Cachat and Priest, 2005). In this study, the increasing level of lactate in parallel with the pH drop is in line with previous findings, but in contrast no shift in the community structure was observed.
The observed acetate to lactate ratio in the reactors suggests high heterofermentative activity, resulting in production of both acetate and lactate (Hatti-Kaul et al., 2018). However, this pathway usually gives equimolar concentrations of acetate and lactate, which was not the case here since at day 200 the molar ratio of acetate to lactate was 1:2 in F1 and 3:1 in F2. Apart from during hetero- and homofermentation, lactic acid can also be produced via the so-called “bifid-shunt,” used by Bifidobacteria, which typically results in a higher acetate to lactate ratio (1.5:1) (Hatti-Kaul et al., 2018). It has been shown that this pathway can lead to production of acetate and formate in certain species, depending on the carbon source (Palframan et al., 2003). Whether the final product ratios vary with pH has not yet been determined. It is also still unclear whether Aeriscardovia uses the bifid-shunt and what acidic end-products are formed.
The high acetate level in F2 could possibly also be explained by further conversion of lactic acid. Lactic acid degradation to acetate and propionate can be performed by many different bacteria, such as Propionibacterium (Seeliger et al., 2002). This could explain the smaller amounts of propionate detected in both F reactors. However, the community analysis showed only a minor fraction (<1%) of non-classified bacteria, so the microbial analyses did not support this explanation. Moreover, lactic acid bacteria have been shown to degrade lactic acid under anoxic conditions using organic compounds as the terminal electron acceptor and forming mainly acetate, but also formate, ethanol, propanediol, and hydrogen, a possible mechanism for the observed VFA pattern (Hatti-Kaul et al., 2018). Lactic acid bacteria could also have produced the small levels of butyrate detected in F2, based on previous findings (Esquivel-Elizondo et al., 2017).
Interestingly, both F reactors harbored Methanosarcina and Methanomicrobiales. This suggests that methanogens were able to survive under the acidic and low pH conditions, and possibly also influenced the resulting acid production pattern. It is a well-known fact that, by consuming hydrogen, formate, or acetate, methanogens can pull otherwise often thermodynamically unfavorable reactions toward production of acetate. Presence of methanogens in a first-stage acid reactor has been reported previously (Maspolim et al., 2015). However, in contrast to the present study, the reactors in that study still showed some methane production and the pH was above 5. Tolerance of methanogens to low pH (<5), as found in the present study, has been reported previously for several different isolates (Bräuer et al., 2006; Jabłonski et al., 2015). Moreover, a previous study on inhibition of methanogens at different levels of acetate and pH demonstrated different inhibition patterns for methanogenic populations in the acidogenic phase compared with the methanogenic phase, suggesting potential for adaptation or selection of acidophilic methanogenic populations (Xiao et al., 2013). It is difficult to say whether methanogens were active and influenced the acid production pattern in this study, as only low levels of methane (<1%) were observed. Inhibition of residual methanogenesis at pH below 4.0 might have resulted in the decreased conversion of lactate, lower acetate levels, and increase in hydrogen concentration observed in F1 compared with F2 after day 158. However, these explanations remain hypothetical and need to be confirmed in a thorough functional analysis of metabolic activities and interactions.
Hydrolysis of Complex Biomass
The low protein degradation in the first-stage reactors, as indicated by the low level of protein mineralization (release of NH4-N from organically bound nitrogen), suggests a functional bottleneck, possibly caused by the low pH (Figure 1). Under the neutral pH prevailing in the methanogenic (M) reactors, protein mineralization was higher (by ~50%) than in the F reactors. This was accompanied by enrichment of members of the genera Fastidiosipila, Gelria, Petrimonas, and Proteiniphilum, all known to comprise protein-degrading representatives, such as Gelria glutamica (Plugge et al., 2002), Fastidiosipila sanguinis (Falsen et al., 2005), and Petrimonas mucosa (Hahnke et al., 2016). The relative abundance of the different potential protein degraders was slightly different between the reactors, with higher relative abundance in M1. A possible explanation for this is the higher protein load to this reactor, which received both food waste and thin stillage.
The enrichment of typical carbohydrate-fermenting genera in M1 and M2 indicated the presence of residual carbohydrates that may not fit into the substrate spectrum of Lactobacillus and Aeriscardovia in hydrolysate from F1 and F2. For example, the genus Caldicoprobacter and family Ruminococcaceae were enriched in both M reactors and representatives from both these groups have been characterized as carbohydrate-fermenting bacteria (Bouanane-Darenfed et al., 2015). Moreover, Bacteroides was enriched in M1 and Defluviitoga was enriched in M2. Both these genera are known to degrade both smaller and more complex carbohydrates (Maus et al., 2015; Westerholm and Schnürer, 2019). Defluviitoga has previously been observed in both one-stage and two-stage processes, but its occurrence in the present study was somewhat unexpected as, to our knowledge, this genus has so far only been observed in thermophilic conditions (Giuliano et al., 2014; Fontana et al., 2018). In addition, representatives from the phylum Cloacimonetes were enriched, with slightly higher relative abundance in M2 than in M1. This phylum is frequently found in biogas reactors (Pelletier et al., 2008; Li et al., 2014; Solli et al., 2014), but so far no isolates have been obtained so its metabolic competence is currently slightly unclear. However, genome-based analyses suggest broad competence, with ability to ferment cellulose, sugars, and amino acids, and to utilize formate and propionate while producing hydrogen and carbon dioxide (Pelletier et al., 2008; Limam et al., 2014; Dyksma and Gallert, 2019). The development of different carbohydrate degraders in M1 and M2 suggests slightly different carbohydrate composition of the hydrolysate from F1 and F2.
Acetogenesis and Methanogenesis
Bacteria known to be involved in syntrophic conversion of organic acids were found in both M reactors, with slightly different composition and relative abundance. The observed difference indicates more efficient degradation of longer fatty acids in M2 compared with M1, potentially explaining the higher methane yield in this reactor. More specifically, species belonging to the genus Syntrophomonas were present in both reactors, but in higher relative abundance in M2. Syntrophomonas spp. degrade fatty acids of four carbon atoms or more (4–18) by beta-oxidation in syntrophy with methanogens (Schink and Muñoz, 2014). In addition, the relative abundance of members within the phylum Cloacimonetes, which are suggested to have the potential to syntrophically degrade propionate (Dyksma and Gallert, 2019), was 3-fold higher in M2 than M1. In contrast, the family Thermoanaerobacteraceae showed slighly higher relative abundance in M1. Within the Thermoanaerobacteraceae, the genus Syntrophaceticus appared to be more enriched in M1 in the later phase of the experiment. The only known representative of this genus, S. schinkii, can oxide acetate in the presence of methanogens, but can also grow on lactate at very slow rates (Westerholm et al., 2010). A possible explanation for the higher abundance of this genus in M1 could thus be the comparably higher level of lacate in F1 hydolysate. The methanogenic environment prevaling in M1 might have facilitated lactate degradation by Syntrophaceticus-related species.
The level of syntrophic acetate oxidation has been shown to correlate strongly with elevated ammonium concentrations (Schnürer and Nordberg, 2008) and/or high VFA/acetate (Westerholm et al., 2016). The ammonia level was slightly higher in M1 than in M2, but in both reactors it was above levels (>200 mg/L) previously shown to induce a shift to syntrophic acetate oxidation (SAO) (Westerholm et al., 2016). The abundance of known SAOB S. schinkii, C. ultunense and T. acetatoxydans, detected by Illumina sequencing and/or qPCR, and the hydrogenotrophic methanogen M. bourgensis, which has been identified as the syntrophic partner organism for these known SAOB (Westerholm et al., 2016), suggests methane formation via SAO in both M reactors. However, the aceticlastic methanogens Methanosarcina and Methanosaeta were also present at similar high abundance, and thus acetate was most likely also directly converted to methane in both M reactors. Additionally, members of Methanomicrobiales and Methanobacteriales were identified to contribute to hydrogenotrophic methanogenesis, in agreement with previous studies of two-stage processes using different substrates (Shimada et al., 2011; Giuliano et al., 2014; Fontana et al., 2018). Our results confirm previous findings of high abundance of S. schinkii and C. ultunense in the methanogenic phase of a two-stage digester, in that case fed primary and waste-activated sludge (Shimada et al., 2011). The ammonia levels in that study were higher (900–1,200 mg/L) than in the present study, which might explain the observed stronger proliferation of C. ultunense (Westerholm et al., 2016). Syntrophaceticus-related species and T. acetatoxydans have also been found at high abundance in a methanogenic reactor of two-stage systems fed cheese whey permeate (Fontana et al., 2018). The SAOB T. acetatoxydans was only detectable by qPCR and exclusively enriched in the M2 reactor, indicating dependence of this microorganism not only on high ammonia levels, but also on high acetate levels. This is in agreement with previous observations that T. acetatoxydans-related species did not enrich in the methanogenic second phase at elevated ammonia levels, although proven to be present at low abundance in a parallel operated one-stage reactor (Fontana et al., 2018). In that study, the acetate level of the hydrolysis reactor was not as high as obtained in F2, but rather similar or even below the level obtained in the F1 reactor (Fontana et al., 2018). Syntrophic acetate oxidation might also be performed by a number of unknown species and some novel SAOB candidates have been suggested, based on fhsOTU (OTU2-OTU10) recovered from a high-ammonia process (Müller et al., 2016). Within that OTU range, OTU4, OTU5, and OTU8 were found in both M1 and M2 in monitoring by qPCR, further supporting SAO-driven methanogenesis in the M reactors. OTU8 (t-RF 283) was also found in the tRFLP profile from both reactors, while OTU5 (t-RF 637) was only detected in the t-RFLP profile obtained from M1. The exact phylogenetic affiliation of these OTUs is unknown, as their closest current relatives share only low identities (Müller et al., 2016).
For the fhs t-RFs, the majority could not be identified. However, in line with the Illumina results, the t-RFs fhs profile showed development of different microbial communities when comparing F and M reactors, and M1 and M2 reactors. Considering that the Illumina 16S rRNA gene profile in the F reactors was dominated by only one Lactobacillus and one Aeriscardovia genotype, the large proportion of the t-RFs observed in the F reactors suggests the presence of other species. Moreover, differences between the two M reactors could correlate with observed differences in the syntrophic communities and explain the observed differences in methane production.
Conclusions
Prior to this study, the high acetate production observed when treating food waste in the processes studied here was hypothesized to be driven by homoacetogenesis. However, this study showed that acid-tolerant Aeriscardovia and Lactobacillus instead formed a highly efficient consortium, producing up to 25 g/L VFA (0.18 g/g VS), with acetate representing as much as 80%. It is critical for this process that the pH does not drop below pH 4, which in turn depends on the organic load and composition of the feedstock. The highest acetate level was obtained when food waste was used as the sole substrate, while co-digestion with thin stillage resulted in lactate production exceeding acetate production. The higher acetic acid level when using only food waste in the first-phase process promoted methane formation in the second reactor, probably due to stronger proliferation of different syntrophic consortia such as syntrophic acetate oxidizers, members within the genus Syntrophomonas and candidate phylum Cloacimonetes and their hydrogenotrophic partners. Enrichment of members within these syntrophic microorganisms is hypothesized to improve degradation of different organic acids, including long-chain fatty acids (>4C), resulting in improved methane yield. To confirm this hypothesis, more detailed analysis must be performed using proteomics or transcriptomics.
Methods
Bioreactor Setup and Process Performance
Reactor set-up and performance are described and evaluated in detail in Moestedt et al. (2015a). In order to identify the most favorable settings, different OLR (from 9.4 to 46.9 kg VS/L d) equal to HRTs between 3 and 15 days were evaluated before the two-stage process was initiated according to Moestedt et al. (2015a). In brief, the experimental reactor set-up chosen for the experiment was as follows: Two sets of reactors were used in the study: Hydrolysis/acidogenesis stage reactors with an active volume of 4 L and methanogenic stage reactors with an active volume of 9 L. Two one-stage methanogenic reactors (denoted M1 and M2) were started and operated with HRT 38 days and OLR 3.5 g VS/L/d. M1 was fed a substrate mixture of thin stillage and food waste (50:50 on VS basis) and M2 was fed only food waste. The food waste contained the organic fraction of municipal source separated solid waste used at the biogas plants in Linköping, Sweden. The sample was retrieved from a buffer tank receiving food waste slurry from the pre-treatment plant (removing impurities such as plastics, glass, gravel and diluting the waste to a pumpable slurry with BioSep® technique). Thin stillage was obtained from the bio-ethanol plant (Lantmännen Agroetanol AB) in close proximity to the Norrköping biogas plant (Moestedt et al., 2013). The single-stage operating performance of M1 and M2 prior to the two-stage process (the first 111 days) was used as reference for comparison with the two-stage performance. At day 112, two hydrolysis/acidogenesis reactors (denoted F1 and F2) were inoculated (100%) with digestate from M1 and M2, respectively. The HRT for these hydrolysis reactors was 10 days. F1 received the thin stillage and food waste (50:50) substrate mixture, while F2 received only food waste as a feedstock, and the OLR for both was 14.1 g VS/L/d. From day 112, the outgoing material from F1 and F2 was used as substrate for M1 and M2, respectively. In order to accurately compare the single-stage (first 111 days) and two-stage processes, the HRT was eventually set to 28 days in M1 and M2, giving a similar total HRT in both the single- and two-stage processes. The temperature was set to 38°C for all reactors, which were fed semi-continuously (once a day) 7 days per week. A process additive containing Fe3+/2+, Co2+, Ni2+, and HCl was added to the substrate for M1 and M2 prior to feeding according to Moestedt et al. (Moestedt et al., 2015b). Volume adjustment and sampling were performed 5 days per week, prior to daily feeding. Full details of volumetric gas production, methane concentration, specific gas production, and chemical analyses can be found in Moestedt et al. (2015a). The VFA analysis included C2-C7 and did hence not detect formate.
Molecular Methods
Triplicate homogeneous aliquots of digestate were withdrawn weekly from both stages and kept at −20°C prior to analysis. DNA was extracted from each sample of digestate withdrawn at days 116, 158, and 200 of operation, using the FastDNA®Spin kit for soil (MPBiomedicals, LLC) and following the manufacturer's instructions. In brief, 2 mL of digestate were centrifuged at maximum speed in an Eppendorf table centrifuge for 5 min. Then 200 mg of the pellet obtained were subjected to DNA extraction, applying an additional washing step with 5.5 M guanidine thiocyanate as described in the manufacturer's manual. DNA was eluted using 70 μL of DNase/pyrogen-free water (provided in the kit). DNA samples were purified and analyzed in triplicate. Quantification of DNA was carried out with the Quant-iT™ Assay (Invitrogen, ThermoFisher Scientific, Waltham, USA) and a Qubit® 3.0 Fluorometer (Invitrogen). For terminal restriction fragment length polymorphism (T-RFLP) analysis, touch-down PCRs were performed as described in Müller et al. (2016), using degenerated primers (Müller et al., 2013) targeting the formyl tetrahydrofolate synthetase (fhs) gene. Amplification of partial fhs fragments was achieved by an initial denaturation step at 94°C for 5 min, 10 cycles at 94°C (20 s), 63–53°C (45 s, decreased by 1°C per cycle) and 72°C (30 s), 28 cycles at 94°C (20 s), 53°C (45 s) and 72°C (30 s), and a final elongation step at 72°C for 10 min using the iQ PCR Supermix (Biorad, Hercules, CA USA). The respective bands at ~600 bp were gel-purified using a QIAquick Gel Extraction Kit (Qiagen, Hilden, Germany) and subjected to t-RFLP analysis as performed by Müller et al. (2016). Barcoded 16S rRNA gene amplicon libraries were prepared as described in Müller et al. (2016). Paired-end sequencing was conducted using the MiSeq Illumina sequencing platform. Obtained sequences were processed and analyzed as described in detail in Westerholm et al. (2018). Each triplicate samples from the F reactors were sequenced twice to get sufficient number of reads for analyses. Raw sequences have been submitted to the NCBI Sequence Read Archive (SRA) under study accession number PRJNA590706
For quantitative PCR (qPCR), 20 x and 50 x diluted DNA samples were used. Detailed descriptions of primer pairs, standard curves, amplification, and reaction set-up have been described before: Tepidanaerobacter acetatoxydans, Clostridium ultunense, Syntrophaceticus schinkii (Westerholm et al., 2011), methanogenic groups (Yu et al., 2005), Methanoculleus (Westerholm et al., 2012) and fhs OTU3, 4, 5, 6, 7, 8, 9, and 10 (Müller et al., 2016). In all cases, the ORA SEE qPCR Green ROX L Mix (highQu GmbH, Kraichtal, Germany) was used.
Data Availability Statement
The datasets generated for this study can be found in the NCBI Sequence Read Archive under accession number PRJNA590706.
Author Contributions
AS and JM: conception and design of the project, data analysis, and writing the manuscript. BM: illumina sequencing, t-RFLP, data analysis, and writing the manuscript. YN: DNA preparation, qPCR.
Funding
JM and AS were supported by Formas grant number 2016-00311 and BM and YN by FORMAS grant number 942-2015-1008. The funders had no role in study design, data collection and analysis, decision to publish, or preparation of the manuscript.
Conflict of Interest
The authors declare that the research was conducted in the absence of any commercial or financial relationships that could be construed as a potential conflict of interest.
Acknowledgments
Illumina sequencing and analysis were supported by the SNP&SEQ Technology Platform, Uppsala, as part as the Swedish National Genomic Infrastructure (NGI), Science for Live Laboratory (SciLifeLab), and the SLU Bioinformatics Infrastructure (SLUBI). Thanks to laboratory technician Yasna Calderon at Tekniska verken i Linköping AB for feeding and sampling the reactors.
Supplementary Material
The Supplementary Material for this article can be found online at: https://www.frontiersin.org/articles/10.3389/fenrg.2020.00105/full#supplementary-material
Figure S1. Relative abundance of 16S RNA gene sequences, grouped by order level, at days 116, 158, and 200 in F1 (hydrolysis reactor, fed 50:50 food waste and thin stillage), F2 (hydrolysis reactor fed food waste), M1 (methanogenesis reactor fed hydrolysate from F1), and M2 (methanogenesis reactor fed hydrolysate from F2).
Figure S2. Alpha diversity indices observed at days 116, 158, and 200 in reactors F1 (red), F2 (green), M1 (light blue), and M2 (purple).
Figure S3. Phylogenetic tree constructed from the retrieved partial 16S RNA genotypes of Lactobacilli in reactors F1 and F2 and 16S RNA genes from all characterized Lactobacilli currently present in the NCBI database.
Figure S4. Pairwise identity of the closest relatives and the Lactobacillus genotypes found in reactors F1 and F2.
Figure S5. Relative abundance of 16S RNA gene sequences, grouped by family level, at days 116, 158, and 200 in F1 (hydrolysis reactor, fed 50:50 food waste and thin stillage), F2 (hydrolysis reactor fed only food waste), M1 (methanogenesis reactor fed hydrolysate from F1), M2 (methanogenesis reactor fed hydrolysate from F2). Threshold set to 5%.
Figure S6. Relative abundance of 16S RNA gene sequences, grouped by genus level, at days 116, 158, and 200 in F1 (hydrolysis reactor, fed 50:50 food waste and thin stillage), F2 (hydrolysis reactor fed only food waste), M1 (methanogenesis reactor fed hydrolysate from F1), and M2 (methanogenesis reactor fed hydrolysate from F2). Threshold set to 5%.
Figure S7. Absolute abundance (log scale per g concentrated digestate) of fhs OTUs 10, 9, 7, and 3 at days 116, 158, and 200 in F1 (hydrolysis reactor, fed 50:50 food waste and thin stillage), F2 (hydrolysis reactor fed only food waste), M1 (methanogenesis reactor fed hydrolysate from F1), and M2 (methanogenesis reactor fed hydrolysate from F2).
Table S1. Relative abundance of t-RF of the partial formyl tetrahydrofolate synthetase gene (fhs) at days 116, 158, and 200. For color explanation see text. F1 and F2 (hydrolysis reactor, fed with 50:50 OFMHW and thin stillage), F2 (hydrolysis reactor fed with OFMSW), M1 (methanogenesis reactor fed hydrolysate from F1), M2 (methanogenesis reactor fed hydrolysate from F2).
References
Aslanzadeh, S., Rajendran, K., and Taherzadeh, M. J. (2014). A comparative study between single- and two-stage anaerobic digestion processes: Effects of organic loading rate and hydraulic retention time. Int. Biodeterior. Biodeg. 95, 181–188. doi: 10.1016/j.ibiod.2014.06.008
Blonskaja, V., Menert, A., and Vilu, R. (2003). Use of two-stage anaerobic treatment for distillery waste. Adv. Environ. Res. 7, 671–678. doi: 10.1016/S1093-0191(02)00038-2
Bouanane-Darenfed, A., Ben Hania, W., Cayol, J. L., Ollivier, B., and Fardeau, M. L. (2015). Reclassification of acetomicrobium faecale as caldicoprobacter faecalis comb. nov. Int. J. Syst. Evol. Microbiol. 65, 3286–3288. doi: 10.1099/ijsem.0.000409
Bräuer, S. L., Cadillo-Quiroz, H., Yashiro, E., Yavitt, J. B., and Zinder, S. H. (2006). Isolation of a novel acidiphilic methanogen from an acidic peat bog. Nature 442:192. doi: 10.1038/nature04810
Cachat, E., and Priest, F. G. (2005). Lactobacillus suntoryeus sp. nov., isolated from malt whisky distilleries. Int. J. Syst. Evol. Microbiol. 55, 31–34. doi: 10.1099/ijs.0.63266-0
Dyksma, S., and Gallert, C. (2019). Candidatus Syntrophosphaera thermopropionivorans: a novel player in syntrophic propionate oxidation during anaerobic digestion. Environ. Microbiol. Rep. 11, 558–570. doi: 10.1111/1758-2229.12759
Esquivel-Elizondo, S., Ilhan, Z. E., Garcia-Peña, E. I., and Krajmalnik-Brown, R. (2017). Insights into butyrate production in a controlled fermentation system via gene predictions. mSystems 2, e00051–e00017. doi: 10.1128/mSystems.00051-17
Falsen, E., Collins, M. D., Welinder-Olsson, C., Song, Y., Finegold, S. M., and Lawson, P. A. (2005). Fastidiosipila sanguinis gen. nov., sp. nov., a new Gram-positive, coccus-shaped organism from human blood. Int. J. Syst. Evol. Microbiol. 55(Pt. 2), 853–858. doi: 10.1099/ijs.0.63327-0
Fontana, A., Campanaro, S., Treu, L., Kougias, P. G., Cappa, F., Morelli, L., et al. (2018). Performance and genome-centric metagenomics of thermophilic single and two-stage anaerobic digesters treating cheese wastes. Water Res. 134, 181–191. doi: 10.1016/j.watres.2018.02.001
Giuliano, A., Zanetti, L., Micolucci, F., and Cavinato, C. (2014). Thermophilic two-phase anaerobic digestion of source-sorted organic fraction of municipal solid waste for bio-hythane production: effect of recirculation sludge on process stability and microbiology over a long-term pilot-scale experience. Water Sci. Technol. 69, 2200–2209. doi: 10.2166/wst.2014.137
Gonzalez-Martinez, A., Garcia-Ruiz, M. J., Rpdriguez-Sanchez, A., Osorio, F., and Gonzalez-Lopez, J. (2016). Archaeal and bacterial community dynamics and bioprocess performance of a bench-scale two-stage anaerobic digester. Appl. Microbiol. Biotehnol. 100, 6013–6033. doi: 10.1007/s00253-016-7393-z
Gu, X. Y., Liu, J. Z., and Wong, J. W. C. (2018). Control of lactic acid production during hydrolysis and acidogenesis of food waste. Bioresour. Technol. 247, 711–715. doi: 10.1016/j.biortech.2017.09.166
Hahnke, S., Langer, T., Koeck, D. E., and Klocke, M. (2016). Description of Proteiniphilum saccharofermentans sp. nov., petrimonas mucosa sp. nov. and fermentimonas caenicola gen. nov., sp. nov., isolated from mesophilic laboratory-scale biogas reactors, and emended description of the genus proteiniphilum. Int. J. Syst. Evol. Microbiol. 66, 1466–1475. doi: 10.1099/ijsem.0.000902
Hansen, K. H., Angelidaki, I., and Ahring, B. K. (1998). Anaerobic digestion of swine manure: inhibition by ammonia. Water Res. 32, 5–12. doi: 10.1016/S0043-1354(97)00201-7
Hatti-Kaul, R., Chen, L., Dishisha, T., and Enshasy, H. E. (2018). Lactic acid bacteria: from starter cultures to producers of chemicals. FEMS Microbiol. Lett. 365:fny213. doi: 10.1093/femsle/fny213
Hawkes, F. R., Hussy, I., Kyazze, G., Dinsdale, R., and Hawkes, D. L. (2007). Continuous dark fermentative hydrogen production by mesophilic microflora: principles and progress. Int. J. Hydrogen Energy 32, 172–184. doi: 10.1016/j.ijhydene.2006.08.014
Jabłonski, S., Rodowicz, P., and Łukaszewicz, M. (2015). Methanogenic archaea database containing physiological and biochemical characteristics. Int. J. Syst. Evol. Microbiol. 65, 1360–1368. doi: 10.1099/ijs.0.000065
Jia, X., Xi, B.-D., Li, M.-X., Yang, Y., and Wang, Y. (2017). Metaproteomics analysis of the functional insights into microbial communities of combined hydrogen and methane production by anaerobic fermentation from reed straw. PLoS ONE 12:e0183158. doi: 10.1371/journal.pone.0183158
Khan, M. A., Ngo, H. H., Guo, W. S., Liu, Y., Nghiem, L. D., Hai, F. I., et al. (2016). Optimization of process parameters for production of volatile fatty acid, biohydrogen and methane from anaerobic digestion. Bioresour. Technol. 219, 738–748. doi: 10.1016/j.biortech.2016.08.073
Kim, M.-S., Na, J.-G., Lee, M.-K., Ryu, H., Chang, Y.-K., Triolo, J. M., et al. (2016). More value from food waste: lactic acid and biogas recovery. Water Res. 96 (Suppl. C), 208–216. doi: 10.1016/j.watres.2016.03.064
Kinnunen, M., Hilderbrandt, D., Grimberg, S., Rogers, S., and Mondal, S. (2014). Comparative study of methanogens in one- and two-stage anaerobic digester treating food waste. Renew. Agr. Food Syst. 30, 515–523. doi: 10.1017/S1742170514000350
Li, Y. F., Chen, P. H., and Yu, Z. T. (2014). Spatial and temporal variations of microbial community in a mixed plug-flow loop reactor fed with dairy manure. Microb. Biotechnol. 7, 332–346. doi: 10.1111/1751-7915.12125
Limam, R. D., Chouari, R., Mazéas, L., Wu, T.-D., Li, T., Grossin-Debattista, J., et al. (2014). Members of the uncultured bacterial candidate division WWE1 are implicated in anaerobic digestion of cellulose. Microbiologyopen 3, 157–167. doi: 10.1002/mbo3.144
Lugli, G. A., Milani, C., Turroni, F., Duranti, S., Mancabelli, L., Mangifesta, M., et al. (2017). Comparative genomic and phylogenomic analyses of the Bifidobacteriaceae family. BMC Genomics 18:568. doi: 10.1186/s12864-017-3955-4
Luo, G., Xie, L., Zhou, Q., and Angelidaki, I. (2011). Enhancement of bioenergy production from organic wastes by two-stage anaerobic hydrogen and methane production process. Bioresour. Technol. 102, 8700–8706. doi: 10.1016/j.biortech.2011.02.012
Marshall, V. M., Cole, W. M., and Farrow, J. A. (1984). A note on the heterofermentative Lactobacillus isolated from kefir grains. J. Appl. Bacteriol. 56, 503–505. doi: 10.1111/j.1365-2672.1984.tb01381.x
Maspolim, Y., Zhou, Y., Guo, C., Xiao, K., and Ng, W. J. (2015). Comparison of single-stage and two-phase anaerobic sludge digestion systems – performance and microbial community dynamics. Chemosphere 140, 54–62. doi: 10.1016/j.chemosphere.2014.07.028
Maus, I., Cibis, K. G., Wibberg, D., Winkler, A., Stolze, Y., König, H., et al. (2015). Complete genome sequence of the strain Defluviitoga Tunisiensis L3, isolated from a thermophilic, production-scale biogas plant. J. Biotechnol. 203, 17–18. doi: 10.1016/j.jbiotec.2015.03.006
Moestedt, J., Müller, B., Westerholm, M., and Schnürer, A. (2016). Ammonia threshold for inhibition of anaerobic digestion of thin stillage and the importance of organic loading rate. Microb. Biotechnol. 9, 180–194. doi: 10.1111/1751-7915.12330
Moestedt, J., Nilsson Påledal, S., Schnürer, A., and Nordell, E. (2013). Biogas production from thin stillage on an industrial scale – experience and optimization. Energies 6, 5642–5655. doi: 10.3390/en6115642
Moestedt, J., Nordell, E., Hallin, S., and Schnürer, A. (2015a). Two stage anaerobic digestion for reduced hydrogen sulphide production. J. Chem. Technol. Biotechnol. 91, 1055–1062. doi: 10.1002/jctb.4682
Moestedt, J., Nordell, E., Shakeri Yekta, S., Lundgren, J., Marti, M., Sundberg, C., et al. (2015b). Effects of trace elements addition on process stability during anaerobic co-digestion of OFMSW and slaughterhouse waste. Waste Manag. 47, 11–20. doi: 10.1016/j.wasman.2015.03.007
Müller, B., Sun, L., and Schnurer, A. (2013). First insights into the syntrophic acetate-oxidizing bacteria–a genetic study. Microbiologyopen 2, 35–53. doi: 10.1002/mbo3.50
Müller, B., Sun, L., Westerholm, M., and Schnürer, A. (2016). Bacterial community composition and fhs profiles of low- and high-ammonia biogas digesters reveal novel syntrophic acetate-oxidising bacteria. Biotechnol. Biofuels 9:48. doi: 10.1186/s13068-016-0454-9
Nakamura, L. K. (1981). Lactobacillus amylovorus, a new starch-hydrolyzing species from cattle waste-corn fermentations. Int. J. Syst. Evol. Microbiol. 31, 56–63. doi: 10.1099/00207713-31-1-56
Palframan, R. J., Gibson, G. R., and Rastall, R. A. (2003). Carbohydrate preferences of Bifidobacterium species isolated from the human gut. Curr. Issues Intest. Microbiol. 4, 71–75.
Pelletier, E., Kreimeyer, A., Bocs, S., Rouy, Z., Gyapay, G., Chouari, R., et al. (2008). Candidatus cloacamonas acidaminovorans: genome sequence reconstruction provides a first glimpse of a new bacterial division. J. Bacteriol. 190, 2572–2579. doi: 10.1128/JB.01248-07
Plugge, C. M., Balk, M., Zoetendal, E. G., and Stams, A. J. (2002). Gelria glutamica gen. nov., sp. nov., a thermophilic, obligately syntrophic, glutamate-degrading anaerobe. Int. J. Syst. Evol. Microbiol. 52(Pt. 2), 401–407. doi: 10.1099/00207713-52-2-401
Pokusaeva, K., Fitzgerald, G. F., and van Sinderen, D. (2011). Carbohydrate metabolism in Bifidobacteria. Genes Nutr. 6, 285–306. doi: 10.1007/s12263-010-0206-6
Schink, B., and Muñoz, R. (2014). “The Family Syntrophomonadaceae,” in The Prokaryotes: Firmicutes and Tenericutes, eds E. Rosenberg., E. F. DeLong., S. Lory., E. Stackebrandt., F. Thompson (Springer Berlin Heidelberg), 371–379. doi: 10.1007/978-3-642-30120-9_365
Schnürer, A., and Nordberg, A. (2008). Ammonia, a selective agent for methane production by syntrophic acetate oxidation at mesophilic temperature. Water Sci. Technol. 57, 735–740. doi: 10.2166/wst.2008.097
Seeliger, S., Janssen, P. H., and Schink, B. (2002). Energetics and kinetics of lactate fermentation to acetate and propionate via methylmalonyl-CoA or acrylyl-CoA. FEMS Microbiol. Lett. 211, 65–70. doi: 10.1111/j.1574-6968.2002.tb11204.x
Shen, F., Yuan, H., Pang, Y., Chen, S., Zhu, B., Zou, D., et al. (2013). Performances of anaerobic co-digestion of fruit & vegetable waste (FVW) and food waste (FW): Single-phase vs. two-phase. Bioresour. Technol. 144, 80–85. doi: 10.1016/j.biortech.2013.06.099
Shimada, T., Morgenroth, E., Tandukar, M., Pavlostathis, S. G., Smith, A., Raskin, L., et al. (2011). Syntrophic acetate oxidation in two-phase (acid-methane) anaerobic digesters. Water Sci. Technol. 64, 1812–1820. doi: 10.2166/wst.2011.748
Shin, S. G., Han, G., Lim, J., Lee, C., and Hwang, S. (2010). A comprehensive microbial insight into two-stage anaerobic digestion of food waste-recycling wastewater. Water Res. 44, 4838–4849. doi: 10.1016/j.watres.2010.07.019
Simpson, P. J., Ross, R. P., Fitzgerald, G. F., and Stanton, C. (2004). Bifidobacterium psychraerophilum sp. nov. and Aeriscardovia aeriphila gen. nov., sp. nov., isolated from a porcine caecum. Int. J. Syst. Evol. Microbiol. 54(Pt. 2), 401–406. doi: 10.1099/ijs.0.02667-0
Solli, L., Håvelsrud, O. E., Horn, S. J., and Rike, A. G. (2014). A metagenomic study of the microbial communities in four parallel biogas reactors. Biotechnol. Biofuels 7:146. doi: 10.1186/s13068-014-0146-2
Strazzera, G., Battista, F., Garcia, N. H., Frison, N., and Bolzonella, D. (2018). Volatile fatty acids production from food wastes for biorefinery platforms: a review. J. Environ. Manage 226, 278–288. doi: 10.1016/j.jenvman.2018.08.039
Tang, J., Wang, X. C., Hu, Y., Zhang, Y., and Li, Y. (2017). Effect of pH on lactic acid production from acidogenic fermentation of food waste with different types of inocula. Bioresour. Technol. 224 (Suppl. C), 544–552. doi: 10.1016/j.biortech.2016.11.111
Westerholm, M., Dolfing, J., Sherry, A., Gray, N. D., Head, I. M., and Schnurer, A. (2011). Quantification of syntrophic acetate-oxidizing microbial communities in biogas processes. Environ. Microbiol. Rep. 3, 500–505. doi: 10.1111/j.1758-2229.2011.00249.x
Westerholm, M., Isaksson, S., Karlsson-Lindsjö, O., and Schnürer, A. (2018). Microbial community adaptability to altered temperature conditions determines the potential for process optimisation in biogas processes. Appl. Energy 226, 838–848. doi: 10.1016/j.apenergy.2018.06.045
Westerholm, M., Levén, L., and Schnürer, A. (2012). Bioargumentation of syntrophic acetate-oxidizing cultures in biogas reactors exposed to increasing levels of ammonia. Appl. Environ. Microbiol. 78, 7619–7625. doi: 10.1128/AEM.01637-12
Westerholm, M., Moestedt, J., and Schnürer, A. (2016). Biogas production through syntrophic acetate oxidation and deliberate operating strategies for improved digester performance. Appl. Energy 179, 124–135. doi: 10.1016/j.apenergy.2016.06.061
Westerholm, M., Roos, S., and Schnürer, A. (2010). Syntrophaceticus schinkii gen. nov., sp. nov., an anerobic, syntrophic acetate-oxidizing bacterium isolated from a mesophilic anaerobic filter. FEMS Micobiol. Lett. 309, 100–104. doi: 10.1111/j.1574-6968.2010.02023.x
Westerholm, M., and Schnürer, A. (2019). “Microbial responses to different operating practices for biogas production systems,” in Anaerobic Digestion London, eds R. Banu., and Y. R. Kannah (London, UK: IntechOpen). doi: 10.5772/intechopen.82815
Wu, Q.-L., Guo, W.-Q., Zheng, H.-S., Luo, H.-C., Feng, X.-C., Yin, R.-L., et al. (2016). Enhancement of volatile fatty acid production by co-fermentation of food waste and excess sludge without pH control: the mechanism and microbial community analyses. Bioresour. Technol. 216, 653–660. doi: 10.1016/j.biortech.2016.06.006
Xiao, B., Qin, Y., Zhang, W., Wu, J., Qiang, H., Liu, J., et al. (2018). Temperature-phased anaerobic digestion of food waste: a comparison with single-stage digestions based on performance and energy balance. Bioresour. Technol. 249, 826–834. doi: 10.1016/j.biortech.2017.10.084
Xiao, K. K., Guo, C. H., Zhou, Y., Maspolim, Y., Wang, J. Y., and Ng, W. J. (2013). Acetic acid inhibition on methanogens in a two-phase anaerobic process. Biochem. Eng. J. 75, 1–7. doi: 10.1016/j.bej.2013.03.011
Yin, J., Yu, X., Zhang, Y., Shen, D., Wang, M., Long, Y., et al. (2016). Enhancement of acidogenic fermentation for volatile fatty acid production from food waste: effect of redox potential and inoculum. Bioresour. Technol. 216, 996–1003. doi: 10.1016/j.biortech.2016.06.053
Yu, Y., Lee, C., Kim, J., and Hwang, S. (2005). Group specific primer and probe sets to detect methanogenic comminities using quantitative real-time polymerase chain reaction. Biotech Bioeng. 89, 670–679. doi: 10.1002/bit.20347
Keywords: two-stage anaerobic digestion, acetate, lactate, syntrophic acetate oxidation, microbial community analyses
Citation: Moestedt J, Müller B, Nagavara Nagaraj Y and Schnürer A (2020) Acetate and Lactate Production During Two-Stage Anaerobic Digestion of Food Waste Driven by Lactobacillus and Aeriscardovia. Front. Energy Res. 8:105. doi: 10.3389/fenrg.2020.00105
Received: 24 November 2019; Accepted: 08 May 2020;
Published: 10 June 2020.
Edited by:
Wei Wang, National Renewable Energy Laboratory (DOE), United StatesReviewed by:
Obulisamy Parthiba Karthikeyan, University of Houston, United StatesMingxing Zhao, Jiangnan University, China
Copyright © 2020 Moestedt, Müller, Nagavara Nagaraj and Schnürer. This is an open-access article distributed under the terms of the Creative Commons Attribution License (CC BY). The use, distribution or reproduction in other forums is permitted, provided the original author(s) and the copyright owner(s) are credited and that the original publication in this journal is cited, in accordance with accepted academic practice. No use, distribution or reproduction is permitted which does not comply with these terms.
*Correspondence: Anna Schnürer, YW5uYS5zY2huJiN4MDAwRkM7cmVyQHNsdS5zZQ==
†These authors share first authorship