 Dionisis Stefanitsis1*Athanasios Nesiadis1
 Konstantina Koutita1
 Aristeidis Nikolopoulos1Nikolaos Nikolopoulos1
 Jens Peters2Jochen Ströhle2Bernd Epple2
- 1Centre for Research and Technology Hellas/Chemical Process and Energy Resources Institute (CERTH/CPERI), Marousi, Greece
- 2Institute for Energy Systems and Technology, Technische Universität Darmstadt, Darmstadt, Germany
In the current work, a transient/dynamic 1-dimensional model has been developed in the commercial software APROS for the pilot 1 MWth CFB boiler of the Technical University of Darmstadt. Experiments have been performed with the same unit, the data of which are utilized for the model validation. The examined conditions correspond to the steady-state operation of the boiler at 100, 80, and 60% heat loads, as well as for transient conditions for the load changes from 80 to 60% and back to 80%. Fair agreement is observed between the simulations and the experiments regarding the temperature profiles in the riser, the heat extracted by the cooling lances, as well as the concentration of the main species in the flue gases; a small deviation is observed for the pressure drop, which, however, is close to the results of a CFD simulation run. The validated model is extended with the use of a thermal energy storage (TES) system, which utilizes a bubbling fluidized bed to store/return the particles during ramp up/down operation. Simulations are performed both with and without the use of TES for the load path 100–80–60–80–100%, and the results showed that the TES concept proved to be superior in terms of changing load flexibility, since the ramp up and down times proved to be much faster, and lower temperature drops between the loads are observed in this case.
Introduction
The 2030 and 2050 EU frameworks for climate and energy(1,2) aim at the decrease of greenhouse gas emissions with improved energy efficiency as well as with larger share than nowadays of Renewable Energy Sources (RES) in the energy supply. However, the replacement of the conventional power plants with RES with stochastic nature, such as wind or solar, creates a flexibility gap between power supply and demand. For example, during a windy day with low power demand, the conventional power plants, such as those operating with lignite or gas, need to operate at partial load for a certain period of time. This creates new challenges for such plants, which should operate efficiently at partial loads and also have high ramp up/down rates, including also fast start up and shut down operation. However, the flexibility of the plants introduces some costs, which are related to: (i) capital expenses for retrofitting of the plants, such as with thermal energy storage, control system optimization, and auxiliary firing; and (ii) operating costs due to increased maintenance needs and/or decreased efficiency (IRENA, 2019). Although the costs depend on the specific technology and plant, to give an idea about its magnitude, for a coal fired power plant the retrofitting costs range from 100 up to 500 €/kW (Energiewende, 2017).
The need for efficient flexible operation applies also to the technology of circulating fluidized bed (CFB) boilers, which has received a lot of attention lately as a viable alternative to pulverized coal combustion, mainly due to its flexible fuel operation as well as its high combustion efficiency and low NOx emissions (Basu, 1999). Modeling of such systems can be done either using CFD simulations [see (Yue et al., 2008; Zhang et al., 2010; Zeneli et al., 2015; Huttunen et al., 2017; Xu et al., 2019) among others], which are 3-dimensional (3D) and generally very sophisticated, but also time consuming, or using simplified 0-D and 1-D models. The one-dimensional (1-D) models, which are not that simplistic and are faster than the CFD simulations, can be incorporated into larger macroscopic models for the simulation of entire power plants. These models are typically utilized to simulate the steady-state operation of a CFB during stable power output [see among others (Huilin et al., 2000; Wang et al., 2002; Yang et al., 2005; Liu et al., 2011; Selcuk and Ozkan, 2011; Kim et al., 2014, 2015; Kaikko et al., 2017)], as also the transient behavior during start-up and ramp up/down operation, which is important for flexible power plant operation.
Regarding the dynamic models for CFBs, which is the focus of this study, Park and Basu (1997) developed a 1.5D core-annulus model of a CFB boiler in order to simulate the transient operation of a 0.3 MWth pilot plant. The coal feed rate was varying in time and the response of the boiler was calculated in terms of temperature and carbon and oxygen concentration at different heights. Good agreement was observed for the aforementioned variables between the simulation and the experiments of the pilot plant. A 1.5D model based on mechanistic and empirical correlations was also developed by Chen and Xiaolong (2006) to simulate the operation of a 410 t/h steam production Pyroflow CFB boiler. Steady-state and transient simulations were performed and the response of various variables in the boiler were estimated. Gungor and Eskin (2007), Gungor and Eskin (2008), and Gungor (2009) developed various 1-D and 2-D (axial and radial direction) models to simulate the operation of CFB boilers in order to investigate their emissions. The models were tested against the experimental data of three boilers of 50 kW, 300 KW, and 160 MW capacities, and good agreement was found regarding various variables including the bed temperature and flue gas composition. The effect of operational parameters such as particle diameter, superficial velocity, excess air, inlet pressure, and fuel type on the bed efficiency and emissions was investigated; their main conclusions was that coal combustion in CFBs can potentially be clean and efficient, while the burning of biomass instead of coal reduces the emissions even further. Xiao et al. (2009) utilized a mathematical model in SIMUCAD, which includes the models of the combustion chamber, the cyclone separator, as well as the back-feeder, in order to simulate the dynamic operation of a 260 t/h CFB boiler. The coal and air inflow rates were changed and the transient response of the bed temperature was estimated; good agreement was found between the simulations and experimental data from the same boiler regarding the aforementioned transient variables as well as critical steady-state parameters during 30 and 50% load operation. Finally, Kim et al. (2016, 2019) extended the model of Kim et al. (2014, 2015) to perform dynamic simulations as well, by calculating the incremental difference from the previous time step, and progressing for the next time step. Two dynamic simulations were performed for a 340 MWe CFB boiler and one with 1500 t/h steam production capacity. The transient effect of the fuel feed rate, air inflow, particle size, solid recirculation rate, and bed height were investigated on the bed temperature and oxygen concentration at the furnace exit. It was found that the temperatures of the dense bed and the furnace exit decrease with the increase of solid circulation rate, while the temperatures at the return part increase. Moreover, they observed that larger particle sizes result in solids accumulation in the dense bed and smaller particle loading in the freeboard.
Although several dynamic CFB models exist in the literature, none of them has been coupled with a thermal energy storage (TES) system, which can operate during its ramp up/down operation with the aim of reducing the time between load changes; the latter is especially important due to the penetration of fluctuating renewable energy sources in the power supply. The only study found in the literature, to the authors' best knowledge, regarding TES in CFBs is the work of Arias et al. (2014) and Arias (2016), who investigated in Aspen Hysys the steady-state operation of an oxy-fired CFB power plant integrated with a TES system. The TES system utilizes two silos, one with high temperature and one with low temperature solids, to store the excess thermal energy during off-peak operation and use it during peak operation. 0-D simulations of a power plant were performed for an operation of 12 h (eight off-peak and four peak), and it was found that the TES integration enabled the plant to produce the same electrical power with a conventional plant, but using only half the fuel thermal input. However, in the work of Arias et al. (2014) and Arias (2016) the TES is utilized only during steady-state operation and also requires the use of two additional heat exchangers, which increase the capital costs of the infrastructure. On the other hand, in the current work transient 1-D simulations are performed during ramp up/down operation of the bed using only an extra bubbling fluidized bed (BFB) to store the particles, as explained in the following paragraph. Therefore, the novelty of the paper lies in the application, for the first time, of a dynamic 1-D model (especially for the BFB reactor) to investigate novel energy storage schemes for CFBs.
Bearing in mind the aforementioned, this work aims to develop a 1-D dynamic process model to simulate the operation of a 1 MWth pilot CFB combustor integrated with a TES system. The model is developed in the commercial software APROS, which has been used in the past for the modeling of CFB boilers (Lappalainen et al., 2017). The TES system is comprised of a BFB, which stores particles from the boiler during ramp/down operation, and returns them during ramp up. The model is validated against experimental data for the 1 MWth pilot CFB during steady-state and transient operation, as well as against results from CFD simulations that were conducted for isothermal conditions based on the model presented in Zeneli et al. (2017). Following that, a hypothetical scenario is simulated for the ramp up and down operation of the boiler with the use of the TES system, and the results are compared with the case without TES. Therefore, the proposed configuration seems to be a good fit for retrofitting cases, in which the ramp up/down rates of existing CFBs need to be increased.
The paper is structured as follows: first, the pilot plant configuration and the experiments are described in general. Afterwards, it follows a section which presents the process flow diagram, the model setup as well as the examined cases. Next, the results are presented for the validation and TES simulations, and, finally, the main conclusions are summarized in the last section of the paper.
Experimental
In the present work, experimental tests are carried out for the 1MWth CFB boiler pilot plant, the data of which are utilized to develop and validate a 1-D APROS model. In the following section, the pilot plant configuration as well as the experimental tests are described briefly.
General Description of the Boiler
The 1 MWth CFB pilot plant of TUDA has been utilized in the past for various applications, including calcium and chemical looping (Ströhle et al., 2014; Haaf et al., 2017, 2020; Ohlemüller et al., 2017; Hilz et al., 2018), as well as CFB combustion. In this work, the pilot plant is utilized to carry out combustion tests with a low rank German lignite fuel. The simplified flow sheet of the CFB600 pilot plant is presented in Figure 1.
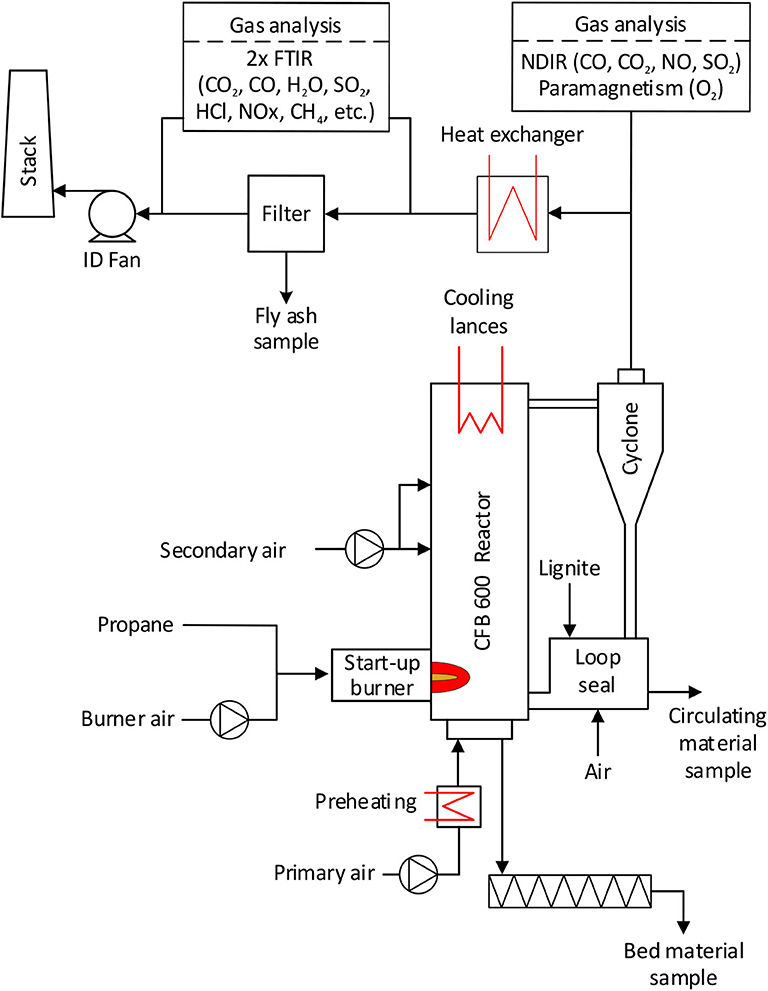
Figure 1. Schematic of the CFB 600 pilot plant.
The reactor has a total height of 8.6 m and an inner diameter equal to 590 mm. Combustion air enters the bed at three locations: electrically preheated primary air enters via a nozzle grid at the bottom of the reactor, while secondary air (25°C) is injected at 2.74 m and at 6.0 m above the dense bed region. For cooling purposes, additional air is injected to the start-up burner. The solid fuel enters the riser via the return leg of the loop seal at a height of 0.48 m. In order to minimize the heat losses, the CFB 600 is fully refractory lined according to industrial standard. Five cooling lances are immersed in the reactor, which can be moved vertically to control its internal temperature. The cooling lances consist of a double tube design, in which the water flows downwards through the inner tube and upwards through the outer one. The most important design characteristics of the CFB600 are summarized in Table 1.
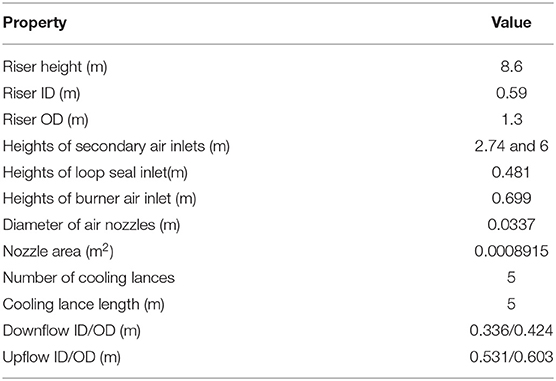
Table 1. Design characteristics of the pilot CFB boiler.
After leaving the riser at the top, particles are separated from the flue gas by a cyclone. The separated particles return to the reactor through the loop seal. This way the residence time of char particles in the combustion zone is increased, therefore enhancing the char burn out. Two air injection nozzles inside the loop seal maintain the fluidization of circulating material to ensure continuous recirculation of particles in the riser. Solid samples can be taken at the loop seal (circulating material) and at the nozzle grid of the riser (bed material). Downstream of the CFB600 the flue gas is cooled down in a heat exchanger before flowing through the fabric filter to separate the fly ash particles. The flue gas then leaves the system via an ID fan and a stack, while the fly ash is extracted from the fabric filter; fly ash samples can be taken at this point. The gas composition is measured at three locations: after the cyclone O2, CO2, CO, NO, and SO2 are measured with NDIR and a paramagnetic sensor, while also two FTIRs equipped with oxygen sensors are installed before and after the fabric filter to measure CO2, H2O, CO, NO, SO2, HCl, NOx, CH4, and other trace gases.
Cooling System
As described in the previous sub-section, heat is extracted from the boiler at two locations: inside the riser via cooling lances, and downstream of the CFB600 via an additional heat exchanger with tube bundles and a membrane wall. The cooling system is a closed pressurized system (8–16 bar), where only liquid water is circulated (no steam production). A simplified flow diagram is shown in Figure 2. After passing the heat exchangers, the heated cooling water is cooled down with an air-cooled re-cooling system to maintain a constant temperature before the heat exchangers. The total mass flow of cooling water is maintained with a pump, which is controlled by a frequency converter. The mass flow through the heat exchangers is controlled by control valves. During the tests, the mass flows through the heat exchangers and the depths of the cooling lances were fixed. In this way, the absorbed heat can be calculated by the temperature difference between the inlet and outlet of each heat exchanger. However, due to unavoidable heat losses to the environment there are uncertainties regarding the heat transfer calculations.
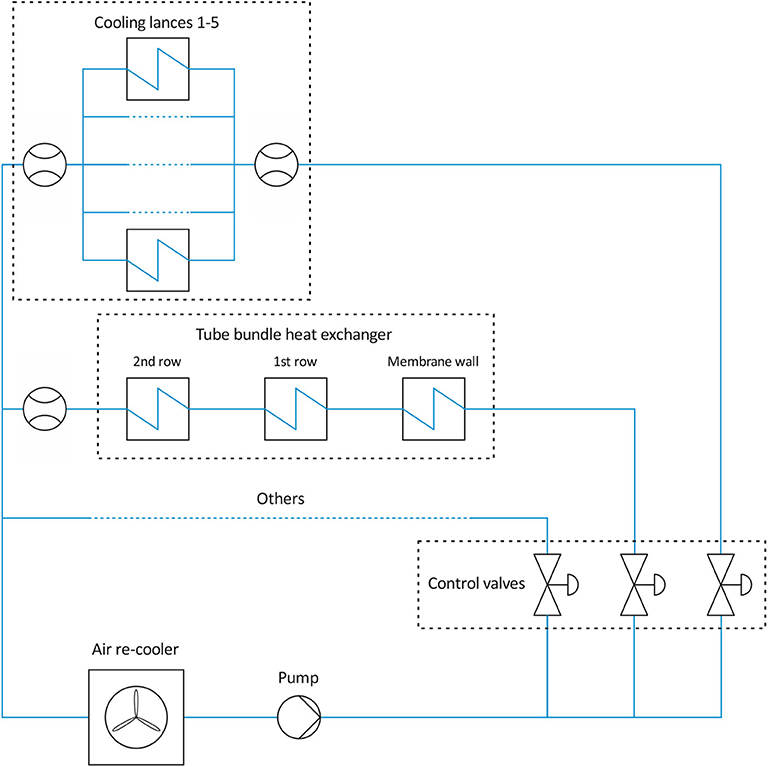
Figure 2. Flow diagram of the cooling system (water side).
The mass flow of water through the cooling lances is measured before and after the lances. The inlet and outlet temperatures of each lance are measured, as well as the total temperature after mixing. The flue gas initially flows downwards through the first row of the heat exchanger and then upwards through the second row; a membrane wall system is installed in both rows. The water temperatures are measured before and after each of the three sub-systems (first row, second row, and membrane wall), while the mass flow is measured after the heat exchanger.
Experimental Conditions and Procedure
In Appendix A some selected properties of the lignite fuel and inert sand are presented (Table 1 in Appendix), along with the ultimate and proximate analyses of the fuel (Table 2 in Appendix). The lower heating value of the fuel is low equal to 10.8 MJ/kg, which is mainly due to the high-water content of the fuel at around 45%. The raw lignite has a very low ash content of around 2.3% as well as a low sulfur content of merely 0.2%. The tests were carried out as follows: long-term steady-state tests (52 h) were performed at a load of around 738 kW, then the load was slowly reduced to 60%. In a subsequent test series, the load was changed stepwise to 80 and to 100%, followed by a load reduction back to 80% and then to 60%. Detailed test parameters and selected results are presented in section Results and Discussion.
Process Flow Diagram, Model Setup, and Examined Cases
Process Flow Diagram
The governing equations that are solved in the APROS software are described in Appendix B, while Figure 3 illustrates the process diagram that has been developed in APROS for the gas/solids side as well as the water cycle of the CFB system. It should be mentioned that the air preheating system is not modeled, while the primary air enters the bed in its preheated condition. In addition, the path of the flue gases after the cyclone and the corresponding tube bundle heat exchanger are also not modeled, since they do not affect the operation of the boiler, which is the main focus of the current work. The fluid types, i.e., air, flue gas, water/steam, and solid materials, i.e., fuel and sand, are defined in the points (1, 10, 32, 33, 34, 28, 23, 37, 38) and the heat structures (5, 13, 20), respectively. The modules in red frame indicate where boundary conditions are defined (e.g., flow rates, pressures, temperatures). All flags (7, 10, 15, 17, 31, 42) are connected to automation diagrams, which control the mass flows of the connected components. The numbers 18, 24, 36, and 43 are measuring instruments of various variables, such as the bed inventory.
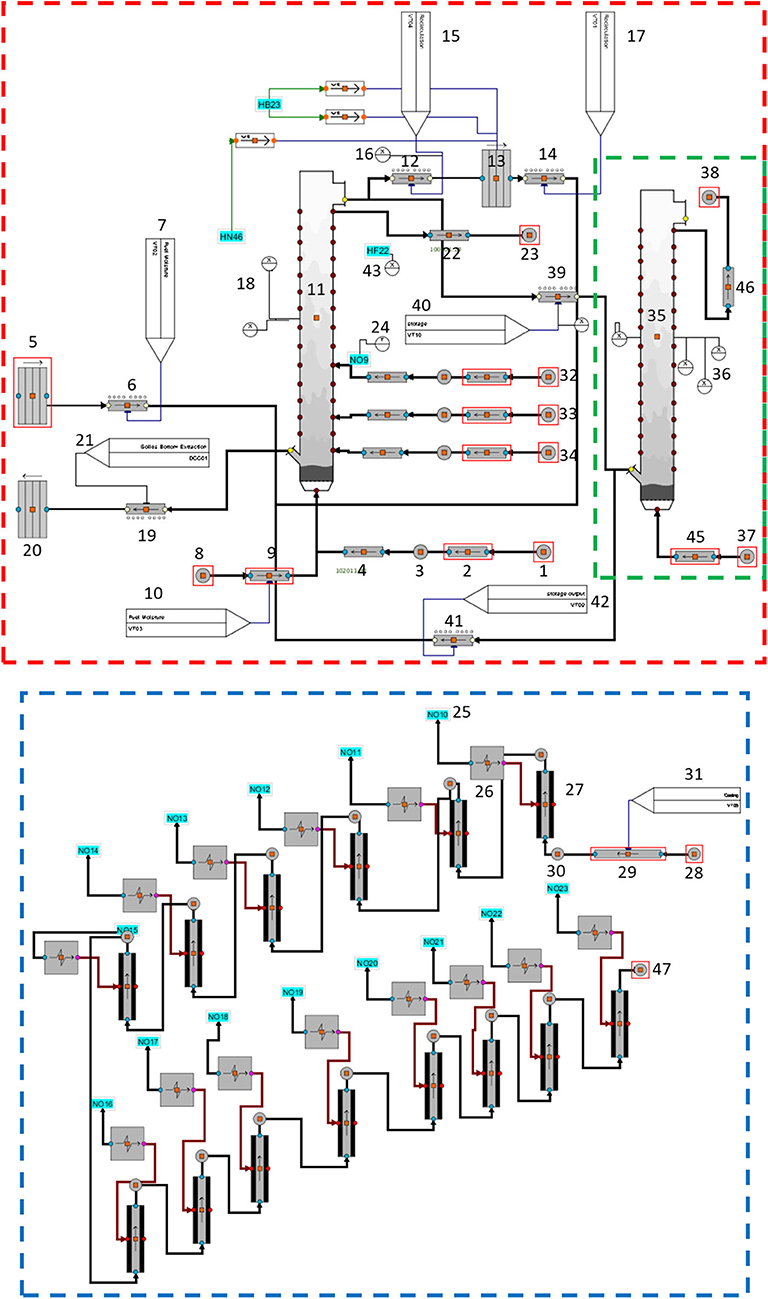
Figure 3. Process diagram of the circulating fluidized bed system (the red colored line highlights the gas/solids side, the blue line highlights the water cycle, while the green line highlights the TES process).
The red colored line highlights the flue gas and solids side. The module no. 11 represents the CFB, while primary air is entering it through point 1 and its connected pipes; secondary air is entering through points 32–34 and the pipes connected to them. The (dry) fuel is entering the system through the particle transmitter no. 6, while the moisture is added separately to the system as a steam phase (point 8 and pipe 9); the latter is done in order to avoid temperature drop in the first node of the bed due to water vaporization. The flue gases are leaving the CFB through pipe 22 and point 23. The solids' recirculation is simulated with the modules 12, 13, and 14, while the particle transmitter no. 19 simulates the bottom extraction system, which keeps the inventory of the bed constant.
The blue colored line highlights the water/steam side, which simulates the cooling lances that extract heat from the riser. Each node of the riser, such as no. 25 of Figure 3, is connected to a heat transfer module and a heat pipe. Water enters the pipes through node 28 and pipe 29, exchanges heat with the CFB, and leaves through point 47.
Finally, the green colored line of Figure 3 highlights the TES concept. Nitrogen is entering the BFB (module 35) through point 37 and pipe no. 45, and leaves it through point no. 38 and pipe no. 46. Nitrogen is used instead of air in order to avoid any reactions within the bed. The BFB module has a height of 6 m and a diameter equal to 0.075 m; its dimensions have been selected such as to minimize heat losses and provide proof of concept for this scheme. Of course, a more thorough design is needed to realistically implement this idea. During ramp down operation, particles are removed from the top of the CFB via transmitter 39 and deposited to the bottom of the BFB, while during ramp up operation they are returned to the bottom of CFB via transmitter 41; more details on the specific gas and solid mass flow rates as well as the conditions of nitrogen are presented in section Thermal Energy Storage (TES) Simulations.
Validation Simulations
Steady-State Simulations
For the steady state simulations three operating loads have been simulated based on the heat transferred through the cooling lances: 100, 80, and 60%, with properties as shown in Table 2. Tuning of the design parameters was performed to fit the model results to those of the experiment. These include reaction speed coefficients, diffusion coefficients of bed, heat transfer efficiencies of the cooling lances, as well as wall heat losses (see Appendix C).
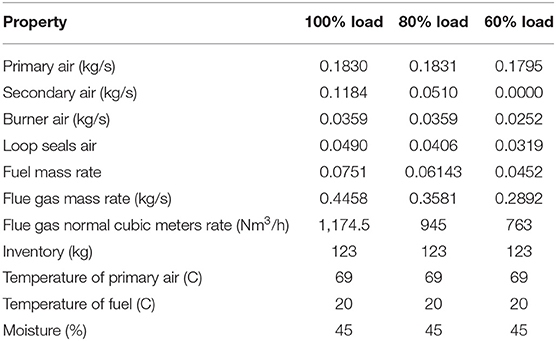
Table 2. Operational data of the three examined loads for the steady-state simulations.
Transient Simulation
A dynamic simulation has been performed in the APROS software for the transition from 80% load to 60% and back to 80%. The conditions of the different loads are those of Table 2, while the time duration of each load is: 80% load from 0 min up to 45 min, 60% load from 85 min up to 295 min, and 80% load from 335 min up to 457 min. While the change in the variables is done stepwise in the experiments conducted in TUDA, in the simulations this occurs by a gradual (linear) increase for 40 min to limit numerical instabilities.
Thermal Energy Storage (TES) Simulations
Two simulations are performed to investigate the TES concept: one with the use of a BFB to store the hot particles during ramp up and down operation and one without TES for comparison. The load of the CFB follows the path 100–80–60–80–100%, while the operational data of both cases are shown in Table 3. The difference between the two cases is essentially that in the first case the inventory of the CFB changes by 10 kg at each load change, while an opposite change also occurs in the inventory of the BFB. For the second case the inventory of the CFB remains constant at 190 kg. Note that this is a different value from the one used in the validation part (Table 2) to avoid hydrodynamic problems at low loads, as for example minimum or even zero entrainment. This is because at low load fast fluidization conditions are not achieved, based on the operational conditions and Grace's diagram. In addition, the efficiency of the cooling lances has been modified in order to keep the heat removal as close as possible to that of the validation part; the rest of the data are identical.
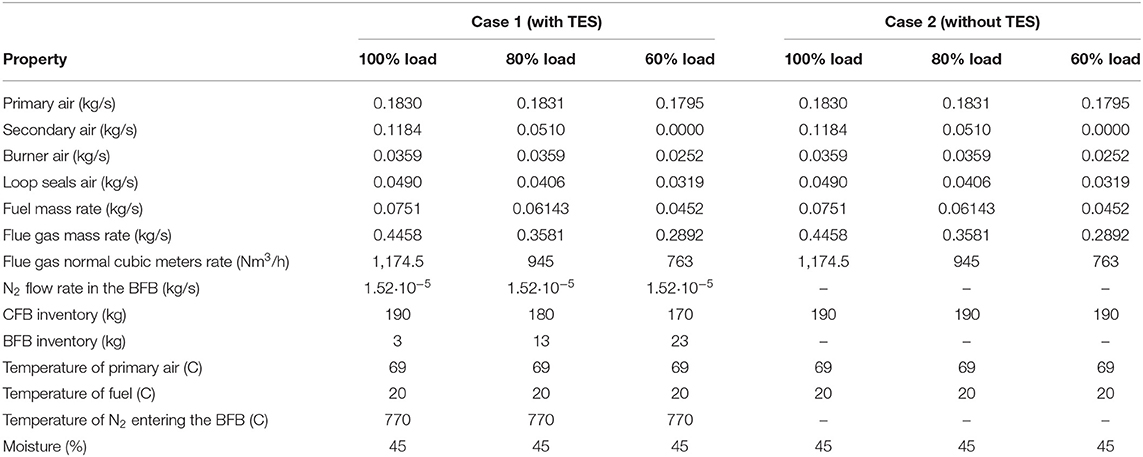
Table 3. Operational data of the two simulation cases for the TES concept.
The nitrogen enters the BFB at a temperature of 770°C, which might be unrealistic for practical application, but it has been chosen to minimize the heat losses in the bed; the low nitrogen flow rate aids in this as well. Of course, various technicalities will induce heat losses. The transition of particles from the CFB to the BFB during the ramp down operation occurs with a mass flow rate equal to 5% of the recirculation flow rate. The transition of particles from the BFB to the CFB during ramp up operation occurs with a fixed mass flow rate equal to 0.028 kg/s, which means that the mass transfer occurs at approximately 6 min. Each load is simulated for 10,000 s (total simulation time 50,000 s) to ensure that the steady-state is reached before switching to the next load.
Results and Discussion
Validation
In order to assess the validity of the model, the results of the steady-state and transient simulations are compared against the experimental data of TUDA performed in the pilot CFB boiler, as well as against data from CFD simulations. The CFD simulations are conducted following the isothermal simplification and by applying the model described in Zeneli et al. (2017). These are presented in the following sub-sections for the steady-state and transient cases.
Steady-State Simulations
Table 4 presents the heat absorbed by the cooling lances, which is essentially the thermal power output of the CFB unit, as predicted by the experiments and the simulations for the three examined loads. A difference of <12% is observed between the results of the simulations and those of the experiments for all examined loads.
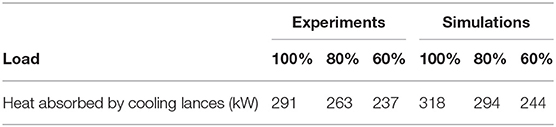
Table 4. Experimental and simulation results on heat absorbed by the lances.
Figure 4 presents the temperature profiles as predicted by the simulations and the experiments for the three examined loads: 100, 80, 60%; the position of the cooling lances in the riser is also illustrated in the graphs. For all examined loads, the temperature increases up to approximately H = 3 m, which is attributed to the high reaction rates in the first stages of the riser. After that height, the temperature starts to decrease due to the presence of the cooling lances. In addition, an abrupt decrease in the temperature is observed at the height of 6 m, due to air staging. As the load decreases, the temperature profile becomes less uniform, similar to Huttunen et al. (2017), and also lower temperatures are observed, since less fuel is burnt. Regarding the comparison between the simulations and the experiments, a very good agreement is observed for the 100% load, while for the 80 and 60% a small deviation is observed up to H = 2 m; in any case, the average deviation in the predicted temperature is <4.2%.
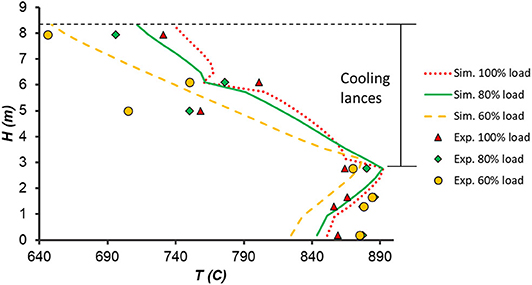
Figure 4. Temperature profiles as predicted by the simulations and the experiments for the three examined loads: 100, 80, and 60%. The position of the cooling lances is also shown in the graph.
Another important variable in the CFB is the pressure profile along the riser, which is presented in Figure 5 for the three examined loads as predicted by: (i) the APROS simulations, (ii) the experiments of TUDA, (iii) CFD simulations using the conventional Gidaspow drag model, (iv) CFD simulations using the advanced EMMS drag model. The pressure difference is high at the initial stages of the riser, up to ~1 m, while a rapid decrease is observed after that point. Although the APROS predictions underestimate the pressure drop when comparing with the experimental measurements, they are close to the results of the CFD simulations with the Gidaspow model. This means that the 1-D APROS model can reproduce the accuracy of the 3D CFD model, at least when conventional models are applied.
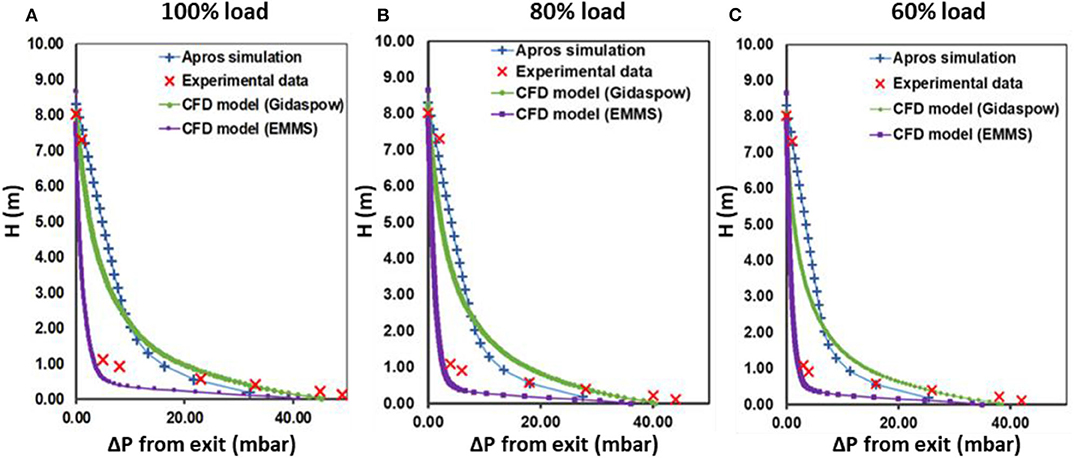
Figure 5. Pressure profiles as predicted by the APROS and CFD simulations as well as the experiments for the three examined loads: (A) 100%, (B) 80%, and (C) 60%.
Transient Simulations
Figure 6 presents the temporal evolution of the temperature at two different heights in the bed (8.3 and 2.77 m), as predicted by the transient simulation and the experiments (transition 80–60–80% loads). The decrease in the load from 80 to 60% results in a decrease in the bed temperature, which is larger for larger heights. The results of the simulations are close to those of the experiments for the 8.3 and 2.77 m heights, while a small initial deviation might be attributed to the difference in the measurement points; this mismatch between the measuring points in the experiments and the simulations occurs due to the discretization of the CFB, which is done using 23 nodes, each corresponding to a height increase of 0.37 m.
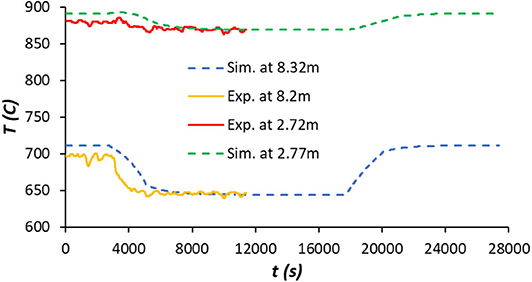
Figure 6. Temporal evolution of the temperature at three different heights in the bed as predicted by the transient simulation and the experiment.
The temporal evolution of the pressure drop is presented in Figure 7, as predicted by the transient simulation and the experiment at two different heights (0.55 and 7.21 m). Again, a good agreement is observed between the results of the simulation and the experimental data, apart from an underprediction for the pressure in the simulations at the height of 7.21 m; however, the pressure drop at that height is very small and prone to measurement uncertainties. The high frequency oscillations appearing in the experimental data typically originate from either bubble activity in the bed (formation, coalescence, eruption, etc.) or disturbances in the air-supply system, fuel feed, etc., phenomena which are not modeled by the APROS model, while it is well-documented that in principle they exist (Sasic et al., 2007; Nikolopoulos et al., 2013).
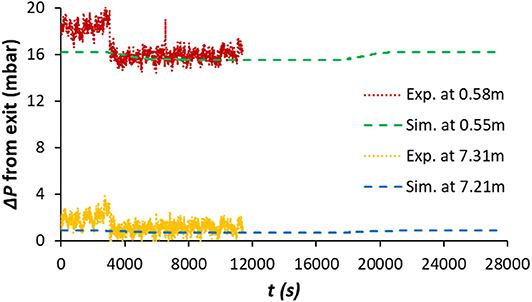
Figure 7. Temporal evolution of pressure drop at two different heights in the bed as predicted by the transient simulation and the experiment.
Finally, the temporal evolution of the concentration of three components of the flue gas (CO2, O2, and H2O) is presented in Figure 8, as predicted by the simulation and the experiment. The concentration of H2O is the one that is affected the most by the load change (Table 2). A good agreement is observed between the simulation and the experiment, with the largest deviation being in the H2O concentration in the order of 13%, as shown in Table 5, which presents the average values and standard deviations of the examined variables, as predicted by the simulation and the experiment for the two examined loads (80 and 60%). Apart from a large difference in pressure, which might be attributed to the different heights in the measurements and was also present in the steady-state simulations (Figure 5), the differences of the average values between the simulations and the experiments is <15%. Moreover, the small values of the standard deviations in the simulation indicate that their results are less fluctuating compared to the experimental data.
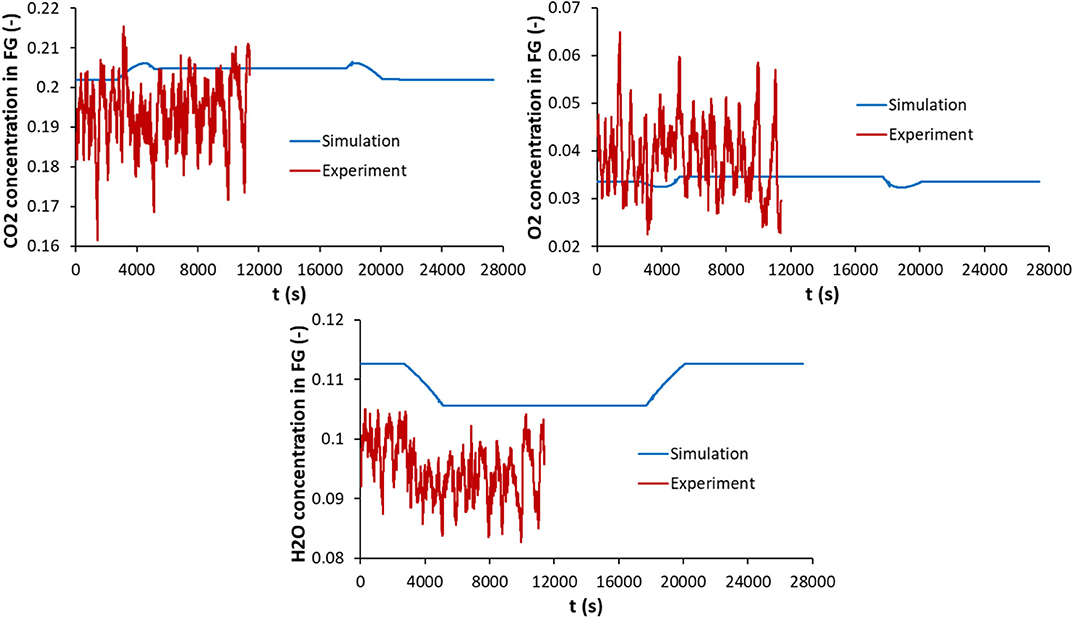
Figure 8. Temporal evolution of flue gas components as predicted by the transient simulation (H = 0.18 m) and the experiment (0.11 m).
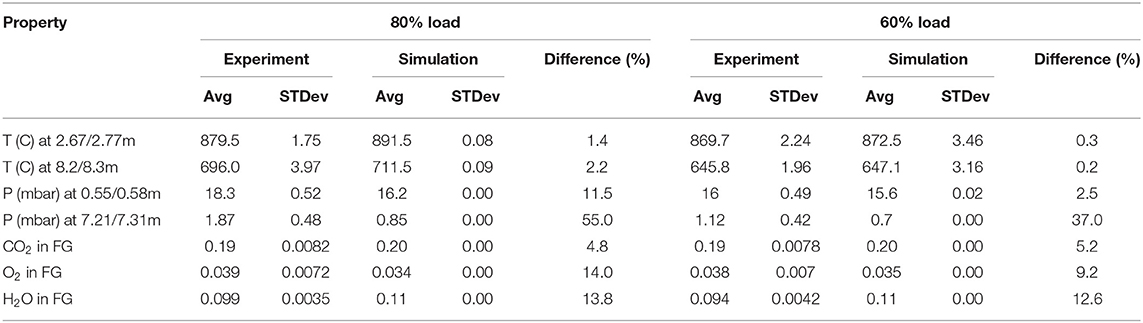
Table 5. Average values and standard deviations of the examined properties as predicted by the transient simulation and the experiment for the 80% and 60% loads.
Thermal Energy Storage (TES) Simulations
First, the steady-state results of the temperature and pressure profiles are presented in Figure 9, as predicted by the simulations for the case with TES system (case 1) and without (case 2), for the three examined loads (100, 80, and 60%). By looking at Figure 9A, it is observed that the case with TES (case 1) predicts lower temperature drops between the loads compared to the case without (case 2), since the decrease of inventory results in lower solid mass to be heated by the fuel. Regarding the pressure profile (Figure 9B), this remains relatively constant when the inventory is constant between the loads (case 2), while it decreases with the decrease of inventory (case 1).
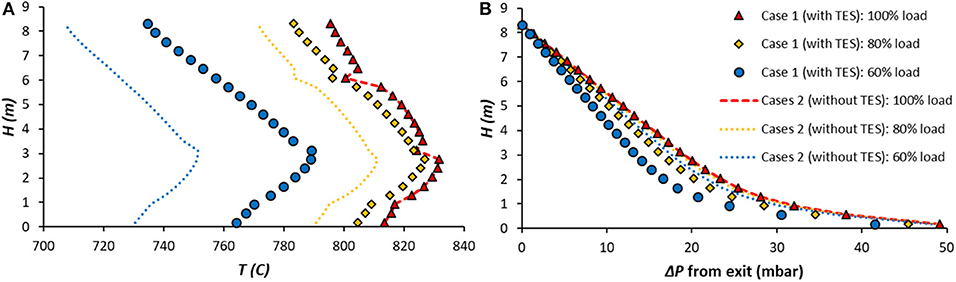
Figure 9. Steady-state (A) temperature and (B) pressure profiles of the CFB as predicted by the simulations of case 1 (with TES) and case 2 (without TES) for the three loads (100, 80, and 60%).
Turning now to the transient results, Figure 10 shows the temporal evolution of the volume weighted average temperature of the CFB and the heat removed by the lances, as predicted by the simulation of 100–80–60–80–100% load changes for the two cases (with and without TES). Again, the lower temperature drops of case 1 are observed in Figure 10A, while by looking at Figure 10B lower heat removal is observed for case 1 at the 80 and 60% loads compared to case 2. The latter might be attributed to the smaller particle loading which decreases the effective heat transfer to the heat transfer surfaces.
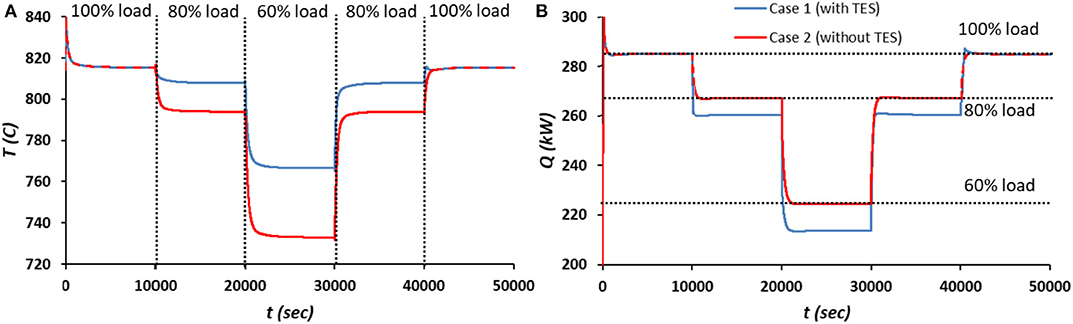
Figure 10. Temporal evolution of the (A) average temperature of the CFB and (B) heat removed by the lances, as predicted by the transient simulation of 100–80–60–80–100% load changes for the two cases (with and without TES). The heat loads are shown in the image as well.
Since the purpose of the current work is to investigate the effect of TES on the ramp up and down operation of the boiler, Figure 11 illustrates zoomed regions of Figure 10B during the ramp up and down transitions (first 1,000 s). The transitions in the case without TES (case 2) occur with a constant slope, while those with the TES (case 1) are steeper during the particle removal/injection and become less steep after that. This adding/removal of mass increases/decreases the heat transfer rates that help in the speed-up of load change. For all transitions, the case with the TES (case 1) shows faster ramp up and down times, as shown in the graphs for the time required to reach 98% of the ΔQ between the load changes. The ratios of t98% ΔQ, case 2/t98% ΔQ, case 1 have been calculated equal to: 4.8 for the transition from 100% load to 80%, 1.31 from 80 to 60%, 2.09 from 60 to 80%, and 1.99 from 80 to 100%. If the percentage of the analog filter constant is used for ΔQ, which is equal to 63%, the ratios become: 3.79, 3.09, 1.28, and 1.1, respectively. It should be mentioned that this speed up can be only attributed to the sensible heat added/removed from the CFB since no unburned char is transported to the BFB TES unit.
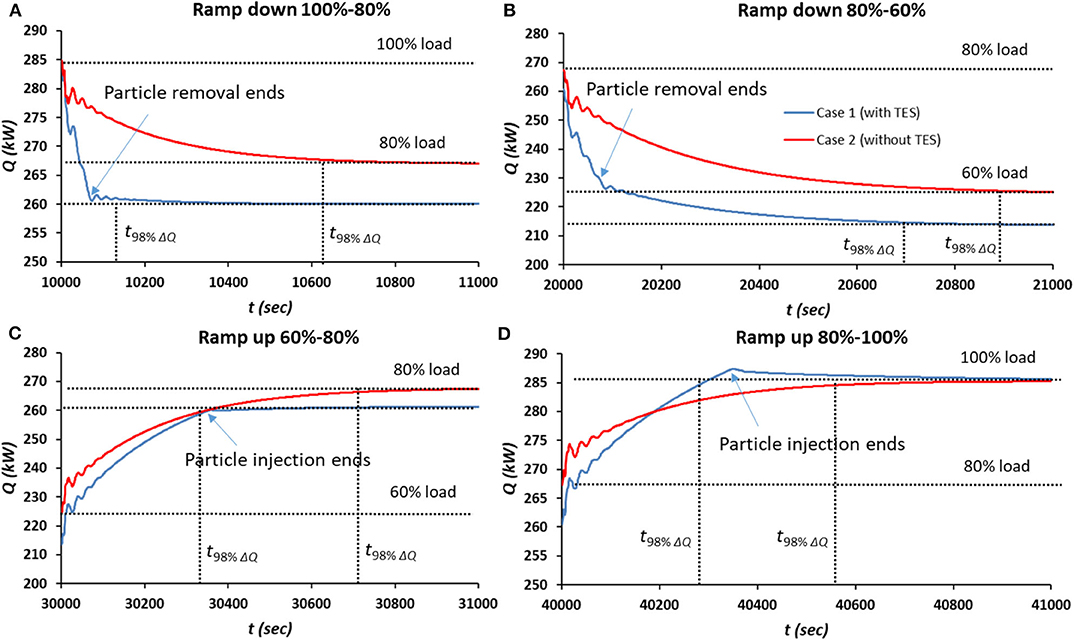
Figure 11. (A-D) Zoomed regions of Figure 10B around the ramp up and down transitions (first 1,000 s). The time when the particle removal/injection ends is also shown in the graphs as well as the time that the Q reaches the 98% of the ΔQ.
Based on the aforementioned results a proof of concept is presented for an interesting ramp up/down strategy that can improve the transition rates between the different loads. This strategy compared to the idea of Arias et al. (2014) and Arias (2016) does not require the use of additional heat exchangers, which increase the capital costs, and also is applied during transient operation instead of steady-state.
Conclusions
The purpose of the current work was to investigate the operation of a CFB boiler equipped with a TES, which uses a BFB to store/return the hot particles during ramp up/down operation. For this reason, a dynamic 1-D model was developed in the commercial software APROS for the 1 MWth CFB unit of TUDA. Initially, steady-state simulations were performed for the 100, 80, and 60% loads, as well as a transient simulation for the transition from 80 to 60% load and back to 80%. The results were compared against experimental data, produced through dynamic experiments in the aforementioned unit, and good agreement was found for the heat extracted through the cooling lances, the temperature profiles, as well as the concentration of the main flue gas species; the pressure drop profile did not quite agree with the experimental data, but it is in agreement with 3D CFD simulations using conventional models. Bearing in mind the above, it can be concluded that there is a fairly good agreement between the simulations and the experiments, and therefore the model can be considered trustworthy.
As a next step, a simulation scenario was tested with and without the use of the TES system for the load transitions 100–80–60–80–100%. It was found that the case with the TES significantly decreases the time required to reach-steady state between load changes. This time is measured as the time required to reach 98% of the ΔQ between the transitions (or 63% using the analog filter constant), and the ratio twithout TES/ twith TES has been calculated equal to: 4.8 (or 3.79 with the filter constant) for the transition from 100% load to 80%, 1.31 (or 3.09) from 80 to 60%, 2.09 (or 1.28) from 60 to 80%, and 1.99 (or 1.1) from 80 to 100%. However, it should be mentioned that this improvement is only attributed to the sensible heat added/removed to the CFB, since no unburned char is present in the entrainment. In addition, the decrease of inventory resulted in lower steady-state temperature drops, when the load was decreased. Based on these results a proof of concept strategy is introduced in the current work that can improve the ramp up/down rates of a CFB with the use of only a BFB as TES, without the requirement of extra heat exchangers as it was the case in previous studies (Arias et al., 2014; Arias, 2016). Nevertheless, before proceeding to the actual implementation of such a system the related added capital costs should be evaluated in a techno-economic study, which is out of the scope of the present work.
Data Availability Statement
The raw data supporting the conclusions of this article will be made available by the authors, without undue reservation, to any qualified researcher.
Author Contributions
DS: TES simulations in APROS. KK: validation simulations in APROS. ANe, ANi, and NN: supervision of APROS simulations. JP, JS, and BE: experimental investigation of CFB. All authors contributed to the article and approved the submitted version.
Funding
Financial support is acknowledged from the RFCS project of the European Commission under Grant Agreement No. 754032 (FLEXible operation of FB plants co-Firing LOw rank coal with renewable fuels compensating vRES – FLEX FLORES).
Conflict of Interest
The authors declare that the research was conducted in the absence of any commercial or financial relationships that could be construed as a potential conflict of interest.
Supplementary Material
The Supplementary Material for this article can be found online at: https://www.frontiersin.org/articles/10.3389/fenrg.2020.00169/full#supplementary-material
Abbreviations
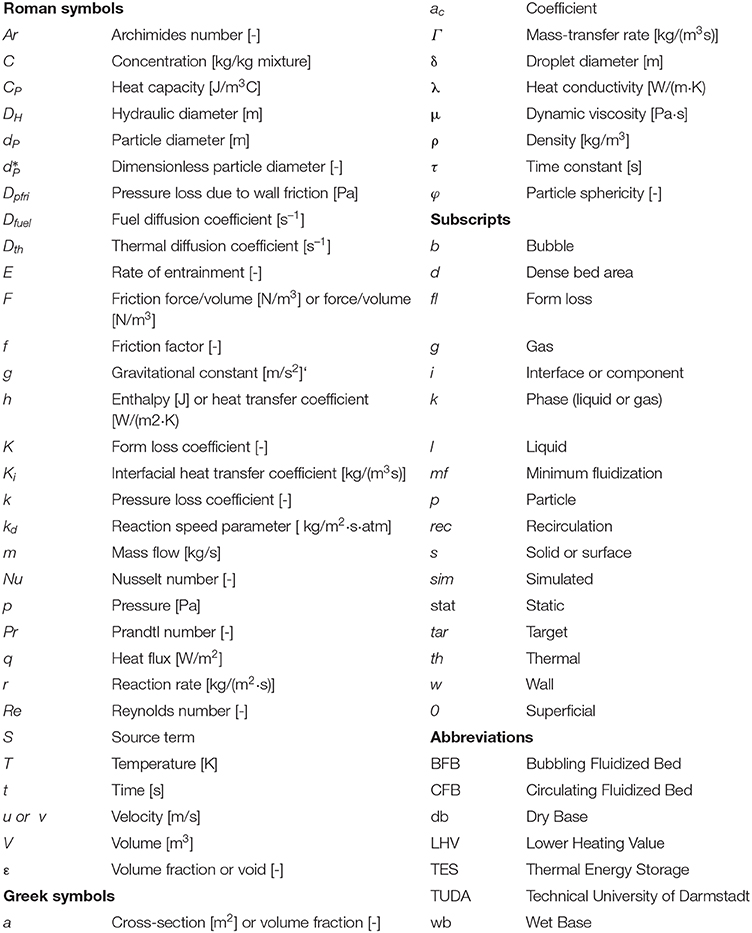
BFB, Bubbling Fluidized Bed; CFB, Circulating Fluidized Bed; db, Dry Base; LHV, Lower Heating Value; TES, Thermal Energy Storage; TUDA, Technical University of Darmstadt; wb, Wet Base.
Footnotes
References
Arias, B. (2016). An analysis of the operation of a flexible oxy-fired CFB power plant integrated with a thermal energy storage system. Int. J. Greenhouse Gas Control 45, 172–180. doi: 10.1016/j.ijggc.2015.12.007
Arias, B., Criado, Y., Sanchez-Biezma, A., and Abanades, J. C. (2014). Oxy-fired fluidized bed combustors with a flexible power output using circulating solids for thermal energy storage. Appl. Energy 132, 127–136. doi: 10.1016/j.apenergy.2014.06.074
Basu, P. (1999). Combustion of coal in circulating fluidized-bed boilers: a review. Chem. Eng. Sci. 54, 5547–5557. doi: 10.1016/S0009-2509(99)00285-7
Chen, Y., and Xiaolong, G. (2006). Dynamic modeling and simulation of a 410 t/h Pyroflow CFB boiler. Comput. Chem. Eng. 31, 21–31. doi: 10.1016/j.compchemeng.2006.04.006
Gungor, A. (2009). One dimensional numerical simulation of small scale CFB combustors. Energy convers. Manage. 50, 711–722. doi: 10.1016/j.enconman.2008.10.003
Gungor, A., and Eskin, N. (2007). Analysis of environmental benefits of CFB combustors via one-dimensional model. Chem. Eng. J. 131, 301–317. doi: 10.1016/j.cej.2006.12.012
Gungor, A., and Eskin, N. (2008). Effects of operational parameters on emission performance and combustion efficiency in small-scale CFBCs. J. Chin. Inst. Chem. Eng. 39, 541–556. doi: 10.1016/j.jcice.2008.05.007
Haaf, M., Peters, J., Hilz, J., Unger, A., Ströhle, J., and Epple, B. (2020). Combustion of solid recovered fuels within the calcium looping process – experimental demonstration at 1 MWth scale. Exp. Thermal Fluid Sci. 113:110023. doi: 10.1016/j.expthermflusci.2019.110023
Haaf, M., Stroh, A., Hilz, J., Helbig, M., Ströhle, J., and Epple, B. (2017). Process modelling of the calcium looping process and validation against 1 MWth pilot testing. Energy Procedia 114, 167–178. doi: 10.1016/j.egypro.2017.03.1159
Hilz, J., Helbig, M., Haaf, M., Daikeler, A., Ströhle, J., and Epple, B. (2018). Investigation of the fuel influence on the carbonate looping process in 1 MWth scale. Fuel Process. Technol. 169, 170–177. doi: 10.1016/j.fuproc.2017.09.016
Huilin, L., Guangbo, Z., Rushan, B., Yongjin, C., and Gidaspow, D. (2000). A coal combustion model for circulating fluidized bed boilers. Fuel 79, 165–172. doi: 10.1016/S0016-2361(99)00139-8
Huttunen, M., Peltola, J., Kallio, S., Karvonen, L., Niemi, T., and Ylä-Outinen, V. (2017). Analysis of the processes in fluidized bed boiler furnaces during load changes. Energy Procedia 120, 580–587. doi: 10.1016/j.egypro.2017.07.175
IRENA (2019). Innovation Landscape Brief: Flexibility in Conventional Power Plants. Abu Dhabi: International Renewable Energy Agency.
Kaikko, J., Mankonen, A., Vakkilainen, E., and Sergeev, V. (2017). Core-annulus model development and simulation of a CFB boiler furnace. Energy Procedia 120, 572–579. doi: 10.1016/j.egypro.2017.07.172
Kim, S., Choi, S., Lappalainen, J., and Song, T.-H. (2019). Dynamic simulation of the circulating fluidized bed loop performance under the various operating conditions. Proc. Inst. Mech. Eng Part A J. Power Energy. 233, 901–913. doi: 10.1177/0957650919838111
Kim, S., Choi, S., and Yang, J. (2016). Dynamic simulation of a circulating fluidized bed boiler system Part I: description of the dynamic system and transient behavior of sub-models. J. Mech. Sci. Technol. 30, 5781–5792. doi: 10.1007/s12206-016-1148-8
Kim, T., Choi, S., and Hyun, J. (2014). Performance prediction of a circulating fluidized bed boiler by heat exchangers block simulation at varying load conditions. Proc. Inst. Mech. Eng Part A J. Power Energy 228, 17–32. doi: 10.1177/0957650913506006
Kim, T., Choi, S., and Kim, J.-S. (2015). Performance prediction of a large-scale circulating fluidized bed boiler by heat exchangers block simulation. Proc. Inst. Mech. Eng Part A J. Power Energy 229, 298–308. doi: 10.1177/0957650914563365
Lappalainen, J., Lalam, V., Charreire, R., and Ylijoki, J. (2017). “Dynamic modelling of a CFB boiler including the solids, gas and water-steam systems,” in 12th International Conference on Fluidized Bed Technology, CFB-12 (At Krakow), 321–328.
Liu, B., Yang, X., Song, W., and Lin, W. (2011). Process simulation development of coal combustion in a circulating fluidized bed combustor based on aspen plus. Energy Fuels 25, 1721–1730. doi: 10.1021/ef101439s
Nikolopoulos, A., Nikolopoulos, N., Charitos, A., Grammelis, P., Kakaras, E., Bidwe, A., et al. (2013). High-resolution 3-D full-loop simulation of a CFB carbonator cold model. Chem. Eng. Sci. 90, 137–150. doi: 10.1016/j.ces.2012.12.007
Ohlemüller, P., Ströhle, J., and Epple, B. (2017). Chemical looping combustion of hard coal and torrefied biomass in a 1MWth pilot plant. Int. J. Greenhouse Gas Control 65, 149–159. doi: 10.1016/j.ijggc.2017.08.013
Park, C., and Basu, P. (1997). A model for prediction of transient response to the change of fuel feed rate to a circulating fluidized bed boiler furnace. Chem. Eng. Sci. 52, 3499–3509. doi: 10.1016/S0009-2509(97)00128-0
Sasic, S., Leckner, B., and Johnsson, F. (2007). Characterization of fluid dynamics of fluidized beds by analysis of pressure fluctuations. Prog. Energy Combust. Sci. 33, 453–496. doi: 10.1016/j.pecs.2007.03.001
Selcuk, N., and Ozkan, M. (2011). Simulation of circulating fluidized bed combustors firing indigenous lignite. Int. J. Thermal Sci. 50, 1109–1115. doi: 10.1016/j.ijthermalsci.2011.01.022
Ströhle, J., Orth, M., and Epple, B. (2014). Design and operation of a 1 MWth chemical looping plant. Appl. Energy 113, 1490–1495. doi: 10.1016/j.apenergy.2013.09.008
Wang, Q.-H., Luo, Z.-Y., Ni, M.-J, and Ke-fa, C. (2002). Model prediction of the operating behavior of a circulating fluidized bed boiler. J. Zhejiang Univ. Sci. A 3, 251–257. doi: 10.1631/jzus.2002.0251
Xiao, H., Bai, J., Wu, Y., Wang, J., Yang, X., Zhang, G., et al. (2009). ISECS International Colloquium on Computing, Communication, Control, and Management. Sanya: IEEE, 246–249.
Xu, L., Cheng, L., Ji, J., Wang, Q., and Fang, M. (2019). A comprehensive CFD combustion model for supercritical CFB boilers. Particuology 43, 29–37. doi: 10.1016/j.partic.2017.11.012
Yang, H., Yue, G., Xiao, X., Lu, J., and Liu, Q. (2005). 1D modeling on the material balance in CFB boiler. Chem. Eng. Sci. 60, 5603–5611. doi: 10.1016/j.ces.2005.04.081
Yue, G. X., Yang, H. R., Nie, L., Wang, Y. Z., and Zhang, H. (2008). “Hydrodynamics of 300 and 600 MWe CFB boilers with asymmetric cyclone layout,” in Proceedings of the 9th International Conference on Circulating Fluidized Beds (Hamburg), 13–16.
Zeneli, M., Nikolopoulos, A., Nikolopoulos, N., Grammelis, P., and Kakaras, E. (2015). Application of an advanced coupled EMMS-TFM model to a pilot scale CFB carbonator. Chem. Eng. Sci. 138, 482–498. doi: 10.1016/j.ces.2015.08.008
Zeneli, M., Nikolopoulos, A., Nikolopoulos, N., Grammelis, P., Karellas, S., and Kakaras, E. (2017). Simulation of the reacting flow within a pilot scale calciner by means of a three phase TFM model. Fuel Process. Technol. 162, 105–125. doi: 10.1016/j.fuproc.2017.03.032
Zhang, N., Lu, B., Wang, W., and Li, J. (2010). 3D CFD simulation of hydrodynamics of a 150MWe circulating fluidized bed boiler. Chem. Eng. J. 162, 821–828. doi: 10.1016/j.cej.2010.06.033
Nomenclature
Keywords: CFB, dynamic model, APROS, experimental investigation of CFB load change, thermal energy storage, ramp up/down
Citation: Stefanitsis D, Nesiadis A, Koutita K, Nikolopoulos A, Nikolopoulos N, Peters J, Ströhle J and Epple B (2020) Simulation of a CFB Boiler Integrated With a Thermal Energy Storage System During Transient Operation. Front. Energy Res. 8:169. doi: 10.3389/fenrg.2020.00169
Received: 17 February 2020; Accepted: 01 July 2020;
Published: 02 September 2020.
Edited by:
Francois M. A. Marechal, École Polytechnique Fédérale de Lausanne, SwitzerlandReviewed by:
Ligang Wang, École Polytechnique Fédérale de Lausanne, SwitzerlandAmin Ghobeity, Sheridan College, Canada
Copyright © 2020 Stefanitsis, Nesiadis, Koutita, Nikolopoulos, Nikolopoulos, Peters, Ströhle and Epple. This is an open-access article distributed under the terms of the Creative Commons Attribution License (CC BY). The use, distribution or reproduction in other forums is permitted, provided the original author(s) and the copyright owner(s) are credited and that the original publication in this journal is cited, in accordance with accepted academic practice. No use, distribution or reproduction is permitted which does not comply with these terms.
*Correspondence: Dionisis Stefanitsis, c3RlZmFuaXRzaXNAY2VydGguZ3I=