 Holger Wiertzema
 Elin Svensson
 Simon Harvey
- 1Division of Energy Technology, Department of Space, Earth and Environment, Chalmers University of Technology, Gothenburg, Sweden
- 2CIT Industriell Energi AB, Gothenburg, Sweden
Electrification of industrial processes is one of the frequently discussed options to reduce greenhouse gas emissions from energy-intensive industries. This paper presents a bottom–up framework to assess process electrification options for energy-intensive industrial process plants in terms of greenhouse gas emissions and energy costs. The framework is based upon pinch analysis energy targetting methods, and accounts for site-specific conditions, including the effects on heat recovery potential and overall mass and energy balances. Furthermore, interactions between the process site and the background energy system are considered and scenarios are introduced in order to assess the impact of electrification options under different possible future energy market conditions. The framework is illustrated by a case study for an existing chemical plant for which there is a broad variety of electrification options that affect the process in different ways. The option of replacing the natural gas based syngas production unit with electrified syngas and steam production is analysed in detail. The results indicate natural gas savings of 173 MW whereas the electricity demand increases by 267 MW, leading to a strong increase in energy costs but also avoided greenhouse gas emissions of 333 kt/a. For two selected energy market scenarios for 2030 and 2040, the energy costs increase by 59 and 50 M€/a, respectively. The framework can be used to compare electrification with other process greenhouse gas emission reduction measures and to support policy and industrial decision making.
Introduction
In 2014, the industrial sector accounted for 36% (154 EJ) of global final energy use and 24% (8.3 GtCO2) of direct fossil CO2 emissions. Five energy-intensive sectors, namely chemicals and petrochemicals, iron and steel, cement, pulp and paper as well as aluminium dominate in terms of industrial energy use with a share of 69% (International Energy Agency, 2017b).
In the light of the Paris agreement, the pressure on industry to contribute to substantial greenhouse gas emission reduction has increased. Electricity can be used to replace fossil fuels for direct process energy demand as well as to produce fuels and raw materials. This fuel switch in conjunction with the anticipated increasing amount of electricity from renewable sources can potentially lead to a significant reduction in greenhouse gas emissions at the plant but also at the national and global energy systems level. As the production cost for renewable electricity is expected to decrease in the future, process electrification will become more economically feasible (International Energy Agency, 2017a). However, there is still a degree of uncertainty about who will bear the costs for the significant grid investments that are needed to achieve massive electrification of industry. Depending on the electricity generation mix, electrification can already today lead to a reduction of greenhouse gas emissions and cost. From a company’s perspective, process electrification can be a measure not only to comply with emission limits but also to reduce the costs associated with emitting greenhouse gases (e.g., within EU ETS). This will become even more important in the future since the price for EU ETS emission allowances is expected to increase (European Roundtable on Climate Change and Sustainable Transition, 2019). Furthermore, electrification can enable participation in flexibility markets (e.g., by providing on demand load-shedding) which can lead to additional revenues.
Variety of Process Electrification Options
Electricity is a versatile energy carrier in industrial processes, and this leads to a comprehensive variety of electrification options. Electricity can be used directly in certain industrial process operations or indirectly via electro-fuels and electro-feedstock. It can be used for process heating purposes to drive heat pumps or electric steam generators. Advanced electro-thermal technologies such as electromagnetic radiation, plasma technologies and microwaves can be highly efficient and offer a high degree of controllability. In the future, high-temperature heat pumps will potentially be able to provide a much higher share of the industrial heat demand. Electricity can also provide the driving force for pressure-driven membrane separation processes or production of hydrogen through water electrolysis. This hydrogen can be used for process purposes (e.g., for hydrotreatment) or combined with CO or CO2 to produce synthetic fuels or feedstock. Finally, innovative electro-chemistry concepts are expected to enable direct production of certain chemicals. Many of these technologies are (commercially) available today while others are still on the research level.
The large variety of electrification options poses a challenge for industrial decision-makers that need to make long-term investment decisions. Policymakers on the other hand are interested in the greenhouse reduction potentials of electrification and corresponding cost as a basis for policy design but also in how electrification of industrial processes will affect electricity demand and distribution infrastructure requirements.
Existing Studies Related to the Assessment of Process Electrification
Much research related to electrification of industrial processes has a strong focus on macro-economic top-down approaches and explorative studies. For example, Lechtenböhmer et al. (2016) estimated that complete electrification of the basic materials (steel, minerals and chemicals) industry in the EU would lead to an additional electricity demand of 1713 TWh/a in 2050, compared to the current level (2780 TWh/a) at the time of the study. Electrification is included in many roadmap studies conducted for specific sectors such as the chemical industry (DECHEMA, 2017), specific countries such as the Netherlands (Berenschot et al., 2017; Stork et al., 2018) or Sweden (Brolin et al., 2017), or specific sites such as the Port of Rotterdam (Samadi et al., 2016). A recent comprehensive review of publications related to decarbonisation pathways for the EU includes industrial electrification as an emissions reduction measure (Gerres et al., 2019).
However, top–down studies usually exclude detailed technological aspects and run the risk of neglecting the many challenges related to implementation in specific plants. Existing industrial process sites, even within the same sector, can be very different. In particular, the degree of integration can vary substantially between plants, i.e., how mass and energy flows between different process units are interconnected. As a result, it is difficult to estimate how introduction of electrification technologies will affect greenhouse gas emissions and costs without conducting site-specific studies.
The research literature related to process electrification also includes inventories of electrification technology options for different processes as well as information about the TRL. Some of these inventories are rather old (EPRI, 1989) and driven by the purpose of efficient use of electricity rather than greenhouse gas emissions reduction. More recent inventories such as (EPRI, 2009) are more extensive and some of them also include comparisons between conventional technologies and electricity-driven equivalents on the unit operation level (DECHEMA, 2017).
Studies based on the engineering bottom–up approach consider more detailed descriptions of the technologies and the impact on existing systems. In this paper, we consider that bottom–up assessment captures the impact of integrating electrification technologies into existing processes in terms of greenhouse gas emissions and cost, accounting for the specific characteristics of the existing process.
Many studies adopt a bottom–up approach to assess the impact of integrating new technologies into existing processes in order to decrease their carbon footprint. Examples are the integration of biomass-to-hydrogen options (Brau and Morandin, 2014) and Fischer-Tropsch fuels production from biomass (Johansson et al., 2014) in oil refineries, or biomass gasification-based syngas production into petrochemical processes (Arvidsson et al., 2014). For oil refining, there is also a techno-economic analysis of excess heat driven post combustion carbon capture and storage (Andersson et al., 2016). The common methodology of these studies is to develop new process designs, to perform process modelling and simulation to establish mass and energy balances and to extract data that is then used to estimate the potential for maximum process heat recovery using pinch analysis tools. The main performance indicators for the subsequent assessment are energy and exergy efficiency, greenhouse gas emission reduction potential, as well as total cost. In another study (Berghout et al., 2019), a bottom–up method for the assessment of technologies for greenhouse gas emission reductions in industrial plants was developed and applied in a case study for a complex oil refinery. Although the method focuses on core processes of an industrial plant, it does not consider changes in terms of heat recovery potential when conventional unit operations are replaced. None of these studies focus on the integration of electrification technologies as new technology.
There are a number of bottom–up studies that focus on specific electrification technologies. Bühler et al. (2019) investigated options for electrification of process heat in milk powder production plants by implementing heat pumps and electric heaters in different configurations. Their study includes an energy, exergy, environmental and economic analysis, as well as different scenarios for future prices and emissions. Wallerand et al. (2018) developed a new method for optimal integration of heat pumps based on a superstructure optimisation model. However, the method was not applied to an existing plant and did not consider possible future changes of energy market conditions. Delikonstantis et al. (2019) evaluated a direct plasma-assisted methane-to-ethylene process and a hybrid plasma-catalytic methane-to-ethylene process. The authors state that further adaptions of the existing processes would be needed since the heat flows in the conventional process are highly integrated with the other processes of the plant. This means that heat demand for subsequent separation processes must be provided in another way. Pinch analysis was used to maximise heat integration of the plasma-assisted processes. Oluleye et al. (2016) developed a screening methodology to identify options to upgrade low grade excess heat with heat pumps. However, the focus of this work was to increase the degree of heat recovery and not to switch to using electricity to provide heat. Sandberg et al. (2019) used an optimisation model to assess the demand for electricity and biomass if energy-intensive processes in Sweden were to switch to these energy carriers to comply with a net zero emissions target.
There is a clear lack of techno-economic and greenhouse gas emission assessment studies for process electrification options from a bottom–up perspective that simultaneously address how electrification options affect different parts of an existing process in detail and that include future energy market scenarios. More specifically, no published study presents a consistent way of mapping relevant electrification options for a specific process plant, considering how core reactions, separation systems and utility systems, as well as utility demands and excess heat availability are affected. There is thus a lack of knowledge about how to adapt existing processes to electricity as energy carrier. Such knowledge is important not only to discard low-performing technologies at an early stage but also to identify conditions under which electrification options are viable.
Objective
The objective of this paper is to present a bottom-up assessment framework for the techno-economic and greenhouse gas assessment of electrification options for existing processes in energy-intensive industries. One novelty of the framework is that electrification options are clustered according to how they affect the plant processes, ranging from the utility system to the core reactions. Another novel contribution is that these effects are combined with an assessment of how electrification options affect the heat recovery potential on the process and plant level, as well as the fuel demand, co-generation potential and availability of excess heat. Pinch analysis is used to generate the data needed for the assessment. Furthermore, scenarios are introduced to assess electrification under possible future energy market conditions. The proposed assessment framework can be used to compare electrification with other greenhouse gas emission reduction measures in order to support industrial and policy decision-making.
The paper starts with a discussion about how electrification options impact an existing process on different process levels, as well as an overview of electrification options and their impacts for specific industrial sectors. Thereafter, the proposed bottom-up framework is presented and applied in a case study for an oxo-synthesis plant. The purpose of the case study is not only to illustrate the assessment framework for a specific plant, but also to identify challenges that are connected to the implementation of electrification technologies in that specific process.
Impact of Electrification Options on Existing Industrial Processes
Classification According to Impacts and Interaction With Surrounding Energy System
There is a wide range of electrification options and they affect existing industrial processes in different ways. One indirect electrification option is to replace fossil-fuel based raw materials and fuels by electricity-based equivalents which do not affect the plant itself. Direct electrification options (such as heat pumps) or indirect electrification options (in which intermediates are produced using electricity) affect the core process more since the existing process units are usually highly interconnected and optimised to reduce the external heating and cooling demand (although very few achieve maximum energy recovery). The impact of electrification on a process does not thus depend only on the electrification technology but also on the existing process configuration. For example, if a conventional unit operation that provides heat to another unit operation is replaced by an electricity-based technology, it is important to consider how the heat for the other unit operation can be provided instead.
Electrification options are often classified according to the direct/indirect electrification or the Power-to-X approaches. In this paper, this classification is extended and electrification options are classified according to the process design hierarchy and interactions model shown in Figure 1. This model was originally established for process design purposes (Gundersen, 2002). The left side of the figure shows the conventional process design procedure which starts from the core reactor, followed by design of the separation and recycling system, the heat recovery system, the heating and cooling system, as well as the water and effluent treatment system. It is thus important to identify which of these systems are affected by electrification. According to this view, introduction of electrification in one sub-system will only impact the sub-system as well as the systems in the outer rings of the hierarchy diagram. However, as shown in the right side of the figure, the process sub-systems all interact with each other and it is important to consider upstream effects. For example, switching to electric steam production can lead to a surplus of internal residual gases that were previously combusted to provide process heat.
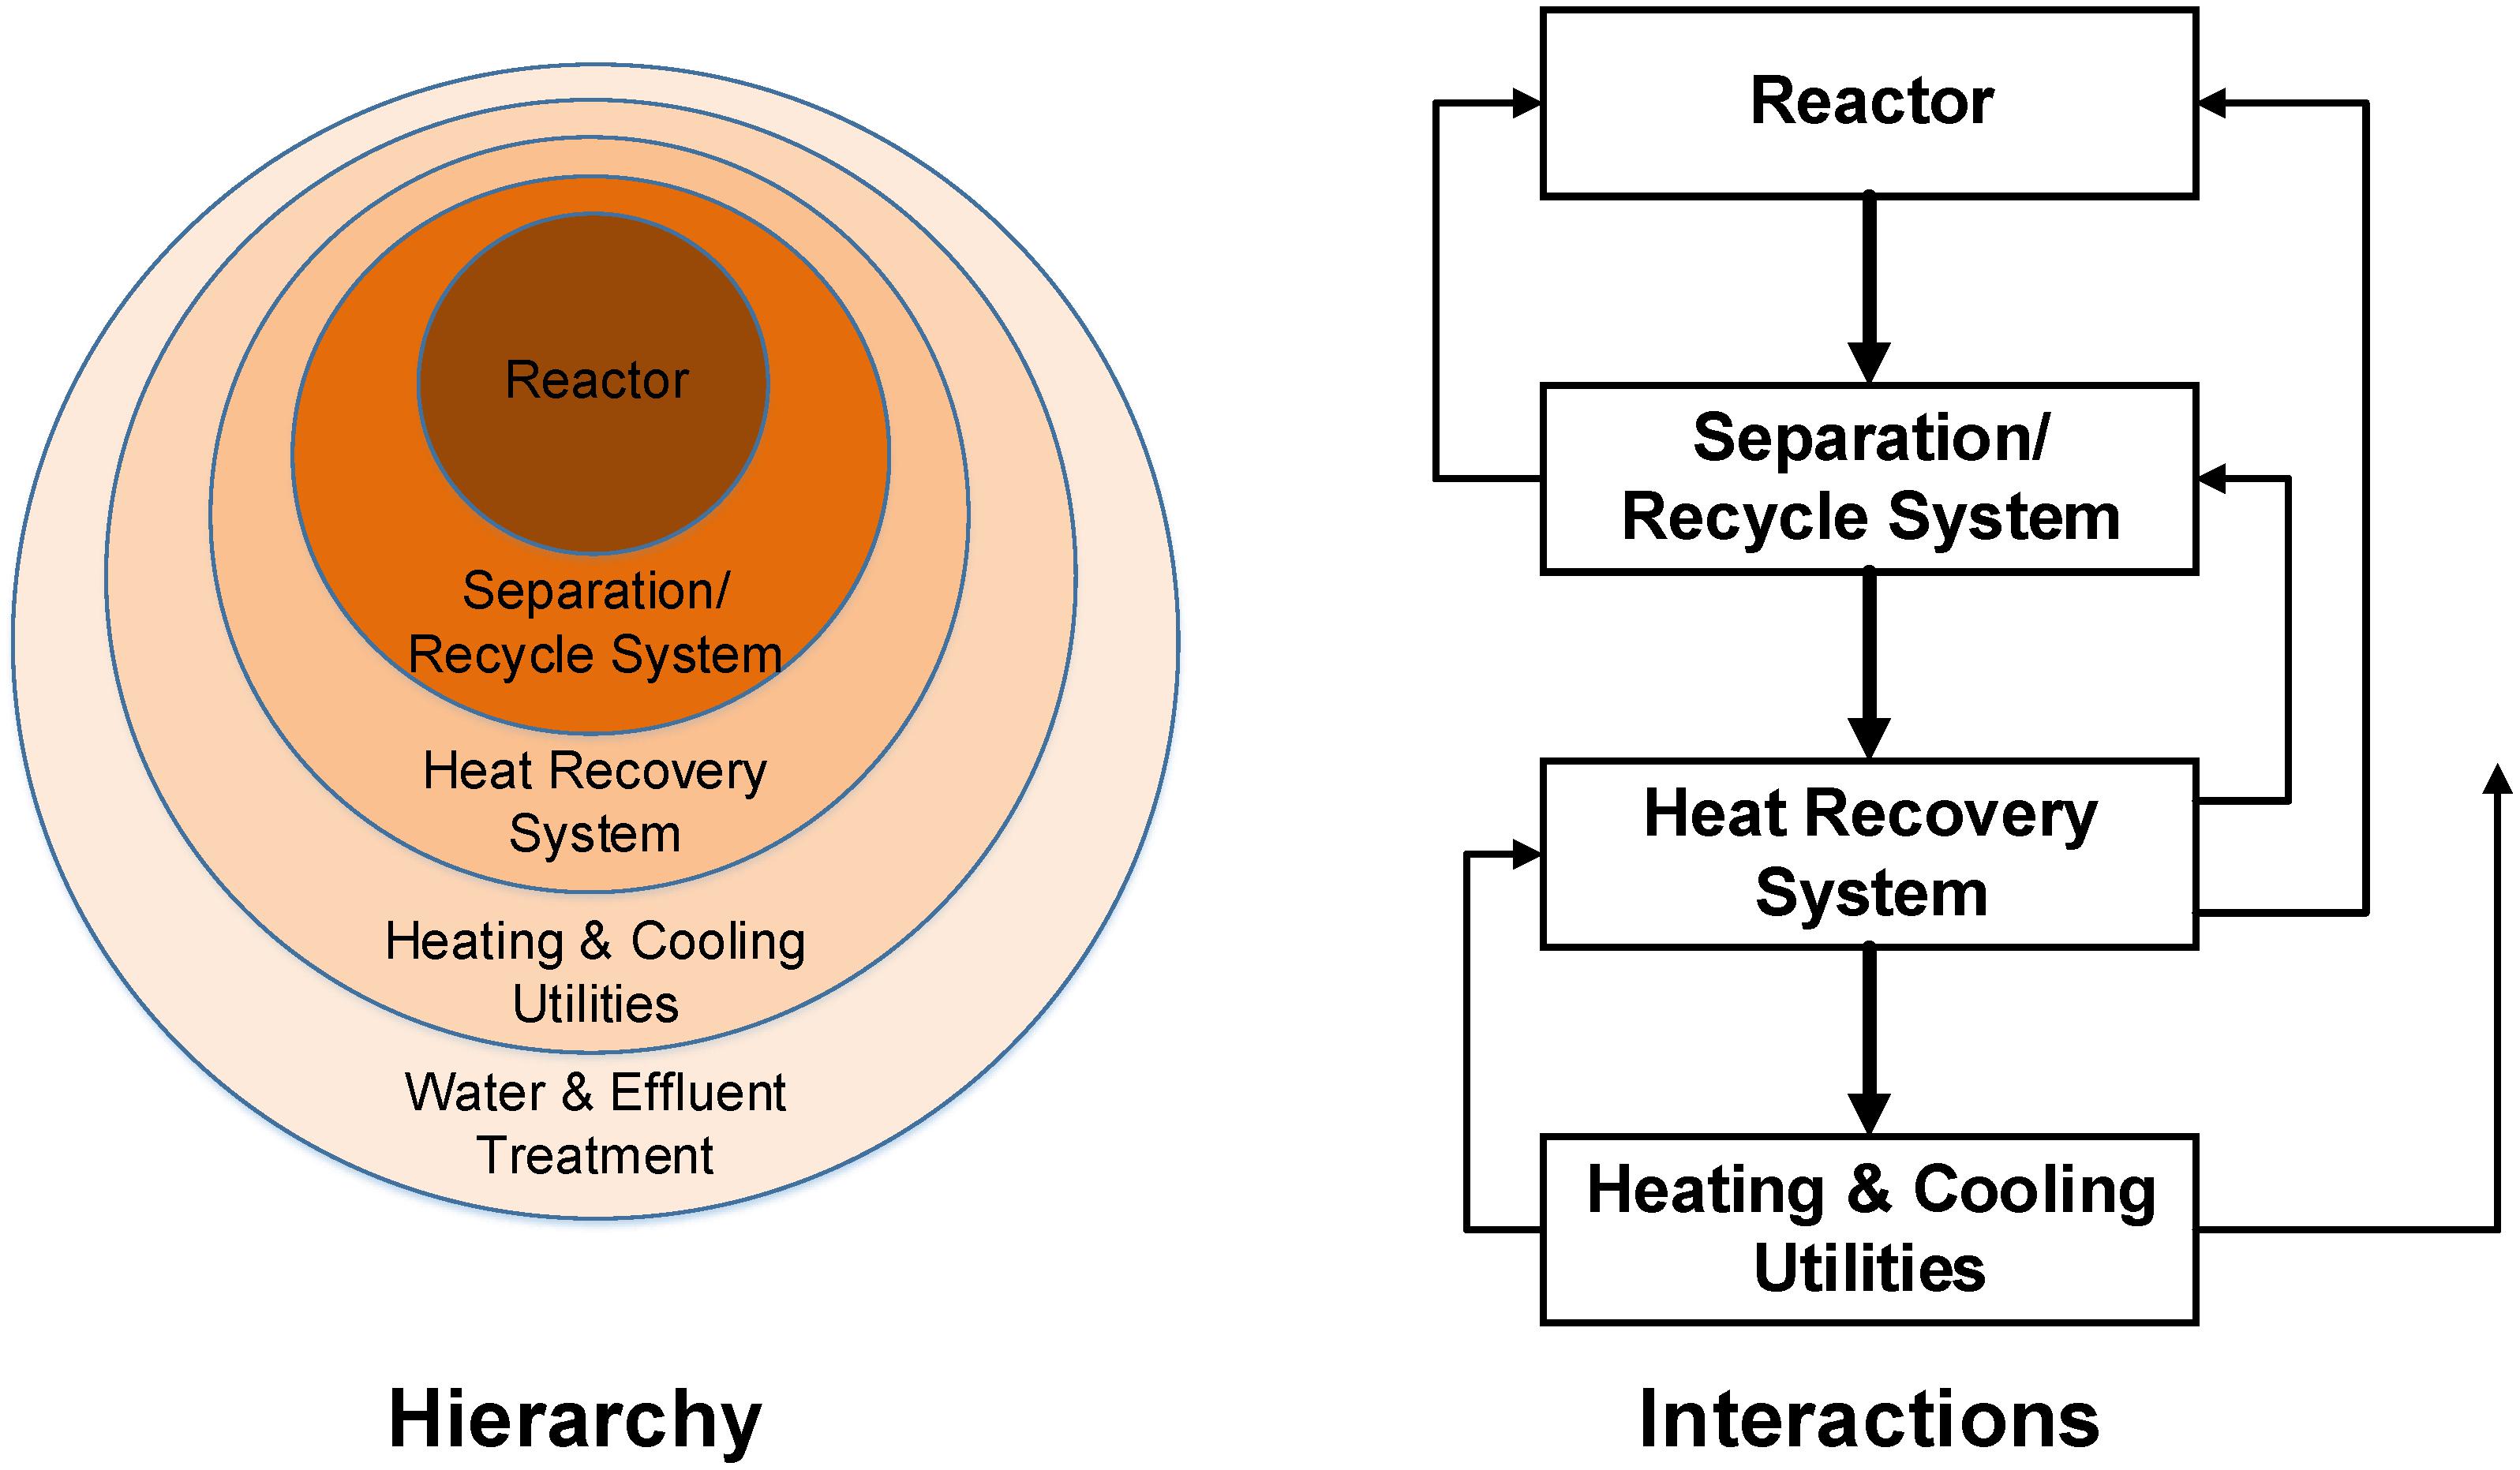
Figure 1. Hierarchy and interactions of industrial process-related systems (adapted from Gundersen, 2002).
It is also important to consider the interaction of the process with the surrounding energy system. In particular, the carbon intensity of grid electricity production must be considered as well as the electricity price. Furthermore, it is important to include future prices for fossil fuels and costs for emitting greenhouse gases as they will have a strong impact on the economic feasibility of electrification options. These aspects again underline the importance of a co-evolution between increased electrification and a reduced carbon-intensity of the electricity system to achieve sustainable decarbonisation of industrial processes. Finally, electrification can impact the availability of excess heat that can be used for district heating or exported to nearby facilities.
Overview of Electrification Options for Specific Energy-Intensive Industries and Their Impacts on Existing Industrial Processes
An important initial part of the methodology is mapping and conducting a first evaluation of electrification options on the level of specific industrial sectors. Table 1 shows a classification of electrification options in terms of process sub-systems affected for some major energy-intensive process industry sectors. The maturity level is included in this table by dividing the options into short-term and long-term.
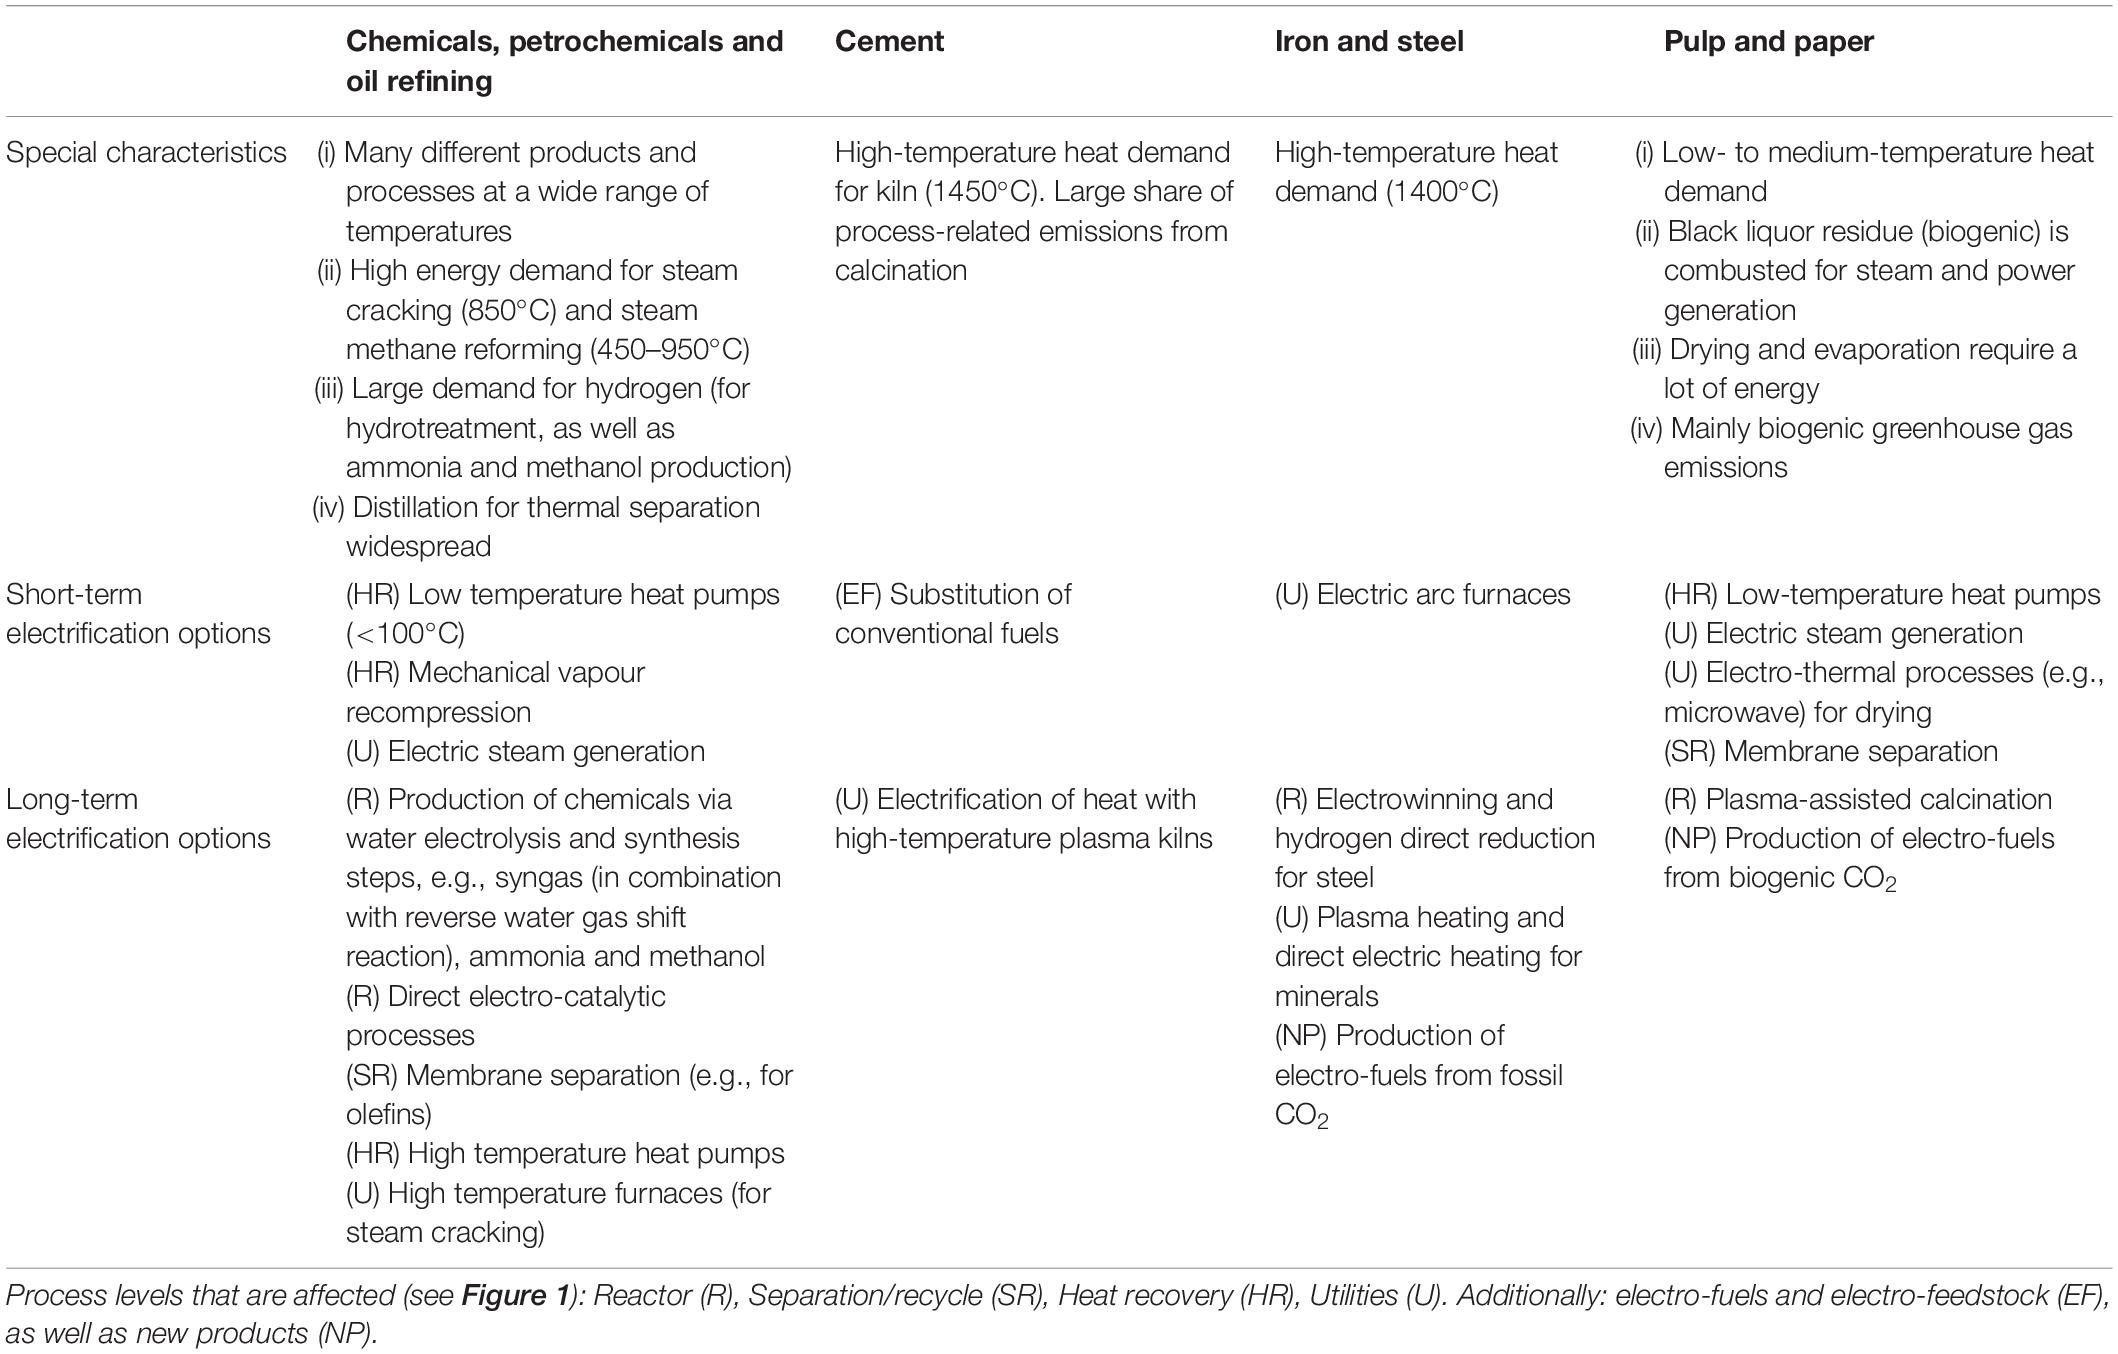
Table 1. Electrification options on different time scales for energy-intensive industries.
Chemical and oil refining industries consist mainly of liquid and gaseous streams. Dominant processes in terms of energy demand include stream cracking and steam methane reforming (with natural gas as feedstock and fuel at the same time) in the petrochemical industry, and atmospheric distillation in oil refineries. In the chemical industry, steam is usually used for heating purposes. In general, temperatures range from low (<250°C) to medium (250–600°C). Otherwise, the range of processes and products varies strongly with different raw materials, fuels, and auxiliary materials (e.g., hydrogen for hydrotreatment). The same is true for process intermediates such as syngas. In oil refining, crude oil is separated into its components which are then purified, often by hydrotreating. Further downstream, cracking furnaces are used to reduce the length of hydrocarbon chains. Short-term electrification options are related to heat recovery and utilities whereas long-term options include a wide range of technologies that affect all levels of the process hierarchy.
In the pulp and paper industry, processing wood (by cooking, bleaching, separating etc.) requires large amounts of steam and hot water in the low temperature range (<250°C). Recovery boilers are used to combust the lignin-rich black liquor stream to produce steam to reduce the demand for external utilities. Biogenic resources are thus not only used as raw material but also as fuel so that fossil-related emissions are usually very low. The incentives to use electricity as energy carriers are thus lower compared to other industries. However, electrification options might be used to overcome production bottlenecks, to release biomass that can be used for other purposes (see Pettersson et al., 2020 for further discussion), or to diversify the plant’s product portfolio.
In the cement and steel industry, solid materials are processed at high temperatures (>600°C). These processes require mainly reaction heat. Radical emission reduction will require breakthrough technologies which are only likely to be available in the long run.
Assessment Framework for Process Electrification Options
The steps involved in the proposed framework are presented below. The system boundaries for the individual steps are indicated in brackets. The framework can be used to assess individual electrification options but also combinations of electrification options. Illustrative examples for the different steps are shown in the case study in Section “Case Study: Assessment of Electrification Options for an Existing Oxo Synthesis Plant.”
1. Definition of the existing process system and its unit operations (plant).
2. Identification of electrification options and the affected process levels (plant).
3. Modelling and simulation of the existing process to obtain data needed for process integration studies (plant).
4. Modelling and simulation of the electrified unit operation (unit operation).
5. Mass and heat integration studies of the reference process as well as the electrified process using pinch analysis tools (plant).
6. Inventory of all relevant changes in input and output flows of material and energy compared to the reference process (plant).
7. Techno-economic and greenhouse gas emission assessment (surrounding energy system).
The scope of the single steps of the approach may be adjusted to take into account the impacts of different electrification options. For example, if an electrification option such as electric steam generation affects the utility system only, it may be sufficient to model the utility system and to ignore the reaction, separation and heat recovery systems.
Definition of the Existing Process System and Its Unit Operations
The existing process system is first mapped at the plant level (core processes and process energy system) and the existing unit operations in the plant sub-processes are identified. This step is important not only as base for screening for electrification options that could replace existing unit operations but also to establish a reference case. In this step, information is collected about existing unit operations, their operating conditions, and how they are connected to each other. This also includes the identification of raw materials and intermediates since these could be produced by electricity-based processes as well. Furthermore, data about current greenhouse gas emissions, fuel types and demand, are collected. This information can come from flowsheets or data sets of measured values. Process simulation can be used to generate data that is not otherwise available (see section “Modelling and simulation of the electrified unit operation”).
Identification of Electrification Options and the Affected Process Levels
Electrification options are identified by finding electricity-driven equivalents for the existing unit operations. This is an iterative process that starts by identifying technologies that are in principle suitable (e.g., electric steam generators to provide steam) before ensuring that specific electrification technologies can cope with the operating conditions in the existing system. Afterward, the electrification options are classified according to the model described in Figure 1 to determine which levels of the process are affected, which has an impact on the modelling in the next step. Helpful tools for the identification of electrification options are technology inventories (such as EPRI, 2009) that list candidate electrification technologies that are suitable for specific industrial processes. Furthermore, technical data sheets for existing technologies (e.g., maximum outlet temperatures and temperature lifts for industrial heat pumps) can be used to assess whether these technologies can fulfil the requirements of the process.
Modelling and Simulation of the Existing Process to Obtain Data Needed for Process Integration Studies
In this step a model is created for the current process in order to generate data for all heat sources and heat sinks, as required for pinch analysis purposes (see step “Mass and heat integration studies of the reference process as well as the electrified process using pinch analysis tools”).
It should be noted that the extent of the model depends on the numbers of levels of the process that are affected according to the previous step. If only the utility system is affected, it may be sufficient to only model the utility system. The model should preferably be run for a number of representative operating conditions. Besides delivering information about the heat content of different streams in the process, the model should also provide information about the fuel demand and related greenhouse gas emissions.
Modelling and Simulation of the Electrified Unit Operation
In this step, a model for the electrified unit operation is created and used for simulation runs to obtain process stream data required for pinch analysis purposes, as described in the previous step. Is it important to adjust the model parameters to meet the specifications of the existing process, meaning that outlet flows must meet the same specifications as the corresponding flows in the conventional unit (flow rate, temperature, pressure and composition). The model also needs to give the electricity demand and related on-site greenhouse gas emissions (if any). The modelling takes place at the unit operation level of the electrification technology.
Mass and Heat Integration Studies of the Reference Process as Well as the Electrified Process Using Pinch Analysis Tools
The next step is to perform heat integration studies based on the stream data that was derived from the model runs in the two previous steps. This is done by applying pinch analysis tools to estimate heat recovery targets and thus the utility demand for a given temperature difference ΔTmin. For the reference process, a Grand Composite Curve (GCC) can be generated in order to establish the theoretical minimum hot and cold utility demands. Afterward, process streams that are related to the unit operation(s) to be replaced by the electrified unit operation are removed from the stream table. The remaining streams form the so-called background process. The process streams related to the electrified unit operation form the foreground process. Thereafter, the concept of split-GCC analysis is applied (Kemp, 2007), in which the GCCs for the foreground and background processes are plotted in the same figure in order to visualize how well the electrified unit operation can be heat integrated with the background process. An example for a split-GCC is shown in Figure 6 in Section “Case Study: Assessment of Electrification Options for an Existing Oxo Synthesis Plant.” In the ideal case, heat can be exchanged between the foreground and background processes, resulting in lower utility demands. It is assumed that the maximum energy recovery (MER) target is met both in the reference case and in the case with the electrified unit operation to allow a fair comparison.
Inventory of All Relevant Changes in Input and Output Flows of Material and Energy Compared to the Reference Process
In this step a full inventory is compiled for the following parameters for the two cases:
• Minimum heating and cooling demand (assuming maximum heat recovery).
• Electricity demand.
• Fuel balances (demand and fuel type).
• CHP opportunities.
• Excess heat availability.
• Direct process greenhouse gas emissions, as well as fuel-related greenhouse gas emissions.
This data constitutes the necessary input to the impact assessment.
Techno-Economic and Greenhouse Gas Emission Assessment
The final step is to perform a techno-economic and greenhouse gas emissions assessment. The assessment takes into account energy costs, as well as greenhouse gas emissions and associated costs. It is important to note that the system boundary is expanded in this step to include the surrounding energy system. In this manner, off-site greenhouse gas emissions are included in the assessment. The operating cost and the greenhouse gas emissions for the electrification technologies are highly dependent on the background energy system. The capital cost on the other hand depends on the estimated cost development for the individual technologies. The ultimate goal of this step is to calculate the possible reductions in greenhouse gas emissions versus the capital and variable cost compared to the reference case.
Background Energy System and Future Energy Market Scenarios
The integration of electrification options will normally lead to an increased electricity demand. Consequently, the change in greenhouse gas emissions depends on the electricity supply system. Since the potential for excess heat delivery (e.g., for district heating) can also be affected, it is important to take the corresponding change in revenues into account. Furthermore, selling new by-products that arise as a result of electrification can lead to additional revenue. To calculate the corresponding running cost (including revenues from excess heat and by-products) and the greenhouse gas emissions, information about the following parameters is required:
• Fossil fuel prices and emission factors.
• Electricity price and grid emission factors.
• Costs for greenhouse gas emissions (e.g., EU ETS, national tax systems and other relevant policy instruments).
• Income from export of excess heat and carbon intensity of the heat sink to which excess heat is exported.
• Sales prices and emission factors for new by-products.
For technologies with a high TRL that could be deployed already today, current values for these parameters can be used for an initial assessment. However, since electrification is one option for industry to comply with ambitious medium- and long-term national climate targets, the expected development of these parameters is of high interest. This is even more the case for electrification options with a low TRL which can only be considered for implementation in the medium- or long-term. This leads to a need for consistent future energy market scenarios in which the values of the aforementioned parameters are internally consistent. In this work, the ENPAC tool (Axelsson and Harvey, 2010) was used to generate consistent scenarios for energy prices and marginal greenhouse gas emissions associated with the use of energy for large-volume industrial customers based on forecasted prices for fossil fuels on the commodity market and costs associated with emitting greenhouse gases.
Case Study: Assessment of Electrification Options for an Existing oxo Synthesis Plant
The assessment framework was applied in a case study of an existing oxo synthesis plant to identify process electrification options and to assess their impact on the processes. A more detailed assessment was performed for electrified syngas and steam production. The plant is part of a large chemical cluster on the west coast of Sweden.
Definition of the Existing Process System and Its Unit Operations
Figure 2 shows a simplified flowsheet of the main process units at the plant. In the oxo synthesis unit, olefins (mainly ethylene and propylene) react with syngas (CO and H2) in the presence of a catalyst to form aldehydes. Part of the aldehydes are further processed to produce alcohols and acids. The olefins are purchased from a neighbouring site, whereas the syngas is produced on-site by non-catalytic partial oxidation (NC-POX) of natural gas. The oxygen is produced by an air separation unit. Fossil fuels are combusted for steam production. Low-pressure (LP) steam for oxo synthesis and further synthesis unit is produced in a gas boiler.
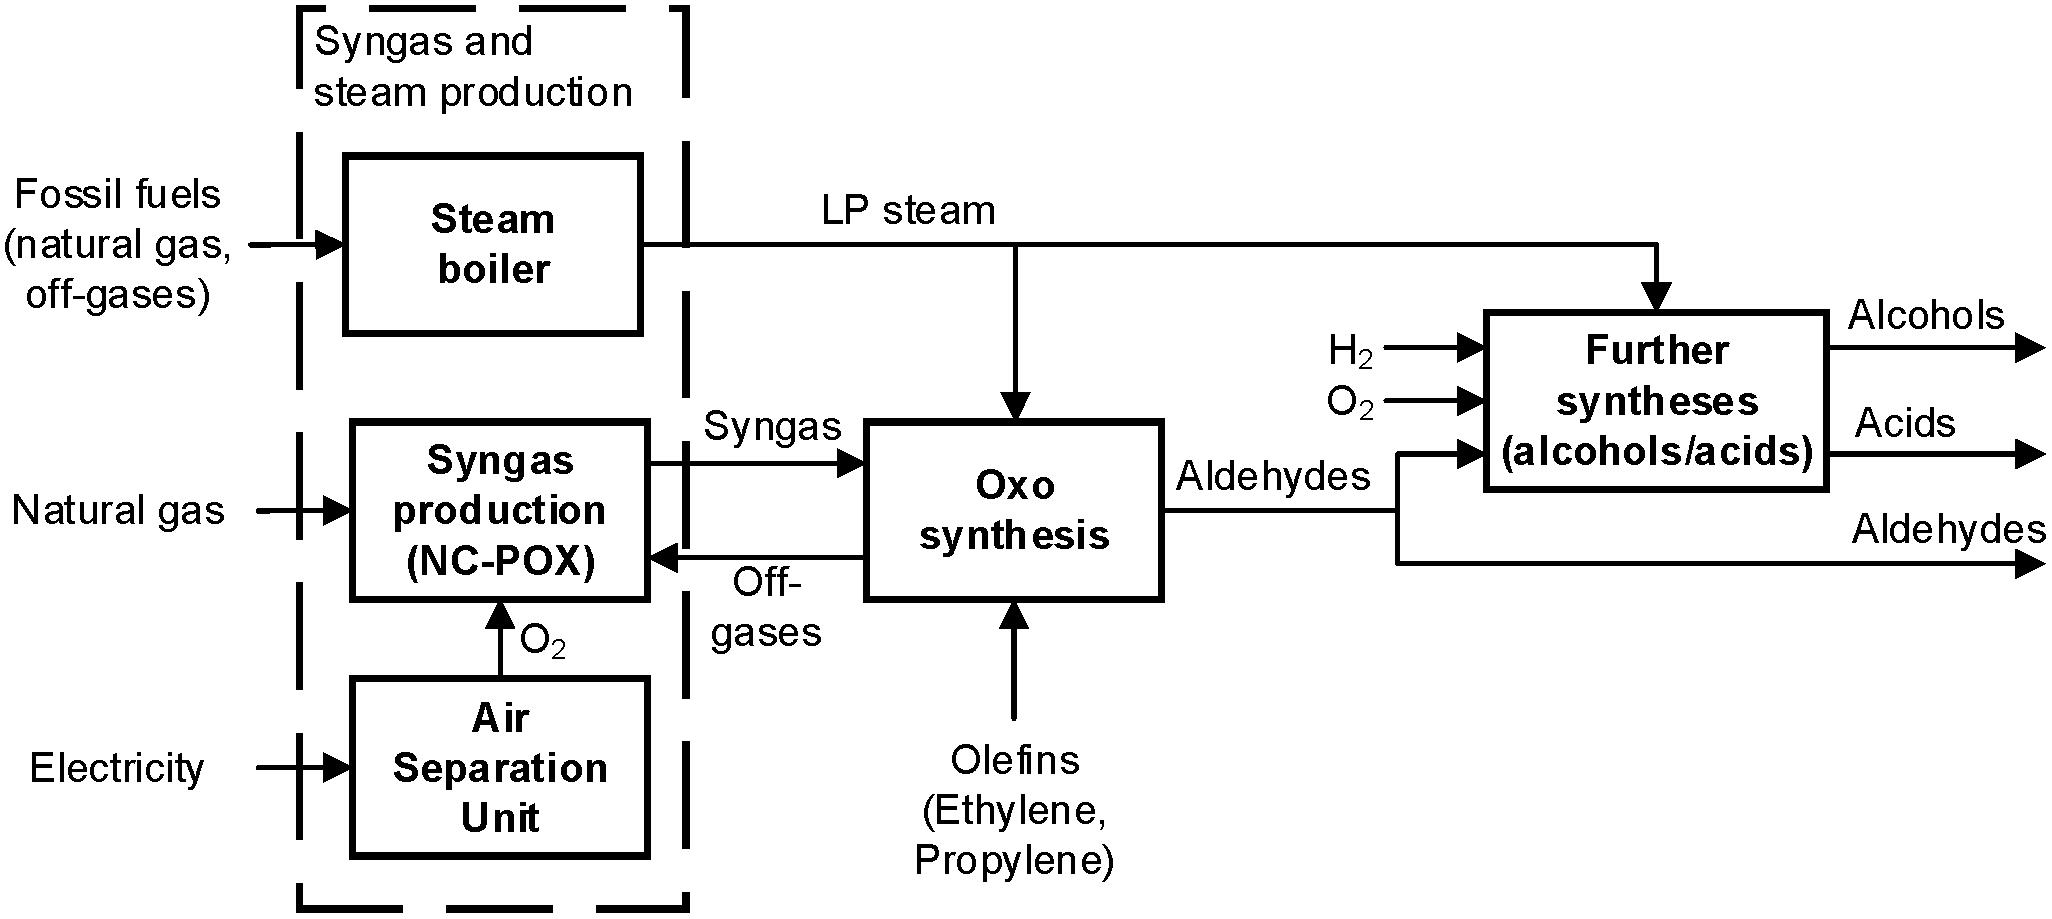
Figure 2. Simplified flowsheet of the main process units at the oxo synthesis plant site including the main material flows. The units in the dashed box are related to the conventional syngas and steam production and used to establish the reference case for the detailed assessment.
The exothermic reaction in the oxo synthesis unit takes place in a stirred-tank reactor at 15–20 bar and temperatures between 85 and 115°C (Bahrmann and Bach, 2012). Cooling is required to remove reaction heat but also to condense the reaction products. After the separation of unreacted materials, the crude aldehyde passes a series of distillation columns for further product separation. These columns require heating and cooling for the reboilers and condensers, respectively.
In the syngas production unit, natural gas from the grid, oxygen from an air separation unit and off-gases from the oxo synthesis unit react in a non-catalytic partial oxidation unit to form syngas with a specific H2/CO ratio and additional hydrogen. Syngas is an intermediate that is sent to the oxo synthesis unit. A more detailed description of the syngas unit can be found in Section “Modelling and simulation of the existing process to obtain data needed for process integration studies.”
In smaller downstream process units, a fraction of the aldehydes from the oxo synthesis is processed further to produce alcohols and acids. Hydrogen is required for hydrogenation to produce the alcohols while oxygen is required for the acid production. The two reactions are highly exothermic. In both cases, distillation is used to separate by-products from the final product. These processes are not presented in detail but were included in the assessment.
Identification of Electrification Options and the Affected Process Levels
A technology inventory was conducted to identify different electrification options for parts of the oxo synthesis plant, see Table 2. The table also includes information about the technical maturity of the different options and indicates the process levels that are affected as described in the previous section. A low technical maturity corresponds to Technology Readiness Levels (TRL) of 1–4, medium to TRLs 5–7 and high to TRLs 8–9.
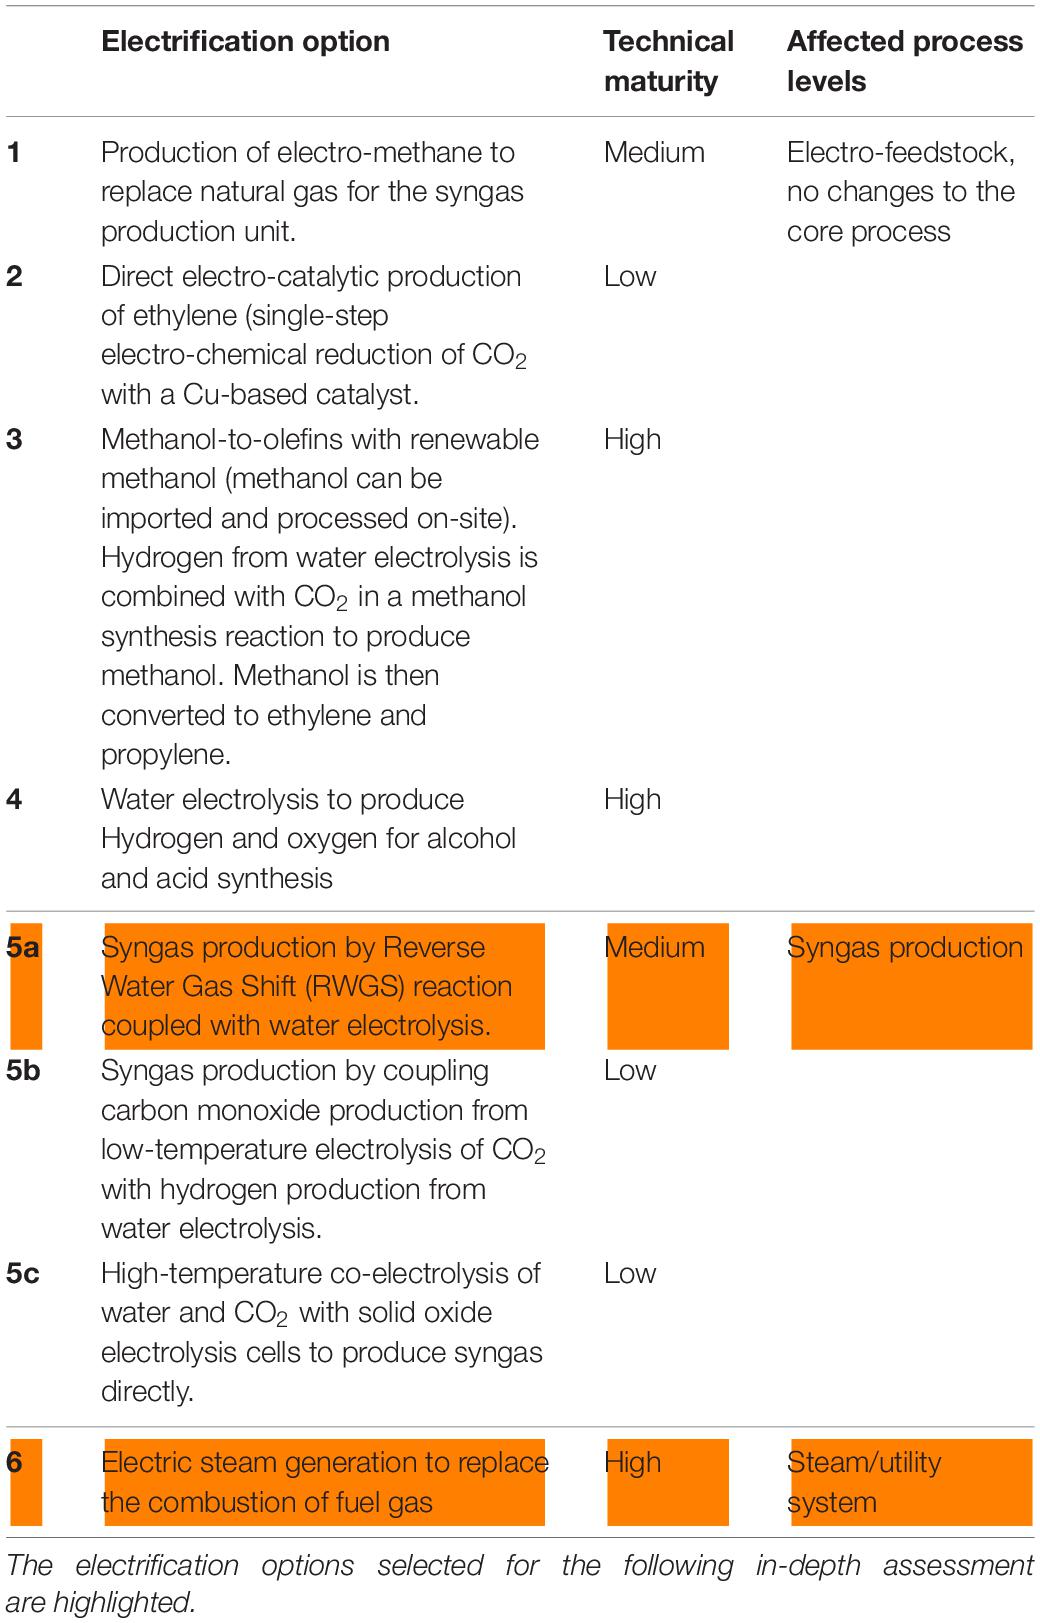
Table 2. Detailed description of the process electrification options for the oxo synthesis plant including technical maturity and affected process levels (DECHEMA, 2017; Foit et al., 2017; Reller et al., 2017).
Electrification options 1–4 are options for indirect electrification to produce electro-feedstock while the processes units at the site are not affected. Since the chemical industry might be accountable for greenhouse gas emissions over the complete value chain in the future (similar to the motor fuel industry, see European Parliament, 2009), it is important to address emissions from fuels and feedstock as well as on-site emissions.
Options 5a-c could replace the current syngas production, although their technical maturity differs widely. They affect the existing process rather strongly since they replace the conventional syngas production (reaction and subsequent separation processes) completely. The elimination of process streams related to the conventional syngas production could induce strong changes on the internal heat recovery potentials since high temperatures are involved. Furthermore, large amounts of electricity as well as a source for CO2 are needed to replace the natural gas demand since syngas is the main intermediate at the plant.
Option 6 affects the utility system only. Subsequently, this electrification option has a lower impact on the existing process configuration according to the process design hierarchy. This technology is commercially available today. It was assumed that unit operations downstream from the syngas production are not affected by this option.
Higher levels of process electrification can be achieved by combining electrification options. For example, the whole oxo synthesis production process could be electrified by combining electrified syngas production (options 2a-c), electrified olefin production (option 4), production of hydrogen and oxygen for alcohol and acid syntheses by water electrolysis (option 5), as well as electrified steam production (option 6). This could lead to a strong reduction of on-site greenhouse gas emissions.
Selected Electrification Options
For the further illustration of the methodology, a combination of electrified syngas production by coupling a Reverse Water Gas Shift (RWGS) reaction with water electrolysis (option 2a) and electrified steam generation (option 6) was selected. This was motivated by the comparatively high technical maturity of the two options and the fact that they affect core parts of the existing process. Rather than replacing single unit operations, all unit operations connected to the conventional syngas production, as well as the conventional steam boiler, were replaced. Furthermore, syngas plays an important role in many chemical and petrochemical plants so that insights from this case study are relevant for other plants as well. RWGS in combination with water electrolysis has been discussed in other studies (Schwab et al., 2015).
Modelling and Simulation of the Existing Process to Obtain Data Needed for Process Integration Studies
Pinch data for the process units of the plant (see Figure 2) was mainly based on previous work (Hackl et al., 2011). However, a more detailed model developed by Arvidsson et al. (2014) was adopted for the conventional syngas production unit. The corresponding flowsheet is shown in Figure 3.
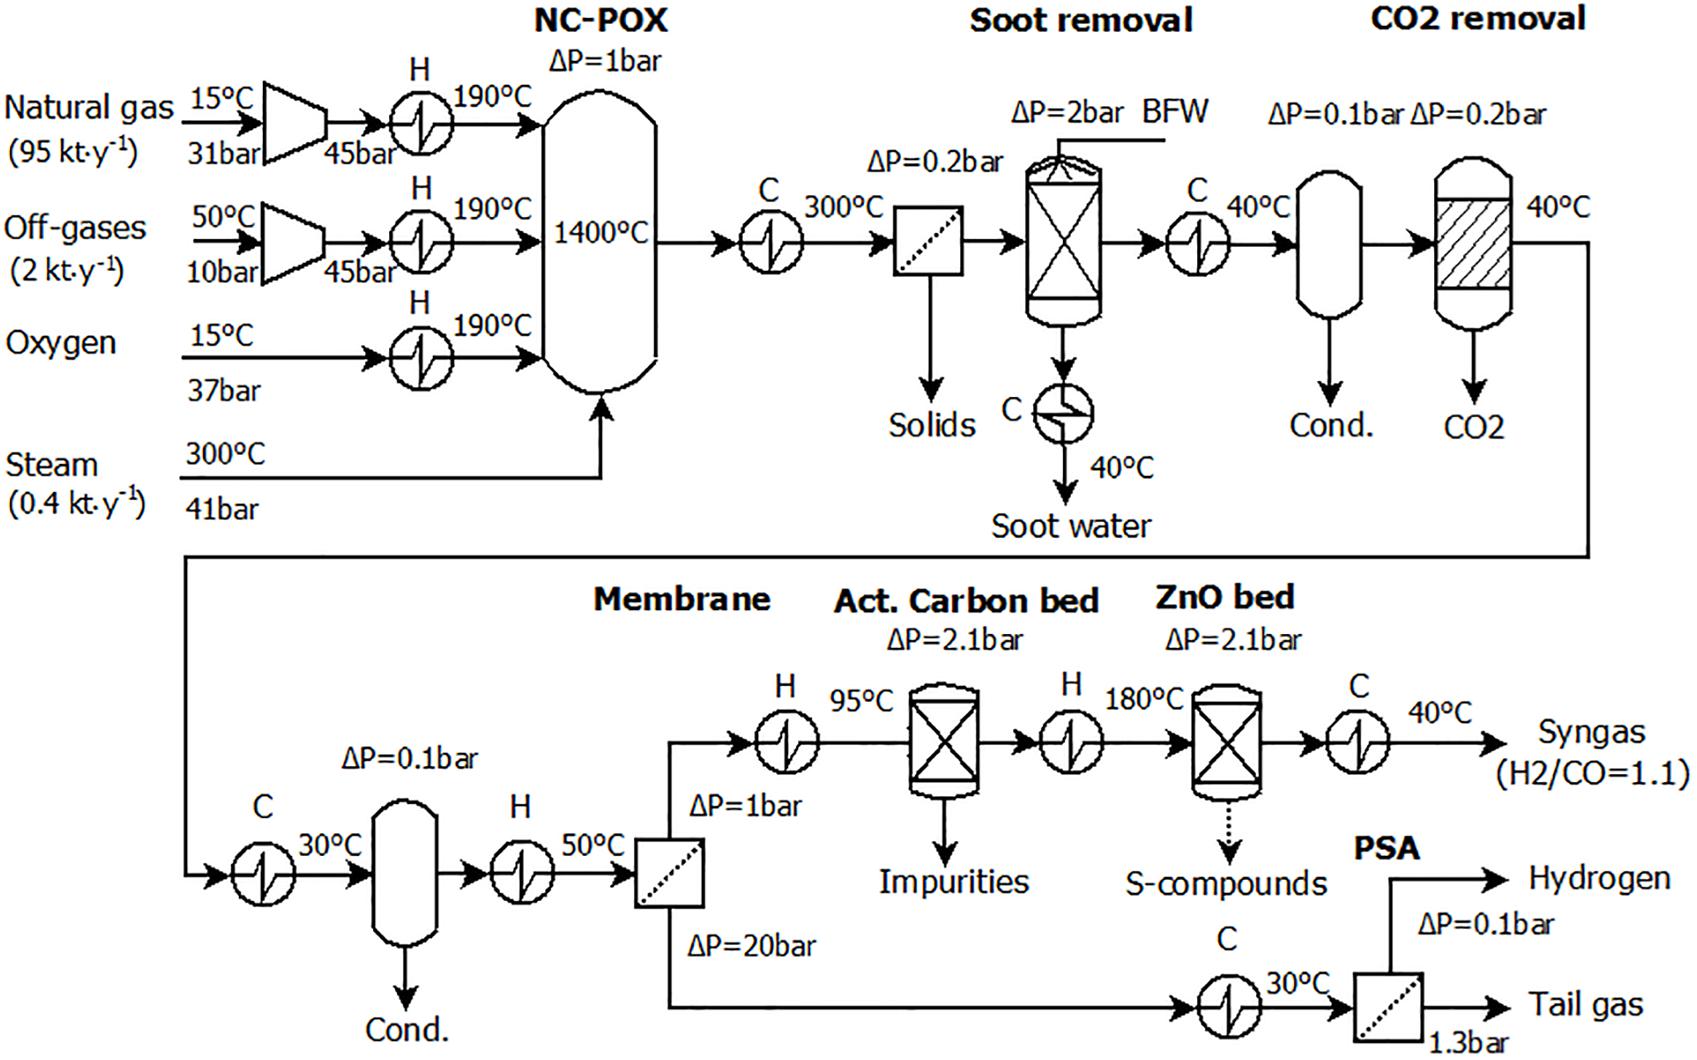
Figure 3. Process scheme for the conventional syngas production. Reprinted with permission from Arvidsson et al. (2014). Copyright 2020 American Chemical Society.
In the NC-POX reactor, natural gas, off-gases and oxygen react in the presence of steam to form a mixture of syngas (CO and H2), CO2, water and tail gas. After soot and CO2 removal, a membrane is used to separate the syngas and pressure-swing absorption is used to separate hydrogen from the tail gas. Significant amounts of heat are released from cooling of the NC-POX reaction products from the reaction temperature of 1400°C down to 300°C. Further cooling is required before the CO2 separation unit operations and for the final syngas product and the by-products. Heating is required to preheat the NC-POX reactor feed streams as well as preheating the feed stream into the active carbon bed and the ZnO bed that are used to remove impurities. The syngas production rate is 115 MW with a H2/CO ratio of 1.1.
The stream data table generated for pinch analysis purposes can be found in Supplementary Appendix A. Since the conventional syngas production was replaced by electrified syngas production, the streams related to the conventional syngas production were removed from the stream data table that included streams related to the process units of the plant. The remaining streams constitute the background process for the following mass and heat integration studies. A stream table with these remaining streams can be found in Supplementary Appendix B.
Modelling and Simulation of the Electrified Unit Operation
Figure 4 shows an overview of the proposed electrified syngas and steam production process. The syngas production constitutes the foreground for the heat integration studies. To generate the required pinch stream data, a RWGS reaction model was coupled with a model for water electrolysis. In the RWGS reaction, carbon monoxide and water are produced from carbon dioxide and hydrogen. The required hydrogen is produced by electrolysis of water with oxygen as by-product. The hydrogen output from water electrolysis was adjusted to fulfil the demands of the RWGS reaction, to adjust the targetted H2/CO ratio and to provide the hydrogen required by for downstream processes. The LP steam for the RWGS reaction unit and the units downstream from the syngas production are produced by an electric steam generator with an assumed thermal efficiency of 99%.
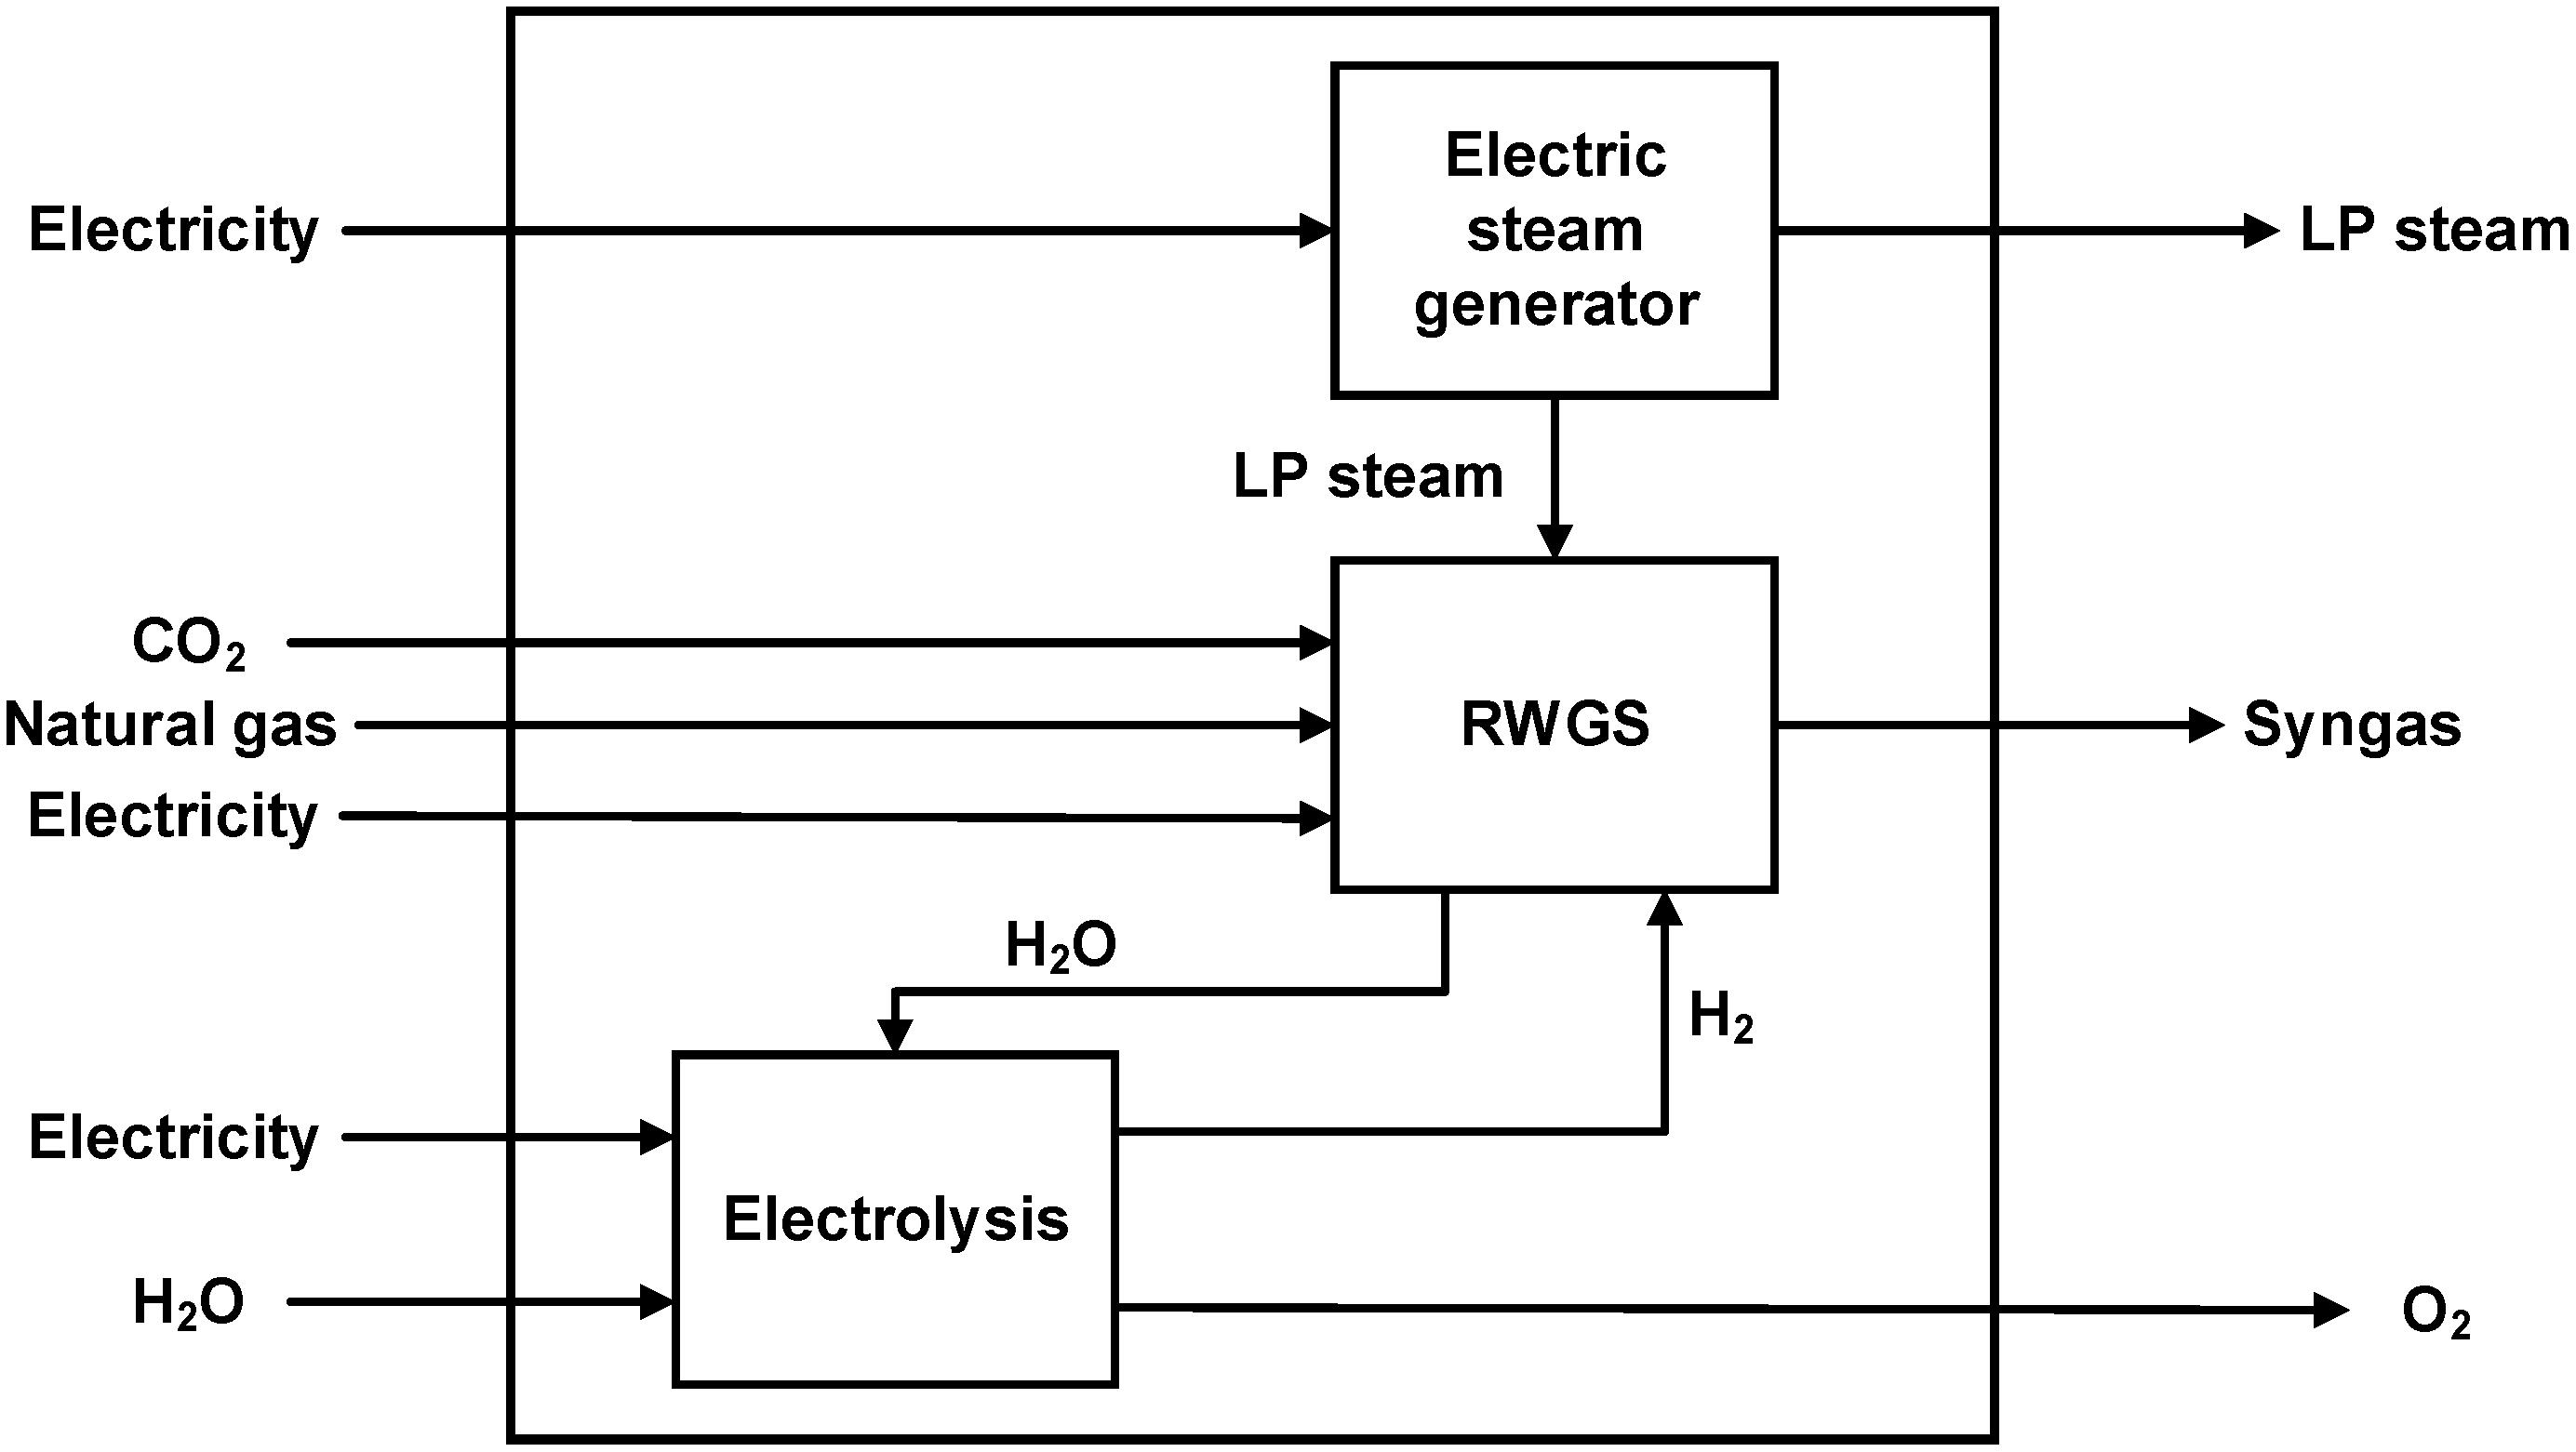
Figure 4. Overview of the electrified syngas and steam production.
RWGS Reaction
For the RWGS reaction, an Aspen HYSYS model presented in Rezaei and Dzuryk (2019) for syngas production at 410 kPa was used and adjusted to meet the required syngas production rate, see Figure 5. At the core of the process is a fired heater in which CO2 is hydrogenated at 900°C and 410 kPa. Flash drums are used to remove water from the process streams while unreacted CO2 is captured by an MEA (monoethanolamine)-based absorption column. The MEA is regenerated in a regenerator column and led back to the absorption column while the CO2 is recycled and mixed with the incoming feed. To increase the energy efficiency of the process, two feed-effluent heat exchangers are used to recover the reaction heat by preheating the reactor feed with the hot effluent stream. In addition, the feed to the regenerator column is preheated using the reboiler stream of the regeneration column. To run the process, low-pressure steam is needed for the regenerator column while electricity is required to drive pumps and compressors. Furthermore, natural gas is needed to provide the heat in the fired reactor since an electricity-driven equivalent for this high-temperature application is not available. Additionally, four coolers with cooling water and three compressors are required to adjust temperatures and pressure of the process streams.
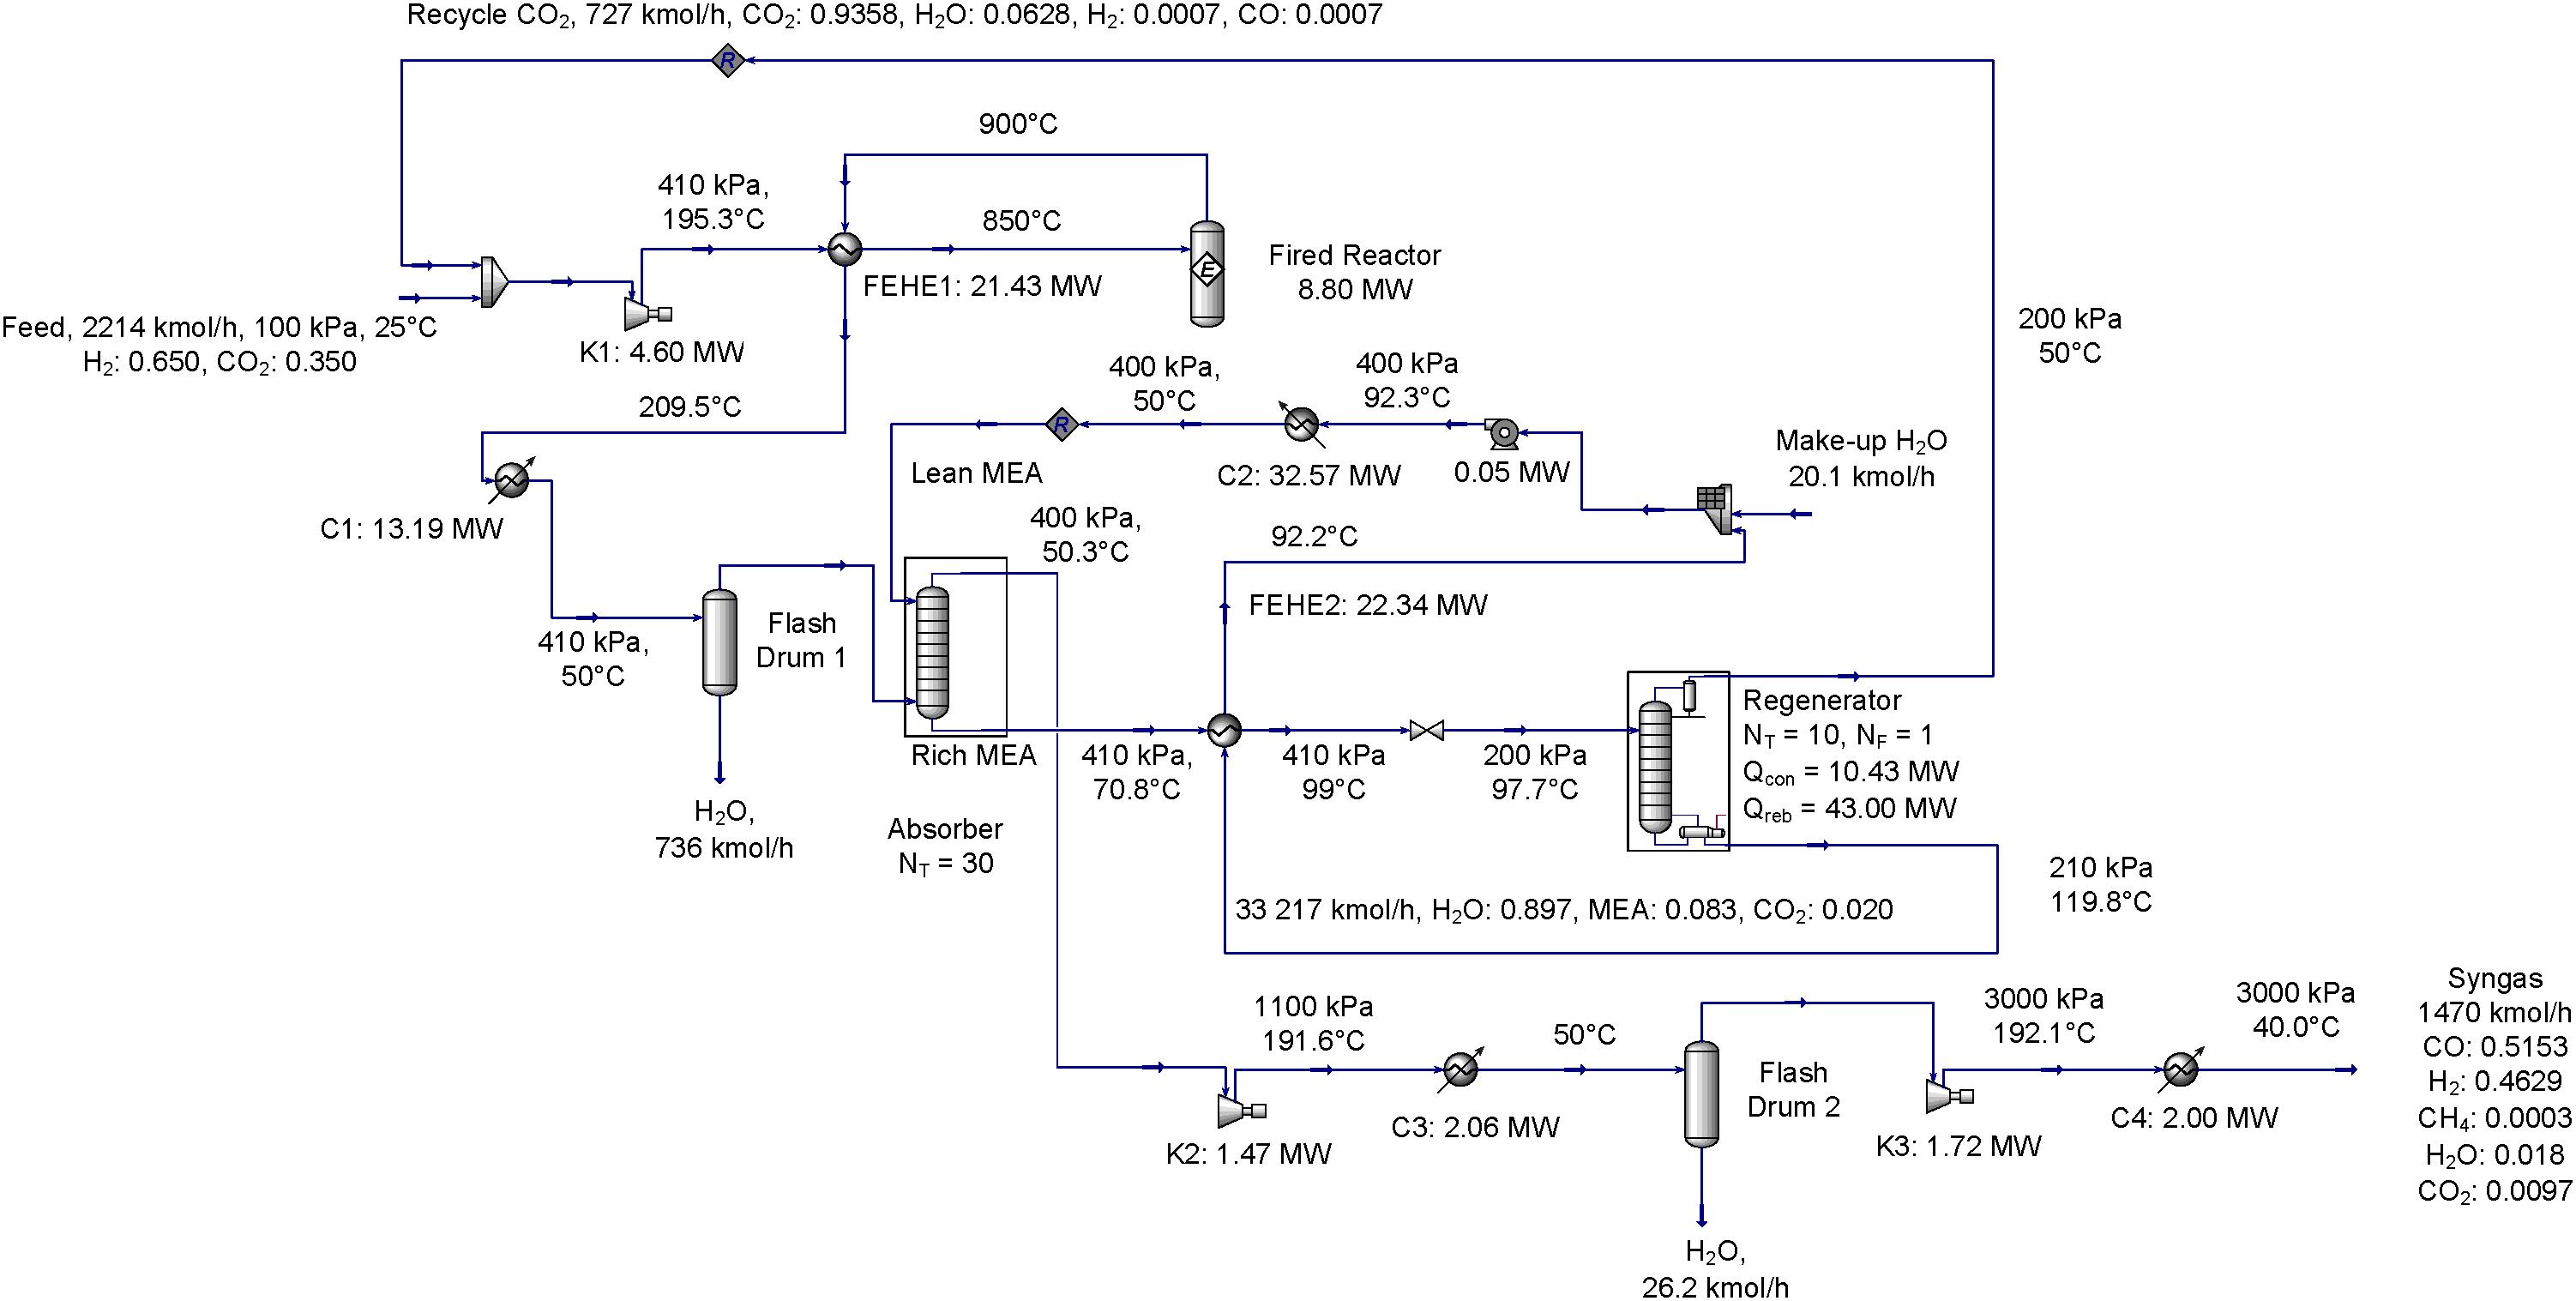
Figure 5. The model used for the RWGS reaction based on Rezaei and Dzuryk (2019), adjusted to meet the requirements of the existing process. The flow compositions are on a molar basis.
Water Electrolysis
It was assumed that hydrogen was produced from water electrolysis with alkaline electrolysis cells (AEC) since this technology is mature, commercially available and suitable for large-scale installations. The assumed operation parameters were based on Grahn and Jannasch (2018): operating temperature of 80°C, conversion efficiency of 0.65 MWH2(LHV)/MWel, excess heat release of 0.30 MWth/MWel at 70°C, water demand of 0.54 ton/MWhH2 and oxygen production of 0.24 ton/MWhH2.
Stream Table for the Electrified Syngas Production
The stream data for both sub-processes of the electrified syngas production are shown in Table 3. It can be seen that the process has a high cooling demand, especially for the electrolyser, but also from two coolers and the condenser at the regenerator. The heating demand is mainly related to the reboiler of the regenerator. It should be noted that the internal heat exchanger FEHE1 (see Figure 5) was retained since the high driving force (logarithmic mean temperature difference of 30°C) and the small difference between the two temperature differences on the two sides (50 and 15°C) which indicate a good heat integration. Accordingly, the corresponding streams do not appear in the stream table.
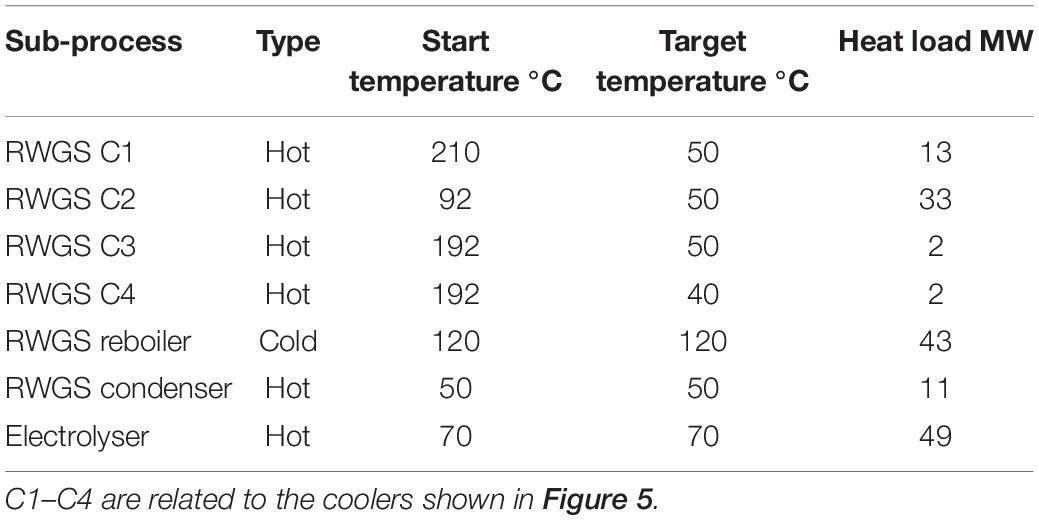
Table 3. Stream table for the electrified syngas production consisting of RWGS reaction and AEC water electrolysis.
Mass and Heat Integration Studies of the Reference Process as Well as the Electrified Process Using Pinch Analysis Tools
The following procedure was used to create the GCCs and split-GCCs for the heat integration studies:
1. A GCC for the reference case (current process configuration for the whole plant as shown in Figure 2) was created to identify minimum utility demands and district heating delivery potentials assuming maximum heat recovery.
2. A split-GCC for the reference case was constructed with the streams connected to conventional syngas production representing the foreground (see stream table in Supplementary Appendix A) and the remaining streams of the plant forming the background (see Supplementary Appendix B) to visualize potential heat flows between the foreground and the background.
3. A split-GCC with streams from the electrified syngas production in the foreground (see Table 3) and the remaining streams (see Supplementary Appendix B) was established to quantify the potential for heat integration.
4. A GCC for the oxo synthesis plant with electrified syngas production was established to derive utility demands and district heating potentials, assuming maximum heat recovery within the plant.
The GCCs and split-GCCs were constructed assuming a global temperature difference for heat exchanging of 10°C. The curves were thereafter used to identify the heat integration potentials, energy targets and district heating delivery potentials.
Figure 6 shows the GCC and the split-GCC for the reference case based on Figure 2 (including the downstream processing of syngas). The large heat pocket in the GCC decreases the minimum demand for hot utility which can be satisfied with LP steam (150°C). The district heating delivery potential was estimated for a supply and return temperature of 90°C and 55°C, respectively. The large cooling demand below the pinch temperature is mainly caused by the cooling requirements of the exothermic reactions related to the downstream processing of syngas. The split-GCC shows the source of the significant heat release from 1400°C to 300°C. One part can be seen in the foreground curve and stems from syngas cooling after the NC-POX reactor. The other part can be seen in the background process and is related to the combustion of process off-gases for steam generation, which was assumed to be unaffected by the proposed change of syngas production. The overlap of the foreground process in relation to the background process in the split-GCC shows clearly that surplus heat from conventional syngas production could be almost fully recovered to supply heat to other parts of the plant.
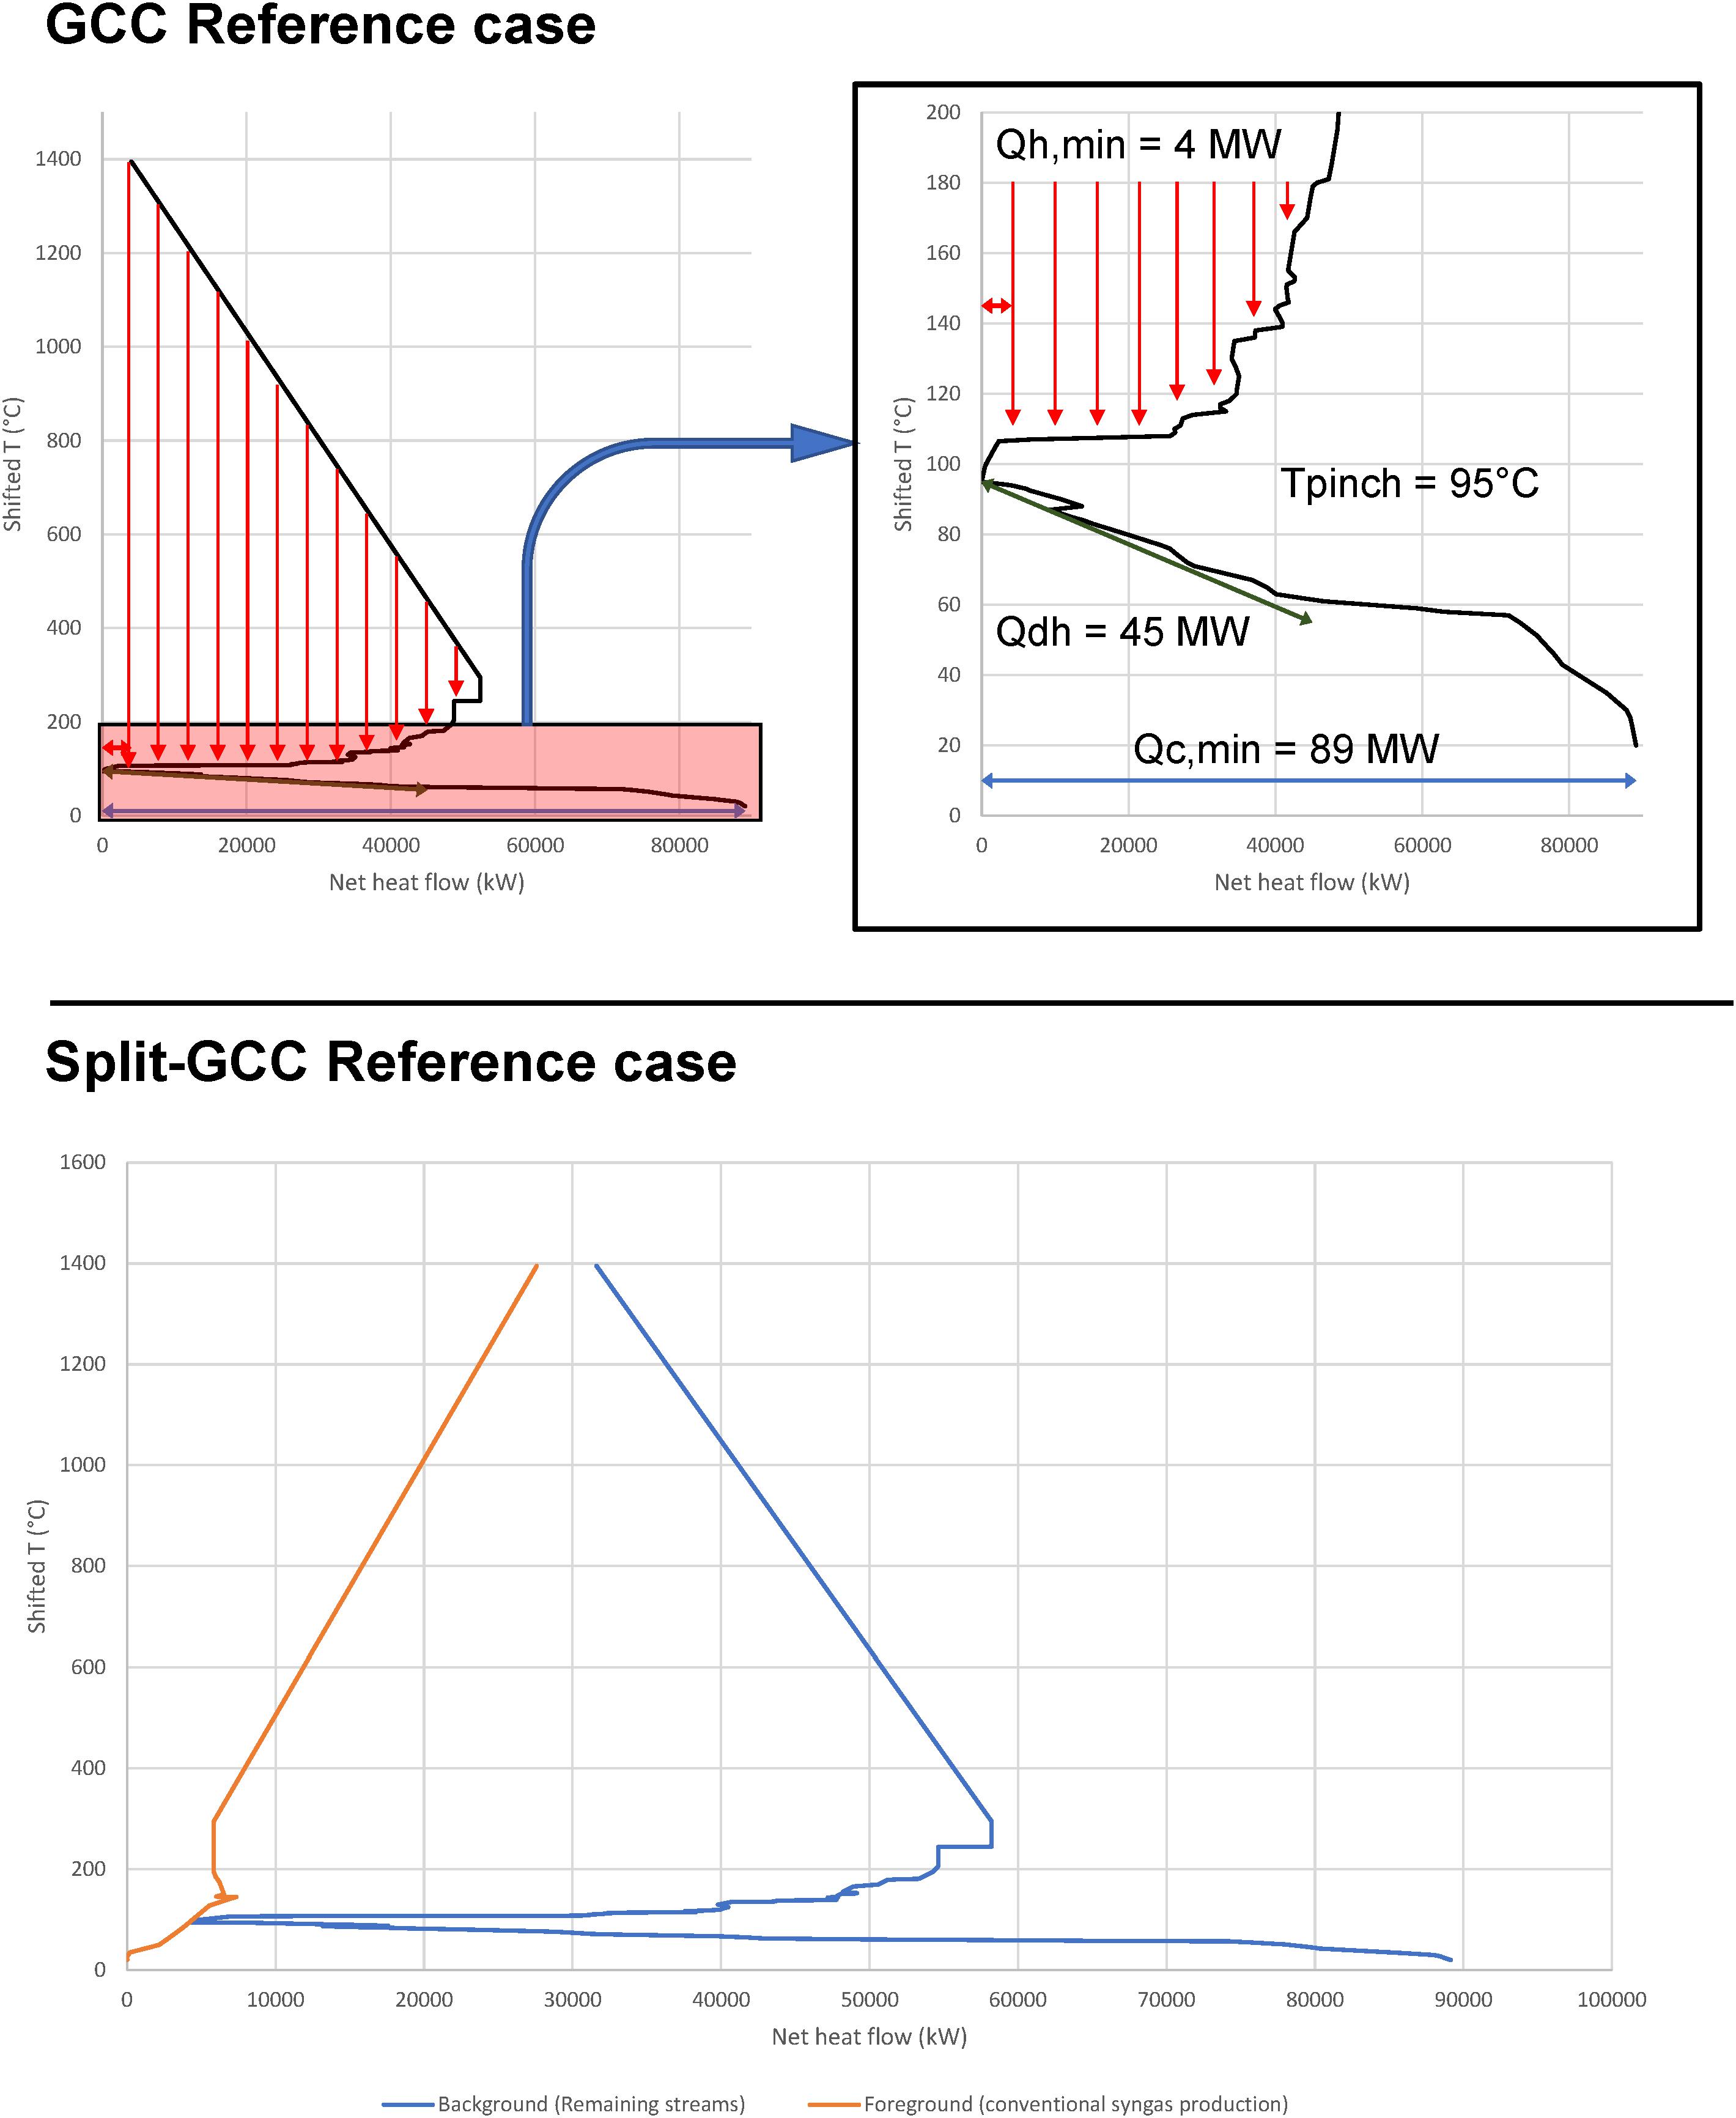
Figure 6. GCC and split-GCC for the reference case. In the GCC, the minimum heating (Qh,min) and cooling (Qc,min) demands, as well as the district heating delivery potential (Qdh) and the pinch temperature (Tpinch) are indicated. The red vertical arrows indicate heat flows within heat pockets.
Figure 7 shows how the process is affected by electrifying the syngas production unit. The GCC shows that the heat pocket decreases while the minimum heating demand increases strongly. The split-GCC shows that this is because heat integration of the streams related to syngas production with the background process streams is basically not possible because of the low temperature level of the heat released in the foreground process. Rather than being able to provide heat to the background process, the electrified syngas production requires additional heat (mainly at 120°) for the reboiler in the RWGS process. In addition, the heating demand that could have been satisfied by surplus heat from conventional syngas production now has to be provided by external utility.
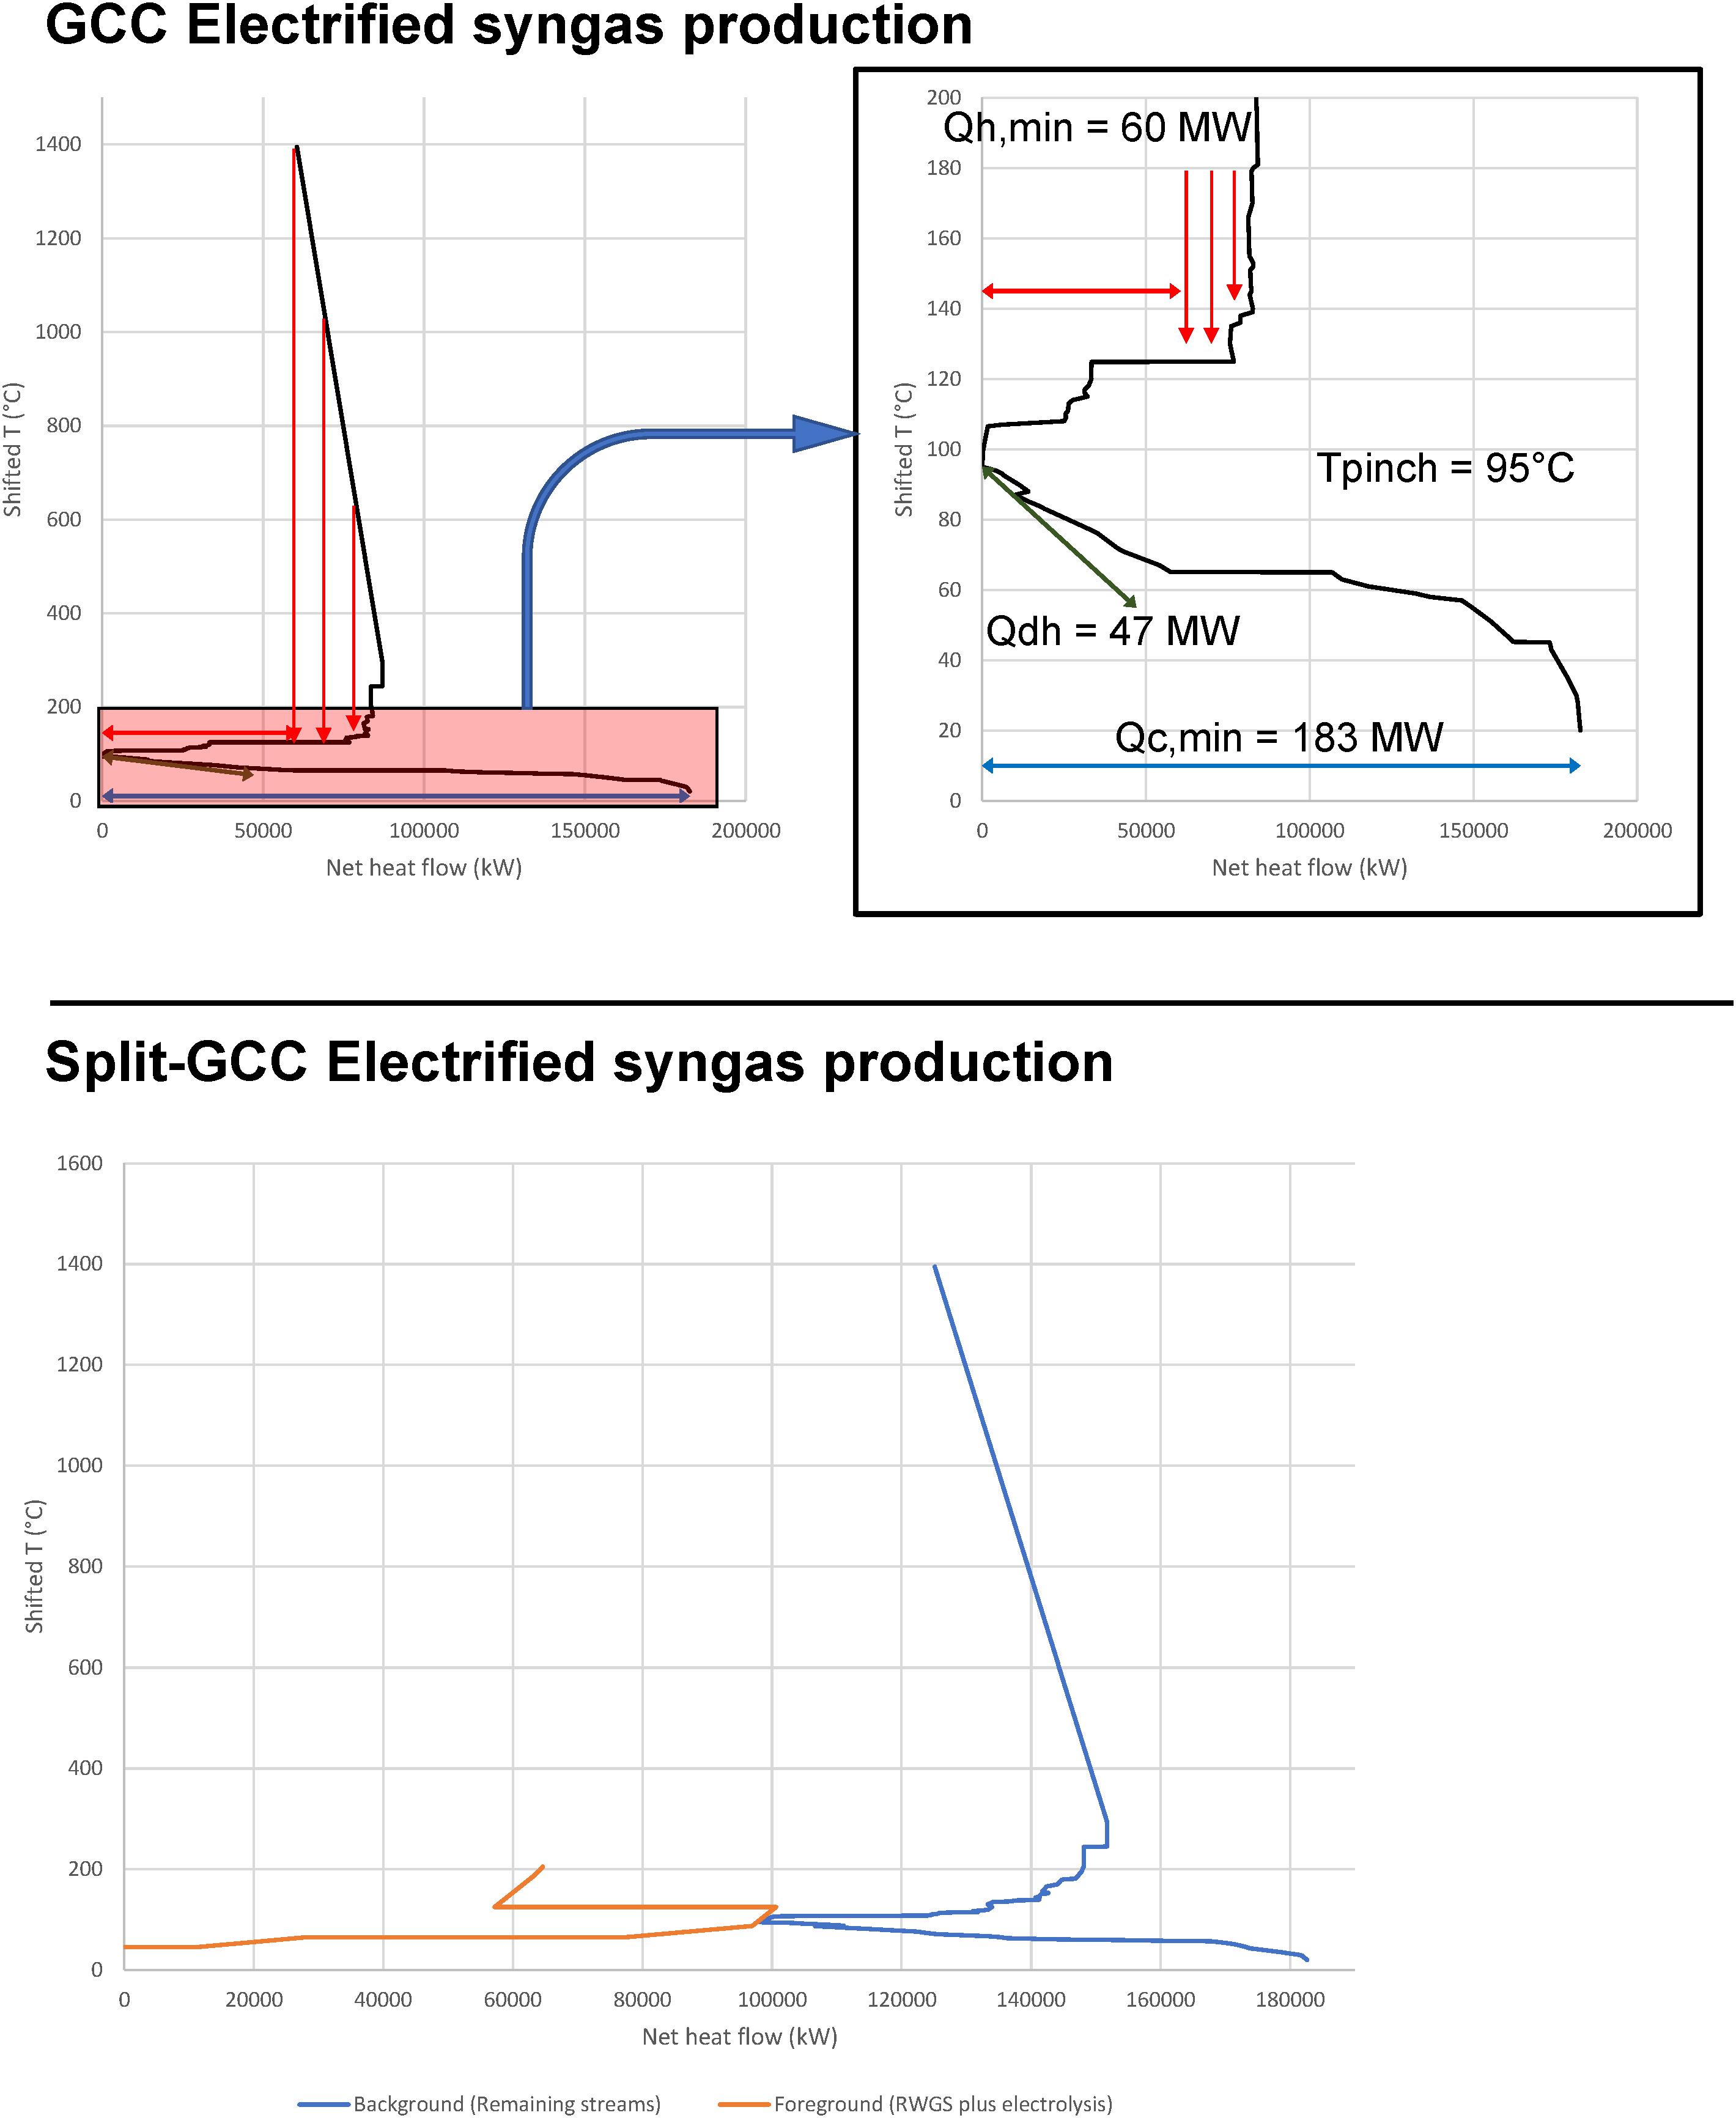
Figure 7. GCC and split-GCC for the electrified syngas case. In the GCC, the minimum heating (Qh,min) and cooling (Qc,min) demands, as well as the district heating delivery potential (Qdh) and the pinch temperature (Tpinch) are indicated. The red vertical arrows indicate the heat pocket.
Figures 6, 7 show that the minimum hot utility demand, which in both cases can be satisfied by LP steam, increases by 56 MW while the cold utility demand increases by 94 MW when switching to electrified syngas production. It can also be seen that the district heating delivery potential varies only slightly between the two cases.
Inventory of All Relevant Changes in Input and Output Flows of Material and Energy Compared to the Reference Process
Table 4 shows a summary of mass and energy flows for the conventional and the electrified syngas production that are relevant for the techno-economic and greenhouse gas emission assessment. It was assumed that the fuel gas and off-gas demands can be handled as natural gas demands since this is the marginal fuel at the process site. The natural gas and electricity demands for LP steam production represent the demands that were identified from the heat integration studies. For the natural gas boiler, an efficiency of 90% was assumed. The results clearly highlight the consequences of switching from natural gas to electricity as main energy carrier when implementing electrified syngas production. It can also be seen that the electrified syngas production requires a large amount of CO2 as feedstock while oxygen is generated as a new by-product. The energy demand for CO2 separation was not considered since it was assumed that this is allocated to the source of CO2 emissions. It can also be seen that the amount of tail gas is zero in the electrified syngas and steam production. This difference is not important since the tail gas is currently used to produce steam at the real plant that does not achieve maximum energy recovery. In the reference case with maximum heat integration, this amount of tail gas is not required.
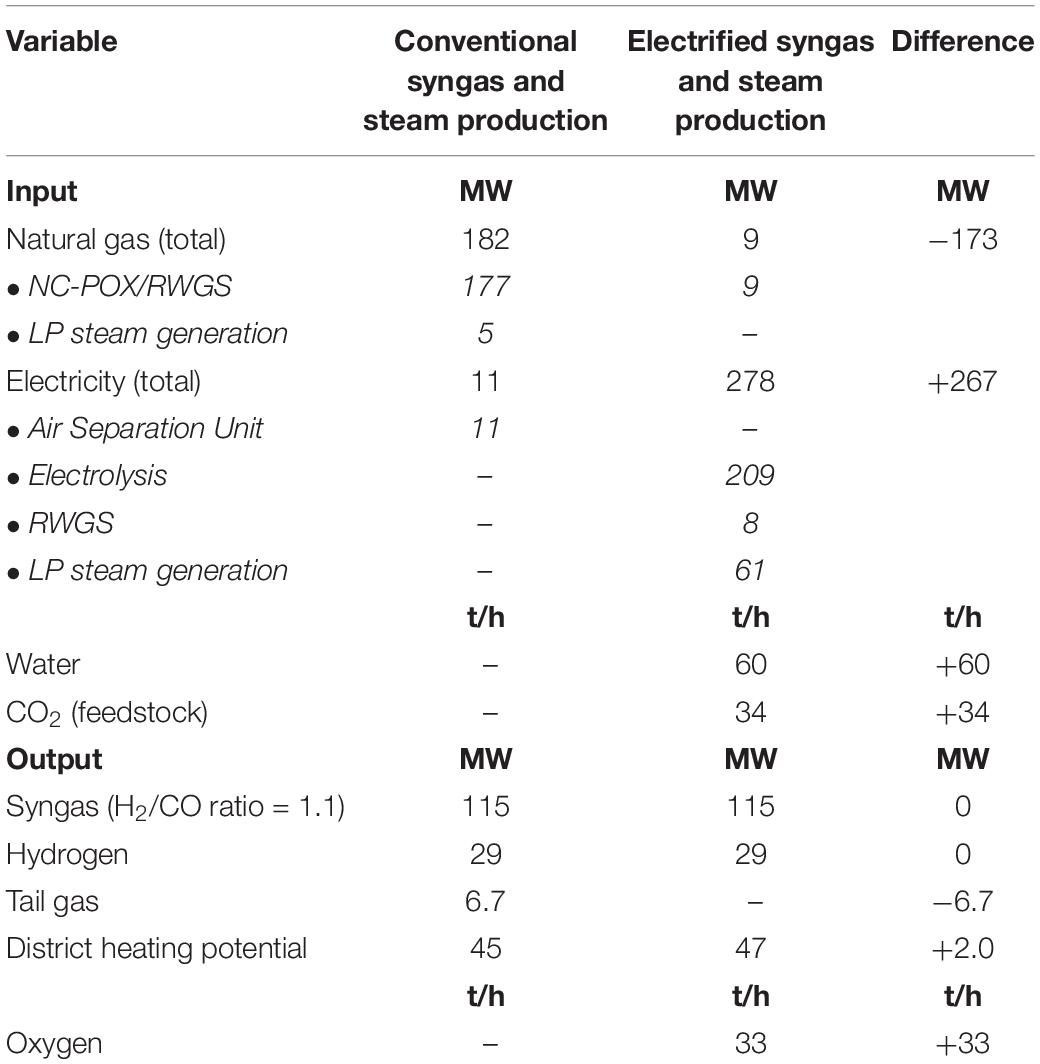
Table 4. Comparison of mass and energy flows for the conventional and the electrified syngas production.
Techno-Economic and Greenhouse Gas Emission Assessment
Greenhouse Gas Emission Assessment
In the greenhouse gas emission assessment, on-site and off-site emissions were considered in terms of equivalent CO2 emissions adopting a well-to-gate approach. The corresponding sources for greenhouse gas emissions are shown in Figure 8.
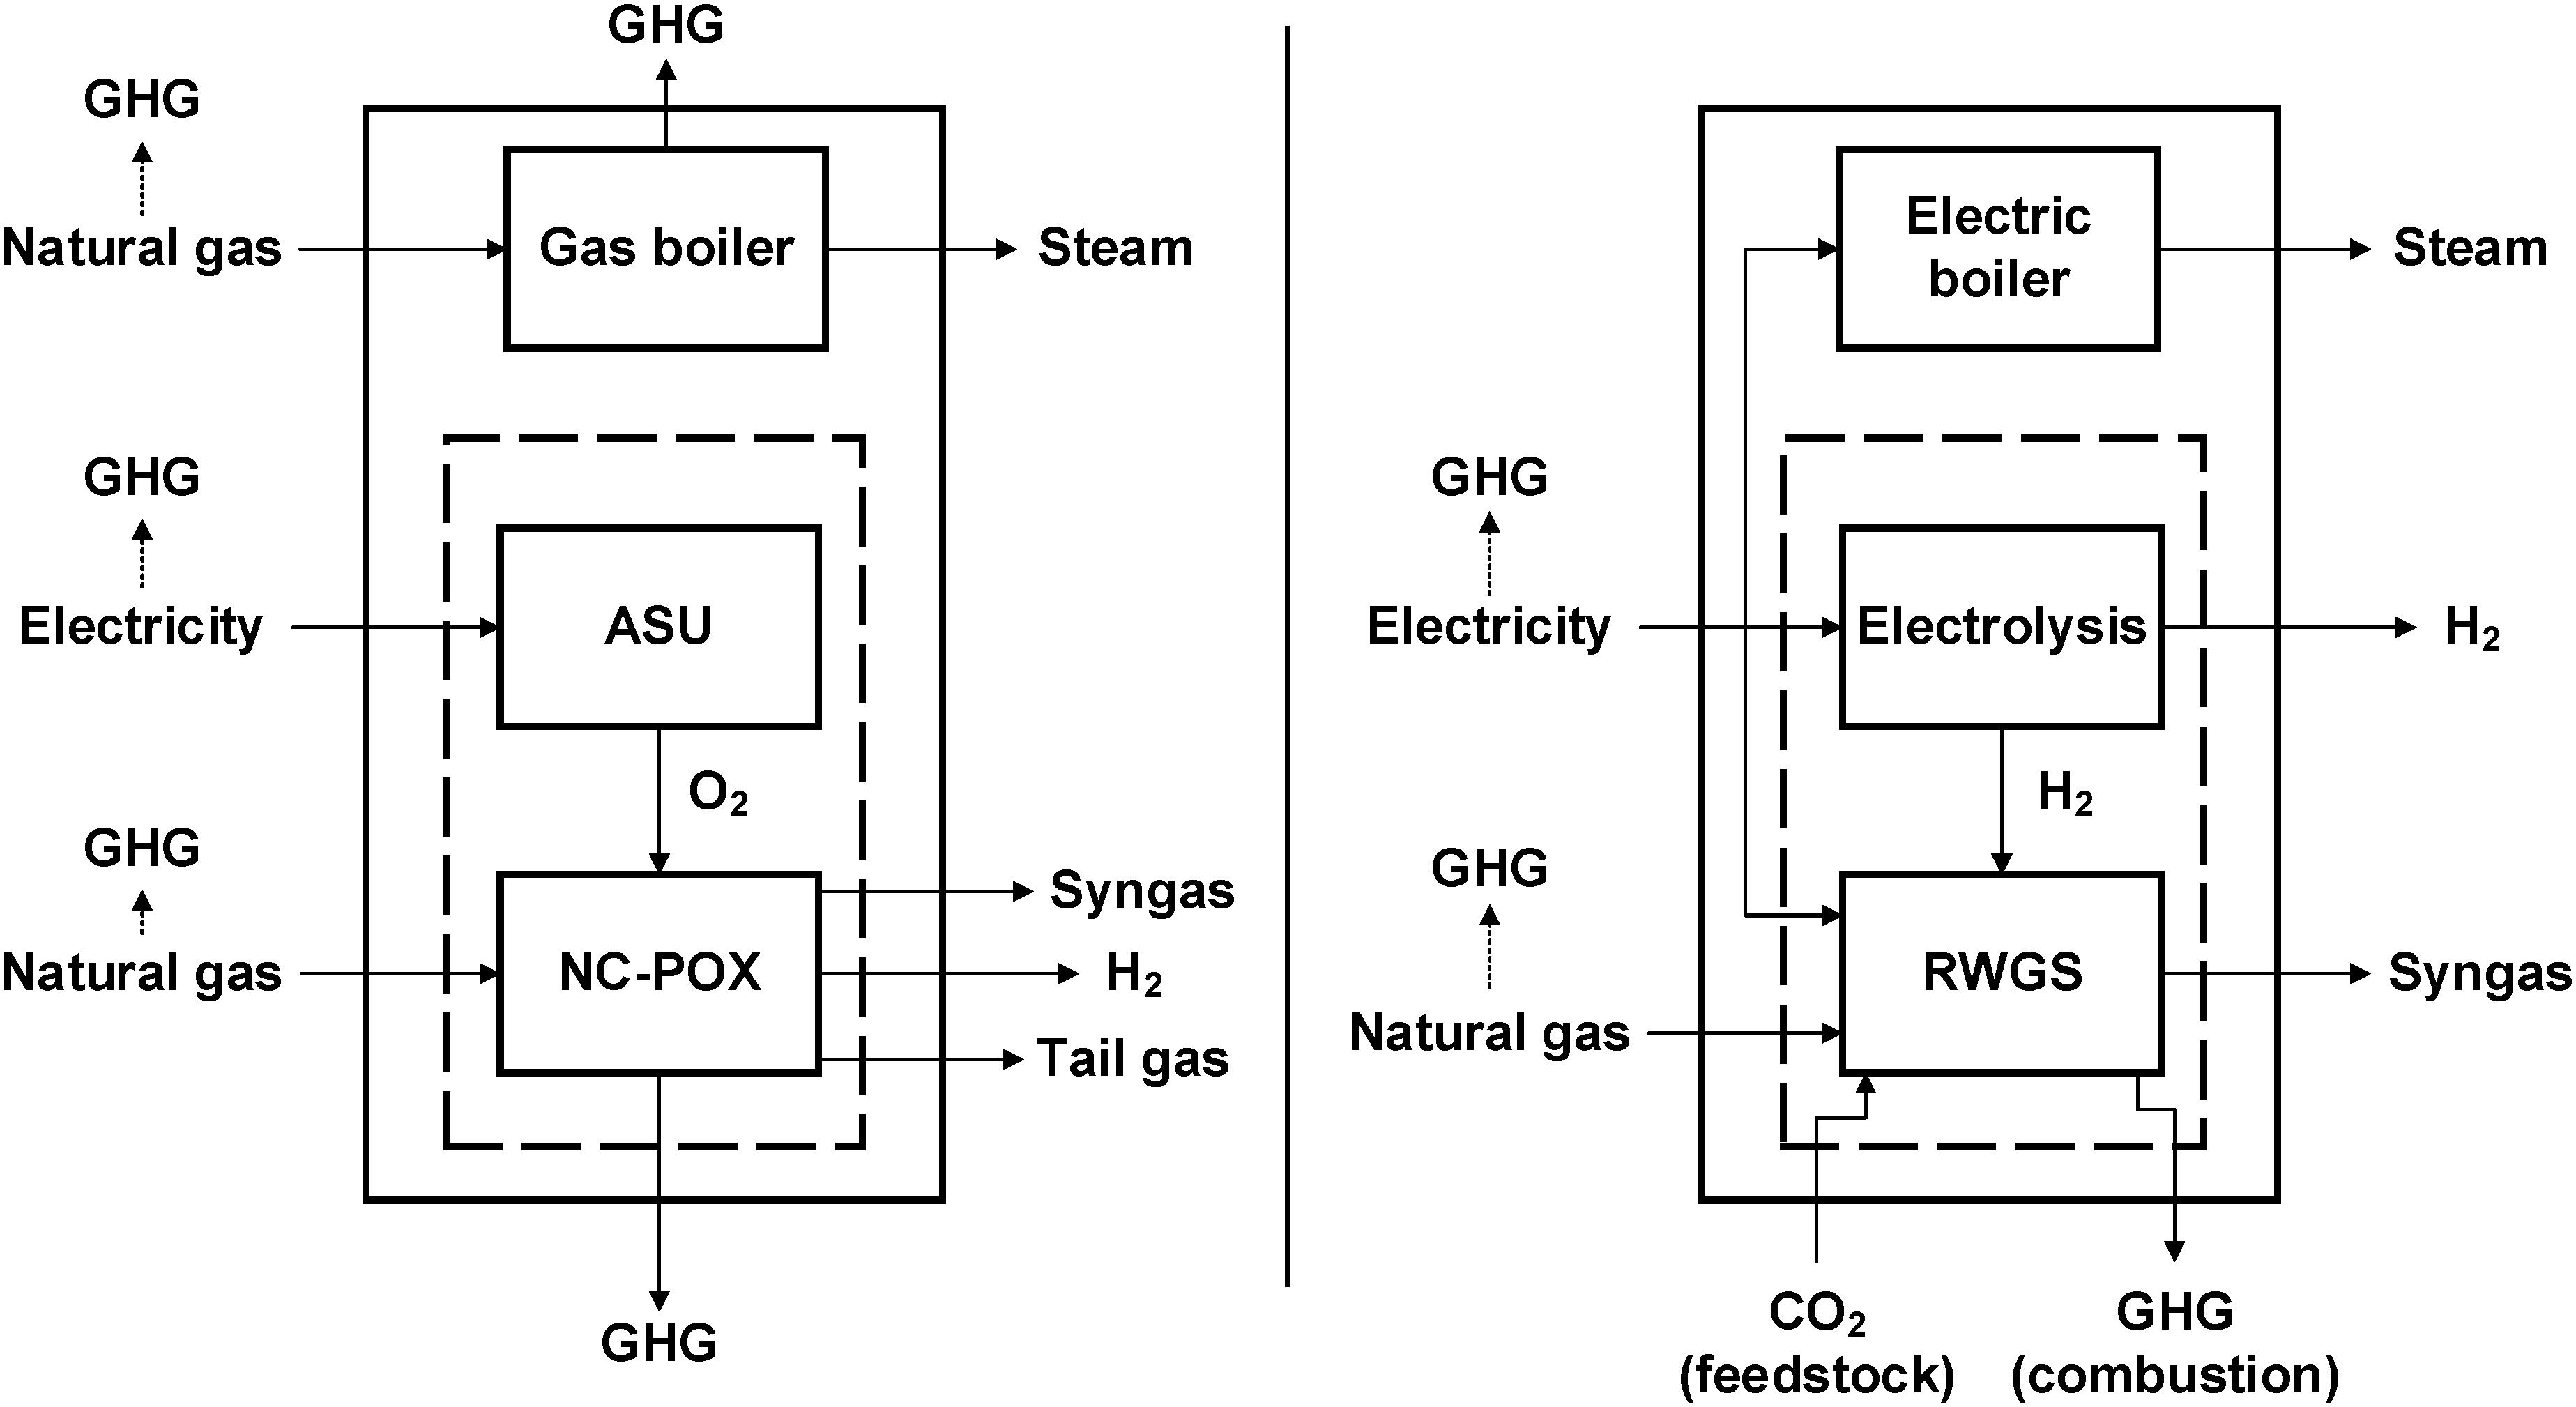
Figure 8. On-site and off-site greenhouse gas (GHG) emissions for the conventional syngas production (left) and the electrified syngas production (right). The dashed boxes represent the two syngas production technologies. Emissions crossing the solid-lines boxes are on-site emissions while emissions occurring outside of this box are off-site emissions.
The on-site emissions from the conventional syngas production stem from combustion of natural gas to heat for the NC-POX reactor and produce utility steam. Off-site emissions arise from the production (extraction and preparation) and transport of natural gas and electricity (well-to-gate perspective).
For the electrified syngas production, the only on-site emissions are related to the combustion of natural gas to provide the high-temperature RWGS reaction heat. Off-site emissions stem from the production of natural gas and electricity (well-to-gate). In addition, the process is fed with CO2 as feedstock that is assumed to be recovered from another process elsewhere. Since the assessment was a well-to-gate assessment, the emissions from the final products at the end of their lifetimes were not considered (since these were assumed to be the same for the reference and the electrified case), and the CO2 feedstock was accounted as avoided emissions at the plant at which it was assumed to be captured. Emissions related to the production (e.g., by amine-based CO2 capture which requires heat for the regenerator), and transport of the CO2 feedstock were not considered since it was assumed that they were not allocated to the electrified syngas production plant. This is one of several approaches for handling CO2 emissions in the context of carbon capture and utilisation (Tanzer and Ramírez, 2019).
The annual avoided greenhouse gas emissions (on-site and off-site), comparing the electrified with the conventional syngas production, were calculated as follows:
with
• PNG: natural gas demand in MW.
• PEL: electricity demand in MW.
• ghg: corresponding greenhouse gas emission factors in CO2eq/MWh (the abbreviation wtg stands for well-to-gate, comb stands for combustion while sg stands for syngas production).
• CO2,RWGS: CO2 feedstock demand for the RWGS reaction in kg/h.
• t: annual operating time in hours.
Based on Arvidsson et al. (2015), the greenhouse gas emissions from natural gas were assumed to be 53 kgCO2eq/MWh for the sum of off-site emission and emissions related to the conventional syngas production (ghgNG,wtg + sg) and 227 kgCO2eq/MWh for the sum of off-site emissions and emissions from combustion (ghgNG,wtg + comb). Furthermore, carbon-free power generation technologies such as wind and nuclear power were assumed as build margin power generation technology and the emission factor for electricity (ghgEL) was set to zero. This assumption is based on the view that substantial electrification of industrial processes leads to a strong increase in electricity demand which in turn triggers investments in new electricity generation capacities. These new capacities must be essentially emission-free since large-scale electrification would otherwise not be acceptable. For wind and nuclear power, an emission factor of zero was assumed. This corresponds to emissions related to plant operation. Emissions related to plant construction and decommissioning are small over the lifetime of the plant. It should be noted that the greenhouse gas emissions related to electricity production are very low for Sweden already today (13 kg/MWh) due to the high share of hydro and nuclear power. Thus, the average emission factor of the electricity generation system is close to the marginal emission factors assumed in this study. The annual operating time was assumed to be 8000 h per year. Due to the small change in district heating delivery potential for the electrified syngas production (+2 MW), the district heating delivery was neglected in the emission assessment.
Techno-Economic Assessment
For the techno-economic assessment, the change in operating cost when switching to electrified syngas production was calculated as follows:
with c as the corresponding cost factors.
The economic assessment was done for two energy market scenarios that were generated using the ENPAC tool (Axelsson and Harvey, 2010; Axelsson and Pettersson, 2014). Based on forecasted prices for fossil fuels on the commodity market and costs associated with emitting CO2, the tool calculates energy prices, including natural gas and electricity prices, for large-volume customers. In this assessment, two scenarios based primarily on data from the “New policies” and the “Sustainable development” scenarios from IEA’s World Energy Outlook 2018 (International Energy Agency, 2018) were generated, see Pettersson et al. (2020) for further details. The “New Policies” scenario is a predictive scenario that takes the impact of existing policy framework and today’s announced policies into account. The “Sustainable Development” scenario on the other hand is a back-casting scenario in which energy-related CO2 emissions peak in 2020 before they follow a trajectory that is fully aligned with the objectives of the Paris Agreement. The two scenarios were considered to study the effect of different ambition levels for greenhouse gas reduction. Scenario data for 2030 and 2040 was used to include a medium-term and a long-term perspective. In addition, it was assumed that the price for the CO2 feedstock is zero as best-case scenario (see section “Discussion”). The corresponding cost factors are shown in Table 5. The cost for cold utility was not included in the assessment since cooling water is readily available in Sweden at a cost that is low compared to the cost connected to hot utility.
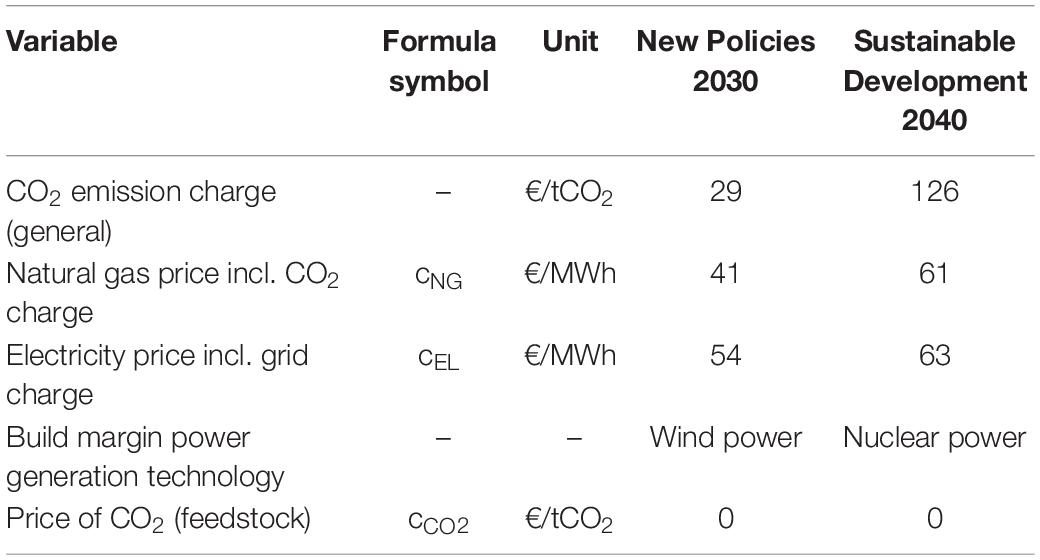
Table 5. Cost factors generated with the ENPAC tool based on the two IEA World Energy Outlook 2018 scenarios “New Policies” and “Sustainable Development” (Pettersson et al., 2020).
Overall Results
Table 6 summarises the resulting avoided greenhouse gas emissions and the changes in operating cost when comparing electrified syngas production and electric steam generation with conventional syngas production and fossil fuel-based steam generation for the two scenarios. The results indicate a large GHG emission savings potential, dominated by the CO2 feedstock for the RWGS reaction. However, also the savings from the decreased use of natural gas are substantial. It should be noted that the greenhouse gas emission factors did not change between the scenarios. Both scenarios show a large increase in operating cost because of the strongly increased electricity demand. However, the increase is slightly smaller for the “Sustainable Development 2040” scenario in which the price difference between natural gas and electricity is very small. It should remember that no cost was assumed for the CO2 feedstock.
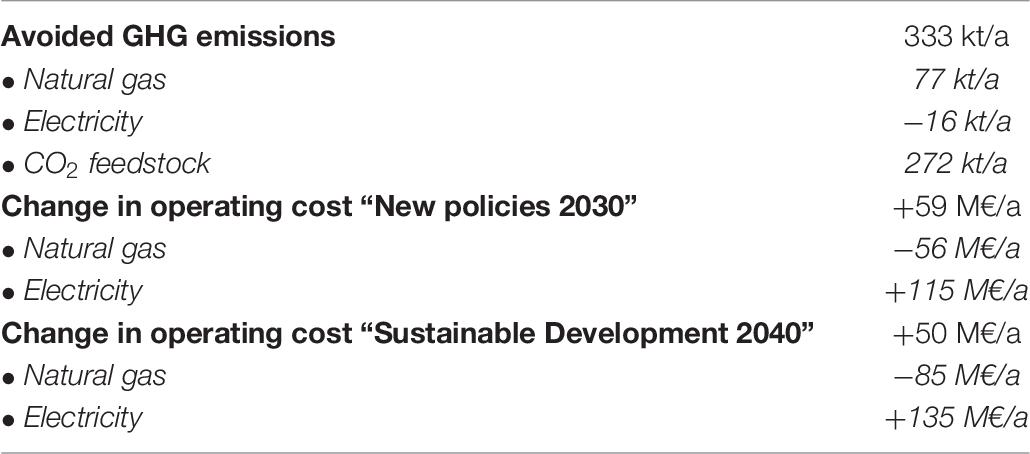
Table 6. Avoided GHG emissions and changes in operating cost for the two different scenarios.
Discussion
The results from the case study underline the importance of accounting for heat integration opportunities at the site since the changes in heat recovery potential and utility demands when switching from conventional syngas and steam production to electrified syngas and steam production were not obvious. Process heat that from conventional syngas production process was no longer available to cover on-site heat demands and the electrification option further increased heat demands. This led not only to a high electricity demand for the electrification itself, but also to a significant increase in hot utility demand. The increased hot utility demand needs to be covered either by fuel combustion, which could partly outweigh the fossil feedstock avoided by the electrification or, as assumed in the case study, by heat production in an electric boiler, thus further increasing the site’s electricity demand. The high electricity demand, in addition to a large demand for CO2 feedstock, highlights two examples of challenges related to electrification. Furthermore, this highlights the importance of co-development of process electrification with decarbonisation of the electricity generation system.
The applicability and reliability of the bottom-up assessment framework depends strongly on the availability of detailed process data and models for existing unit operations and those that are connected to the process electrification option. Especially for new technologies, such data and models might not be available. Another integral and significant part of the assessment framework is the selection of system boundaries and energy market scenarios. The system boundaries must be selected carefully to allow a fair comparison with the reference cases but also with other options for greenhouse gas emission reduction. In the case study, the system boundary was extended to include off-site emission from natural gas and electricity production, as well the CO2 uptake for the RWGS reaction to allow a holistic assessment. Especially for CO2 feedstock, the system boundaries and the allocation of greenhouse gas emissions that are connected to the production of this CO2 feedstock are not trivial. This is also the case for the assumptions about the prices of CO2 feedstock and depends on the type of CO2 (biogenic or fossil) and the capture process. In the case study, the CO2 feedstock was treated as a free waste product from another plant. Although this approach can be found in other studies as well, it would also be possible to include greenhouse gas emissions connected to the production of CO2 feedstock and to consider a certain price which could be based on the cost for capture. Furthermore, the choice of energy market scenarios has a strong impact on the greenhouse gas emission reduction potential and cost. It is important to include different scenarios based on different possible market developments since specific electrification options might perform well under one scenario but not for others. Such insights are crucial when it comes to the risk assessment of investments in electrification options. Costs related to upgrading the plant’s grid connection capacity were not included since the focus of the methodology is to understand the impact of electrification on the existing processes itself and the resulting energy cost rather than the electric grid connection cost. However, this site-specific cost can potentially be large and cannot be neglected in the project planning if electrification options are to be implemented. It is also important to note that wide-spread electrification will require substantial investment in grid distribution capacity. These costs will ultimately be passed on to electricity users. Estimating such costs was not included in this study.
In the case study presented in this paper, off-site emissions related to the production and transport of natural gas and electricity were included. This is a good approach to get a more holistic picture of the overall emission consequences. However, specific plant owners might mainly be interested in greenhouse emissions that they can influence and that they are financially accountable for.
For the case study plant, it is suggested that this methodology is applied to other electrification options as well (single ones or in combinations) to also allow a comparison not only of electrification options versus the current situation (reference base) but also to allow a comparison among different electrification options. The starting point is the inventory of electrification options for this plant. Results from these studies can also be used to allow a comparison with other decarbonisation options (e.g., increased use of biomass) to support industrial decision-making and guide the design of energy and environmental policies.
Conclusion
A bottom–up assessment framework for electrification options in energy intensive industrial process plants was presented and applied in a case study for an existing chemical plant. The broad variety of electrification options for industrial processes increases the necessity of such a systematic approach to identify promising options in terms of greenhouse gas emission reduction potential and energy costs. Since industrial process sites are often characterised by a high degree of process heat recovery, it is important to understand the interconnection between existing unit operations and the changes that result from introducing unit operations to increase process electrification on a detailed level.
The bottom–up assessment framework presented in this paper pays special regards to the on-site conditions of specific industrial plants and captures effects that are often overlooked in more general top–down studies that assume similar conditions for different industrial sites. A fundamental aspect of the framework is the inclusion of heat integration studies with pinch analysis tools to analyse how the heat surpluses or demands connected to electrification options change heat recovery potentials and utility demands. These effects can be substantial and complex and are usually not considered by top–down studies. However, they can be analysed using the proposed framework.
The framework also includes different energy market scenarios to investigate the performance for different future energy prices and costs related to greenhouse gas emissions. The careful selection of system boundaries and energy market scenarios is crucial to allow a fair comparison. The case study results as well as the fact that industrial process sites are usually very different suggest using the presented bottom–up approach to obtain a more accurate picture of the real greenhouse gas emission reduction potential and the cost for process electrification options.
The detailed assessment in the case when switching to electrified syngas and electrified steam production indicated natural gas savings of 173 MW while the electricity demand increased up to 267 MW, leading to a strong increase in energy costs but also avoided greenhouse gas emissions of 333 kt/a. For the two energy market scenarios for 2030 and 2040, the energy costs increase by 59M€/a and 50M€/a. Compared to the energy cost for the conventional syngas production, this equals an increase by 100% for the 2030 scenario and by 50% for the 2040 scenario.
The bottom-up assessment framework can be used to assess different electrification options and to compare them with a reference case or other greenhouse gas emission reduction measures and can complement top–down studies to get a more realistic picture of the greenhouse gas emission reduction potential and cost for process electrification.
Data Availability Statement
All datasets presented in this study are included in the article/Supplementary Material.
Author Contributions
All authors listed have made a substantial, direct and intellectual contribution to the work, and approved it for publication.
Funding
This work was conducted within the project “PROCEL Opportunities for decarbonisation of industrial processes through increased electrification” which was financed by the Swedish Energy Agency (project number P42221).
Conflict of Interest
ES was employed by the company CIT Industriell Energi AB.
The remaining authors declare that the research was conducted in the absence of any commercial or financial relationships that could be construed as a potential conflict of interest.
Supplementary Material
The Supplementary Material for this article can be found online at: https://www.frontiersin.org/articles/10.3389/fenrg.2020.00192/full#supplementary-material
References
Andersson, V., Franck, P. -Å, and Berntsson, T. (2016). Techno-economic analysis of excess heat driven post-combustion CCS at an oil refinery. Int. J. Greenh. Gas Control 45, 130–138. doi: 10.1016/j.ijggc.2015.12.019
Arvidsson, M., Morandin, M., and Harvey, S. (2014). Biomass gasification-based syngas production for a conventional oxo synthesis plant - process modeling, integration opportunities, and thermodynamic performance. Energy Fuels 28, 4075–4087. doi: 10.1021/ef500366p
Arvidsson, M., Morandin, M., and Harvey, S. (2015). Biomass gasification-based syngas production for a conventional oxo synthesis plant - greenhouse gas emission balances and economic evaluation. J. Clean. Prod. 99, 192–205. doi: 10.1016/j.jclepro.2015.03.005
Axelsson, E., and Harvey, S. (2010). Scenarios for Assessing Profitability and Carbon Balances of Energy Investments in Industry. Report 2010:EU1 Göteborg: AGS.
Axelsson, E., and Pettersson, K. (2014). Energy Price and Carbon Balances Scenarios tool (ENPAC) – A Summary of Recent Updates. Göteborg: Chalmers University of Technology.
Bahrmann, H., and Bach, H. (2012). Oxo Synthesis. Ullmann’s Encyclopedia of Industrial Chemistry. Weinheim: Wiley-VCH.
Berenschot, C. E. Delft, Industrial Energy Experts Energy Matters, (2017). Electrification in the Dutch Process Industry. Available at: https://www.cedelft.eu/en/publications/download/2278 (accessed May 6, 2020).
Berghout, N., Meerman, H., van den Broek, M., and Faaij, A. (2019). Assessing deployment pathways for greenhouse gas emissions reductions in an industrial plant – A case study for a complex oil refinery. App. Energy 236, 354–378. doi: 10.1016/j.apenergy.2018.11.074
Brau, J.-F., and Morandin, M. (2014). Biomass-based hydrogen for oil refining: integration and performances of two gasification concepts. Int. J. Hydrogen Energy 39, 2531–2542. doi: 10.1016/j.ijhydene.2013.10.157
Brolin, M., Fahnestock, J., and Rootzén, J. (2017). Industry’s Electrification and Role in the Future Electricity System - A Strategic Innovation Agenda. Available at: http://www.diva-portal.org/smash/get/diva2:1073841/FULLTEXT01.pdf (accessed May 6, 2020).
Bühler, F., Zühlsdorf, B., Nguyen, T.-V., and Elmegaard, B. (2019). A comparative assessment of electrification strategies for industrial sites: case of milk powder production. Appl. Energy 250, 1383–1401. doi: 10.1016/j.apenergy.2019.05.071
DECHEMA (2017). Low Carbon Energy and Feedstock for the European Chemical Industry. Available at: https://dechema.de/dechema_media/Downloads/Positionspapiere/Technology_study_Low_carbon_energy_and_feedstock_for_the_European_chemical_industry.pdf (Accessed May 6, 2020).
Delikonstantis, E., Scapinello, M., and Stefanidis, G. D. (2019). Process modeling and evaluation of plasma-assisted ethylene production from methane. Processes 7:68. doi: 10.3390/pr7020068
EPRI (2009). Program on Technology Innovation: Industrial Electrotechnology Development Opportunities. Available at: https://www.epri.com/#/pages/product/1019416/ (accessed May 6, 2020).
European Parliament (2009). Directive 2009/30/EC of the European Parliament and of the Council of 23 April 2009 amending Directive 98/70/EC as Regards the Specification of Petrol, Diesel and Gas-Oil and Introducing a Mechanism to Monitor and Reduce Greenhouse gas Emissions and Amending Council Directive 1999/32/EC as Regards the Specification of fuel Used by Inland Waterway vessels and Repealing Directive 93/12/EEC. Available at: https://eur-lex.europa.eu/LexUriServ/LexUriServ.do?uri=OJ:L:2009:140:0088:0113:EN:PDF (accessed May 6, 2020).
European Roundtable on Climate Change and Sustainable Transition, (2019). 2019 State of the EU ETS Report. Available at: https://ercst.org/wp-content/uploads/2019/05/2019-State-of-the-EU-ETS-Report.pdf (accessed May 6, 2020).
Foit, S. R., Vinke, I. C., de Haart, L. G. J., and Eichel, R.-A. (2017). Power-to-Syngas: an enabling technology for the transition of the energy system? Angew. Chem. Int. Ed. 56, 5402–5411. doi: 10.1002/anie.201607552
Gerres, T., Chaves, Ávila, J. P., Llamas, P. L., and San Román, T. G. (2019). A review of cross-sector decarbonisation potentials in the European energy intensive industry. J. Clean. Prod. 210, 585–601. doi: 10.1016/j.jclepro.2018.11.036
Grahn, M., and Jannasch, A.-K. (2018). Electrolysis and Electro-Fuels in the Swedish Chemical and Biofuel Industry: a Comparison of Costs and Climate Benefits. Sweden: f3 The Swedish Knowledge Centre for Renewable Transportation Fuels.
Gundersen, T. (2002). A Process Integration Primer. Available at: http://www.ivt.ntnu.no/ept/fag/tep4215/innhold/Retrofit-new.pdf (accessed May 6, 2020).
Hackl, R., Andersson, E., and Harvey, S. (2011). Targeting for energy efficiency and improved energy collaboration between different companies using total site analysis (TSA). Energy 36, 4609–4615. doi: 10.1016/j.energy.2011.03.023
International Energy Agency (2017a). Renewable Energy for Industry - From Green Energy to Green Materials and Fuels. Paris: International Energy Agency.
International Energy Agency (2017b). Tracking Clean Energy Process 2017. Paris: International Energy Agency.
Johansson, D., Berntsson, T., and Franck, P. -Å (2014). Integration of Fischer-Tropsch fuel production with a complex oil refinery. Int. J. Environ. Sust. Dev. 13, 50–73. doi: 10.1504/IJESD.2014.056413
Lechtenböhmer, S., Nilsson, L. J., Åhman, M., and Schneider, C. (2016). Decarbonising the energy intensive basic materials industry through electrification – Implications for future EU electricity demand. Energy 115, 1623–1631. doi: 10.1016/j.energy.2016.07.110
Oluleye, G., Smith, R., and Jobson, M. (2016). Modelling and screening heat pump options for the exploitation of low grade waste heat in process sites. Appl. Energy 169, 267–286. doi: 10.1016/j.apenergy.2016.02.015
Pettersson, K., Axelsson, E., Eriksson, L., Svensson, E., Berntsson, T., and Harvey, S. (2020). Holistic methodological framework for assessing the benefits of delivering industrial excess heat to a district heating network. Int. J. Energy Res. 2020, 2634–2651. doi: 10.1002/er.5005
Reller, C., Krause, R., Volkova, E., Schmid, B., Neubauer, S., Rucki, A., et al. (2017). Selective Electroreduction of CO2 toward ethylene on nano dendritic copper catalysts at high current density. Adv. Energy Mater. 7:1602114. doi: 10.1002/aenm.201602114
Rezaei, E., and Dzuryk, S. (2019). Techno-economic comparison of reverse water gas shift reaction to steam and dry methane reforming reactions for syngas production. Chem. Eng. Res. Des. 144, 354–369. doi: 10.1016/j.cherd.2019.02.005
Samadi, S., Lechtenböhmer, S., Schneider, C., Arnold, K., Fischedick, M., Schüwer, D., et al. (2016). Decarbonization Pathways for the Industrial Cluster of the Port of Rotterdam. Wuppertal: Wuppertal Institut.
Sandberg, E., Toffolo, A., and Krook-Riekkola, A. (2019). A bottom-up study of biomass and electricity use in a fossil free Swedish industry. Energy 167, 1019–1030. doi: 10.1016/j.energy.2018.11.065
Schwab, E., Milanov, A., Schunk, S. A., Behrens, A., and Schödel, N. (2015). Dry reforming and reverse water gas shift: alternatives for syngas production? Chem. Ing. Tech. 87, 347–353. doi: 10.1002/cite.201400111
Stork, M., de Beer, J., Lintmeijer, N., and den Ouden, B. (2018). Chemistry for Climate: Acting on the need for speed - Roadmap for the Dutch Chemical Industry towards 2050. Available at: https://www.vnci.nl/Content/Files/file/Downloads/VNCI_Routekaart-2050.pdf (accessed May 6, 2020).
Tanzer, S. E., and Ramírez, A. (2019). When are negative emissions negative emissions? Energ. Environ. Sci. 12, 1210–1218. doi: 10.1039/C8EE03338B
Keywords: energy-intensive process industries, electrification, bottom–up assessment, chemical industry, techno-economic assessment, energy market scenarios
Citation: Wiertzema H, Svensson E and Harvey S (2020) Bottom–Up Assessment Framework for Electrification Options in Energy-Intensive Process Industries. Front. Energy Res. 8:192. doi: 10.3389/fenrg.2020.00192
Received: 06 May 2020; Accepted: 20 July 2020;
Published: 11 August 2020.
Edited by:
Theodoros Damartzis, École Polytechnique Fédérale de Lausanne, SwitzerlandReviewed by:
Martin Atkins, University of Waikato, New ZealandAlessio Santecchia, École Polytechnique Fédérale de Lausanne, Switzerland
Copyright © 2020 Wiertzema, Svensson and Harvey. This is an open-access article distributed under the terms of the Creative Commons Attribution License (CC BY). The use, distribution or reproduction in other forums is permitted, provided the original author(s) and the copyright owner(s) are credited and that the original publication in this journal is cited, in accordance with accepted academic practice. No use, distribution or reproduction is permitted which does not comply with these terms.
*Correspondence: Holger Wiertzema, aG9sZ2Vyd0BjaGFsbWVycy5zZQ==