 John P. Barton
 Rupert J. L. Gammon
 Abdulla Rahil
- 1Institute of Energy and Sustainable Development (IESD), De Montfort University, Leicester, United Kingdom
- 2Centre for Renewable Energy Systems Technology (CREST), School of Mechanical, Electrical and Manufacturing Engineering, Loughborough University, Loughborough, United Kingdom
- 3The Centre for Automotive & Power Systems Engineering (CAPSE), Faculty of Computing, Engineering and Science, University of South Wales, Pontypridd, Wales, United Kingdom
Electricity systems require energy storage on all time scales to accommodate the variations in output of solar and wind power when those sources of electricity constitute most, or all, of the generation on the system. This paper builds on recent research into nickel-iron battery-electrolysers or “battolysers” as both short-term and long-term energy storage. For short-term cycling as a battery, the internal resistances and time constants have been measured, including the component values of resistors and capacitors in equivalent circuits. The dependence of these values on state-of-charge and temperature have also been measured. The results confirm that a nickel-iron cell can hold 25% more than its nominal charge. However, this increased capacity disappears at temperatures of 60°C and may be dissipated quickly by self-discharge. When operating as an electrolyser for long-term energy storage, the experiments have established the importance of a separation gap between each electrode and the membrane for gas evolution and established the optimum size of this gap as approximately 1.25 mm. The nickel-iron cell has acceptable performance as an electrolyser for Power-to-X energy conversion but its large internal resistance limits voltage efficiency to 75% at 5-h charge and discharge rate, with or without a bubble separation membrane.
Introduction
Energy storage is becoming an increasingly critical component of low-carbon energy systems at all scales, from national networks down to micro-grids. At the smaller end of this range, batteries are routinely used at the heart of household or community-level energy supply networks, typically powered by solar photovoltaics and wind turbines, especially in remote and Developing World applications. However, it is often the battery that is the weakest part of a stand-alone mini-grid as it is the most vulnerable, and yet most expensive, element of the system (Wiemann et al., 2011; Innovation Energie Développement (IED), 2013; Crossland et al., 2015; Danish Energy Management, 2019). Industrialised nations also are installing batteries, in their national grids, for the purposes of frequency response and peak lopping.
Just one battery chemistry, nickel-iron (Ni-Fe), stands out from the rest for its durability and robustness. Lead-acid batteries are degraded by high temperatures and by being stored in a partially discharged state (Ruetschi 2004). Lithium-ion batteries are more expensive and are degraded by high temperatures, deep cycling and by being stored at a high state-of-charge (SOC) (Ecker et al., 2014). Ni-Fe batteries are also more expensive than lead-acid, and have several drawbacks, for example a low round-trip efficiency of 50%–80%, and a high self-discharge rate of 1%–2% per day at 25°C and much faster at higher temperatures (Chakkaravarthy et al., 1991; Shukla et al., 1994). Nevertheless, Ni-Fe batteries continue to occupy a niche in the battery market where ultra-reliability and long cycle life are required (Dougherty et al., 1995). The service life can be 20 or 25 years (Chakkaravarthy et al., 1991) and there are examples of Ni-Fe batteries lasting for 40 years (Soutar, 2018). Research in Ni-Fe batteries has continued (Hariprakash et al., 2005; Gaffor et al., 2010; Kong et al., 2020) including an innovation to improve the power density (Wang et al., 2012).
Wind and solar power outputs vary on all timescales, as does energy demand. Batteries are practical for storing and delivering energy over diurnal cycles, but weekly patterns of demand, weather-related variation over several days or weeks, and seasonal variations are more difficult to cope with. Hydrogen has long been proposed as a long-term energy storage medium for such cases (Borgschulte, 2016). Such hydrogen production is an example of Power-to-X in its own right and an input for sustainable production of synthetic fuels such as methanol, methane and ammonia.
Recently, there has been renewed interest in using Ni-Fe technology as a combined battery and electrolyser, a so-called “battolyser” (Mulder and Weninger, 2016; Mulder et al., 2017). As well as being potentially well suited to the mini-grid applications discussed above, such a device might also be scaled up for large-capacity energy storage on national-scale energy networks.
While the focus of Mulder et al. (2017) was to verify that the Ni-Fe device can operate as both a battery and an electrolyser, the present paper explores how it might perform under a wider envelope of temperatures and charge rates and discharge rates in the real world, and considers some of the design parameters of a practical device. The present paper also measures the transient response of a Ni-Fe cell and thereby establishes an equivalent circuit that will be useful when designing a battolyser or Ni-Fe cell.
The aim of the experiment was to simulate the operation of a battolyser where the maximum power input as an electrolyser is much greater than the power input or output as a battery. This design philosophy maximises the value of the capital investment by maximising the useful energy throughput.
It is anticipated that such a battolyser will produce hydrogen for high-power and high-energy loads such as cooking and water heating, while also storing electrical power for lower power and lower energy loads such as lighting, mobile phone charging, televisions, radios and computers. The intended application is in mini-grids for communities in the developing world that are not connected to the national grid. The hydrogen will provide a sustainable alternative to liquefied petroleum gas as a cooking gas, and an alternative to biogas for communities without sufficient biological feedstocks. Clean cooking fuels are an essential part of achieving the UN Sustainable Development Goals (SDG), especially SDG 7 (United Nations 2019).
Materials and Methods describes the experiments performed. Results shows the results and discusses them. Discussion describes the next steps and the design modifications necessary in a practical, commercial device.
Materials and Methods
Experiments were conducted at small laboratory scale and the apparatus was similar to that of Mulder et al. (2017) as described below.
Electrodes
The present experiments used electrodes extracted from a commercially sold Ni-Fe cell, manufactured by the Sichuan Changhong Battery Co., Ltd. The cell was the smallest size available, with a nominal capacity of 10 Ah and voltage of 1.2 V. The cell consisted of pocket-plate electrodes of alternating polarity. Three negative (iron containing) anode plates were interspersed between with four positive (nickel containing) cathode plates. This cell was chosen because it was readily available and provided plates of an appropriate size for benchtop experimentation. The construction of a battolyser cell using components from a commercial battery offers an easier route to market than the construction of components within house.
In order to convert the cell from a battery to a battolyser, it was necessary to insert a bubble separation membrane between the plates and to collect gas produced by electrolysis. For simplicity, just one electrode plate of each type was used in the present experiments. Since just two out of the seven original plates were used, the new cell capacity was estimated as 3 Ah. The physical size of each electrode was 7 cm by 7 cm, and therefore the maximum current density achievable was just over 200 mA cm−2 using a 10 A power supply.
Electrolyte
This assembly was placed in potassium hydroxide solution at 30% concentration by weight. Unlike the experiments of Mulder et al. (2017), the electrolyte did not include any sodium hydroxide or lithium hydroxide. Only potassium hydroxide solution was used, because it is easier to obtain and more similar to the electrolyte used in an alkaline electrolyser (Hydrogenics, 2013; NEL Hydrogen, 2020; Keçebaş et al., 2019). In future tests, the long-term durability of the battolyser may be improved by the addition of lithium hydroxide to protect the positive electrode against migrated ferric hydroxide (Shukla et al., 1994).
Membrane
The bubble separation membrane was the same material as used by Mulder et al. (2017): Zirfon-Perl-UTP500 from Agfa Speciality Products. This was chosen because it is an available, low-cost asbestos free membrane material.
Data Acquisition
Currents and voltages were measured using handheld meters. Gases were collected over water using measuring beakers. The temperature of the cell was measured using a k-type thermocouple probe. A diagram of the experimental set-up is shown in Figure 1. The voltmeter was placed directly on the cell terminals to minimise the effect of contact resistances.
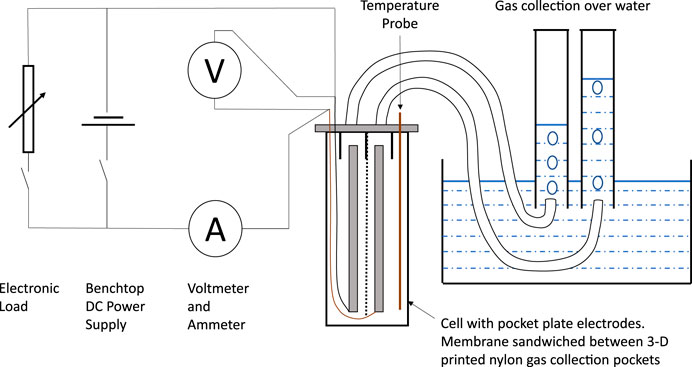
FIGURE 1. Experimental setup.
It was not possible to determine whether the cell capacity was limited by the positive or negative electrodes since no reference electrode was available and electrode voltages were not measured relative to a reference voltage.
Experiments
The experiments were designed to test the battolyser at low and high current densities to simulate the intended application in mini-grids. Electrical charging and discharging were conducted at currents of 0.6 A (C/5 rate) and 1.5 A (C/2 rate). Electrolysis tests were conducted at up to 10 A (3.3C rate).
The experiments were conducted in 2 phases. In the first phase, the gap between the electrodes and membrane was varied and its effect on cell electrical efficiency and electrolysis efficiency were measured. This was done to establish the optimum gap, which is a trade-off between length of electrical conduction path and the ability of bubbles to escape during electrolysis.
In the second phase, the experimental cell was rebuilt to enable gas collection. The temperature, charge rate and discharge rate were varied, to explore the effects of high ambient temperature and high renewable energy input rates that might be encountered in a larger battery as part of a practical energy storage system. Experiments at 20°C were carried out with no temperature control other than the room thermostat. Experiments at 40 and 60°C were carried out with the cell in a thermostatically controlled water bath. The heat dissipated inside the cell during charging and discharging was 3 W or less. The heat dissipated during electrolysis was 30 W or less for a much shorter period. The thermal mass of the cell and the large, uninsulated surface area were such that the temperature rise of the experimental cell due to self-heating was negligible, as confirmed by the temperature probe inside the cell.
In phase 2, the additional cell capacity observed by Mulder et al. (2017) and electrolysis gas volumes were measured to establish the real cell capacity and total energy efficiency.
Measurements Taken
Electrical measurements were used to measure the total charge entering and leaving the cell and voltage as a function of time and charge level. Thus, as the cell was cycled, the charge efficiency (Coulombic efficiency) and overall energetic efficiency were measured.
Cell Equivalent Circuit and Interruption Tests
During the cell cycling, the charging and discharging was periodically interrupted to establish the transient response of the cell (Stroe et al., 2016). From this, the component values of an equivalent circuit with two RC networks (Tian et al., 2014; Zhang C et al., 2018) were calculated, as shown in Figure 2. In order to fully model the transient characteristics of the cell, an equivalent circuit with two resistor-capacitor pairs was chosen and found to be a good fit to the data. With this model, it will be possible to calculate the ability of a Ni-Fe battery to meet transient loads of various sizes and durations.
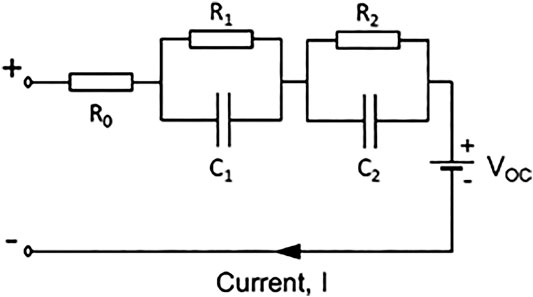
FIGURE 2. Equivalent circuit of the Ni-Fe cell.
Each of the parameters was calculated from measurements and in some cases found to be functions of state-of-charge (SOC), temperature and cell construction. Open circuit voltage (VOC) also exhibits hysteresis between charging and discharging.
Interruption tests were used to calculate the component values of the equivalent circuit. Data was measured every 10 s for 5 min as shown in the enlarged insets of Figure 3 curve was fitted to the data as a sum of two decaying exponential terms, Eqs 1–7.
Constants τ1 and τ2 are the time constants of the resistor-capacitor circuits:
Taking the example of an interruption during charging, the voltage before interruption (time t = 0) is V0. In a fully stabilised cell, the capacitors have zero current flowing through them, and therefore:
The initial values of the curve-fit functions are found by extrapolation of the components
When resistances R1 and R2 have been established, the capacitances can also be calculated using Eqs 2 and 3:
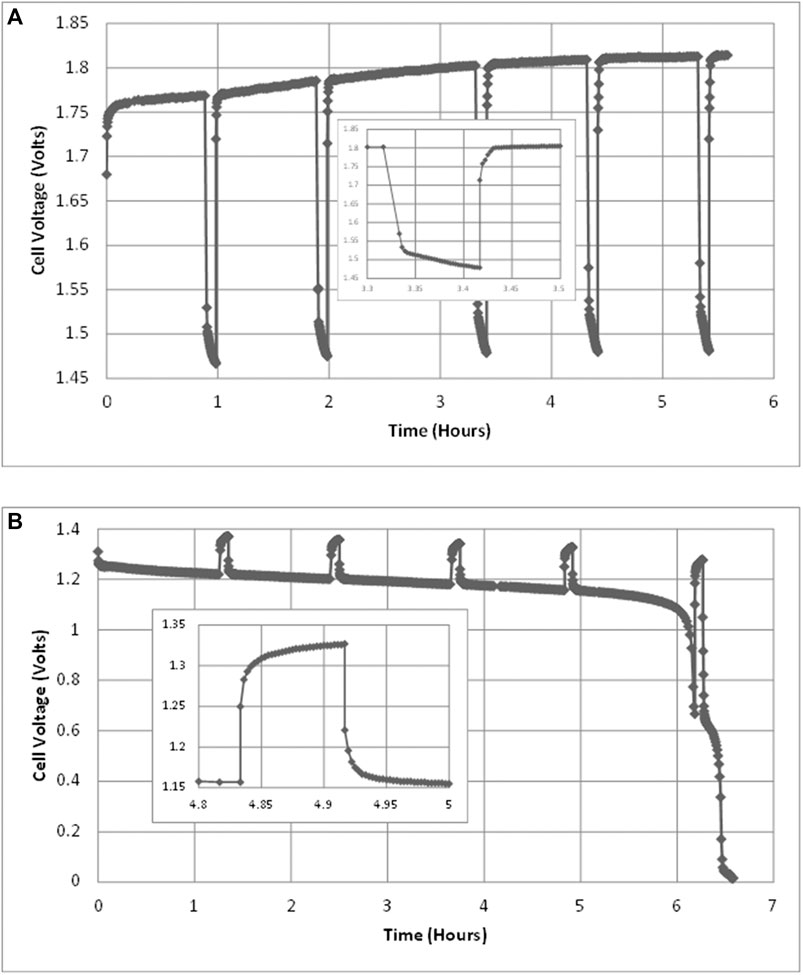
FIGURE 3. Cell voltages during (A) charging test at 1.5 A, 40°C and (B) discharging test at 0.6 A, 40°C. Each test includes five interruption tests of 5 min each. An example interruption is shown in each, enlarged and inset.
The components of the equivalent circuit can also be calculated from the recovery period after interruption. However, the method is not as easy, or as accurate, for the following reasons:
(1) After just 5 min of interruption, the capacitances of the equivalent circuit have not fully discharged. The conditions at the time of reconnection are not fully known and therefore, a curve fit of data over the following 5 min would not be as accurate.
(2) When recovering to a state of charging or discharging, the open-circuit voltage of the cell, VOC, is continuously changing. There is no fixed asymptote to which the cell recovers.
Electrolysis Tests
When fully charged, and also when not fully charged, the cell was tested as an electrolyser by increasing the applied voltage. The voltage was increased from 1.5 V in steps of 0.05–3.0 V or until a current of just over 10 A was achieved. These tests simulate periods surpluses of power in a mini-grid, caused for example by an increase in wind turbine power or midday solar PV power.
Where possible, the volume of hydrogen was measured separately from the volume of oxygen. However, there was an inadequate seal between the two halves of the cell and only a total volume of gas could be measured.
Measurements of Cell Electrical Capacity
The capacity of the cell was measured during discharge by Coulomb counting, i.e., an integration of current drawn from the cell between full and empty. The starting point for discharge was a high SOC, soon after the end of charging. This “full” SOC has no clear markers, other than the point during charging at which the cell voltage plateaus and stops rising. An indefinite amount of charge can still be inserted into the fully-charged cell, but no longer results in the storage of more electrical charge. Instead, energy is consumed in hydrogen production and a much smaller amount is dissipated through side reactions of the cell, Eq. 8:
One way to detect the fully charged condition is to wait until the cell voltage has not increased by more than 1 mV in 5 min (in constant-current mode). Another way is to wait until cell current has not dropped by more than 10 mA in 5 min (constant-voltage mode). A third way is simply to leave the cell charging overnight. All these methods have been tried in the tests described here.
Discharge was not cut off at the point of voltage collapse since that event is not well defined and very dependent on the discharge rate. Discharge was continued with a terminal voltage very close to zero. A more repeatable end point for discharging can be defined as when the voltage has collapsed, the cell has been shorted out and the current has dropped to a very low level (typically below 0.15 A). At this “empty” point, the current is dropping and exponentially approaching zero. The cell always carries some residual charge, and to completely flatten it would take an unfeasibly long time. The best way to estimate this residual charge is therefore to fit an exponential function to the measured discharge current and to integrate this function, Eqs 9 and 10.
The parameters τ3 and A3 are found by curve fitting. The residual charge was found to be relatively small compared to the total cell capacity and was added onto the cell SOC determined by coulomb counting.
Results
The sections below describe the results of charging, discharging and electrolysis tests together with the calculated cell model parameter values.
Cell Voltage
As described above, charging and discharging tests were interrupted in order to measure the internal resistance of the cell. Therefore, the raw voltage measurements over time typically look like those in Figure 3 for a charging test and for a discharge test.
Excluding the interruptions and excluding the period of voltage stabilisation after each interruption test, charge and discharge curves were created. These have been plotted as a function of cumulative charge, for example Figure 4. Some noise appears on the curves, both due to the interruption tests and because in phase 1 the variable resistor required repeated adjustment to achieve constant current.
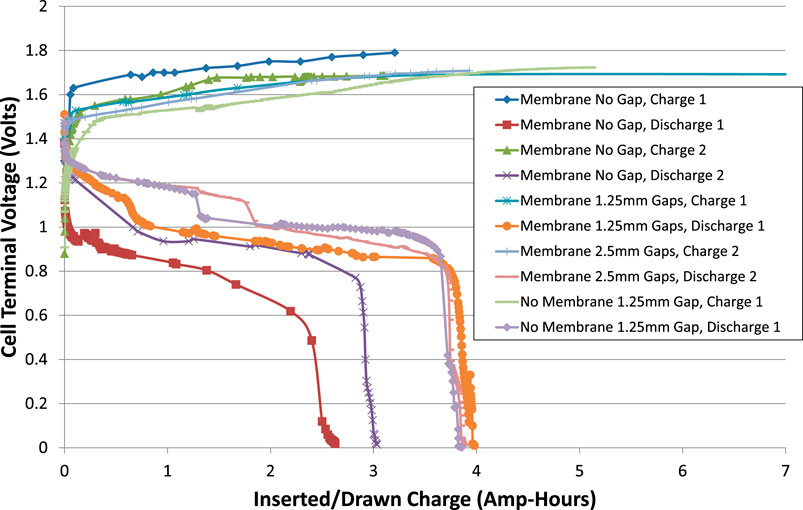
FIGURE 4. Cell voltages during charge and discharge excluding interruptions. The current was ± 0.6 A (C/5 rate) and the cell temperature was room temperature, about 20°C.
It appears that the capacity of the cell increased as it was cycled, and that the actual capacity was greater than the nominal 3 Ah. It can also be seen that the total internal resistance of the cell reduced on second and subsequent cycles.
Open Circuit Voltages
The open-circuit voltages, VOC, were calculated, being the asymptote of each interruption test. VOC is plotted against cumulative cell charge for tests from phase 2 in Figure 5. Phase 1 tests are excluded from Figure 5 because the corrosion of the copper wires may have affected the apparent cell voltage. VOC exhibits some scatter, reflecting uncertainty in the calculation of the asymptote of voltage. Nevertheless, some patterns do emerge:
(1) There is a hysteresis, or difference, between charging VOC and discharging VOC. Either this is a genuine difference that depends on the direction of the most recent current, or the voltage stabilisation takes longer than can be measured in a 5-min interruption test due to internal resistances.
(2) The hysteresis is larger at low SOC than high SOC.
(3) When charging at ambient temperature, VOC is higher than in other tests. However, the cell may not have fully stabilized after being rebuilt. Some discharging tests at ambient temperature were excluded from Figure 5 for this reason.
(4) There is no strong correlation of VOC with temperature.
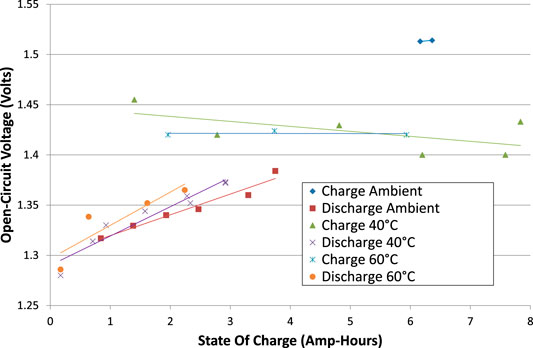
FIGURE 5. Open circuit voltages (VOC) for all tests, comparing charging with discharging, and comparing the effect of cell temperatures.
Ohmic Resistance
The ohmic resistance (R0) of the cell and its electrical connections was calculated from the initial voltage rise, or fall, of an interruption test. For most tests, R0 was about 0.2 Ω. Four observations can be made:
(1) When the SOC is very low, the R0 for discharging is much higher than in other cases, up to 0.8 Ω. This is consistent with the surface area of the active chemical species, iron and nickel oxyhydroxide, being reduced as their abundance is depleted.
(2) When the cell has a membrane but no gap each side of the membrane, R0 is higher than in the other tests, up to values between 0.3 and 0.5 Ω, especially during charging and toward high SOC. This could be because of bubble blinding, where bubbles are trapped against the electrodes and unable to escape by buoyancy. These bubbles obstruct the flow of ions through the electrolyte.
(3) When the cell has a membrane and a gap of 2.5 mm each side, R0 is slightly higher than when the gaps are just 1.25 mm. This is as expected, due to the increased length of the conduction path through the electrolyte.
(4) When the cell had no membrane, R0 was not significantly reduced. The addition of a membrane does not therefore significantly impact on the function of the cell as a battery.
Time Constants and R-C Equivalent Circuit Component Values
When each of the parameters in each test were plotted against SOC, no strong trends were evident except for an increase in resistances at very low SOC; cell construction and temperature made very little difference. Therefore, average values have been given, Table 1. Each parameter was averaged across all interruptions of charging and discharging across all tests of phase 2, excluding very low values of SOC and excluding a few outlying values. The test program did not allow time for long-term cycling of the battery to see how these parameters change over time.
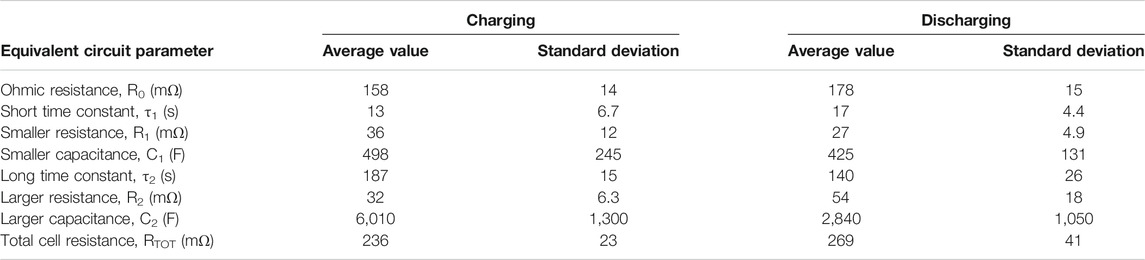
TABLE 1. Time constants of interruption tests and equivalent circuit component values measured in phase 2 with a gap of 1.25 mm on each side of the membrane.
Most parameters of the equivalent circuit exhibit insignificant differences between charging and discharging, but the long time constant, τ2 is slightly larger and the larger capacitance, C2 is significantly larger during charging. This could be because bubbles of gas form inside the electrodes and act as a form of energy storage, causing the cell to temporarily perform as an alkaline fuel cell for a few minutes when the charging current is disconnected.
Cell Capacity
The approximate charge capacity of the cell can be observed from the total ampere-hours delivered in each discharge test at the point of voltage collapse, for example the discharge tests of Figures 3 and 4. However, the time of voltage collapse depends on the discharge current: a slower discharge results in later voltage collapse. Therefore, discharge was continued at very low voltage until the current also dropped to a very low level, approximately 0.1 A, while counting ampere-hours. Since current continued to fall exponentially and asymptotically, Eq. 10 was used to estimate the residual cell capacity at the end of each test. Residual capacity added only a small fraction of total charge, in most cases about 1% of capacity and never more than 3.3%.
At ambient temperatures, the total cell capacity was 3.87 ± 0.2 Ah. At 40°C, the total cell capacity was very similar at 3.79 ± 0.12 Ah. Thus, the observed total cell capacity was about 30% greater than the expected nominal value of 3 Ah, and about 25% greater at the point of voltage collapse, Figure 4. There are various reasons for this. Firstly, the cell becomes conditioned by repeated cycling. Any net oxidation of both electrodes is removed by the liberation of more oxygen than hydrogen over the first few cycles. Secondly, the measured cell capacity included a second plateau of lower voltage where further oxidation of iron electrodes takes place, Eq. 11:
However, the plateau, visible in Figure 3B only adds about 2% to cell capacity. Therefore, the actual cell capacity appears to be larger than nominal. The charging process behaves as a logistic function (Mulder et al., 2017). With the exception of the first two charge-discharge tests carried out, the charge inserted was much greater than the nominal capacity and was continued until the cell voltage had stopped rising, indicating that no more charge was being stored.
At 60°C, the total cell capacity was 2.46 ± 0.04 Ah, which is 18% below nominal capacity and 35% below the capacity at ambient temperature despite the inserted charge being at least as great as in tests at lower temperatures. These observed differences could be due to cell self-discharge and its dependence on both SOC and temperature. At moderate temperatures, self-discharge is slow enough for the cell to temporarily hold a full charge, whereas at elevated temperature the initial self-discharge rate is very high. However, self-discharge tests were not carried out to confirm or refute this theory. Self-discharge does not necessarily result in a high rate of energy loss, since it can result in the release of hydrogen and oxygen gases (Weninger and Mulder, 2019). The production of gases during the charging process was not measured during the long capacity tests, but was measured in the combined charging-electrolysis tests described in Charge Efficiency During Electrolysis Tests, Energy Efficiency During Full Charging and Discharging Cycles, and Energy Efficiency When Electrolysing at Full Charge.
Electrolyser Performance Comparing Different Cell Constructions
Electrolyser tests have been performed at least once with every cell configuration. The maximum current is 10 A, and the working cell area of the cell is 50 cm2, corresponding to a current density of 200 mA/cm2, which is a modest maximum for an electrolyser.
A hysteresis effect was observed: electrolysis voltage is slightly higher when stepping up the voltage than when stepping down, indicating a slightly lower resistance when decreasing voltage and current. Also, when a second, repeated electrolysis test was performed, it usually resulted in higher current at a given voltage than in the first test, indicating a further reduction in resistance. This is due to the action of the self-forming catalysts, nickel oxy-hydroxide in the oxygen evolution reaction and metallic iron in the hydrogen evolution reaction (Mulder et al., 2017) that reduce the overpotential at each electrode. A second test also resulted in less difference between the increasing and decreasing tests. Therefore, where possible, only the second electrolysis test of each cell configuration is presented and compared in subsequent analyses. The increasing and decreasing portions of each electrolysis test were then averaged to minimise hysteresis effects.
Comparing the second electrolysis tests (where available) for all the cell configurations of phase 1, Figure 6, the cell configurations can be ranked in order of performance as an electrolyser.
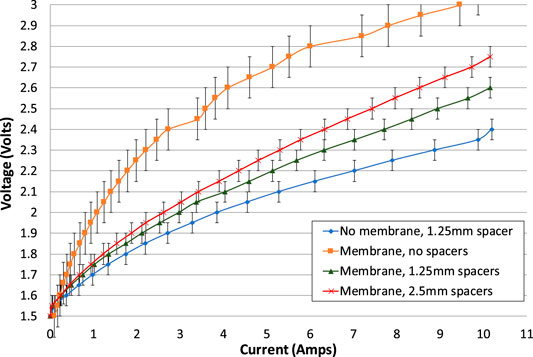
FIGURE 6. Electrolysis tests for all cell configurations of phase 1 testing. The increasing and decreasing portions of the electrolysis tests have been averaged. With the exception of the test of a membrane with no spacers, the second electrolysis test is shown. Error bars added indicate variation in test repeatability.
The cell with no gaps is the worst performing and can be discounted as a realistic option for a battolyser. With no gap on each side of the membrane, the voltage was much higher than other configurations, implying that the internal resistance was consistently higher. Therefore, it is imperative to have at least a small gap on each side of the membrane. It is thought that this is necessary to allow bubbles to escape efficiently, to avoid “bubble blinding.”
The cell with lowest resistance is the one with no membrane and just one spacer, giving a gap of 1.25 mm. This can also be discounted as a realistic option for a battolyser since the membrane is needed to separate hydrogen and oxygen gases. However, the no-membrane case can be used to estimate the electrical resistance of the membrane itself.
When a 1.25 mm spacer on each side of the membrane is compared with a 2.5 mm spacer on each side, the smaller gaps create a cell with a smaller internal resistance. Therefore, for current passing between the electrodes, the effect of reduced resistance of a shorter pathway through the electrolyte more than offsets any increase in bubble blinding due to a smaller gap, even at maximum current density.
The difference between the lines in Figure 6 can be used to estimate the electrolyte resistivity. The lines are almost linear between 4 and 10 A, where the gradients have been calculated as shown in Table 2.
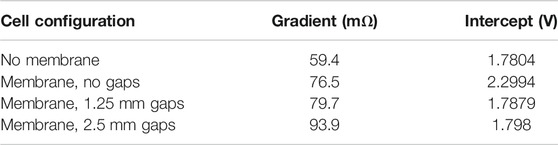
TABLE 2. Gradients and intercepts of electrolysis voltage curves, indicating ohmic resistance and voltage at which significant electrolysis first takes place.
The difference in pathway length through the electrolyte in a cell with a gap of 2.5 mm on each side and that of a cell with a gap of 1.25 mm on each side is a total of L = 2.5 mm, and the increase in resistance, R, is 0.0939 − 0.0797 = 0.0142 Ω. The working area, A, is still approximately 50 cm2, or 0.005 m2.
The conductivity is the inverse of this, 35.2 Sm−1, or 352 mScm−1. This corresponds reasonably well with published results of 550 mScm−1 for 35 wt.% KOH at 25°C (Allebrod et al., 2012).
Given this resistivity, it is possible to estimate the resistance that the no-membrane cell would have had if a membrane were present, as follows:
Resistance of cell with membrane and 1.25 mm gaps = 0.0797 Ω, Thickness of membrane itself = 0.45 mm, Length of pathway through electrolyte in cell with no membrane = 1.25 mm, Length of pathway through electrolyte in cell with membrane is 1.25 + 0.45 + 1.25 = 2.9 mm, Reduction in resistance due to reduced width is 0.0142 × 1.7/2.5 = 0.009656 Ω, Resistance of no-membrane cell if it had a membrane is therefore 0.0797 − 0.009656 = 0.070044 Ω, Actual resistance of no-membrane cell = 0.0594 Ω.
Therefore, added resistance of membrane itself is 0.070044 − 0.0594 = 0.0106 Ω, or just 10.6 mΩ.
Given the 50 cm2 cell area, this equates to a specific resistance of 0.53 Ωcm2 at 20°C, which agrees fairly well with the manufacturer’s stated resistance of 0.3 Ωcm2 for 30 wt.% KOH solution at 30°C.
The added resistance of membrane plus increased cell width is 20.3 mΩ, which is only 8% of average total cell internal resistance, Table 1. The internal resistance is dominated by the resistance within the electrodes themselves and the addition of a membrane is only a small efficiency or power penalty.
Electrolysis at Elevated Temperatures
In phase 2 tests, the cell had a fixed configuration of a membrane and a gap of 1.25 mm on each side. Electrolysis tests were carried out as before, increasing and decreasing the voltage in steps of 0.05 V. Tests were performed at ambient laboratory temperature of approximately 20°C, then 40°C and finally 60°C. At each temperature, electrolysis was repeated, ramping the current and voltage up and down twice.
As before, the increasing and decreasing portions of each electrolysis test have been averaged, and the second electrolysis test is used wherever one was available, Figure 7. The lower voltage gradient in the phase 1 test is due to the lower resistance of its contact wires within the cell. The results show that voltage at a given current is reduced with increasing temperature. To a good approximation, the cell voltage is uniformly reduced by 0.1 V for a temperature increase of 40°C.
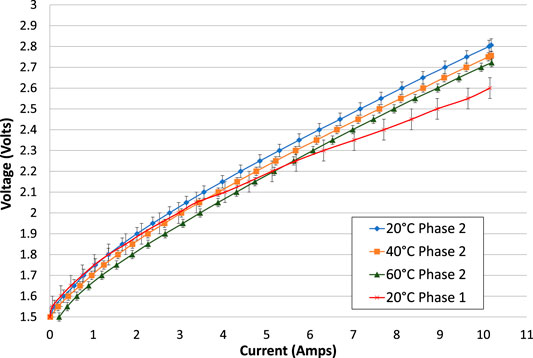
FIGURE 7. Comparison of electrolysis tests at different temperatures and also compared with the equivalent test in phase 1, all with 1.25 mm spacers on each side of the membrane. The increasing and decreasing portions of the electrolysis tests have been averaged. With the exception of the 60°C test, the second (repeated) electrolysis test is shown.
The cell was rebuilt between phase 1 and phase 2 testing, with a new lid for gas collection and new electrical connections to the electrodes. The new electrical connections are expected to have some effect on the ohmic resistance of the cell. In phase 1, the electrode connectors were stranded copper wires that became corroded where they were exposed to the potassium hydroxide electrolyte. The wires were clamped onto the electrode with nylon nuts and bolts. The surface connection resistance may have been poor but the electrical conductivity of the wires themselves was good. Each wire had a measured resistance of 0.01 Ω. In total, the connections to both electrodes are therefore estimated to have a total resistance of at least 0.02 Ω.
In phase 2, the electrode connectors were solid stainless steel, each with a length of about 200 mm and diameter of 3 mm. The resistivities of stainless steels are between 69 and 80 μΩ-cm, (AZOMaterials, 2018; Ugur, 2018; California Fine Wire Co, 2020). Using a typical value of 75 μΩ-cm, the resistance of each wire would be 0.021 Ω, and the total resistance added to the cell would be 0.042 Ω, which is slightly larger than in phase 1. A back-to-back comparison of the electrolysis current-voltage characteristics of the cell in phase 1 and phase 2 at ambient temperature is shown in Figure 7.
The phase 2 cell obviously has a higher internal resistance, resulting in a higher gradient of voltage vs. current. In Figure 7, the cell voltage at a current of 10 A is about 0.2 V higher in phase 2 than in phase 1, indicating an apparent increase in resistance of 0.02 Ω. This is consistent with the calculated increase in resistance that should result from swapping from copper wires to stainless steel wires, and within the margin of experimental error.
The design of the experimental cell included wires to the base of each electrode so that the electrical connection did not have to pass through the gas collection pockets. Further research and design work are required to achieve a multi-cell stack with minimal electrical resistance between cells.
Gas Production Rates
The total gas production rates were measured for some of the electrolysis tests. There was too much gas cross-over from oxygen to hydrogen or vice versa to measure the volume of each gas independently, but the total gas volume was successfully measured. One important reason for the gas cross-over was the insufficient depth of gas collection pockets at the top of the cell, as the proportion of gas emerging from each of the tubes was dependent on small changes to the depth of submersion in the water collection bath. The overall sealing of the cell was also inadequate for very accurate gas volume measurements, given that some bubbles were often observed emerging from the edges of the cell lid and around the temperature probe. Lessons are learned for future cell design, including problems of electrolyte frothing at high gas production rates.
Nevertheless, total gas volumes from both collection cylinders were measured, added together and converted into the number of moles of gas using measured temperature and known atmospheric pressure on the day (Time and Date AS, 2020). The gas volume was adjusted for humidity, assuming 100% relative humidity at the temperature of the water bath (TLV A Steam Specialist Company, 2020).
To investigate the effect of SOC, some electrolysis tests took place when the cell was fully charged, whereas others took place when the cell was almost completely discharged. When the cell was fully charged, it was expected that all electrical charge would be used to make hydrogen and oxygen, but when the cell was charged rapidly from empty, the charge is divided between charging the cell and producing gases, both of which were measured.
The measured total gas production rates depended mainly on the cell voltage, regardless of the SOC, Figure 8. Gas production is negligible below a cell voltage of 1.5 V.
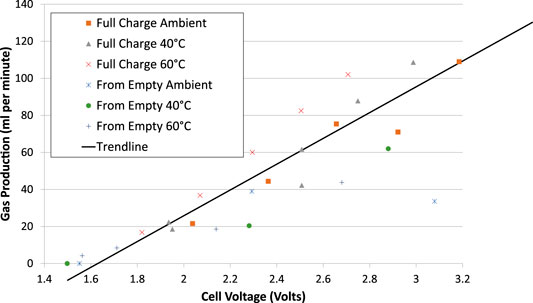
FIGURE 8. Electrolysis total gas production rates vs. cell voltage averaged over the test. Cells had 1.25 mm spacers each side of the membrane.
There is some evidence suggesting that gas production rates are higher when the cell is fully charged than when it is empty, but the data was only sufficient to show this effect at elevated temperatures, and the effect is secondary to the voltage.
Charge Efficiency During Electrolysis Tests
The charge balances of all the electrolysis tests are shown in Figures 9 and 10. They show the charge balance of electrolysis tests in units of millimoles of electrons in, and millimoles of electrons used in gas production, according to the overall chemical equation for electrolysis.
Using the stoichiometry, Equation 11, each 3 mol of gas requires 4 mol of electrons to make it. If the electrical charges were fully accounted for, the “charge input” and “gas output” bars of Figure 9 would be equal in height for each test. However, in practice the measured charge efficiency (Faraday efficiency) is quite variable and usually less than 100%. When starting from a full cell, the charge efficiency varies between 73% and 107% with an average of 87%. Apart from measurement error and gas leakage, possible sources of difference include temporary over-charging of the cell and leakage current.
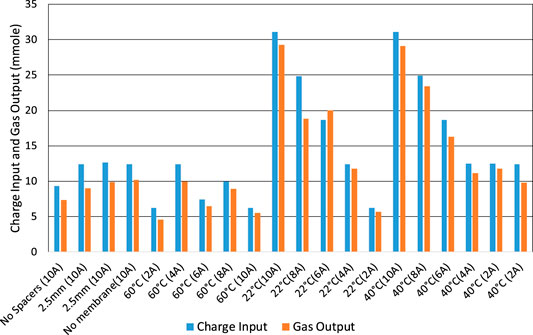
FIGURE 9. Electrolysis tests starting with a fully charged cell. Charge input and equivalent gas output in terms of effective charge used and at different charge rates.
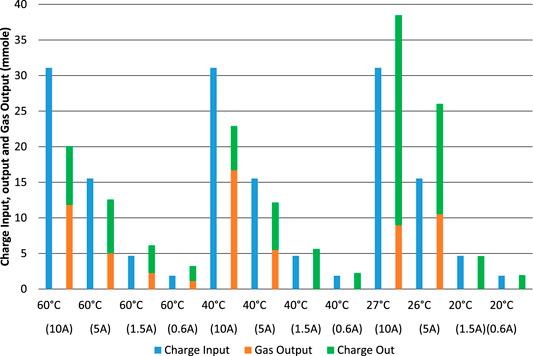
FIGURE 10. Electrolysis tests starting with an almost-empty cell. Charge input, charge output and equivalent gas output in terms of effective charge used and at different charge and discharge rates.
When starting with an almost-empty cell, Figure 10, the sum of “gas output” and “charge out” should be equal to the preceding “charge input” for each test, if all charge were accounted for. However, the charge efficiency is even more variable for these tests, with a minimum of 65%, a maximum of 174% and an average of 112%. In these tests, apart from all the sources of error and difference measured above, it is also difficult to know if the cell returned to the same SOC at the end of the experiment as it was at the beginning. The most commonly used methods for estimating SOC in other batteries (Zeng et al., 2018; Zhang R et al., 2018) are not available for our Ni-Fe cell. Considering each possible method in turn: Ampere-hour counting is an output of this experiment, not an input that can be used to determine SOC; VOC is too variable to be used and the time constants associated with the cell are too long; The internal impedances do not exhibit any clear relationship with SOC; An electrochemical model is not available; The equivalent circuit model does not show clear relationships with SOC; Kalman filter algorithms are not available for this cell. Upon disconnection of a load, VOC slowly returns to a plateau at about 0.7 V, and then another plateau at 1.2 V. The characteristics of the battery are not well enough known for impedance spectroscopy or modeling methods to be used. The method of estimation of residual charge described by Eq. 10 makes the reasonable assumption that short-circuit current is proportional to residual charge but may not be accurate enough.
From the charge stored in the cell when performing a short electrolysis/charge test from an almost-empty state, it appears that there is a maximum rate-of-charge for the Ni-Fe cell. Excluding tests where the charge output exceeded the charge input, and therefore focusing on tests at 40 and 60°C, it is possible to divide the charge output by the duration of the charging test to calculate an effective charging current as a function of average cell voltage, Figure 11. It appears that the maximum charge rate is limited to about 2.5 A, corresponding to 50 mAcm−2, no matter how high the voltage or the electrolysis current is. That is a charge rate of just under 1C in this 3 Ah cell.
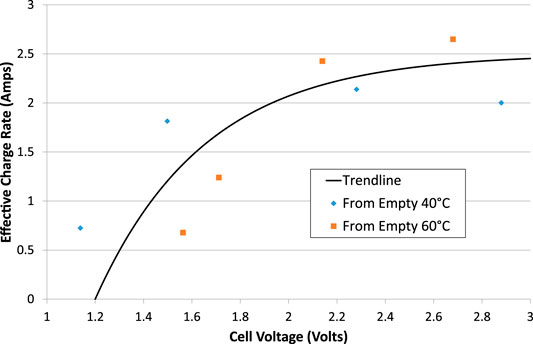
FIGURE 11. Effective charge rate during electrolysis tests that start with an empty cell. Asymptotic trend line added.
Energy Efficiency During Full Charging and Discharging Cycles
During the long charge and discharge cycles, the overall energy balance is impossible to establish since the gas volumes were not measured. As seen above, as the cell approaches a fully charged state, the rate of electrolysis increases but the chemical energy associated with the hydrogen gas was not accounted for during the long charging tests. The plateau voltages, Figures 3 and 4, show the cell charging at between 1.5 and 1.8 V, then discharging between 1.3 and 0.7 V. The electrical energy efficiency was therefore about 70% when charged and discharged at 0.6 A (12 mA/cm2) and closer to 40% when charged and discharged at 1.5 A (30 mA/cm2) but these figures include the large resistances of contact wires inside the cell. the efficiency penalty due to addition of the membrane is estimated to be up to 10%. Therefore, the battolyser’s performance as a battery is compromised.
Energy Efficiency When Electrolysing at Full Charge
The higher heating value (HHV) of the chemical energy in the hydrogen gas produced has been compared with electrical energy input and integrated over the time duration of the tests, Figures 12 and 13. When starting from a fully-charged cell, Figure 12, the energy efficiency may be as high as 70% when the current is only 2 A and the cell voltage is only 1.9 V, but is less than 40% when the current is up to 10 A and the voltage is up to 3 V. The main cause of low efficiency is, again, high cell voltage, which again includes the voltage drop in the wires inside the cell of up to 0.4 V.
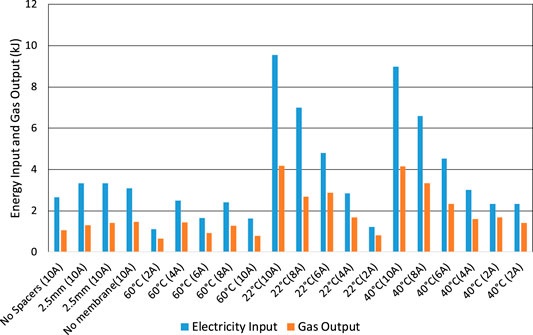
FIGURE 12. Electrolysis tests starting with a fully charged cell. Electrical energy input compared to calorific heat energy of gas output (HHV).
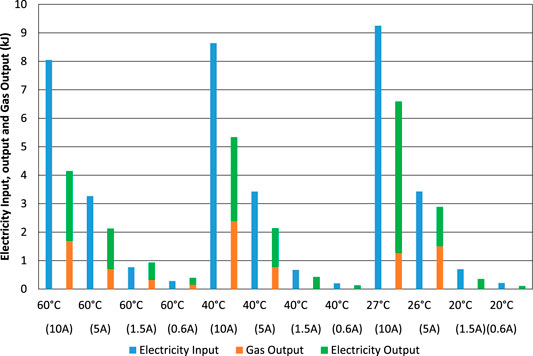
FIGURE 13. Electrolysis tests starting with an almost-empty cell. Electrical energy input compared to calorific heat energy of gas output (HHV) and electrical energy output.
When starting from an almost-empty cell, Figure 13, the energy efficiency is again much lower than the charge efficiency, Figure 10, due to the high voltage during electrolysis, especially when the current is as high as 10 A with an associated high cell voltage of up to 3 V including the resistance of wires inside the cell.
Discussion
The high internal resistances of the cell, Table 1, and hysteresis of VOC, Figure 5, result in poor voltage efficiency. When the charge and discharge rate is C/5, the stabilized terminal voltages are typically 1.6 and 1.2 V respectively, resulting in a voltage efficiency of 75%. When the charge and discharge rate is C/2, the stabilized terminal voltages are typically 1.82 and 0.98 V respectively, resulting in a voltage efficiency of 54%. These voltage efficiencies are similar to but slightly lower than those observed by Mulder et al. (2017). Side reactions and poorer performance at very high or low SOC reduce electrical efficiency still further. In any case, the maximum charge rate is limited to less than 1C, Figure 11. The role of Ni-Fe batteries in electricity systems is therefore primarily for long duration storage, diurnal cycling rather than peak lopping for example.
The present experiments used only one pair of electrodes whereas a battery uses a stack of interleaved electrodes. The present experiments also added a membrane and increased the conduction path length. The relatively small increases in resistance caused by these changes, Table 2, indicate that the high internal resistance are intrinsic to the chemistry of Ni-Fe cells and that the present changes make only a small compromise to the performance of a Ni-Fe battolyser as a battery.
As an electrolyser, the energy efficiency is also relatively low at typically 50%, Figure 12. Given the thermo-neutral voltage of electrolysis at ambient pressure and temperature of 1.48 V (Mori et al., 2013), the voltage efficiency at a current density of 200 mA/cm2 and 60°C is just 55% Figure 7. The measured current density at an efficiency of 70% (or 2.11 V) is just 83 mA/cm2 compared to 500 mA/cm2 for alkaline electrolysers and 2000 mA/cm2 for PEM electrolysers (Ayers et al., 2010). The electrolysis efficiency of 80% at a current density of 100 mA/cm2 measured by Mulder et al. (2017) is slightly higher than the present result but still lower than commercial electrolysers.
Given the proposed application of using surplus renewable electricity at low capacity factors, low cost and durability are more important than efficiency. The United Kingdom retail price of Ni-Fe batteries is £440/kWh, which is lower than other batteries of long cycle life such as lithium titanate or lithium iron phosphate (Bimble Solar Ltd., 2020) but higher than deep-cycle lead acid batteries, which have shorter cycle life. The example current density of 83 mA/cm2 is equivalent to a battery charge rate of 1.4C in the tested two-electrode cell, or 2.8C if many electrodes are interleaved in a stack and operated as double-sided electrodes. If a thermal efficiency of 70% is expected, then capital cost per kW as an electrolyser is comparable or lower than that of commercial electrolysers but excludes the cost of gas collection and compression. If a lower efficiency is tolerated, then the capital cost of the stack on its own can be lower.
Further research is required to optimize the Ni-Fe battolyser for its dual role:
• Long cycle-life testing is required to establish the durability of a Ni-Fe battolyser as repeated overcharging is known to change the crystal structure of the positive electrode (Shukla et al., 1994). Damage to electrodes and partial disintegration of the electrode materials was observed but the cause was unknown.
• Existing Ni-Fe electrodes are designed to minimise hydrogen and oxygen evolution. The battolyser may therefore benefit from a different formulation of electrodes and surface coatings to enhance gas production.
• The gas collection system and balance of plant need to be engineered to be affordable yet durable.
Conclusions
The tests confirm that a Ni-Fe cell can be used as a battery-electrolyser or battolyser. It can be used for both storage of electrical energy and hydrogen production as a Power-to-X sustainable fuel.
An equivalent circuit model of a Ni-Fe cell has been constructed from interruption tests conducted during charging and discharging of the experimental cell, with approximate values of equivalent circuit components. The equivalent circuit has two R-C loops. The shorter time constant is approximately 15 s in either charging or discharging but the longer time constant is 187 s during charging and 140 s during discharging. The open-circuit voltage exhibits a hysteresis effect, depending on whether the cell is charging or discharging, especially at low states-of-charge. Alternatively, this may be evidence of an even longer time required for cell voltage stabilisation.
The total cell capacity is confirmed to be greater than the nominal cell capacity by approximately 25%. To make use of this extra capacity, the cell has to be overcharged for a significant period of time and may need to be discharged immediately after charging to avoid loss of energy by self-discharge.
Results are consistent with the Ni-Fe cell having a high self-discharge rate, and that self-discharge is increased at elevated temperature.
The bubble separation membrane increases the cell’s internal resistance by 0.53 Ω cm2 at 20°C, which is consistent with the membrane manufacturer’s specifications. Together with the required increase in separation between electrodes, the addition of a membrane results in an increase in cell resistance during electrolysis of 34%. The increase in total internal resistance of the cell as a store of electricity is only 8%. The electrical performance of a Ni-Fe battolyser is therefore almost as good as a Ni-Fe battery.
Elevated temperature reduces the measured cell capacity by a modest amount, but also reduces the voltage at which electrolysis takes place, thereby improving the efficiency of electrolysis.
There is an optimum separation gap between the cell electrodes and each side of the bubble separation membrane. This should be large enough to avoid “bubble blinding” but small enough that the extra electrolyte layer does not increase internal resistances significantly. In the cell studied, the best results were observed with gaps of 1.25 mm or 2% of cell height.
There appears to be a maximum cell charge rate of the order of 50 mA cm−2, regardless of the cell voltage.
Ni-Fe batteries appear to be a good choice for electricity storage in off-grid microgrids powered by intermittent renewable energy, especially where long battery life is required at elevated ambient temperatures. Ni-Fe battolysers appear to be a cost-effective technology of providing hydrogen for other energy uses and longer-term energy storage, provided they can be manufactured in a low-cost yet robust way.
Data Availability Statement
The datasets generated for this study are available on request to the corresponding author.
Author Contributions
JB and RG contributed conception and methodology of the experiments; RG secured funding, supervised and administered the project; AR and JB assembled the laboratory equipment and performed the experiments; AR organized the database of results; JB wrote the first draft of the manuscript; JB, RG and AR contributed to manuscript revision, read and approved the submitted version.
Funding
This research was funded by HEIF (grant HE0010 - 15.A.7HU) and by the Modern Energy Cooking Services (MECS) project, UK Foreign, Commonwealth and Development Office (FCDO) (IATI Identifier: GB-GOV-1-300123).
Conflict of Interest
The authors declare that the research was conducted in the absence of any commercial or financial relationships that could be construed as a potential conflict of interest.
Acknowledgments
The authors would like to thank colleagues at De Montfort University for their help in this study. Special thanks go to the mechanical engineering workshop for use of machining equipment, electrical engineering workshop for loan of test equipment, the materials design department for 3D printed parts, and the chemistry department for the loan of laboratory equipment. The authors would also like to thank Dr Richard Blanchard, Head of Renewable Energy for Development Group, and Dr Murray Thomson, Senior Lecturer in Electrical Networks and Systems, at CREST, Loughborough University for enabling the publication of this paper.
Supplementary Material
The Supplementary Material for this article can be found online at: https://www.frontiersin.org/articles/10.3389/fenrg.2020.509052/full#supplementary-material
Glossary
A1, A2 Volts Scale factors of exponential terms associated with the RC networks of the equivalent circuit
A3 Amps Scale factor of exponential decay of residual current
C/5, C/2, 1C hour−1 Hourly charge or discharge rate of the cell
C1, C2, F Polarisation capacitances of the RC networks of the equivalent circuit
mΩ Ohmic resistance
Ni-Fe Nickel-iron
R1, R2, mΩ Polarisation resistances of the RC networks of the equivalent circuit
RTOT, mΩ Total resistance of the cell. RTOT = R0 + R1 + R2
SOC, % State Of Charge of batteries or cells
V1, V2, Volts Voltages of the RC networks of the equivalent circuit
VOC, Volt Open Circuit Voltage
τ1, τ2, seconds Time constants of the RC networks of the equivalent circuit
τ3, seconds Time constant of exponential decay of residual current
References
Allebrod, F., Chatzichristodoulou, C., Mollerup, P. L., and Mogensen, M. B. (2012). Electrical conductivity measurements of aqueous and immobilized potassium hydroxide. Int. J. Hydrogen Energy. 37, 16505–16514. doi:10.1016/j.ijhydene.2012.02.088
Ayers, K. E., Anderson, E. B., Capuano, C., Carter, B., Dalton, L., Hanlon, G., et al. (2010). Research advances towards low cost, high efficiency PEM electrolysis. ECS Trans. 33 (1), 3–15. doi:10.1149/1.3484496
AZOMaterials (2018). Stainless steel - grade 316 (UNS S31600). Available at: https://www.azom.com/properties.aspx?ArticleID=863 (Accessed March 9, 2018).
Bimble Solar Ltd. (2020). Bimble solar. Available at: https://www.bimblesolar.com/batteries/nifebatteries (Accessed October 5, 2020).
Borgschulte, A. (2016). The hydrogen grand challenge. Front. Energy Res. 4 (11). doi:10.3389/fenrg.2016.00011 | .
California Fine Wire Co. (2020). Stainless steel 308 material #: 100193. Avilable at: http://www.calfinewire.com/datasheets/100193-stainlesssteel308.html (Accessed September 30, 2020).
Chakkaravarthy, C., Periasamy, P., Jegannathan, S., and Vasu, K. I. (1991). The nickel/iron battery. J. Power Sources. 35 (1), 21–35. doi:10.1016/0378-7753(91)80002-f | .
Crossland, A. F., Anuta, O. H., and Wade, N. S. (2015). A socio-technical approach to increasing the battery lifetime of off-grid photovoltaic systems applied to a case study in Rwanda. Renew. Energy. 83, 30–40. doi:10.1016/j.renene.2015.04.020 | .
Danish Energy Management (2019). Batteries - a key constraint for off-grid solar. Available at: https://www.dem.dk/wp-content/uploads/2019/11/Discussion-paper-05_Batteries.pdf (Accessed September 30, 2020).
Dougherty, B. J., Tanzella, F. L., I International, S. R., Ave, R., and Park, M. (1995). “Some nickel -iron, and nickel - metal hydride, cell cycling results,” in Proceedings of the tenth annual battery conference on applications and advances. Long Beach, CA: IEEE, 199–205. doi:https://doi.org/10.1109/BCAA.1995.398538 | .
Ecker, M., Nieto, N., Käbitz, S., Schmalstieg, J., Blanke, H., Warnecke, A., et al. (2014). Calendar and cycle life study of Li(NiMnCo)O2-based 18650 lithium-ion batteries. J. Power Sources. 248 (15), 839–851. doi:10.1016/j.jpowsour.2013.09.143 | .
Gaffor, S. A., Haripraksh, B., and Shukla, A. K. (2010). “Nickel-iron battery-based electrochemical energy storage systems for rural/remote area telecommunication,” in INTELEC, international telecommunications energy conference (proceedings), Orlando, FL: IEEE, 1–6. doi:10.1109/INTLEC.2010.5525702
Hariprakash, B., Martha, S. K., Hegde, M. S., and Shukla, A. K. (2005). A sealed, starved-electrolyte nickel-iron battery. J. Appl. Electrochem. 35, 27–32. doi:10.1007/s10800-004-2052-y | .
Hydrogenics (2020). Electrolysis. Available at: https://www.hydrogenics.com/technology-resources/hydrogen-technology/electrolysis/ (Accessed March 19, 2020).
Innovation Energie Développement (IED) (2013). Identifying the gaps and building the evidence base on low carbon mini-grids final. Francheville. Available at: https://www.gov.uk/dfid-research-outputs/support-study-for-dfid-low-carbon-mini-grids-identifying-the-gaps-and-building-the-evidence-base-on-low-carbon-mini-grids-final-report (Accessed November 10, 2020).
Keçebaş, A., Kayfeci, M., and Bayat, M. (2019). “Alkaline electrolyzer,” in Solar hydrogen production: processes, systems and technologies. Editors F. Calise, M. Dentice D’Accadia, M. Santarelli, A. Lanzini, , and D. Ferrero, 1st Edition. Elsevier Academic Press, 586. Available at: https://www.sciencedirect.com/topics/engineering/alkaline-water-electrolysis.
Kong, D., Wang, Y., Huang, S., Zhang, B., Lim, Y. V., Sim, G. J., et al. (2020). “3D printed compressible quasi-solid-state nickel-iron battery.” ACS Nano. 14 (8), 9675–9686. doi:10.1021/acsnano.0c01157.
Mori, M., Mržljak, T., Drobnič, B., and Sekavčnik, M. (2013). Integral characteristics of hydrogen production in alkaline electrolysers. Strojniski Vestnik/J. Mech. Eng. 59 (10), 585–594. doi:10.5545/sv-jme.2012.858.
Mulder, F. M., Weninger, B. M. H., Middelkoop, J., Ooms, F. G. B., and Schreuders, H. (2017). Efficient electricity storage with a battolyser, an integrated Ni-Fe battery and electrolyser. Energy Environ. Sci. 10 (3), 756–764. doi:10.1039/c6ee02923j | .
Mulder, F., and Weninger, B. (2016). Hybrid battery and electrolyser. US10297890B2. Issued 2016. Available at: https://patents.google.com/patent/US10297890B2/en.
NEL Hydrogen (2020). Atmospheric alkaline electrolyser. Available at: https://nelhydrogen.com/product/atmospheric-alkaline-electrolyser-a-series/ (Accessed March 19, 2020).
Ruetschi, P. (2004). Aging mechanisms and service life of lead-acid batteries. J. Power Sources. 127 (1–2), 33–44. doi:10.1016/j.jpowsour.2003.09.052 | .
Shukla, A. K., Ravikumar, M. K., and Balasubramanian, T. S. (1994). Nickel/iron batteries. J. Power Sources. 51, 29–36. doi:10.1016/0378-7753(94)01953-3 | .
Soutar, I. (2018). The Edison nickel iron cell. Available at: http://www.nickel-iron-battery.com/ (Accessed October 11, 2018).
Stroe, D.-I., Swierczynski, M., Stroe, A.-I., and Knudsen Kær, S. (2016). Generalized characterization methodology for performance modelling of lithium-ion batteries. Batteries 2 (4), 37. doi:10.3390/batteries2040037 | .
Tian, Y., Xia, B., Wang, M., Sun, W., and Xu, Z. (2014). Comparison study on two model-based adaptive algorithms for SOC estimation of lithium-ion batteries in electric vehicles. Energies 7 (12), 8446–8464. doi:10.3390/en7128446 | .
Time and Date AS (2020). Past weather in Leicester, England, United Kingdom. Available at: https://www.timeanddate.com/weather/uk/leicester/historic (Accessed September 30, 2020).
TLV A Steam Specialist Company (2020). Calculator: saturated steam table by temperature. Available at: https://www.tlv.com/global/UK/calculator/ (Accessed September 30, 2020).
Ugur, U. (2018). “Resistivity of steel,” in The physics factbook. Brooklyn, NY: Glenn Elert is Science Research Coordinator, Midwood High School. Available at: https://hypertextbook.com/facts/2006/UmranUgur.shtml (Accessed March 9, 2018).
United Nations (2019). “Sustainable development goals,” in Sustainable development goals knowledge platform. New York, NY: UN Department of Economic and Social Affairs (UNDESA). Available at: https://sustainabledevelopment.un.org/?menu=1300.
Wang, H., Liang, Y., Gong, M., Li, Y., Chang, W., Tyler, M., et al. (2012). An ultrafast nickel-iron battery from strongly coupled inorganic nanoparticle/nanocarbon hybrid materials. Nat. Commun. 3 (917). doi:10.1038/ncomms1921.
Weninger, B. M. H., and Mulder, F. M. (2019). Renewable hydrogen and electricity dispatch with multiple Ni-Fe electrode storage. ACS Energy Lett. 4 (2), 567–571. doi:10.1021/acsenergylett.8b02488.
Wiemann, M., Rolland, S., and Guido, G. (2011). Hybrid mini-grids for rural electrification: lessons learned. Brussels, Belgium. Brussels, Belgium: Alliance for Rural Electrification Available at: https://www.ruralelec.org/sites/default/files/hybrid_mini-grids_for_rural_electrification_2014.pdf.
Zeng, Z., Tian, J., Dong, L., and Tian, Y. (2018). An online state of charge estimation algorithm for lithium-ion batteries using an improved adaptive cubature kalman filter. Energies 11 (1), 59. doi:10.3390/en11010059 | .
Zhang, C., Allafi, W., Dinh, Q., Ascencio, P., and Marco, J. (2018). Online estimation of battery equivalent circuit model parameters and state of charge using decoupled least squares technique. Energy 142 (1), 678–688. doi:10.1016/j.energy.2017.10.043 | .
Keywords: nickel-iron battery, hydrogen, battolyser, electrolysis, Edison cell, equivalent circuit model
Citation: Barton JP, Gammon RJL and Rahil A (2020) Characterisation of a Nickel-iron Battolyser, an Integrated Battery and Electrolyser. Front. Energy Res. 8:509052. doi: 10.3389/fenrg.2020.509052
Received: 31 October 2019; Accepted: 26 October 2020;
Published: 26 November 2020.
Edited by:
Valerie Eveloy, Khalifa University,United Arab EmiratesReviewed by:
Mariano Martín, University of Salamanca, SpainSurendra Kumar Martha, Indian Institute of Technology Hyderabad, India
Copyright © 2020 Barton, Gammon and Rahil. This is an open-access article distributed under the terms of the Creative Commons Attribution License (CC BY). The use, distribution or reproduction in other forums is permitted, provided the original author(s) and the copyright owner(s) are credited and that the original publication in this journal is cited, in accordance with accepted academic practice. No use, distribution or reproduction is permitted which does not comply with these terms.
*Correspondence: John Barton, ai5wLmJhcnRvbkBsYm9yby5hYy51aw==