 Jun Li
 Di Fang1
 Mingjun Wang
 Wenxi Tian
 G. H. Su
- 1School of Nuclear Science and Technology, Shaanxi Key Laboratory of Advanced Nuclear Energy and Technology, State Key Laboratory of Multiphase Flow in Power Engineering, Xi’an Jiaotong University, Xi’an, China
- 2Science and Technology on Reactor System Design Technology Laboratory, Nuclear Power Institute of China, Chengdu, China
The concept of wire-wrapped assembly has been widely adopted in liquid metal-cooled reactors to enhance the capability of flow and heat transfer. The detailed 3D thermal hydraulic behaviors of liquid metal in the wire-wrapped assembly directly affect the safety of the reactor. In the present work, a numerical study on a 19-pin wire-wrapped assembly cooled by a lead-bismuth eutectic was carried out using the CFD method. The geometrical model is referred to in the test section in KIT’s 19-pin experiments, which is a scaled test assembly based on the MYRRHA reactor. The established CFD model was validated against experimental data and results showed that the SST k-ω model accompanied with the modified Prt was appropriate for the current problem. Then the numerical models were extensively used in the modeling of the blocked assembly flow with a cylindrical blockage. Also, the influences of blockage longitude, position, and porosity on the thermal hydraulic characteristics in the assembly were evaluated in detail. This work is meaningful for the deep understanding of safety features under the condition of assembly blockage operation in LFRs.
1. Introduction
For the sake of decreasing the emission of greenhouse gases and improving the intrinsic safety of nuclear reactors, the concept of liquid metal reactors has garnered more interest in recent years. Fast reactors have been incorporated into the GEN-IV nuclear energy system. Among various kinds of fast reactors, the lead or lead-bismuth eutectic (LBE)-cooled reactor is regarded as one of the most promising next-generation nuclear energy systems and has already been put onto the schedule for practical usage. Consequently, a variety of designs have sprung up around the world, like SVBR (Zrodnikov et al., 2011), MYRRHA (Abderrahim et al., 2001; Biarrotte et al., 2010), CLEAR (Wu, 2016a; Wu, 2016b), ALFRED (Damiani et al., 2014; Frogheri et al., 2013; Frignani et al., 2019a; Frignani et al., 2019b), etc.,
The thermal-hydraulic phenomenon in liquid metal fast reactors has recently attracted attention. Particularly, the numerical method has been widely adopted due to its higher efficiency and cost-effectiveness compared with the experimental method. Yu et al. (Yu et al., 2015) proposed a two-region porous-medium model for predicting the temperature profile on the duct wall, with the existence of inter-wrapper flow (IWF). Similarly, Wang et al. (Wang et al., 2019b) put forward a modified model with coarse mesh for a three-assembly system with IWF, based on the 61-pin assembly in Chinese experimental fast reactors. Vanderhaegen et al. (Qin et al., 2019) modeled the core and hot pool of MYRRHA, and the fuel bundles, heat exchangers, and pumps were simplified with the porous-medium model. Similarly, Wang et al. (Wang et al., 2020) contributed a full-scale numerical model based on the porous-medium model for the Monju reactor (SFR). Steady-state and transient analyses on the thermal-stratification phenomenon in the upper plenum were performed.
Coarse-mesh methodology is no longer sufficient in calculation at the subassembly level, and various methods for solving the N-S equations (DNS, LES, and RANS) can be found in open literature. The validation and calculations for benchmarks are widely implemented in different kinds of assemblies. The objects of experiments and simulations include a wire-wrapped annulus (Qin et al., 2019), 7- (Merzari et al., 2016), 19- (Pacio et al., 2016; Piazza et al., 2016; Pacio et al., 2017), 61- (Nguyen et al., 2017; Chen et al., 2018; Goth et al., 2018a; Goth et al., 2018b; Nguyen et al., 2018), and 127-pin assemblies (Kennedy et al., 2015), and for detailed outcomes, readers can refer to the paper by Roelof (Roelofs et al., 2019b) which makes key conclusions on these numeric practices. Among these studies, a variety of numerical results have confirmed the feasibility of the RANS models in simulating the turbulent heat transfer of liquid-metal coolants. Although RANS models cannot predict the local characteristics in the flow field (especially in the vicinity of the wire) to a satisfactory accuracy, as Merzari et al. (Merzari et al., 2016) pointed out, so far the RANS is still sufficient and effective in calculation at the assembly level.
During the design and safety analyses of liquid metal fast reactors, a series of issues at the assembly level still need to be addressed (Roelofs et al., 2019a; Zhang et al., 2020), and it is a fact that most of the current numerical studies focus on the normally operated subassemblies. However, the off-normal conditions also deserve great attention. One of the typical off-normal conditions is a blockage accident, which can be caused by the accumulation of corrosive products in the fuel assembly (Zhang et al., 2020). Blockage accidents in LFRs may threaten the safety of reactors, leading to fuel assembly damage or melt. Therefore, the thermal-hydraulic characteristics in LFRs under off-normal conditions (partially or completely blocked fuel assembly) should be paid more attention to. Pacio et al. (Pacio et al., 2018) focused on the local heat transfer of internal blockages in fuel assemblies with wire spacers in the European MAXSIMA project. Rasu et al. (Rasu et al., 2014) investigated the effects of porous blockages with a 19-pin bundle cooled by sodium. More factors of the blockage are taken into consideration, such as the porosity, size, and radial location. In addition to correctly modeling the geometry of wire-wrapped subassemblies, Sakar et al. (Sarkar et al., 2019; Sarkar et al., 2020) developed the porous-medium simplification method based on the non-Darcy theory for saving computational cost efficiently. In the simulations, both the natural convection under an instantaneous blockage and the forced convection with sub-channels partially blocked were modeled. Piazza et al. (Piazza et al., 2014) modeled a partial blockage in a lead-cooled bundle under different blockage ratios with URANS, and the results show that a higher cladding temperature is induced by a larger area of blockage under the same boundary conditions. Chai et al. (Chai et al., 2019) investigated the internal blockages in a subassembly with wire spacers numerically under the conditions with different positions and longitudes.
In summary, the thermal hydraulic characteristics in fuel assemblies with wire spacers cooled by LBE under the non-normal conditions should be paid more attention to. In the present study, the flow and heat transfer features in a 19-pin wire-wrapped fuel assembly are numerically studied with a RANS model. The geometric and mesh models for the 19-pin bundle are described, and the numerical methods and algorithms adopted are introduced. Then the validation between simulation and experiments is performed. Finally, the accidental scenario of partial blockage at the inlet is outlined and investigated.
2. Geometric and Mesh Models
2.1. The Geometric Model
A series of experiments related to the LBE flow and heat transfer study have been conducted by the KALLA Laboratory (Karlsruhe Institute of Technology, Germany). The experiments performed by Pacio et al. cover the assemblies with different spacer types, including the grid spacer (Pacio et al., 2014) and the wire-wrapped spacer (Pacio et al., 2016; Pacio et al., 2017). As for the geometric model in the current study, it fully refers to the wire-wrapped test section, which is a scaled model from the real MYRRHA subassembly. Specifically, the tested assembly contains 19 rods fixed in a triangle arrangement, and it is divided into three parts: the developing region upstream of the inlet with a length of 824 mm, the heated zone representing the active region in the real core with a length of 870 mm, and the outlet region with a length of 535 mm (Pacio et al., 2016). More details about the geometric scales of assembly are presented in Figure 1 and Table 1. Additionally, in the current simulation, the geometric model is simplified to save computational cost with necessary accuracy. A shorter developing region (328 mm, one wire pitch) is adopted, and the outlet region is not considered in the final domain. Moreover, wires are prepared and embedded in the rods and smoothed, and a gap of 0.1 mm (Merzari et al., 2010; Ranjan et al., 2010) is kept between the wire-pin assembly and the other rods, to avoid direct contact. Finally, a geometric model of the assembly with a total length of 1,198 mm is established.
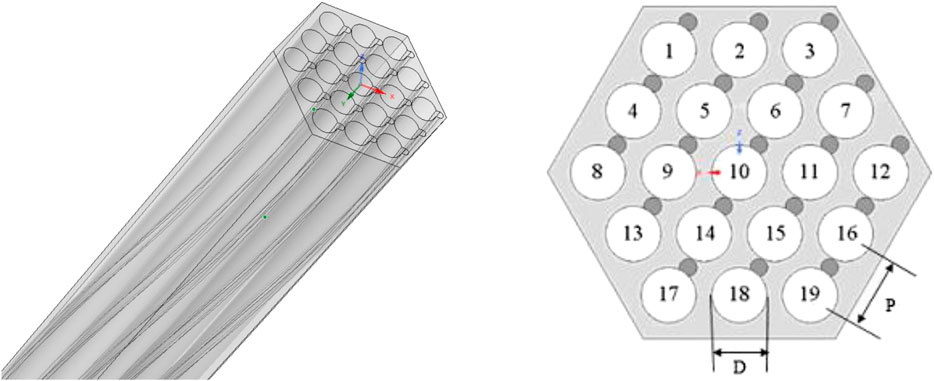
FIGURE 1. The three dimensional model of the computational domain.
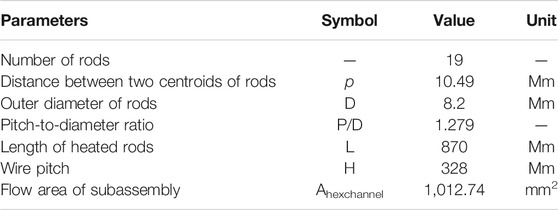
TABLE 1. Some detailed parameters of the subassembly in the present study (Pacio et al., 2016).
2.2. Grid Models
As for the grid model, polyhedral cells are adopted to fill up the final fluid domain. A polyhedral cell has more connective cells than a hexahedral or tetrahedral cell, meaning that high-resolution of the complex geometry and better convergence can be achieved (Wang et al., 2018; Wang et al., 2019a). Hence comprehensively making a balance between the grid quality and the cell quantity, the polyhedral type is a better choice to guarantee the high-quality mesh model with a relatively smaller cell quantity due to the complex wire spacers and narrow proximity between the wire and the fuel rod. More specifically, there are five wall-resolved models that adopt different cell quantities (minimum 7.7 million, maximum 72.9 million, as summarized in Table 2) in this simulation to obtain the mesh-independence solution. In addition, the y+ value of the first cell layer near the wall is controlled within the range of 1 to 10.

TABLE 2. Details of the five grids adopted in the sensitivity study.
2.3. Mesh Independence Analysis
In the reference case, the inlet temperature and the mass flow rate of the LBE are 473 K and 19.18 kg/s, respectively. Besides, the heated rod surface is specified with a uniform heat flux of 463,000 w/m2. Firstly, the effect of the mesh refinement is analyzed qualitatively. The temperature profile at one central sub-channel (the position is shown in Figure 2A) is assessed in five different cases. Figure 2B illustrates that the profiles estimated by the “coarse”, “base”, and “fine” models are closed, while the results estimated by the two other models are more divergent. Consequently, considering these five profiles and the computational cost, the final grid is chosen from the three “coarse”, “base”, and “fine” models.
FIGURE 2. (A) The schematic position of the characteristic line; (B) the temperature profile along the characteristic line at the central sub-channel.
Secondly, quantitative analyses about the grids are supplemented. In this part, a grid convergence index (Roache, 1994; Roache, 1997) (GCI) is adopted and the evaluation is performed in the three grids mentioned above. Besides, the desired parameters in the GCI calculation are chosen as the local Nusselt number at the plane ML2 and the maximum temperature along the characteristic line (ML2 shown in Figure 4, the characteristic line shown in Figure 2A). In the GCI methodology, for the current grid models, the refinement ratio is defined as:
where Nf+1 denotes the cell quantity of the grid after refinement, Nf is the quantity before refinement. What is more, for the current three-dimensional case, D is equal to three in Eq. 1, representing the dimensionality of the problem. Subsequently, we can derive the convergence index for the desired parameters using Eq. 2, which can be written as:
where Fs denotes a safety factor, and it is suggested as 1.25 (Roache, 1997). |e| is the absolute value of relative error between the two solutions estimated by the two grids. And p is the order of convergence. The grids in this part are not refined uniformly, i.e., the refinement ratio is not constant, and the evaluation of p needs an iterative process (Roache, 1997). Specifically, iterative equations are presented as:
where pli is the value of p in the last iteration, ω is a relaxation factor and determined as 0.5, and r12 and r23 are the refinement ratios of the finest grid to the intermediate grid, and the intermedium to the coarse grid, respectively. So in this case, the index 1, 2, and 3 represent the “fine” grid, the “base” grid, and the “coarse” grid, respectively.
Results of GCI analyses on the two concerned parameters are shown in Table 3. The highest temperature along the characteristic line decreases gradually with the grid refining. Moreover, the GCI analysis for the highest temperature suggests that the “fine” model in #1 would be optimum for the current study, with a very low GCI (GCIt,12) value at 0.0380%. Besides, the same analysis for local Nu at ML2 presents a similar conclusion. Specifically, after refinement, the GCI value of Nu at ML2 decrease to 2.55%, a relatively low value with the “fine” grid in #1.
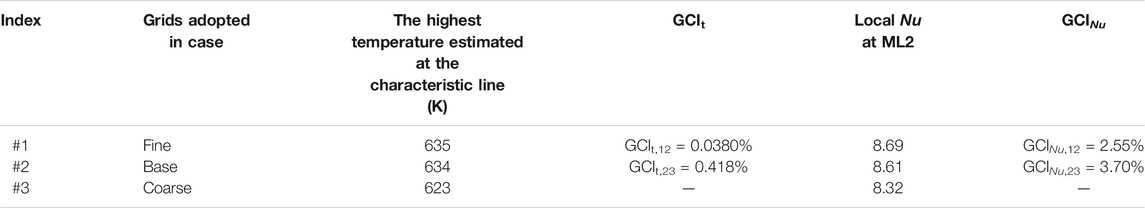
TABLE 3. GCI evaluated on the highest fluid temperature at the chosen line and Nu on ML2.
2.4. Blockage Modeling
The “mesh-marking” method, which is performed using user-defined memories in ANSYS-FLUENT (FLUENT 19.2, 2019) to distinguish the cells of the blockage region from the fluid domain, is adopted to set up the mesh model under a blockage condition. After the method is implemented, the marked blockage region is specified as porous, and stainless steel is chosen as the solid material. The properties of the solid material are shown as the following equations (Chai et al., 2019):
The source term induced by the porous region is:
where Si denotes the source term added in the momentum equation, α represents the permeability of the porous region, which is the ability of the medium to allow fluid to pass through, and C2 is the inertial resistance factor. Besides, the steady-state energy equation inside the porous region can be written as:
where Ef is the total energy of fluid, keff represents the effective thermal conductivity, and can be derived as Eq. 8b, where kf and ks are the thermal conductivities of fluid and solid, respectively, and γ denotes the porosity of the material. In the current problem, the viscous and inertial loss coefficients are derived using the Ergun equation (FLUENT 19.2, 2019):
where Dp represents the particle diameter, and us is the superficial velocity of fluid. During the calculation, the different flow state in the region can be conveniently established by changing the porosity and the resistance factors.
3. Calculation Implementation
3.1. Numeric Methods
In the present study, the steady-state governing equations, including continuum, momentum, and energy equations, are solved in a FLUENT pressure-based solver. In the solver, gradient terms are discretized in the “least square cell based” scheme, while convection terms are addressed with a second order upwind scheme. During the calculation, the coupling between the velocity field and the pressure field is achieved by the SIMPLEC algorithm. Simultaneously, when the residuals during the iterative process of solving the equations decays to 10−4, the iteration process is judged to be convergent.
3.2. Properties of LBE
The physical properties of LBE may change significantly in the process of flow and heat transfer. So in the present work, temperature-dependent properties are adopted. They can be presented as the following equations (Kutateladze, 1959; Hultgren, 1973; Lida and Guthrie, 1988; Su et al., 2013):
Density ρ:
Thermal capacity Cp:
Thermal conductivity
Viscosity μ:
3.3. The Turbulent Heat Transfer Model
The Prt of LBE in the energy equation should be treated carefully in this study. The Prt of liquid metal is far less than 1.0, which means that the velocity boundary layer is not similar to the thermal boundary layer, so the Reynolds analogy is no longer feasible for liquid metal. For solving this problem, many modifications have been proposed. The Cheng-Tak (Cheng and Tak, 2006) model has a better estimation capacity for the heat transfer characteristics of LBE flow, which are presented as:
4. Validation
In the present work, the numerical results are validated against the experimental data under the normal operation conditions from experiments conducted by Pacio et al. (Pacio et al., 2016) The validation simulation aims to confirm that the numerical model is correct and can be extensively used in non-normal condition simulations.
Firstly, the local Nu at ML3 (Pacio et al., 2016) is evaluated to assess the suitable turbulence models. In the experiment, the variation of Nu with the Pe ranging from 400 to approximately 1,300 is presented. Comparing with the numerical results estimated by different models, the SST k-ω model predicts the local thermal field much closer to the experimental data. As shown in Figure 3, both SST and the Reynolds stress model (RSM) have a relatively high precision prediction of the Nu, but with the Pe increasing, the RSM is found to underestimate the Nu by over 20% (green error bars present the ±20% deviation).
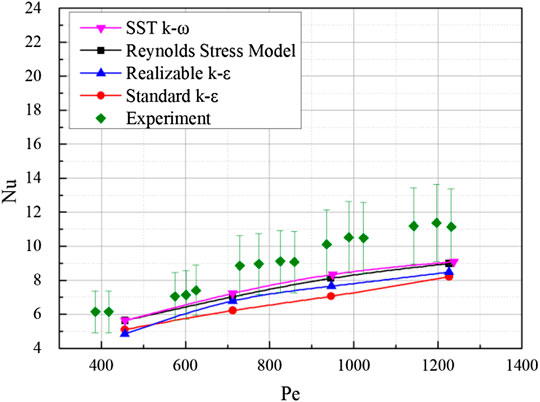
FIGURE 3. The local Nu at ML3 estimated by different turbulence models against the experiment.
For further validation, the specific coolant temperatures in the sub-channels at ML2 and ML3 (positions are depicted in Figure 4) are compared between CFD results and experimental data. As shown in Figure 5, the present CFD model can predict the temperature profile in the sub-channels with satisfactory precision, and the errors are less than 3%.
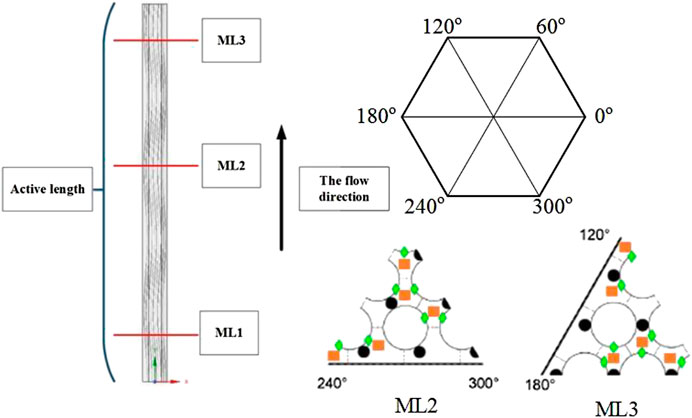
FIGURE 4. The schematic positions of temperature measuring points in the sub-channels at ML2 and ML3 (Pacio et al., 2016) (Z: the distance downstream of the entrance of the active length).
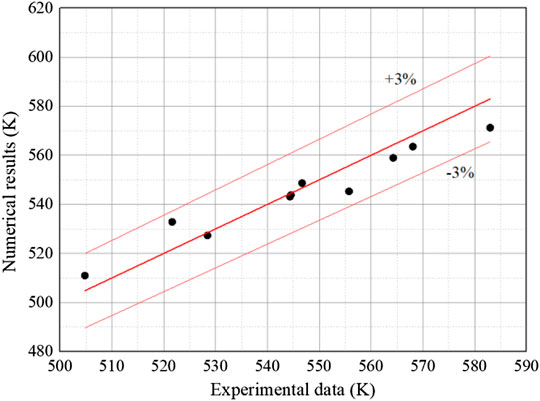
FIGURE 5. The variations of numerical simulation errors.
5. Results and Discussion
In the simulation, various blockage conditions are tested and analyzed, including the influences of blockage longitude, position, and porosity. All the calculated cases are summarized in Table 4.
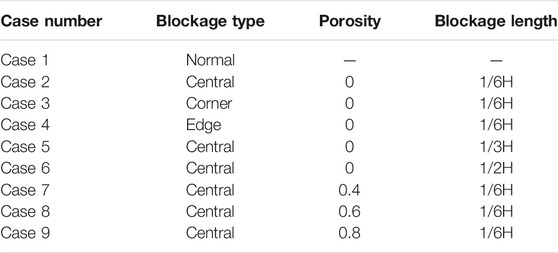
TABLE 4. The case matrix of blockage analysis.
5.1. The Flow and Thermal Fields After Inlets Are Partially Blocked
In this section, the flow and heat transfer characteristics under the assembly blockage in the central sub-channels are discussed. After the stainless steel blockage propagates along the axis direction, the thermal hydraulic features inside the assembly change significantly. The coolant is forced to bypass the surrounding channels, so a cylindrical region with high temperature and a wake region downstream of the blockage can be observed. Figure 6 shows the temperature distribution in the six sectional planes along different axis positions with a 1/6, 1/3, 1/2, 2/3, 5/6, and 6/6 blockage length from the inlet. At the 1/6 blockage length plane (depicted as Figure 6A), the temperature is observed to be symmetrical. Because the helical spacer wires contribute to different heat transfer efficiency at different positions of the blockage, a large-scale hot spot appears and extends gradually in the anti-clockwize direction with the flow developing downstream. Specifically, the circumferential velocity of the coolant is induced in the anti-clockwize direction on the depicted plane. Hence at the upwind surface, the coolant floods and cools down the hot rods to a certain extent.
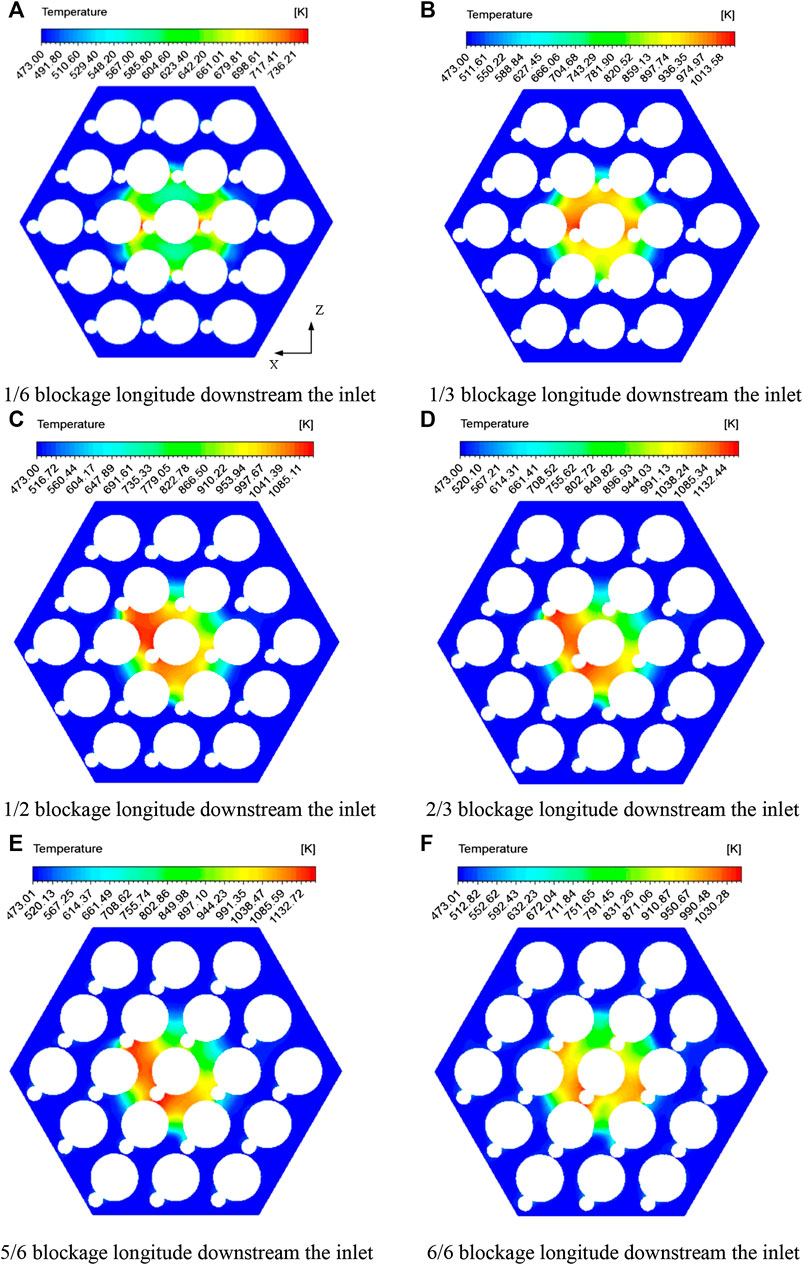
FIGURE 6. The temperature distributions at six sectional planes in the blocked region. (A) 1/6 blockage longitude downstream of the inlet. (B) 1/3 blockage longitude downstream of the inlet. (C) 1/2 blockage longitude downstream of the inlet. (D) 2/3 blockage longitude downstream of the inlet. (E) 5/6 blockage longitude downstream of the inlet. (F) 6/6 blockage longitude downstream of the inlet.
After passing the blockage, the bypassed coolant begins to re-fill the downstream region of the blocked sub-channels. The velocity contours on the four planes downstream of the blockage are shown in Figure 7. As the contours illustrate, in a short distance downstream of the blockage, the sub-channels above the blocked region are still in a state of coolant loss, while at position 1/18H (18.2 mm) downstream of the blockage, the re-flood LBE begins to cool down the central pin surrounded by the cylindrical region. Besides, the wake region is filled up circumferentially, and it is nearly fully cooled from plane 1/6H (54.7 mm) downstream of the blockage. Nevertheless, because of the difference in filling velocity from different circumferential bearings, pin 10 (the position shown in Figure 1) is still partially exposed to the hot coolant.
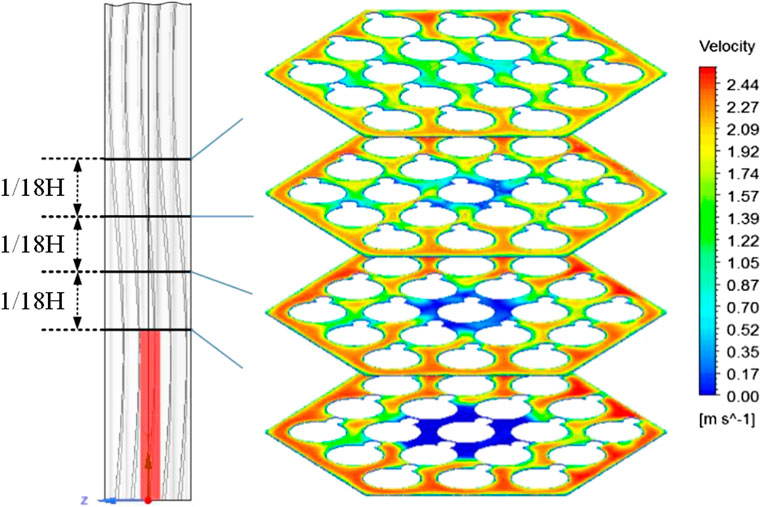
FIGURE 7. The velocity contours downstream of the blockage.
5.2. The Influence of the Blockage Position
The effects of a solid blockage (porosity at 0) at different radial positions are studied in this section. A schematic of blockage positions of cases 3 and 4 are shown in Figure 8A. More specifically, in case 3, pin 1 (as depicted in Figure 1) is surrounded by a solid blockage that has the same length as case 2, and the corner channels are blocked. In case 4, the edge channels are blocked and pin two is in the central blockage region.
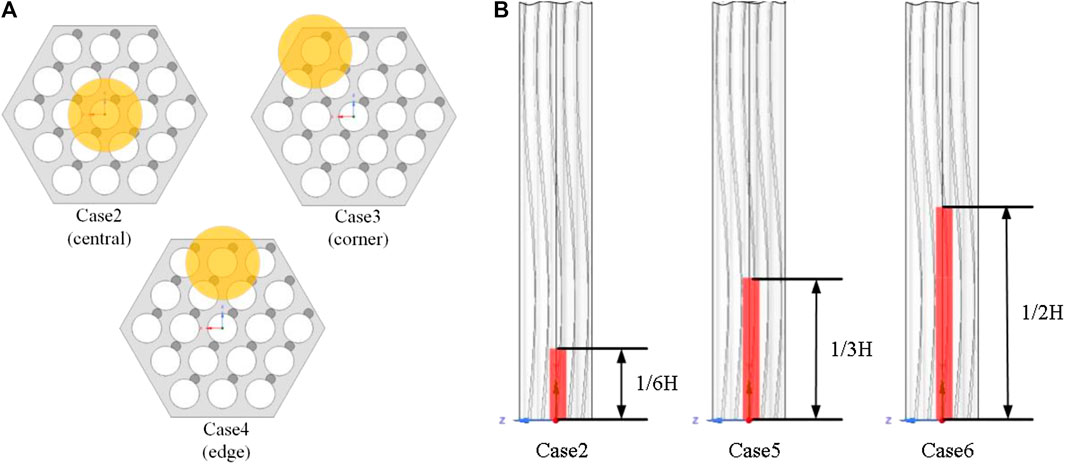
FIGURE 8. The schematic positions and layouts of the blockages in the six cases. (A) Blockages positions in cases 2, 3, and 4. (B) Blockage positions in cases 2, 5, and 6.
Considering the blockages at different radial positions, six sectional planes were chosen to depict velocity vectors and temperature distribution. In case 3, after the blocked corner is generated, the circumferential flow in the peripheral sub-channels close to the hexagonal wrapper is revealed. The original anti-clockwize flow along the hexagonal wrapper is forced back by impacting the blockage material, and a small scale vortex is formed, shown as the dotted arrow line in Figure 9A. Although the blockage region obstructs the anti-clockwize peripheral flow significantly, the LBE will flow into the nearby channels, and simultaneously, the outer wall of the blockage is flooded and cooled down by the counter-clockwize flowing coolant. Downstream of the blockage, the coolant rapidly fills up the wake region from two different directions. As shown in Figure 9E, the coolant from the peripheral channel and central channel flood toward pin 1, which is the centroid of the cylindrical blockage. In addition, unlike the conditions in the central blockage, the hot spot in case 3 seems to be stationary. Because of the assembly wrapper, the coolant is only able to cool down one side of the circular area in an anti-clockwize fashion, hence the hot spot remains in the vicinity of pin 1, as shown in Figures 9B–E. Similar flow and temperature fields can also be observed in case 4 with a circular blockage located at the edge (pin two is surrounded fully and some edge sub-channels are covered). As can be seen in Figure 10B, the filling flow floods toward the center rod quickly. Because the flooding velocity from the right side is much higher than the other side, asymmetrical cooling is obvious. That is to say, pin two suffers a high temperature difference on the surface of the rod.
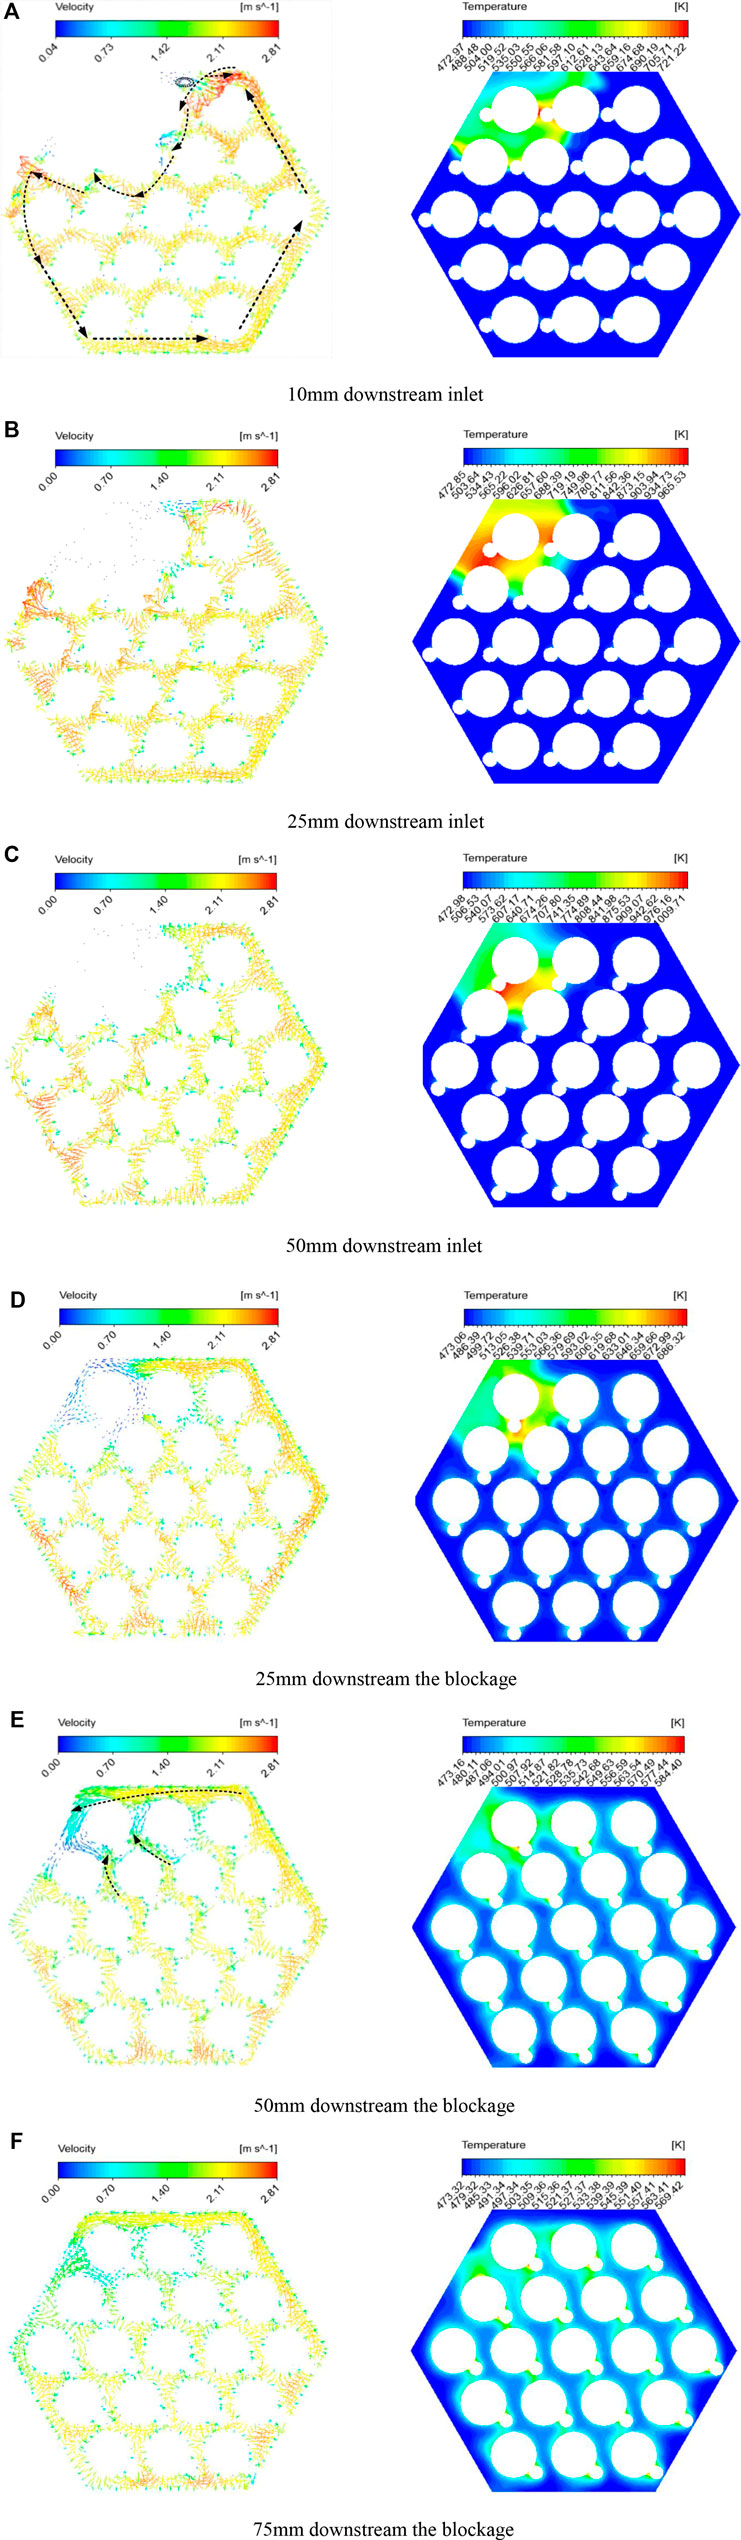
FIGURE 9. The vector and temperature contours in case 3. (A) 10 mm downstream of the inlet. (B) 25 mm downstream of the inlet. (C) 50 mm downstream of the inlet. (D) 25 mm downstream of the blockage. (E) 50 mm downstream of the blockage. (F) 75 mm downstream of the blockage.
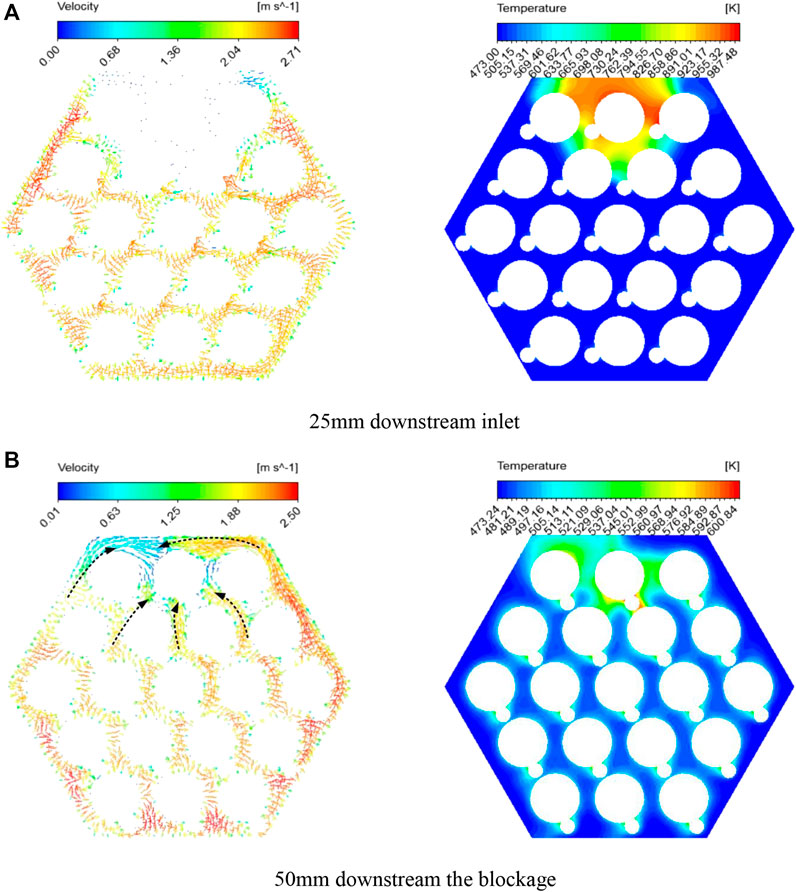
FIGURE 10. The vector and temperature contours in case 4. (A) 25 mm downstream of inlet. (B) 50 mm downstream the of blockage.
From a macroscopic view, blockages in different radial positions have evidential effects on the cladding temperature. The evolution of circumferentially averaged temperature in an individual rod that is surrounded by a blockage (pin one in case 3 and pin two in case 4) varies with the axial position as shown in Figure 11. It illustrates that the evolution laws of averaged temperature on different rod surfaces are similar. The average temperatures almost peak at the same height (26.1 mm downstream of the inlet) in all three cases. What is different is the peak temperature value, and in the case with a central blockage, the peak temperature is the largest at approximately 1020 K. Subsequently, the rapid decrease of circumferentially averaged temperature is witnessed. Simultaneously, the average temperatures at the outlet also show discrepancies, and the largest is approximately 610 K in case 2, which is 31 K higher than the value estimated in case 4 (579 K) and 43 K larger than that in case 3 (567 K).
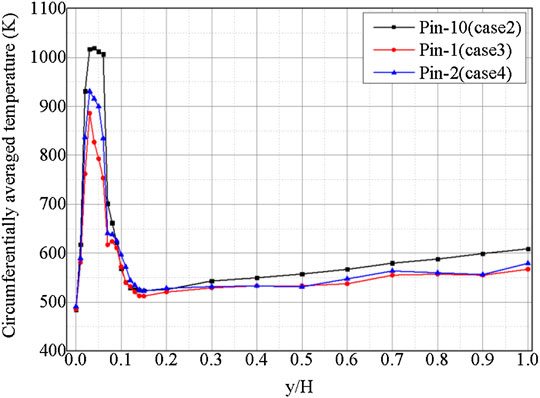
FIGURE 11. Variation of the circumferentially averaged temperature on pin 1, 2, and 10 along the axial position.
In addition, as summarized in Table 5, the effect of a blockage on the local and global cladding temperature is quantitatively analyzed. Firstly, the deviations can be found when considering the local maximum cladding temperature. Specifically, the highest peak temperature of the cladding in the bundle in case 2 is 1,174.13 K due to the peripheral flow. In the central part of the assembly, most of the coolant flows downstream, while the circumferential velocity is relatively low, so the coolant cannot effectively cool down the outer blockage and fulfill the wake region downstream. But when the blockage occupies near the hexagonal wrapper, the peripheral flow dominates. From the view of safety, central blockages can be more dangerous than the other two conditions.
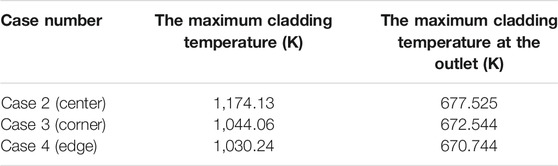
TABLE 5. The local peak cladding temperature and maximum temperature at the outlet.
5.3. The Influence of Porosity
Under normal operation conditions, a porous blockage may propagate to occupy sub-channels as the debris accumulates and the coolant can still flow inside the porous region. But the flow and heat transfer characteristics may change considerably. Hence, a central blockage at an inlet with three different porosities were calculated (case 7 with porosity at 0.4, case 8 with porosity at 0.6, and case 9 with porosity at 0.8), as summarized in Table 4.
Figure 12 presents the velocity and temperature fields at six sectional planes in case 7. As can be seen in Figures 12A–C, although the sub-channels are blocked, a small amount of LBE is still able to contribute to rod cooling. So the temperature distribution at the beginning of the blockage is homogeneous, and the temperature increase in the porous region is less significant than that in the solid cases. In a short distance, at the plane 25 mm downstream of the inlet (nearly half of the whole blockage height), the coolant rapidly floods into the blocked area with an anti-clockwize direction. And downstream of the blockage, the coolant cools the wake region in the same pattern. In addition, the development of the temperature field can be asymmetric, which is similar with the solid case. When the flow develops to the position of 75 mm downstream of the blockage, the wake region is fully cooled by the coolant, and the temperature distribution is observed to be homogeneous, though hot spots are found in the sub-channel among the pins 9, 10, and 14.
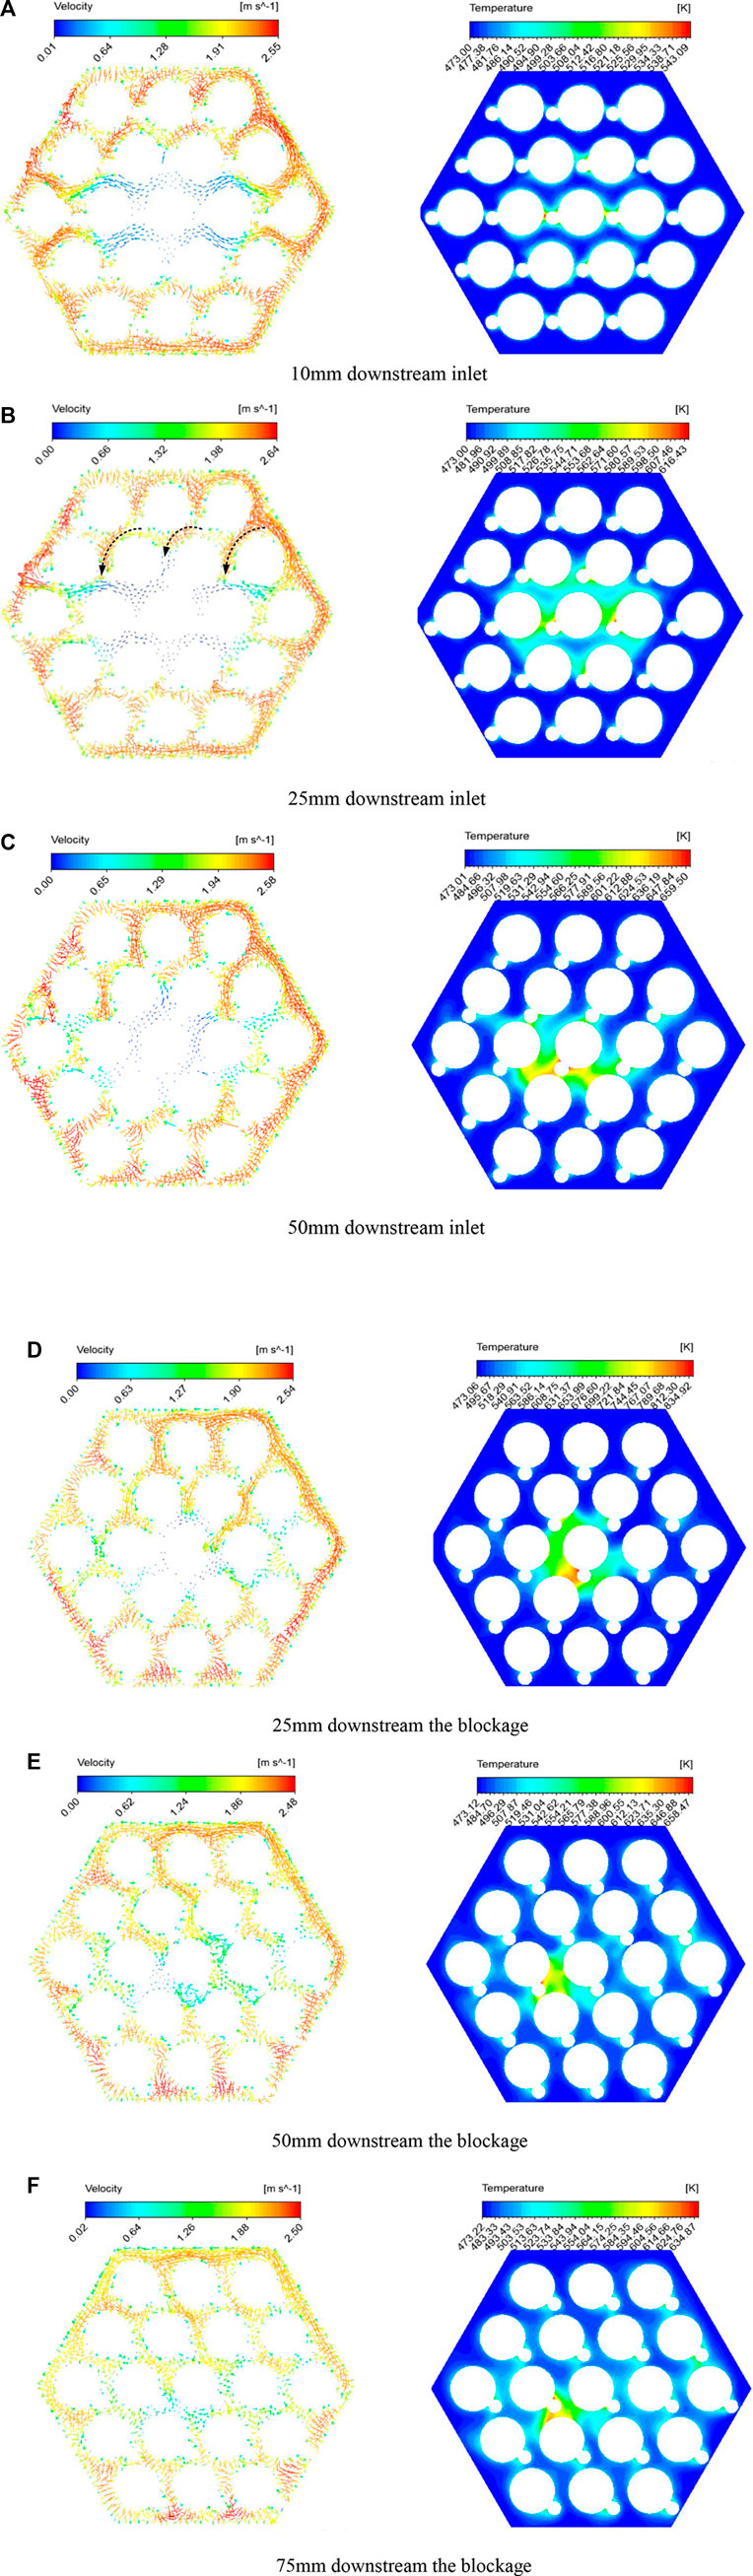
FIGURE 12. The vector and temperature distributions in case 7. (A) 10 mm downstream of the inlet (B) 25 mm downstream of the inlet. (C) 50 mm downstream of the inlet. (D) 25 mm downstream of the blockage. (E) 50 mm downstream of the blockage. (F) 75 mm downstream of the blockage.
The evolution of circumferentially averaged temperature on pin 10 surrounded by materials with different porosities is shown in Figure 13A. As the porosity increases, the peak temperature decreases. The peak temperature position moves closer to the outlet when the porosity decreases. Nevertheless, the evolution of the average temperature on the rod surface downstream of the blockage is similar among all four of the different cases. Additionally, the maximum cladding temperatures in the four cases are shown as the line graph in Figure 13B. The line graph illustrates that the porosity has an evidential effect on the maximum temperature of the cladding, and the cladding temperature may exceed 1000 K when the porosity is smaller than 0.4. But the influence becomes weaker as the porosity increases.
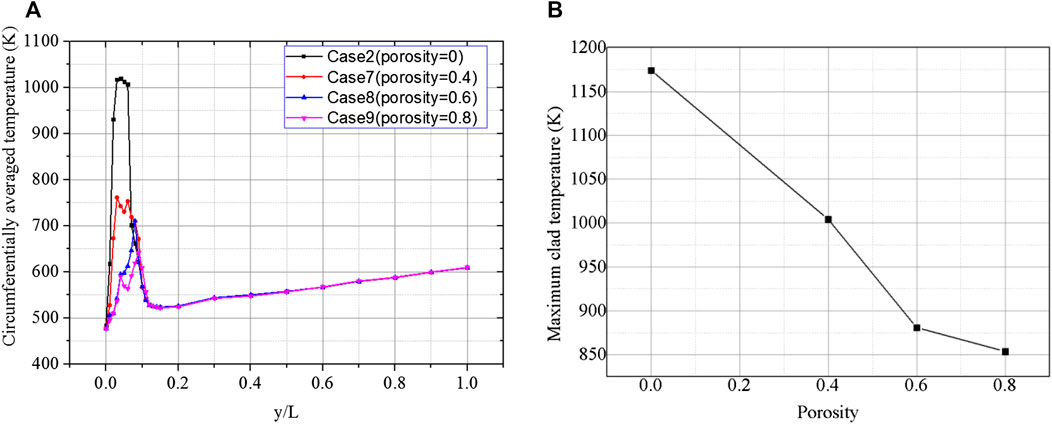
FIGURE 13. The characteristics of the temperature evolution under a porous blockage with different porosities. (A) Circumferentially averaged temperature. (B) The maximum cladding temperature.
5.4. The Influence of Blockage Length
In addition to the porosity and blockage position, the blockage longitude also has a significant effect on the thermal-hydraulic behaviors of the LBE inside the blocked assembly. In this part, two more cases (cases 5 and 6) were supplemented and analyzed to summarize the influence of blockages at different longitudes. The blockages in the two cases propagate downstream from the inlet of the heated region to 1/3H and 1/2H, of which the size in the y direction are two and three times as long as that in case 2, respectively. The blockage layout and the scales are shown in Figure 8B.
It can be confirmed that prolonging the solid blockage contributes to a longer region with weaker heat transfer between the rods and coolant. Figure 14 shows variations of circumferentially averaged temperature. In case 2, the circumferentially average temperature of pin 10 increases sharply from 473 K to approximately 1000 K in a short distance (∼0.02 L) because of coolant loss. Then the average temperature peaks at approximately 1020 K at 0.04 L (34.8 mm) downstream of the inlet inside the blocked area. Downstream of the blockage region, the average temperature rapidly decreases due to the reflooding of rod 1. In cases 5 and 6, the blockage length is prolonged by two and three times, respectively. Although the blockage length is different, the variation laws are the same in all three cases, i.e., the wake regions are the same length.
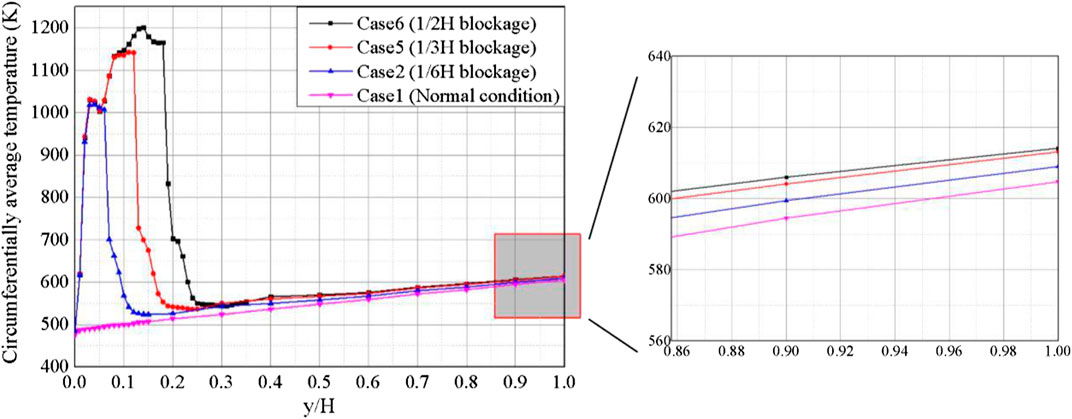
FIGURE 14. Variations of the circumferentially averaged temperature on pin 10 along the axis direction.
Similarly, the local and global effects of the blockage were also determined. As summarized in Table 6, two kinds of maximum cladding temperature are confirmed. With the increase of blockage length, the maximum temperature of cladding is found when the blockage is prolonged three times, and the maximum is 1,351.68 K in case 6. The maximum temperature at the outlet of case 6 is also the highest among the three cases. What is worth mentioning here is that, although the longitude has evidently influenced the local maximum, the influence on the global effect becomes weaker when the blockage is prolonged.

TABLE 6. The local peak cladding temperature and the maximum temperature at the outlet.
6. Conclusions
In the present work, a CFD model for a 19-pin assembly that is cooled by LBE was established and validated against the experimental data. In the simulation, the Prt was modified and various RANS models were assessed for the selection of a proper liquid-metal coolant turbulent heat transfer model. Then the validated numerical models were adopted to investigate the blocked flow inside the assembly. The simulation results suggested that the Cheng-Tak Prt model cooperating with the SST k-ω turbulence model were appropriate, and the relative error between the simulation results and experimental data of the Nu and coolant temperatures in the sub-channels were less than 20% and 3%, respectively. Then the thermal hydraulic features of the 19-pin assembly under blocked conditions were studied. Some detailed conclusions could be drawn:
(1) Although a wake region downstream of the blockage was observed, the direction effect by wire spacers contributed to rapid re-flooding.
(2) The average cladding temperature exhibited a nearly monotonic variation with the axial position. The effect of a porous blockage was strongly influenced by porosity, and the peak cladding temperature was proportional to the porosity.
(3) From the view of safety, the most dangerous case was when a partially porous blockage was located near the outlet of an active section. What is more, a rapid temperature increase appeared with a decrease in porosity.
Data Availability Statement
The raw data supporting the conclusions of this article will be made available by the authors, without undue reservation.
Author Contributions
JL has written and organized the structure of the article, and has performed some of the calculations presented in the article. DF and CG have performed some of the calculations in the article. MW, JD, WT, SQ, and GS give some advice about the article.
Funding
This research has been supported by the National Natural Science Foundation of China (Grant No. 11705139) and the National Key Research and Development Program of China (No. 2019YFB1901300).
Conflict of Interest
The authors declare that the research was conducted in the absence of any commercial or financial relationships that could be construed as a potential conflict of interest.
Glossary
CFD Computational fluid dynamics
Cp Thermal capacity of LBE
Cpsteel Thermal capacity of stainless steel
FA Fuel assembly
GEN-IV Generation IV
GCI Grid convergence index
IWF Inter-wrapper flow
LBE Lead-bismuth eutectic
LFR Lead-cooled fast reactor
LMFR Liquid metal fast reactor
RANS Reynolds averaged Navier-Stokes equations
RSM Reynolds stress model
SFR Sodium-cooled fast reactor
Si Source term in momentum equation
T-H Thermal hydraulic
TIB Total instantaneous blockage
U′ Component of fluctuating velocity
vi Component of velocity
|v| Velocity magnitude
ρ Density of LBE
λ Thermal conductivity of LBE
μ Viscosity of LBE (Pas)
ρsteel Density of stainless steel
λ Thermal conductivity of stainless steel
References
Abderrahim, H. A., Kupschus, P., Malambu, E., Benoit, P., Van Tichelen, K., Arien, B., et al. (2001). MYRRHA: a multipurpose accelerator driven system for research & development. Nucl. Instrum. Methods Phys. Res. 463 (3), 487–494. doi:10.1016/s0168-9002(01)00164-4
Biarrotte, J. L., Mueller, A. C., Klein, H., Pierini, P., and Vandeplassche, D. (2010). “Accelerator reference design for the MYRRHA European ADS demonstrator,” in Proceedings of linear accelerator conference LINAC2010, Tsukuba, Japan, September 12–17, 2010, 440-443. Available at: https://accelconf.web.cern.ch/LINAC2010/papers/tup020.pdf.
Chai, X., Liu, X. J., Xiong, J. B., and Cheng, X. (2019). CFD analysis of flow blockage phenomena in a LBE-cooled 19-pin wire-wrapped rod bundle. Nucl. Eng. Des. 344, 107–121. doi:10.1016/j.nucengdes.2019.01.019
Chen, J., Zhang, D. L., Song, P., Wang, X., Wang, S., Liang, Y., et al. (2018). CFD investigation on thermal-hydraulic behaviors of a wire-wrapped fuel subassembly for sodium-cooled fast reactor. Ann. Nucl. Energy 113, 256–269. doi:10.1016/j.anucene.2017.11.023
Cheng, X.,, and Tak, N. (2006). Investigation on turbulent heat transfer to lead–bismuth eutectic flows in circular tubes for nuclear applications. Nucl. Eng. Des. 236 (4), 385–393. doi:10.1016/j.nucengdes.2005.09.006
Damiani, L., Prato, A. P., and Revetria, R. (2014). Innovative steam generation system for the secondary loop of 'ALFRED' lead-cooled fast reactor demonstrator. Appl. Energy 121, 207–218. doi:10.1016/j.apenergy.2014.02.014
FLUENT 19.2 (2019). FLUENT 19.2 documentation, user’s guide manual. Available from: https://www.twirpx.com/file/3179054/.
Frignani, M., Alemberti, A., and Tarantino, M. (2019a). ALFRED: A revised concept to improve pool related thermal-hydraulics. Nucl. Eng. Des. 355, 110359. doi:10.1016/j.nucengdes.2019.110359
Frignani, M., Alemberti, A., Tarantino, M., and Grasso, G. (2019b). “ALFRED staged approach,” in International congress on advances in nuclear power plants (ICAPP 2019), Juan-les-pins, France, May 12–15, 2019.
Frogheri, M., Alemberti, A., and Mansani, L. (2013). “The lead fast reactor: demonstrator (ALFRED) and ELFR design,” in International conference on fast reactors and related fuel cycles: safe technologies and sustainable scenarios, Paris, France, March 4–7, 2013. (International Atomic Energy Agency). Available at: https://www-pub.iaea.org/MTCD/Publications/PDF/Pub1665Vol1Web-68441300.pdf.
Goth, N., Jones, P., Nguyen, D. T., Vaghetto, R., Hassan, Y., Salpeter, N., et al. (2018a). Comparison of experimental and simulation results on interior subchannels of a 61-pin wire-wrapped hexagonal fuel bundle. Nucl. Eng. Des. 338, 130–136. doi:10.1016/j.ijheatfluidflow.2018.03.021
Goth, N., Jones, P., Nguyen, T. D., Vaghetto, R., Hassan, Y. A., Obabko, A., et al. (2018b). PTV/PIV measurements of turbulent flows in interior subchannels of a 61-pin wire-wrapped hexagonal fuel bundle. Int. J. Heat Fluid Flow 71, 295–304. doi:10.1016/j.nucengdes.2018.08.002
Hultgren, R. R. (1973). Selected values of the thermodynamic properties of binary alloys. Metals Park, OH: American Society for Metals. 1435.
Kennedy, G., Tichelen, K., and Doolaard, H. (2015). “Experimental investigation of the pressure loss characteristics of the full-scale MYRRHA fuel bundle in the COMPLOT LBE facility,” in NURETH16, Chicago, IL, August 30–September 4, 2015. Available at: http://glc.ans.org/nureth-16/data/papers/13119.pdf.
Lida, T.,, and Guthrie, R. I. L. (1988). The physical properties of liquid metals. Ann Arbor, MI: Oxford University Press.
Merzari, E., Fischer, P., Yuan, H., Van Tichelen, K., Keijers, S., De Ridder, J., et al. (2016). Benchmark exercise for fluid flow simulations in a liquid metal fast reactor fuel assembly. Nucl. Eng. Des. 298, 218–228. doi:10.1016/j.nucengdes.2015.11.002
Merzari, E., Pointer, W. D., and Smith, J. G. (2010). “Numerical simulation of the flow in wire-wrapped pin bundles: effect of pin wire contact modeling,” in Computational fluid dynamics (CFD) for nuclear reactor safety applications - workshop proceedings, CFD4NRS-3 - experimental validation and application of cfd and cmfd codes to nuclear reactor safety issues. Nuclear Energy Agency of the OECD. 1231. Nuclear Engineering and Design, 2012, 253 (1-4), 374–386.
Nguyen, T., Goth, N., Jones, P., Lee, S., Vaghetto, R., and Hassan, Y. (2017). PIV measurements of turbulent flows in a 61-pin wire-wrapped hexagonal fuel bundle. Int. J. Heat Fluid Flow 65, 47–59. doi:10.1016/j.ijheatfluidflow.2017.03.007
Nguyen, T., Goth, N., Jones, P., Vaghetto, R., and Hassan, Y. (2018). Stereoscopic PIV measurements of near-wall flow in a tightly packed rod bundle with wire spacers. Exp. Therm. Fluid Sci. 92, 420–435. doi:10.1016/j.expthermflusci.2017.11.009
Pacio, J., Daubner, M., Fellmoser, F., Litfin, K., Marocco, L., Stieglitz, R., et al. (2014). Heavy-liquid metal heat transfer experiment in a 19-rod bundle with grid spacers. Nucl. Eng. Des. 273, 33–46. doi:10.1016/j.nucengdes.2014.02.020
Pacio, J., Daubner, M., Fellmoser, F., Litfin, K., and Wetzel, T. (2016). Experimental study of heavy-liquid metal (LBE) flow and heat transfer along a hexagonal 19-rod bundle with wire spacers. Nucl. Eng. Des. 301, 111–127. doi:10.1016/j.nucengdes.2016.03.003
Pacio, J., Daubner, M., Fellmoser, F., Litfin, K., and Wetzel, T. (2018). Heat transfer experiment in a partially (internally) blocked 19-rod bundle with wire spacers cooled by LBE. Nucl. Eng. Des. 330, 225–240. doi:10.1016/j.nucengdes.2018.01.034
Pacio, J., Wetzel, T., Doolaard, H., Roelofs, F., and Van Tichelen, K. (2017). Thermal-hydraulic study of the LBE-cooled fuel assembly in the MYRRHA reactor: experiments and simulations. Nucl. Eng. Des. 312, 327–337. doi:10.1016/j.nucengdes.2016.08.023
Piazza, I. D., Angelucci, M., Marinari, R., Tarantino, M., and Forgione, N. (2016). Heat transfer on HLM cooled wire-spaced fuel pin bundle simulator in the NACIE-UP facility. Nucl. Eng. Des. 300, 256–267. doi:10.1016/j.nucengdes.2016.02.008
Piazza, I. D., Magugliani, F., Tarantino, M., and Alemberti, A. (2014). A CFD analysis of flow blockage phenomena in ALFRED LFR demo fuel assembly. Nucl. Eng. Des. 276, 202–215. doi:10.1016/j.nucengdes.2014.05.033
Qin, H., Wang, C., Wang, M., Zhang, D., Tian, W., Su, G. H., et al. (2019). Numerical investigation on thermal-hydraulic characteristics of NaK in a helical wire wrapped annulus. Int. J. Heat Mass Tran. 145, 118689. doi:10.1016/j.ijheatmasstransfer.2019.118689
Ranjan, R., Pantano, C., and Fischer, P. (2010). Direct simulation of turbulent swept flow over a wire in a channel. J. Fluid Mech. 651, 165. doi:10.1017/s0022112009993958
Rasu, N. G., Velusamy, K., Sundararajan, T., and Chellapandi, P. (2014). Thermal hydraulic effect of porous blockage in fuel subassembly of sodium cooled fast reactor. Ann. Nucl. Energy 70, 64–81. doi:10.1016/j.anucene.2014.01.045
Roache, P. J. (1994). Perspective: a method for uniform reporting of grid refinement studies. J. Fluid Eng. 116, 405–413. doi:10.1115/1.2910291
Roache, P. J. (1997). Quantification of uncertainty in computational fluid dynamics. Annu. Rev. Fluid Mech. 29, 123–160. doi:10.1146/annurev.fluid.29.1.123
Roelofs, F., Gerschenfeld, A., and Tarantino, M. (2019a). Thermal-hydraulic aspects of liquid-metal-cooled reactors. Cambridge, MA: Elsevier Science. 462.
Roelofs, F., Uitslag-Doolaard, H., Dovizio, D., Mikuz, B., Shams, A., Bertocchi, F., et al. (2019b). Towards validated prediction with RANS CFD of flow and heat transport in a wire-wrap fuel assembly. Nucl. Eng. Des. 353, 110273. doi:10.1016/j.nucengdes.2019.110273
Sarkar, M., Velusamy, K., Munshi, P., and Singh, O. P. (2019). Thermal hydraulic investigation of heat transfer from a completely blocked fuel subassembly of SFR. Ann. Nucl. Energy 130, 131–141. doi:10.1016/j.anucene.2019.02.030
Sarkar, M., Velusamy, K., Munshi, P., and Singh, O. P. (2020). Analysis of flow and heat transfer through a partially blocked fuel subassembly of fast breeder reactor. Prog. Nucl. Energy 118, 103142. doi:10.1016/j.pnucene.2019.103142
Su, Z. W., Zhou, T., and Liu, M. Y. (2013). Thermophysical properties of liquid lead-bismuth eutectic. Nucl. Technol. 36 (9): 90205–91806.
Wang, M. J., Chen, J., Zhang, D. L., Zhang, J., Tian, W., Su, G. H., et al. (2020). Numerical study on the thermal stratification characteristics in the upper plenum of sodium-cooled fast reactor (SFR). Ann. Nucl. Energy 138, 107222. doi:10.1016/j.anucene.2019.107222
Wang, M. J., Manera, A., Petrov, V., Qiu, S., Tian, W., and Su, G. H. (2018). Numerical study of integral inherently safe light water reactor in case of inadvertent DHR operation based on the multiscale method. Nucl. Technol. 203 (2), 194–204. doi:10.1080/00295450.2018.1446656
Wang, M. J., Manera, A., Petrov, V., Memmott, M. J., Qiu, S., and Su, G. H. (2019a). Passive decay heat removal system design for the integral inherent safety light water reactor (I2S-LWR). Ann. Nucl. Energy 145, 106987. doi:10.1016/j.anucene.2019.106987
Wang, X. A., Zhang, D. L., Wang, M. J., Song, P., Wang, S., Liang, Y., et al. (2019b). Hybrid medium model for conjugate heat transfer modeling in the core of sodium-cooled fast reactor. Nucl. Eng. Tech. 52, 708–720. doi:10.1016/j.net.2019.09.009
Wu, Y. C. (2016a). CLEAR-S: an integrated non-nuclear test facility for China lead-based research reactor. Int. J. Energy Res. 40 (14), 1951–1956. doi:10.1002/er.3569
Wu, Y. C. (2016b). Design and R&D progress of China lead-based reactor for ADS research facility. Engineering 2 (1), 124–131. doi:10.1016/j.eng.2016.01.023
Yu, Y., Merzari, E., Obabko, A., and Thomas, J. (2015). A porous medium model for predicting the duct wall temperature of sodium fast reactor fuel assembly. Nucl. Eng. Des. 295, 48–58. doi:10.1016/j.nucengdes.2015.09.020
Zhang, Y., Wang, C. L., Lan, Z. K., Wei, S., Chen, R., Tian, W., et al. (2020). Review of thermal-hydraulic issues and studies of lead-based fast reactors. Renew. Sustain. Energy Rev. 120, 109625. doi:10.1016/j.rser.2019.109625
Keywords: CFD, sub-channel blockage, fuel assembly, lead-bismuth eutectic, wire-wrapped assembly
Citation: Li J, Fang D, Guo C, Wang M, Deng J, Tian W, Qiu S and Su GH (2020) Numerical Study on the Thermal Hydraulic Characteristics in a Wire-Wrapped Assembly of LFRs. Front. Energy Res. 8:548065. doi: 10.3389/fenrg.2020.548065
Received: 01 April 2020; Accepted: 09 November 2020;
Published: 07 December 2020.
Edited by:
Muhammad Zubair, University of Sharjah, United Arab EmiratesReviewed by:
Mariano Tarantino, Italian National Agency for New Technologies, Energy and Sustainable Economic Development (ENEA), ItalyIvo Kljenak, Institut Jožef Stefan (IJS), Slovenia
Copyright © 2020 Li, Fang, Guo, Wang, Deng, Tian, Qiu and Su. This is an open-access article distributed under the terms of the Creative Commons Attribution License (CC BY). The use, distribution or reproduction in other forums is permitted, provided the original author(s) and the copyright owner(s) are credited and that the original publication in this journal is cited, in accordance with accepted academic practice. No use, distribution or reproduction is permitted which does not comply with these terms.
*Correspondence: Mingjun Wang, d2FuZ21pbmdqdW5AbWFpbC54anR1LmVkdS5jbg==; Jian Deng, ZGVuZ2ppYW5fbnBpY0AxNjMuY29t