 Xiang Li1*
 Theodoros Damartzis1
 Zoe Stadler2Stefano Moret1Boris Meier2Markus Friedl2François Maréchal1
- 1Industrial Processes and Energy Systems Engineering, Institute of Mechanical Engineering, Sion, Ecole Polytechnique Fédérale de Lausanne, Lausanne, Switzerland
- 2Hochschule für Technik Rapperswil, Rapperswil, Switzerland
Decarbonization gained prominence with the witnessed rise of temperature over recent years, particularly in the aftermath of the adoption of the Paris agreement for limiting the temperature increase within 2°C until 2050. Biogenic resources are explicitly indicated as carbon-neutral from Life Cycle Assessment perspective by the IPCC, shedding light on the carbon-neutral society by applying Biogenic Energy Carbon Capture for creating negative emissions. This article proposes a novel modeling approach by introducing carbon layers with specification on the principal carbon sources and sinks based upon an optimization algorithm, in order to solve the carbon loop issue in a highly interconnected energy system due to increasing penetration of biomass and carbon capture, use, and storage. This study contributes to quantifying biogenic and nonbiogenic carbon footprints, and optimizing the circular economy associated with a net-zero-emission society, in favor of policy-making for sustainable development in long terms.
1. Introduction
Carbon mitigation is becoming an essential and urgent issue in human activities, infiltrating into various societal fields, including politics, culture, economy, environment, lifestyle, ecology, resource, and so on. In the context of striving for a sustainable society, participating countries in the Paris Climate Summit which took place in 2015 reached an agreement, declaring the objective of keeping the increase in global average temperature to well below 2°C above preindustrial levels within this century, and further to pursue efforts to limit the increase to 1.5°C (IPCC, 2014). In this context, European countries are pioneering the exploration of plausible pathways toward carbon mitigation: the Netherlands announced that all Dutch cars must be emission free by 2030 (NLTimes, 2017); Germany planned to phase out the coal power plants by 2038 (Rinscheid and Wüstenhagen, 2019); and the Danish government decided to provide 100% of Denmark’s energy requirements in electricity, heating, and transport from renewable sources by 2050 (Madsen et al., 2018). In terms of Switzerland, there is a host of energy policies that range from rules for market liberalization to programs for energy conservation, subsidies for renewables, and regulations for
• mitigation of carbon sources: predominately translated by the massive penetration of renewable resources, and efficiency improvement for carbon-intensive areas;
• reinforcement of carbon sinks: in either natural way, such as afforestation and reforestation, or artificial way, typically the deployment of CCUS technologies.
Therefore, it is necessary to analyze the carbon flows of the energy system, by distinguishing carbon categories and identifying various carbon sources and sinks. This article proposes a modeling approach by defining specific carbon layers based upon distinguished carbon categories and identified carbon sources and sinks, in order to clarify the murkiness in energy system models on carbon loop issues, especially in the context of increasing biogenic energy with carbon capture (BECC) where the biomass serves as both a carbon source and a sink. This approach contributes to quantifying the carbon footprints of the system and discovering potential opportunities for a breakthrough, especially with respect to certain key technologies.
This article hereafter is organized in the following way: Section 2 resumes the state-of-the-art from the literature review; Section 3 clarifies the modeling methodology for the MILP (mixed-integer linear programming) optimization, with specification on the carbon flow modeling; Section 4 presents the key data and assumptions used in this research; Section 5 defines decarbonization scenarios and analyzes the results, followed by a discussion on how to achieve carbon neutrality; at last, a conclusion is drawn in Section 6 by resuming the core achievements and limitations of the research.
2. State-of-the-Art
With increasing attention to the decarbonization of the energy system, numerous articles mentioned the essence of biomass playing in achieving this goal. National Academies of Sciences, Engineering and Medicine (2018) emphasized two technologies for conversing biomass to fuels, namely, pyrolysis and gasification; other possible technologies, such as biomass Fischer–Tropsch processes, hydrothermal gasification, etc., had yet not been accounted for. Celebi et al. (2017) reviewed and analyzed various lignocellulosic biorefineries and suggested process design methodology for improving thermo-environmental performance, which is nevertheless not able to quantify the impact of these improvements on the multisector energy system structure. Dahiya et al. (2018) proposed a concept of circular bio-economy with biorefinery, which focused merely on the biomass field, without analysis on the impact of the biomass on the whole energy system. Similar topics include Pfeffer et al. (2007), Santibañez-Aguilar et al. (2011), and Peduzzi (2015). Smith (2016) came up with seven scenarios elaborating fossil CCS (carbon capture and storage) and BECCS, and the production of biofuels, but no further information on how to optimize the usage of the synthesized biofuels, and their corresponding impact to the other energy conversion technologies. In parallel, Creutzig et al. (2015) emphasized the role that CCS plays in biogenic carbon treatment, but ignored the possibility of CCU application. Instead, SAPEA (2018) took into account the role of CCU, but simply concluding the CCU is not able to abate the carbon emission, since the captured carbon is finally released back to the atmosphere, where the effect of the decreased utilization of fossil fuels is neglected.
Concerning BECC, the majority of current researches focus principally on the improvement of the performance of standalone BECC processes within limited boundaries, for instance at an industrial site level, rendering a lack of holistic view on the interactive impacts on the whole energy systems. Another challenge is arising with the increasing advocation for carbon capture and utilization (CCU), which unavoidably releases back the captured carbon into the atmosphere, resulting in carbon flow loops as long as the carbon products are not chemically stable and nonreleasable, typically recyclable plastics. The loop issue is even more tough to be tackled taking into consideration the double nature of biomass as both carbon source and sink. In addition, current studies have paid limited attention to the relationship of carbon capture and renewable development, which cannot be simply regarded as synergistic or mutually exclusive due to the intrinsic complexity of the interactions between resources and technologies.
As to the modeling of carbon flows, the majority of articles are dedicated to depicting the inter-regional import and export of carbon fuels, such as Aichele and Felbermayr (2010), Ackerman et al. (2007), and Chen et al. (2017), with limited attention on the intrinsic complexity of the energy system. Some focused on carbon economics on the market such as Spaargaren and Mol (2013) with up-bottom approaches, rendering a lack of details on the technological aspects of the system. Gounand et al. (2018) analyzed the impact of carbon flows on the ecosystems, with limited information on the energy sides; Chen and Chen (2017) emphasized the correlation between energy consumption and carbon emissions; however, the proposed methodology is still an acylic model, implying circular carbon flows are not considered. Ramaswami et al. (2011) and Suciu et al. (2018) analyzed the carbon footprints within city scale, which is yet difficult to be generalized into a national level, which requires scrutiny since limited freedom of technologies and resources in small cases may restrict the flexibility of a system with diverse possibilities.
Currently, many researchers demonstrate that decarbonizing a specific energy sector within limited boundary is feasible, such as Schiffer and Manthiram (2017) for chemical industry, Braune et al. (2019) for building, and Hannula and Reiner (2017) for transport. However, it should be highlighted that decarbonization of a certain sector may not be substantially beneficial to the decarbonization of the whole energy system, since it might simply shift the carbon emission from one sector to other sectors. For instance, a steel-manufacturing factory opts to consume more electricity than conventional coal/gas as energy carriers in order to mitigate carbon emission, which in nature is risky of transferring the emission pressure to the power sector if the electricity mix is still fossil-dominant. Up to now, there are few models capable of studying circular carbon flow in complex energy systems with multisectors for quantifying the impact of increasing penetration of biogenic carbon sources with CCUS.
From the authors’ perspective, a holistic model allows for an in-depth exploration on the interaction between approaches, some of which are supposed to be mutually exclusive; e.g., the implementation of CCS is likely to be impeded by the increasing penetration of intermittent renewables due to lack of available carbon sources, while some are reckoned synergistic, e.g., the development of storage technologies is expected to be in parallel to the renewables' evolution. Therefore, without a holistic view of the whole system, it is difficult to judge the role of a standalone process/sector in the energy transition.
Conventional methods for dealing with complex systems involve simulation and optimization: Simulation is the most straight-forward method with computational efficiency competence for projection modeling by fixing assumptions and observing the consequent pathways. Its application is however limited particularly in the presence of loop problems, where it is difficult to get the optimal solution from limited tests; conversely, optimization deals with a problem by exploring part of (or the whole) feasible zone at a sacrifice of heavy computational complexity and is commonly used as an auxiliary tool for decision-making. Additionally, an optimization problem can be transformed into a simulation problem by enforcing constraints. Taking into consideration the multilateral interactions in the energy systems, an optimization model based upon AMPL (A Mathematical Programming Language) was applied in this research and is elaborated in Section 3.
3. Modeling Methodology
3.1. Model Description
3.1.1. General Introduction
This research is conducted based upon Energyscope, a bottom-up energy system model developed in the Industrial Process and Energy Systems Engineering (IPESE) group in favor of decision-making for techno-economic and ecological optimization. Compared to other existing energy models, which are often proprietary, computationally expensive, and mostly focused on the electricity sector (Limpens et al., 2019), Energyscope optimizes both the investment and operation strategies of an entire energy system (including electricity, heating, and mobility) by taking a “snapshot” for a given objective year. In this study, the time horizon in consideration is 2050 with a monthly resolution. Having a good performance in the trade-off between the modeling scope and computational time, Energyscope was applied to analyze the uncertainty by Moret et al. (2017) and Li et al. (2019). This open-source platform provides users with the flexibility to define tailored scenarios and analyze the corresponding economic and ecological impacts.
In this model, we highlight the difference in final energy consumption (FEC) and end-use demand (EUD). FEC is defined as the amount of input fuel needed to satisfy the EUD. For instance, FEC refers to, in an oil heat boiler, the amount of oil consumed, while EUD corresponds to the heat generated. The efficiency of the boiler is thus defined by the ratio of EUD over FEC. As presented in Figure 1, the EUD in Energyscope covers the process heat (HT), low-temperature heat (LT), including space heating and hot water supply, electricity, passenger mobility, and freight mobility, where space heating varies in different months according to the distribution ratios given by Moret et al. (2017), while the other demands are supposed to be uniformly distributed within the whole year. In Energyscope, the links between FEC and EUD are bridged by end-use technologies (EUT), such as the boiler aforementioned. One technology can have multi-inputs and outputs, e.g., a cogeneration gas plant provides both heat and electricity with corresponding efficiencies. Additional to EUT, a part of technologies are responsible for intermediate conversions without direct participation in supply for EUD, such as the storage technologies. From the FEC side, Energyscope involves 1) fossil fuels: natural gas, coal, nonbiogenic waste, heating oil, diesel, and gasoline; and 2) nonfossil resources: uranium, solar, wind, geothermal, and biomass. Intermediate resources include electricity, hydrogen, biogas, and bio-liquids (gasoline and diesel). In particular, electricity is regarded as a resource if it serves as an input of one technology, for instance in the electrolysis process; or as an EUD by household appliances. Specifically,
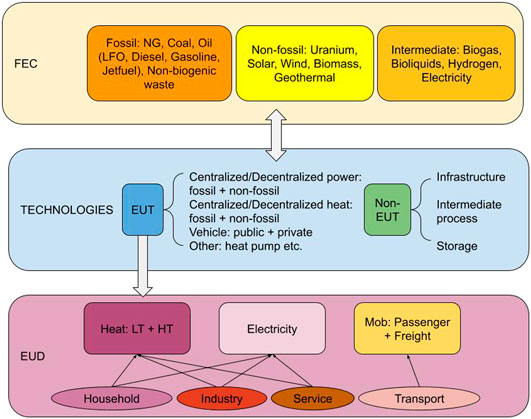
FIGURE 1. Typology of Energyscope.
3.1.2. Mathematical Formulation
In this article, all decision variables are marked in bold format. The objective function of the Energyscope is to minimize the annual total cost
A couple of constraints are dedicated for renewable energies. Equations 16 and 17, expressed in a compact nonlinear formulation, where the nominator and denominator represent the low-temperature heat demand in month t and in the whole year, respectively, render the model more realistic by defining the operating strategy for decentralized heating: the relative use of each technology in each period should be constant, except for the solar thermal (DecSolar): if solar thermal k is installed (
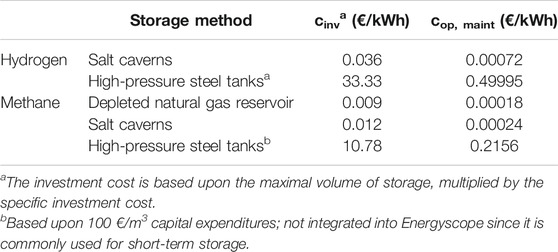
TABLE 1. Storage cost, summarized from Gorre et al. (2018) and Leeuwen and Zauner (2018).
3.2. Carbon Flow Modeling
This section focuses on presenting the modeling approach for circular carbon flows in energy systems. The major carbon sources and sinks, as well as key technologies, are analyzed in Sections 3.2.1.–3.2.4, followed by 3.2.5 presenting the modeling concepts of carbon layers in Energyscope. In order to quantify the carbon flows, a parameter named carbon content linking the energy and carbon mass for each carbon resource and product r is defined by Eq. 21:
where the
Carbon management is considered by taking into account various carbon-containing resources, either biogenic or nonbiogenic, carbon sinks in the form of
3.2.1. Carbon Sources
• Biogenic carbon sources, including
(1) domestic wood: waste wood, wood residues, and forest wood (soft and hard);
(2) domestic wet biomass: sewage sludge, manure, industry waste, and household garbage;
(3) domestic plant (crops): agriculture residues.
• Nonbiogenic carbon sources, including
(1) fossil fuels import: NG (natural gas) and LFO (light fuel oil), diesel, gasoline, and jet-fuel (kerosene);
(2) domestic fuels: nonbiogenic waste;
(3) others: construction emission for technologies and direct cement manufacturing emission.
Coal import is not considered in this model due to the Swiss policy of phasing out coal. Table 2 summarized the domestic biomass potential for energy usage by aggregating all the corresponding subcategories listed in the biogenic carbon sources. It is highlighted that only the sustainable part of the biomass potential was integrated in Energyscope.
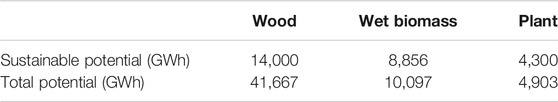
TABLE 2. Domestic biomass potential for Switzerland, extracted from Burg et al. (2018).
In addition to domestic biomass resources, biofuel import contributes to the energy supply as well. In Switzerland, all nonbiogenic energy fuels depend on import, except nonbiogenic wastes. Among the carbon sources, cement manufacturing calls for special scrutiny due to the large amount of the direct emission from
In 2017, Switzerland generated in total 80–90 Mt waste (FOEN, 2018), of which 86% stemmed from construction waste, including excavated waste (57 Mt) and deconstruction waste (17 Mt). Approximately 30% deconstruction waste went further to incineration and landfill. Additionally, 7% of the total waste is composed of the municipal solid waste (MSW), where 53% was recycled and the remaining 2.9 Mt went to incineration. The third-largest source, biogenic waste, took account of approximately 6% of the waste stock, including food waste, agricultural waste, and dry sewage sludge, etc. In order to avoid double counting the biomass, the waste in Energyscope refers to merely the nonbiogenic waste, i.e., the nonrecyclable MSW for energy usage: construction waste is not considered since it is accounted in the availability of wood; similarly, biogenic waste is incorporated into the wet biomass category. By this approach, the annual waste in 2017 amounts to 9.835 TWh, with an average LHV value of MSW 12.35 MJ/kg (Michel, 2012). We further assume an increase in waste availability by 42.8% in 2050 in correspondence to the estimation of GDP development by SECO (2020). One constraint (Eq.22) is integrated into the model reflecting the following two assumptions:
• waste generation rate is uniform over the year;
• waste can be neither accumulated nor exported, implying immediate disposal (e.g., burning in a CHP boiler) when generated.
where the
3.2.2. Carbon Conversion Technologies
Conventional boilers, oil-based vehicles are the major technologies for conversing FEC to satisfy EUD with associated efficiencies. These technologies are mature and have been discussed in numerous articles. In this section, we focus on biomass-based technologies including the following:
• Pyrolysis: The thermal cracking of wood, or solid biomass in general, in the absence of oxidizing conditions. Pyrolysis can deliver a variety of products including gaseous, liquid, and solid mixtures of organic and inorganic compounds, depending on the operating conditions. The heating rate is prevalent among them, determining the intensity of the carbon bond scission and thus, the final distribution of the product mix. Although pyrolysis is considered to be the first step of biomass gasification in order to produce a gaseous fuel, a standalone process can be utilized and targeted toward the production of bio-crude, a liquid hydrocarbon mixture that should undergo further treatment to produce biodiesel.
• Gasification: Woody biomass can be converted to a gaseous fuel stream comprised mainly
• Fischer–Tropsch synthesis: The Fischer–Tropsch (FT) reaction, first developed by Franz Fischer and Hans Tropsch in the 1920s, is a catalytic synthesis process realized as polymerization of carbon atoms. It is mainly used to produce synthetic biofuels from gasification-derived syngas. The chemical reaction is described by a simple representation of the form:
where n is the number of carbon atoms in the polymer chain. The conversion conditions (around 200–300°C and pressure in the range of tens of bars) are used to inhibit the formation of small alkanes, but rather push toward the production of long-chain hydrocarbons with carbon chains of 10–20 atoms, according to the Anderson–Schulz–Flory (ASF) distribution. The FT process uses catalysts to promote the growth of the carbon chain, with nickel or cobalt being the most commonly used ones. However, their low poisoning resistance to sulfuric derivatives dictates stringent syngas cleaning steps prior to insertion in the FT reactor. The produced hydrocarbon blend must then undergo hydrotreatment in order to obtain the desired biofuel quality. The addition of hydrogen in a subsequent hydrocracking reactor leads to the chemical cleavage of the long-chain hydrocarbons and under controlled conditions, the acquisition of a paraffin blend (biodiesel) of the desired quality.
• Anaerobic digestion: Anaerobic digestion (AD) is a biochemical process that is used to break the biogenic carbon of wet biomass and release it in the form of biogas, a gaseous mixture of
• Hydrothermal gasification (HTG): Hydrothermal gasification (HTG) offers the possibility of converting wet organic streams into methane using high pressure to reach supercritical water conditions in a complex reactor scheme. Compared to traditional gasification, it offers the advantage of utilizing the wet stream as it is, avoiding the preceding energy-intensive drying step. Moreover, water in its supercritical condition has a low density and dielectric constant. Consequently, it changes from polar to nonpolar solvent, and thus, the organic compounds dissolve easily in it. Furthermore, the supercritical conditions that prevail within the HTG reactor also ensure that the nitrous and phosphoric minerals contained in some forms of wet biomass such as sewage sludge and manure are released unharmed in the residual output stream. Apart from the direct processing of wet biomass streams, HTG can be used to convert the lignin-rich digestates from anaerobic digestion. On the drawbacks of the process stand the energy needed to reach the operating conditions (around the critical point of water, i.e., 370°C and 220 bars) as well as the use of a catalyst, which in turn requires special attention with regard to maintenance (poisoning prevention, degradation handling, etc.)
• Biomass to alcohols: Primary alcohols such as methanol and ethanol are not only individually used fuels, but also constitute chemicals used as the basis for the synthesis of higher fuels, e.g., aviation fuels. Alcohols can be produced from both woody and nonwoody biomass using different conversion pathways. Methanol can be produced from wood gasification followed by a synthesis step to convert the produced syngas. Ethanol is primarily produced via the biochemical fermentation of biomass crops such as corn, wheat, or sugarcane. Fermentation is usually preceded by pretreatment and handling steps such as milling and hydrolysis, which aims to isolate the sugars from the biomass matrix. Then, the biological degradation step is able to transform the sugars in chemicals of fuels such as ethanol depending on the design of the process.
3.2.3. Carbon Sinks
Two categories of carbon sinks are considered in Energyscope:
• natural carbon sinks: Biomass is regarded as a carbon sink in the process of biogenic formation. As presented, it serves also as a carbon source by combustion.
• artificial carbon sinks: CCUS, where the three processes, CC (carbon capture), CCS (carbon sequestration), and CCU (carbon utilization) are treated separately. Carbon capture occurs previously to the sequestration and utilization. The captured carbon has to be either stored or used.
In terms of CC process, two categories are distinguished according to their application fields: one is from large point sources with high
• postcombustion: One of the most relatively mature technologies for carbon capture. It applies to almost all industrial sectors, typically gas/coal power stations and heavy manufacturing plants. Carbon dioxide is captured from flue gases after combustion of fossil fuel at power stations or other large point sources. Postcombustion capture is most popular in research because existing fossil fuel power plants can be retrofitted to include CCS technology in this configuration (Sumida et al., 2012).
• precombustion: This applies to the majority of biofuels and chemical industry. There are several advantages and disadvantages compared to conventional postcombustion CC. The
• oxy-fuel: The fuel is burned in oxygen instead of air in order to obtain an almost pure carbon dioxide stream that can be transported to the sequestration site or reused. The cement industry is considered one of the most promising application fields for deploying this technology.
By contrast, the other category of CC process is specified for the nonconcentrated carbon emission, typically involving transportation (including aviation) and other fugitive emissions, e.g., the emission to the atmosphere due to incomplete absorption/adsorption of conventional carbon capture technologies. These emissions are not supposed to be capturable except via natural carbon sinks (biomass) or DAC (direct air capture). As an emerging technology, the latter is commonly as much as 3–5 times that of conventional CC technologies.
Following carbon capture, either CCS or CCU should be applied. Carbon storage implies deposing the captured
Different from carbon storage, carbon utilization consists in making use of the captured
3.2.4. CO2-to-X
In the context of the energy system decarbonization,
• Methanation: Methanation is a catalytic conversion process through which,
Methanation requires moderate temperatures (in the range of 250C–350°C) and pressures as high as 20–25 bars. As the reaction makes use of a catalyst to aid with the conversion, the latter usually being nickel or cobalt, it is evident that the input streams must be rid of any impurities such as sulfur and hydrocarbons that could poison the catalyst either by deactivation or by coke deposit.
•
•
•
Both ethylene and propylene constitute chemicals that mainly represent building blocks for subsequent synthesis of polymers widely used in the plastics industry, namely, polyethylene and polypropylene, respectively, or raw materials for the production of other chemicals such as acetic acid. In this study, acetic acid can be either produced through either ethylene cracking or more directly, from carbonylation of methanol. Methanol itself can also be transformed into a mixture of aromatics, mostly benzene and toluene as well as a blend of xylenes (dominated by o- and p-xylene). The latter conversion process serves as a method of synthesizing the aforementioned aromatics directly from captured
3.2.5. Carbon Flows
As stated, carbon flows with in-depth penetration of biomass and
• biogenic carbon inputs lead to at maximal net-zero emission; negative emission could be realized in the presence of BECCS.
• nonbiogenic carbon inputs result in at least net-zero emission. In reality, it is impossible to realize 100% carbon capture and as a result, nonbiogenic carbon emission keeps always positive.
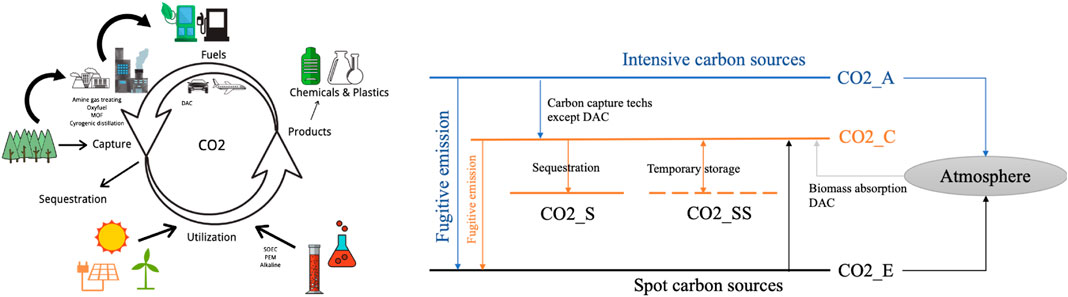
FIGURE 2. Carbon flow modeling (A) circular carbon flow in energy systems, (B) modeling concept of
In Energyscope, the carbon balance is handled by the
•
•
•
•
•
Figure 2 illustrates the relationship of the
where
As illustrated in the Figure 2B, the captured
which reflects the carbon balance of carbon sources and sinks, where the inputs stem from all carbon capture technologies
where
4. Historical Data and Assumptions ON Swiss Energy System
4.1. Demand
Figure 3 illustrates the historical EUD in Switzerland and defines three scenarios according to JASM (2020): scenario REF representing the base scenario; scenarios HIGH and LOW depicting the high- and low-energy demands in respective sectors. This article adopts the scenario REF as the base scenario for analysis.
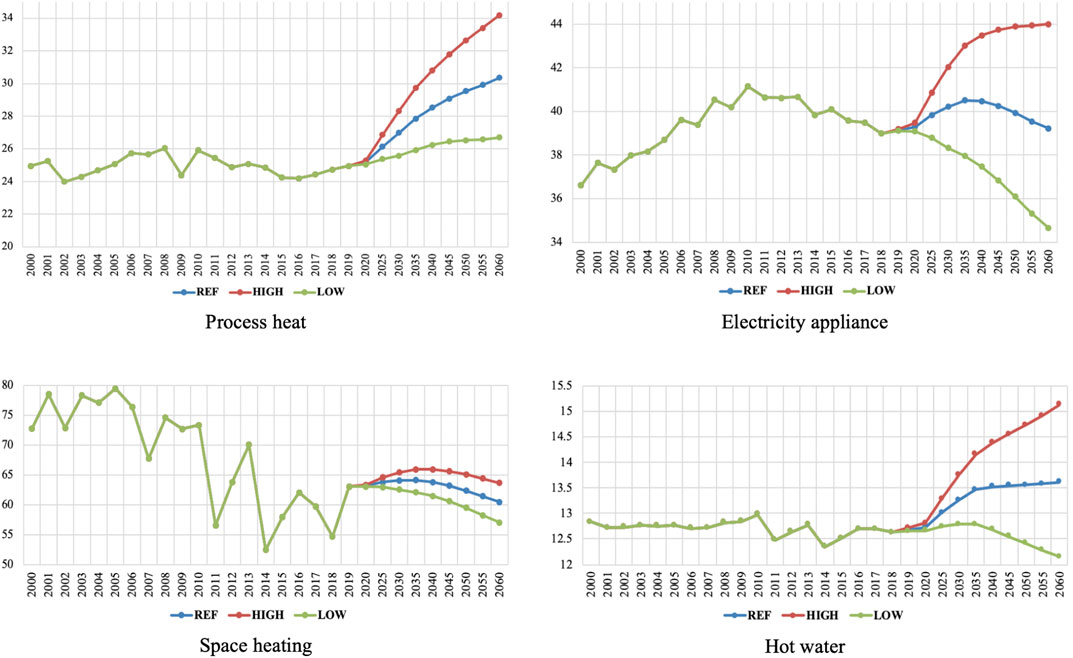
FIGURE 3. History and projection of Swiss energy demand (TWh) for process heat, electricity appliance, space heating, and hot water in three scenarios.
Additionally, plastics and chemicals demands are integrated into EUD (Figure 4) in order to have a holistic view on the carbon flow chains. It is assumed that the demands for chemicals and plastics in 2050 keep the same as 2017 due to a trade-off between increasing population and recycling rate. Intermediate products include ethane, ethylbenzene, benzene, propylene, ethylene, styrene, p-xylene, and toluene.
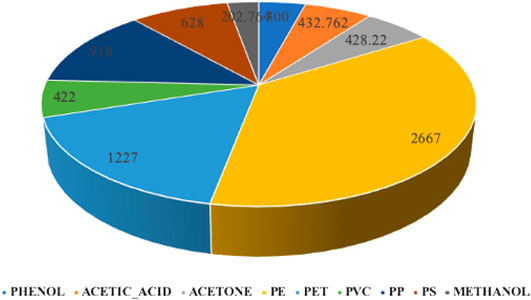
FIGURE 4. Chemicals and plastics demand (GWh) of Switzerland, 2017.
Transportation accounts for more than 1/3 of final energy consumption in the current Swiss system. The passenger and freight demand (excluding aviation) in 2050 are estimated to be 140,300 Mpkm (million passenger kilometer) and 39,700 Mtkm (million ton kilometer), respectively (Stadler et al., 2019). In terms of aviation, we distinguish the short-distance and long-distance flight, and estimate the demand via Eq. 29:
where the r represents the share of flight category for short distance (within Europe) and long distance (outside Europe) in the flight set
4.2. Current Energy Mix
As a country lacking fossil fuels, the current energy supply of Switzerland depends predominantly on imports. Petroleum products and natural gas accounted for approximately 60% in the energy mix. In the power sector, hydro power dominated with around 50% share, and wind and PV were developing rapidly [PV production in 2018 was roughly 40 times the value in 2008 according to BFE (2018a)]. First, we applied Energyscope on the energy system of Switzerland in 2017 for calibration. From the corresponding results shown in Figure 5, the renewable penetration accounted for around 30% in the Swiss FEC mix, associated with carbon emissions from fossil and nonfossil fuels 40.7 and 10.0 Mt/y, respectively.
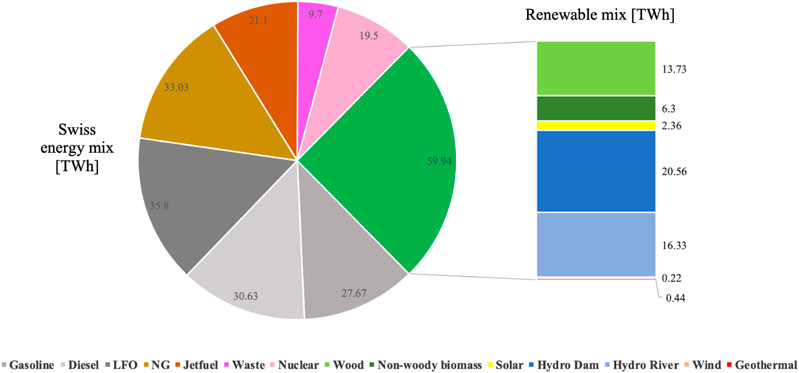
FIGURE 5. Swiss final energy consumption in 2017.
5. Decarbonization Scenarios
5.1. Scenario Definition
This section focuses on two issues: 1) Is it possible to realize carbon neutrality in 2050 for Switzerland? 2) If yes, what does the optimal energy system look like? First, the ϵ value of
• scenario a: allowing the utilization of fossil fuels
• scenario b: banning the utilization of fossil fuels
Additionally, electricity import is prohibited within both scenarios in order to realize power autonomy. The availability for wood, wet biomass, and plants (crops) follow the definition in Table 2. PV potential varies in literature: according to SFOE (2019), Swiss roofs and facades have the potential to generate 67 TWh of electricity per year, where 50 TWh is estimated from roofs larger than 10 m2, and 17 TWh from walls for at least 20 m2 average exposure to excellent sunlights with hypothesis that 45–60% of their surfaces can be covered with PV panels. Assouline et al. (2016) indicated the PV power production for urban areas in Switzerland in 2050 was expected to reach about 32 TWh. In this article, the maximal installed capacity of PV panels in Switzerland in 2050 is set to be 40 GW. Compared to the solar energy, the development potential for wind is limited and estimated to be 4.4 GW (BFE, 2018b) in 2050. Table 3 lists the key assumptions in the scenarios.
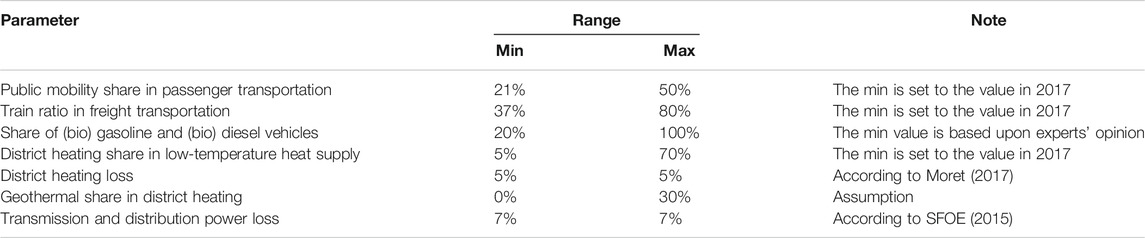
TABLE 3. Assumptions in Energyscope.
In Energyscope, imported resources are regarded as nonstorable due to techno-economic consideration, implying “import only when needed”. Domestic fuel products, such as hydrogen from electrolysis, are assumed to be storable. In the following paragraphs, the results of scenarios a and b are analyzed, respectively, with further discussion in Section 5.3.
5.2. Results
5.2.1. Net-Zero Emission With Fossil Fuels
The Sankey diagram in Figure 6 illustrates the optimal carbon flows of the considered energy system with fossil fuel utilization. The width of the arrow is proportional to the amount of carbon flow expressed as
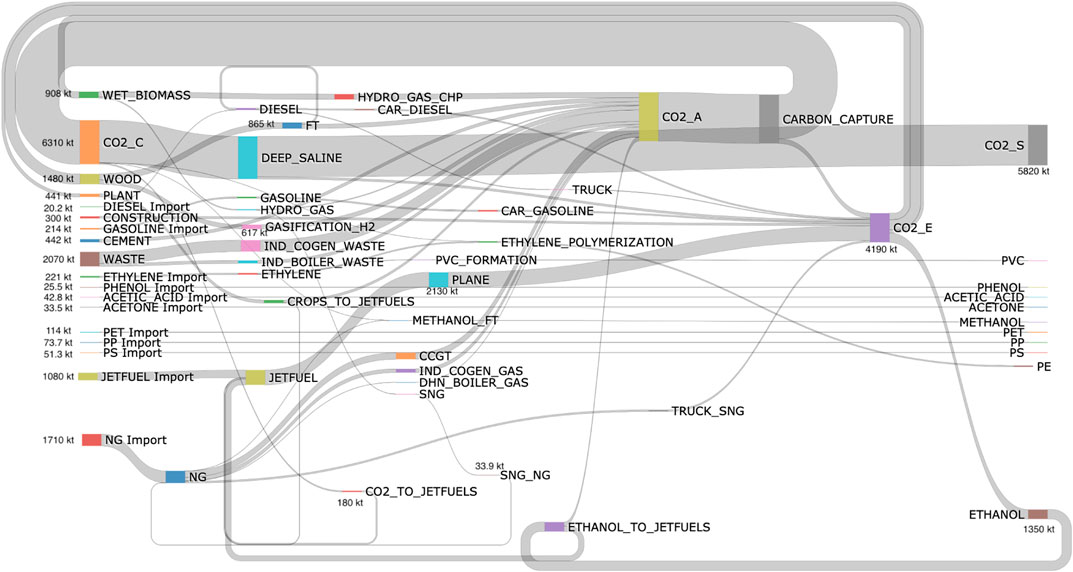
FIGURE 6. Annual carbon flow (kt-C) in a net-zero-emission system with fossil fuel import.
In terms of nonbiogenic carbon, natural gas import in this scenario amounts to 31.64 TWh/y, approximately the same level as today (33 TWh): the majority (84%) is used for power and heat supply, while 15% serves for transportation and the remaining part is transformed to methanol. Nonbiogenic waste is predominantly incinerated in combined heat and power plants. As the most important energy carriers, the two sources contribute to 3,780 kt-C/y. Other nonbiogenic carbon sources stem mainly from jet-fuel (excluding the biogenic part coming from ethanol upgrading), construction, and cement industry, as well as a small part of gasoline and diesel. The significant drop in fuel consumption results principally from deep electrification in the mobility sector. As for biogenic carbon, the saturation of domestic biomass sustainability is witnessed, translated to 2,829 kt-C/y contributing 27.2 TWh/y to the energy system. Wood is largely converted to hydrogen and diesel, while wet biomass is all consumed by hydrothermal gasification for producing synthetic natural gas. Plants are in majority converted to jet-fuel (441 kt-C/y) via fermentation processes.
Based upon the optimization results, chemicals and plastics depend mainly on import, except PVC, PE, and methanol, which could be synthesized from intermediate materials. 3% of the captured carbon (
5.2.2. Net-Zero Emission Without Fossil Fuels
Scenario b aims at decarbonizing the energy system without importing fossil fuels. Similarly, biomass is fully exploited and the majority of biogenic carbon is converted to biogas and liquid biofuels. Waste serves as a major source for nonbiogenic carbon. With regard to the carbon sinks, CCS declines to 3,744 kt-C/y from 5,820 kt-C/y in scenario a, while CCU climbs due to the production of diesel (766 kt-C/y) and jet-fuel 663 kt-C/y, as well as plastics (8 kt-C/y). The results demonstrate the dominance of CCS as the major negative emission technology and the principal role of CCU as clean fuel supplier.
In Figure 9, the annual natural gas storage level is represented via the loop NG
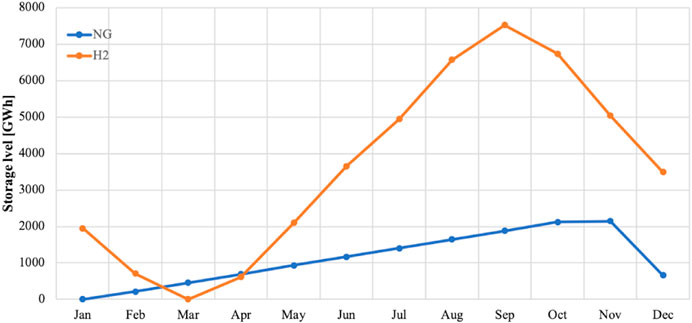
FIGURE 7. Seasonal storage levels of natural gas and hydrogen (GWh).
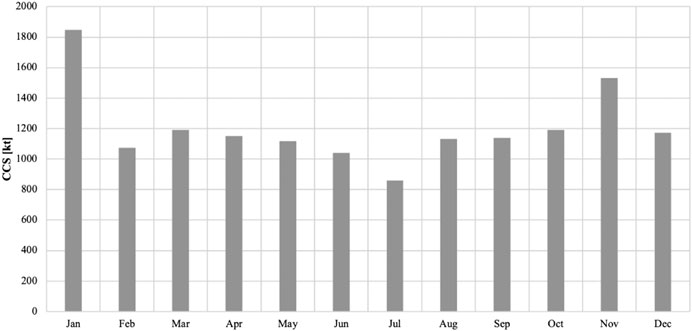
FIGURE 8. Monthly carbon sequestration (kt-CO2).
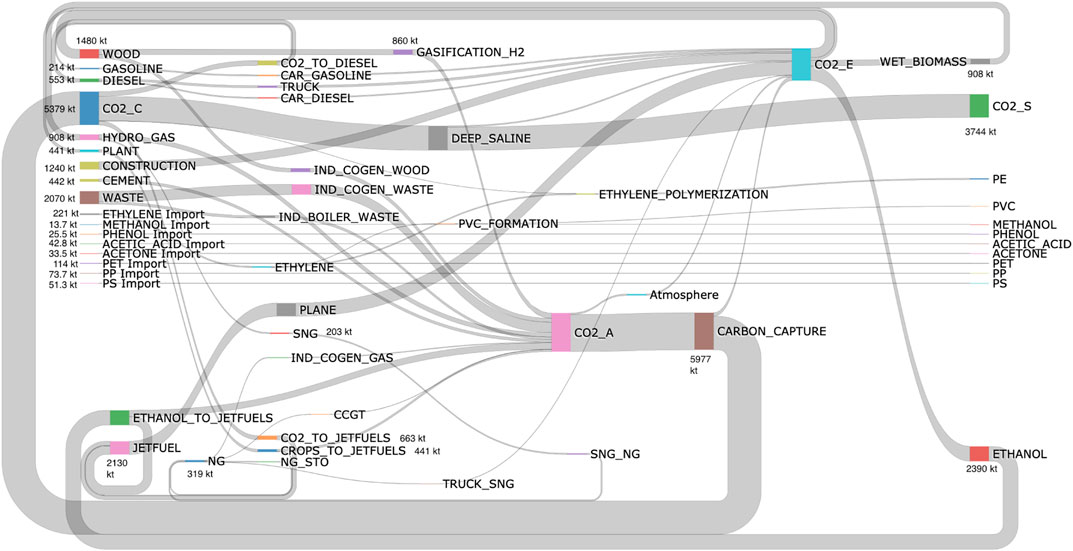
FIGURE 9. Annual carbon flow (kt-C) in a fossil-fuel-free and net-zero-emission system.
Based upon the modeling results, a massive penetration of renewables is obligatory for realizing carbon neutrality: Figure 10 reflects the output of renewable technologies (positive value) as well as electrolysis (negative value). Biomass is not included here since it is mainly used for fuel production as discussed previously. An obvious positive correlation is observed between electrolysis and the renewable power outputs, especially the intermittent renewables (PV and wind). Hydropower accounts for nearly half of the total renewable outputs and is distributed relatively uniformly among the months. In summer, PV and hydro contribute approximately the same amount of power to the system. Geothermal is predominantly used for heat supply in cold seasons.
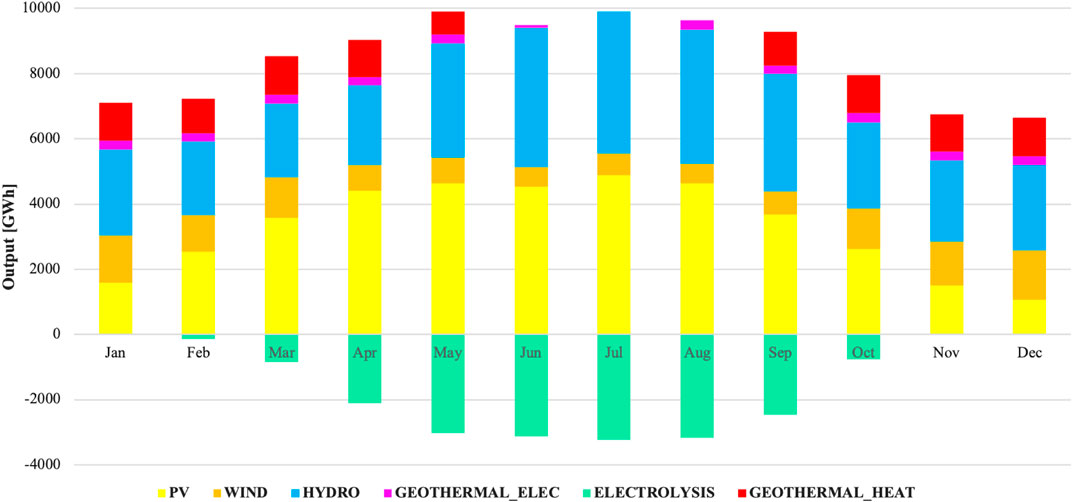
FIGURE 10. Monthly production of renewables.
5.3. Discussion
Table 4 summarizes the key findings on the carbon flows from the two scenarios. In the presence of fossil fuels, CCS is deployed on a large scale with limited CCU due to the relatively lower cost of imports than domestic production. Phasing out fossil fuels results in an explicit increase for CCU and a decline for CCS as a result of the deficit for fuels. CCU is capable of shifting emissions among different technologies and in different periods due to seasonal storage, which is yet not able to directly mitigate the anthropogenic carbon emission by nature, except the small part in plastics synthesis. However, CCU results in a steep decline of nonbiogenic carbon entering the energy system by providing alternative e-fuels and biofuels. From this perspective, all the carbon emissions stem originally from “above the ground” and circulate internally, implying no carbon accumulation in the energy system. Despite an increase of the total cost around 3.3 billion CHF/y, scenario b is considered more radical in terms of realizing fossil-free society and diminishing the overdependence on CCS, which may result in unexpected geologic impacts. It should be highlighted that the total cost of the energy system is of large uncertainty depending predominantly on the specific investment and operational costs for the considered resources and technologies, which was discussed in the previous studies (Moret et al., 2017; Li et al., 2019). The results in this article are based upon the EUD projection in 4.1, which could be further reduced by energy efficiency improvement, for instance, building renovation and innovative industrial process design, as well as lifestyle change, such as substitution of private cars by increasing bicycles. All these effective measures contribute to the acceleration of the decarbonization process and by consequence, reinforcing the plausibility of the realization of carbon neutrality illustrated in this study.
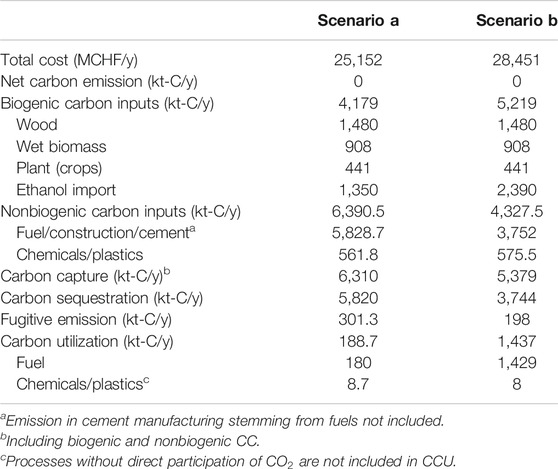
TABLE 4. Scenario comparison.
Concerning the limitations of this research: The infrastructures in the energy system are not fully modeled, e.g., the pipelines for hydrogen. In addition, the emission factors for each technology during construction in the future are based upon the present values that are supposed to decline due to the intensification of carbon mitigation. In terms of CCS, this model reports the amount of
6. Conclusion
This article comes up with a systematic methodology of modeling carbon flows in a complex energy system in favor of sustainable strategy decisions for the long-term energy transition toward a carbon-neutral society. It proposes an optimization approach for solving the complex carbon loop issues emerging from the massive penetration of renewables and CCUS technologies. Results demonstrate that a radical reformulation of the current energy system is obligatory, where the participation of biomass is indispensable. By quantifying the carbon flows among various sources and sinks, this article depicts the optimal configurations of the Swiss energy system in terms of techno-economic consideration, concluding the following:
• for nonbiogenic carbon: CCS serves as an absolute carbon sink in offsetting the nonbiogenic carbon inputs;
• for biogenic carbon: CCU with biogenic carbon sources strengthens the coupling of the whole system via power-to-X and energy storage, with net-zero (even negative) carbon emission.
In terms of Switzerland, biomass-based plants, waste incineration, and cement industry are the key areas for the deployment of carbon capture technologies. Although the applied case study is based on Switzerland, the modeling approach presented by this article is generic and applicable to different energy systems of different scales.
Data Availability Statement
The original contributions presented in the study are included in the article/Supplementary Material, and further inquiries can be directed to the corresponding author.
Author Contributions
XL for modeling, results analysis, and writing. TD for data management. SM for initial conceptual development of the modelling framework. The others for data collection and review.
Funding
The research work for this paper was financially supported by the Swiss Competence Center for Energy Research - Joint Activity Scenario Modeling (JASM). The research work for this paper was financially supported by the Swiss Competence Center for Energy Research - Biomass for Swiss Energy Future (BIOSWEET). The research work for this paper was financially supported by the Swiss National Science Foundation, the Swiss Federal Office of Energy as well as the Federal Office for the Environment. SM acknowledges partial support from the Swiss National Science Foundation (SNSF) under Grant no P2ELP2_188028.
Conflict of Interest
The authors declare that the research was conducted in the absence of any commercial or financial relationships that could be construed as a potential conflict of interest.
Supplementary Material
The Supplementary Material for this article can be found online at: https://www.frontiersin.org/articles/10.3389/fenrg.2020.549615/full#supplementary-material
References
Ackerman, F., Ishikawa, M., and Suga, M. (2007). The carbon content of Japan–US trade. Energy Pol. 35, 4455–4462. doi: 10.1016/j.enpol.2007.03.010
Aichele, R., and Felbermayr, G. (2010). Kyoto and the carbon content of trade. Stuttgart, Germany: Hohenheim University, Vol. 69.
Assouline, D., Mohajeri, N., and Scartezzini, J. L. (2016). Solar photovoltaic electricity potential for Switzerland—SCCER FEEB&D. Available at: https://www.sccer-feebd.ch/solar-photovoltaic-electricity-potential-for-switzerland/[Dataset] (Accessed January 10, 2020).
BFE (2018a). Gesamtenergiestatistik, Bundesamt für Energie. Available at: https://www.bfe.admin.ch/bfe/de/home/versorgung/statistik-und-geodaten/energiestatistiken/gesamtenergiestatistik.html[Dataset].
BFE (2018b). Office fédéral de l’énergie - storymap Installations éoliennes. Available at: https://www.uvek-gis.admin.ch/BFE/storymaps/EE_WEA/index.php?lang=fr[Dataset].
Braune, A., Geiselmann, D., Oehler, S., and Ruiz Durán, C. (2019). Implementation of the DGNB framework for carbon neutral buildings and sites. IOP Conf. Ser. Earth Environ. Sci. 290, 012040. doi: 10.1088/1755-1315/290/1/012040
Bryngelsson, M., and Westermark, M. (2009). CO2 capture pilot test at a pressurized coal fired CHP plant. Energy Procedia 1, 1403–1410. doi: 10.1016/j.egypro.2009.01.184
Bui, M., Adjiman, C. S., Bardow, A., Anthony, E. J., Boston, A., and Brown, S. (2018). Carbon capture and storage (CCS): the way forward. Energy Environ. Sci. 11, 1062–1176. doi: 10.1039/C7EE02342A
Burg, V., Bowman, G., Erni, M., Lemm, R., and Thees, O. (2018). Analyzing the potential of domestic biomass resources for the energy transition in Switzerland. Biomass Bioenergy 111, 60–69. doi: 10.1016/j.biombioe.2018.02.007
Celebi, A. D., Ensinas, A. V., Sharma, S., and Maréchal, F. (2017). Early-stage decision making approach for the selection of optimally integrated biorefinery processes. Energy 137, 908–916. doi: 10.1016/j.energy.2017.03.080
Chen, B., Yang, Q., Zhou, S., Li, J. S., and Chen, G. Q. (2017). Urban economy’s carbon flow through external trade: spatial-temporal evolution for Macao. Energy Pol. 110, 69–78. doi: 10.1016/j.enpol.2017.08.010
Chen, S., and Chen, B. (2017). Coupling of carbon and energy flows in cities: a meta-analysis and nexus modelling. Appl. Energy 194, 774–783. doi: 10.1016/j.apenergy.2016.10.069
Chevalier, G., Diamond, L. W., and Leu, W. (2010). Potential for deep geological sequestration of CO2 in Switzerland: a first appraisal. Swiss J. Geosci. 103, 427–55. doi: 10.1007/s00015-010-0030-4.
Commission Européenne and Direction Générale de la Mobilité et des Transports (2016). EU energy, transport and GHG emmissions: trends to 2050: reference scenario 2016 (Luxembourg: Office for Official Publications of the European Communities).
Creutzig, F., Ravindranath, N. H., Berndes, G., Bolwig, S., Bright, R., and Cherubini, F. (2015). Bioenergy and climate change mitigation: an assessment. GCB Bioenergy 7, 916–944. doi: 10.1111/gcbb.12205
Dahiya, S., Kumar, A. N., Shanthi Sravan, J., Chatterjee, S., Sarkar, O., and Mohan, S. V. (2018). Food waste biorefinery: sustainable strategy for circular bioeconomy. Bioresour. Technol. 248, 2–12. doi: 10.1016/j.biortech.2017.07.176
Dean, C. C., Blamey, J., Florin, N. H., Al-Jeboori, M. J., and Fennell, P. S. (2011). The calcium looping cycle for CO2 capture from power generation, cement manufacture and hydrogen production. Chem. Eng. Res. Des. 89, 836–855. doi: 10.1016/j.cherd.2010.10.013
Gorre, J., Van Leeuwen, C., and Ortloff, F. (2018). “Innovative large-scale energy storage tech- nologies and power-to-gas concepts after optimisation: store&GO D8.6: report on the optimal time profile and operation of the conversion technology during a representative year,” in The perspective of the available storage capacities. STORE&GO Technical Rep. EU-H2020.
Gounand, I., Little, C. J., Harvey, E., and Altermatt, F. (2018). Cross-ecosystem carbon flows connecting ecosystems worldwide. Nat. Commun. 9, 1–8. doi: 10.1038/s41467-018-07238-2
Hannula, I., and Reiner, D. (2017). The race to solve the sustainable transport problem via carbon-neutral synthetic fuels and battery electric vehicles. Cambridge, UK: University of Cambridge. Working paper. doi: 10.17863/CAM.17544
IPCC (Editor) (2014). Climate change 2014: mitigation of climate change: working group III contribution to the fifth assessment report of the intergovernmental panel on climate change (New York, NY: Cambridge University Press)
JASM (2020). Database: the joint activity scenarios and modelling (JASM). Available at: https://sccer-jasm.ch/[Dataset].
Leeuwen, C., and Zauner, A. (2018). Innovative large-scale energy storage technologies and power-to-gas concepts after optimisation, STORE&G D8.3, report on the costs involved with PtG technologies and their potentials across the EU. STORE&GO Technical Rep. EU-H2020
Li, X., Moret, S., Baldi, F., and Marechal, F. (2019). Are renewables really that expensive? The impact of uncertainty on the cost of the energy transition. Comput. Aided Chem. Eng. 46, 1753–1758. doi: 10.1016/B978-0-128-18634-3.50293-9
Limpens, G., Moret, S., Jeanmart, H., and Maréchal, F. (2019). EnergyScope TD: a novel open-source model for regional energy systems. Appl. Energy 255, 113729. doi: 10.1016/j.apenergy.2019.113729
Madsen, J. S., Bach, L., Knudsen, K. B., Sørensen, M., and Holbech, C. (2018). From policy to action, state of green. State of Green Technical report.
Markard, J., Suter, M., and Ingold, K. (2016). Socio-technical transitions and policy change – advocacy coalitions in Swiss energy policy. Environ. Innovat. Soc. Trans. 18, 215–237. doi: 10.1016/j.eist.2015.05.003
Michel, L. (2012). “Complémentarité entre plusieurs ressources énergétiques pour une même prestation,” in Le Cas Du Réseau de Chauffage à Distance de Lausanne. PhD thesis. Geneve: Université de Geneve.
Moret, S., Codina Gironès, V., Bierlaire, M., and Maréchal, F. (2017). Characterization of input uncertainties in strategic energy planning models. Appl. Energy 202, 597–617. doi: 10.1016/j.apenergy.2017.05.106
National Academies of Sciences, Engineering and Medicine (2018). Bioenergy with carbon capture and storage approaches for carbon dioxide removal and reliable sequestration: proceedings of a workshop—in brief. Washington, DC: The National Academies Press. doi: 10.17226/25170
NLTimes (2017). New Dutch government’s plans for the coming years. Available at: https://nltimes.nl/2017/10/10/new-dutch-governments-plans-coming-years [Dataset].
Peduzzi, E. (2015). Biomass to liquids: thermo-economic analysis and multi-objective optimisation. PhD thesis. Paris: EPFL.
Pfeffer, M., Wukovits, W., Beckmann, G., and Friedl, A. (2007). Analysis and decrease of the energy demand of bioethanol-production by process integration. Appl. Therm. Eng. 27, 2657–2664. doi: 10.1016/j.applthermaleng.2007.04.018
Ramaswami, A., Chavez, A., Ewing-Thiel, J., and Reeve, K. E. (2011). Two approaches to greenhouse gas emissions foot-printing at the city scale. Environ. Sci. Technol. 45, 4205–4206. doi: 10.1021/es201166n
Rinscheid, A., and Wüstenhagen, R. (2019). Germany’s decision to phase out coal by 2038 lags behind citizens’ timing preferences. Nature Energy 4, 856–863. doi: 10.1038/s41560-019-0460-9
Santibañez-Aguilar, J. E., González-Campos, J. B., Ponce-Ortega, J. M., Serna-González, M., and El-Halwagi, M. M. (2011). Optimal planning of a biomass conversion system considering economic and environmental aspects. Ind. Eng. Chem. Res. 50, 8558–8570. doi: 10.1021/ie102195g
SAPEA (2018). Novel carbon capture and utilisation technologies. Technical report. Science Advice for Policy by European Academies.
Schiffer, Z. J., and Manthiram, K. (2017). Electrification and decarbonization of the chemical industry. Joule 1, 10–14. doi: 10.1016/j.joule.2017.07.008
SECO (2020). Staatssekretariat für Wirtschaft SECO. Available at: https://www.seco.admin.ch/seco/de/home.html [Dataset].
SFOE (2019). Les toits et les façades des maisons suisses pourraient produire 67 TWh d’électricité solaire par an. Available at: https://www.bfe.admin.ch/bfe/fr/home/actualites-et-medias/communiques-de-presse/mm-test.msg-id-74641.html[Dataset].
SFOE, (2020). What is the energy strategy 2050? Available at: https://www.bfe.admin.ch/bfe/en/home/politik/energiestrategie-2050/was-ist-die-energiestrategie-2050.html [Dataset].Google Scholar
Smith, P. (2016). Soil carbon sequestration and biochar as negative emission technologies. Global Change Biol. 22, 1315–1324. doi: 10.1111/gcb.13178
Spaargaren, G., and Mol, A. P. J. (2013). Carbon flows, carbon markets, and low-carbon lifestyles: reflecting on the role of markets in climate governance. Environ. Polit. 22, 174–193. doi: 10.1080/09644016.2013.755840
Stadler, Z., Meier, B., Friedl, M., Damartzis, T., Moret, S., and Li, X. (2019). Carbon flows in the energy transition. Technical report. Swiss Federal Office of the Environment.
Starr, F. (2009). Integrated gasification combined cycle for carbon capture & storage. Claverton Group Conference December 3, 2019. Available at: https://claverton-energy.com/integrated-gasification-combined-cycle-for-carbon-capture-storage.html.
Suciu, R., Girardin, L., and Maréchal, F. (2018). Energy integration of CO2 networks and power to gas for emerging energy autonomous cities in Europe. Energy 157, 830–842. doi: 10.1016/j.energy.2018.05.083
Sumida, K., Rogow, D. L., Mason, J. A., McDonald, T. M., Bloch, E. D., and Herm, Z. R. (2012). Carbon dioxide capture in metal–organic frameworks. Chem. Rev. 112, 724–781. doi: 10.1021/cr2003272
Keywords: carbon neutrality, carbon capture, use, and storage, circular carbon flow, energy planning, biogenic energy with carbon capture, mixed-integer linear programming optimization
Citation: Li X, Damartzis T, Stadler Z, Moret S, Meier B, Friedl M and Maréchal F (2020) Decarbonization in Complex Energy Systems: A Study on the Feasibility of Carbon Neutrality for Switzerland in 2050. Front. Energy Res. 8:549615. doi: 10.3389/fenrg.2020.549615
Received: 06 April 2020; Accepted: 28 September 2020;
Published: 16 November 2020.
Edited by:
Rangan Banerjee, Indian Institute of Technology Bombay, IndiaReviewed by:
Xiaofeng Guo, ESIEE Paris, FranceRajagopalan Srinivasan, Indian Institute of Technology Madras, India
Copyright © 2020 Li, Damartzis, Stadler, Moret, Meier, Friedl and Maréchal. This is an open-access article distributed under the terms of the Creative Commons Attribution License (CC BY). The use, distribution or reproduction in other forums is permitted, provided the original author(s) and the copyright owner(s) are credited and that the original publication in this journal is cited, in accordance with accepted academic practice. No use, distribution or reproduction is permitted which does not comply with these terms.
*Correspondence: Xiang Li, eGlhbmcubGlAZXBmbC5jaA==