 Yoshiharu Mukouyama1,2*
 Shuji Nakanishi2,3*
- 1Division of Science, College of Science and Engineering, Tokyo Denki University, Hatoyama, Japan
- 2Research Center for Solar Energy Chemistry, Osaka University, Toyonaka, Japan
- 3Graduate School of Engineering Science, Osaka University, Toyonaka, Japan
The local pH value at an electrochemical interface (pHs) inevitably changes during redox reactions involving the transfer of H+ or OH− ions. It is important to quantitatively estimate pHs during polarization, as this parameter has a significant impact on the activity and selectivity of electrochemical reactions. Numerical simulation is an effective means of estimating pHs because it is not subject to experimental constraints. As demonstrated in a number of studies, pHs can be estimated by solving partial differential equations that describe diffusion process. In the present work, we propose a method to consider the process by using ordinary differential equations (ODEs), which can significantly reduce the computational resources required for estimating pHs values. In the ODE-based model, the description of the diffusion process was achieved by considering the reaction plane in the diffusion layer over which the H+ and OH− concentrations are balanced while assuming that the concentration profiles in the layer are in a steady state. The resulting model successfully reproduces experimental voltammograms characterized by local pH changes in association with the hydrogen evolution and hydrogen peroxide reduction reactions.
Introduction
Electrochemical interfaces are regions in which electrical energy is directly converted to chemical energy or vice versa. Many important reactions closely related to energy and environmental issues, including hydrogen evolution/oxidation, oxygen reduction/evolution, carbon dioxide reduction, nitrate reduction and organic oxidation reactions, involve the transfer of H+ and OH− ions, which inevitably changes the electrode surface pH (pHs). As a consequence, the pHs can be more than 3 units different from the bulk pH (pHb) even in a buffered electrolyte. This modification of pHs can be particularly pronounced in the case that the current density is increased as a result of the use of gas diffusion or roughened/porous electrodes (Sen et al., 2014; Hall et al., 2015; Ma et al., 2016; Yoon et al., 2016; Yang et al., 2017; Song et al., 2019). Interestingly, the pHs value determines both the kinetics and thermodynamics of various reactions, and thus affects the activity and selectivity of such processes. Therefore, it is important to determine pHs during electrochemical polarization so as to understand and design electrocatalysts.
The pHs value can be experimentally obtained in some specific cases. As an example, the reaction activity and selectivity are known to depend on pH during electrochemical carbon dioxide reduction (Kas et al., 2015; Singh et al., 2015; Singh et al., 2016; Varela et al., 2016; Billy and Co, 2017; Ooka et al., 2017). Thus, pHs can be quantified by monitoring the ratio of CO32− to HCO3− (which will vary with pH) using attenuated total reflectance surface-enhanced infrared absorption spectroscopy (Ayemoba and Cuesta, 2017; Dunwell et al., 2018). A rotating ring-disc electrode assembly can also be used to determine pHs if the electrochemical activities of reaction intermediates and/or products vary with pH (Zhang and Co, 2020). Even if a system does not exhibit these specific characteristics, pHs may still be found by using pH probes together with appropriate analytical techniques. Deligianni and Romankiw developed an in-situ technique for measuring pHs during Ni and NiFe electrodeposition on a gold mesh cathode. The technique made use of a flat-bottomed glass pH electrode positioned at the back of the cathode (Deligianni and Romankiw, 1993). Ji et al. modified this useful technique to conduct a further study of the Ni electrodeposition (Ji et al., 1995). Ryu et al. established the pHs values associated with the hydrogen oxidation reaction by adding cis-2-butene-1,4-diol, which undergoes pH-dependent selective conversions to 1,4-butandiol (at higher pH) or n-butanol (at lower pH), to the reaction system (Ryu et al., 2018). Some groups demonstrated the spatiotemporal visualization of changes in pHs based on the use of pH-responsive fluorescent dyes in conjunction with laser scanning confocal microscopy (Suzurikawa et al., 2010; Leenheer and Atwater, 2012; Fuladpanjeh-Hojaghan et al., 2019).
Another effective approach to the quantitative estimation of pHs is to conduct a numerical simulation, which has the added benefit of being free from experimental constraints. As an example, Mayrhofer’s group established the fundamental physicochemical relationship between current density and the total diffusive flux of ions within a diffusion layer (Auinger et al., 2011; Katsounaros et al., 2011). In this prior work, increases in pHs during the hydrogen evolution reaction (HER) were estimated from the current density, and the electrode potential was calculated by substituting the calculated pHs values into the Nernst equation. This same study also calculated ion distributions in the diffusion layer. Carneiro-Neto et al. also simulated the HER based on the Volmer-Tafel (V-T) and Volmer-Heyrovský mechanisms, in which the pHs change during reactions was taken into consideration (Carneiro-Neto et al., 2016). In this work, equations were solved numerically employing a finite element method. Grozovski et al. studied the HER on a Ni rotating disc electrode in unbuffered electrolyte solutions with mildly acidic pH values (Grozovski et al., 2017) and also conducted finite element simulations, assuming that the concentration profiles of H+ and OH− ions were stationary during the HER. These simulations indicated that OH− ions could have an infinite diffusion rate.
pHs values can be simulated by solving mathematical equations representing diffusion process. When the diffusion process is described as a function of several independent variables, a numerical method to solve partial differential equations (PDEs) is required. This approach successfully provides spatial distributions of pHs values (Rudd et al., 2005; Leenheer and Atwater, 2012). To obtain reliable pHs data through numerical simulations, it is essential to accurately represent the possible reactions as differential equations. However, in the case that the system of interest consists of multiple reactions, the number of coupled differential equations inevitably increases, and consequently requires greater computational resources. Herein, we report an alternative method based on ordinary differential equations (ODEs) that can be employed to calculate simulated pHs values. In this simplified model, the introduction of a new parameter that describes the plane in which the H+ and OH− concentrations are balanced (referred to as the “reaction plane”) enables a representation of the temporal variations of pHs using ODEs. This newly developed model is simple, yet it is able to reproduce the essential characteristics of voltammograms that appear due to changes in pHs. In this ODE model, pHs can be predicted simply by establishing the balance between H+ and OH−, even if the reactants and/or products vary in a pHs-dependent manner. In the present work, we demonstrate the validity and generality of this approach by simulating the HER and hydrogen peroxide (H2O2) reduction reaction (HPRR). Notably, our model succeeds in reproducing even the features of the complex HPRR system, in which H2O2 dissociates in a pH-dependent manner (H2O2 ⇌ HO2− + H+; pKa ≈ 11.7).
It should be noted that our model can be regarded as an expansion of the ODE model originally developed by Koper and Sluyters (Koper and Sluyters, 1991). Their model was based both on a Randles-type equivalent circuit (see Figure 3) and on the Nernst diffusion layer model where the concentration profile of electroactive species near the electrode is assumed to be in a steady state. Interestingly, their model can simulate even the essential features of dynamic behavior such as spontaneous current oscillations, because the concentrations of electroactive species at the electrode surface is treated as a time-dependent variable. This is a significant advantage of the model over the calculation performed under steady-state assumption. In our prior works (Mukouyama et al., 1999; Mukouyama et al., 2001; Mukouyama et al., 2015; Mukouyama et al., 2017a), by means of the model, we simulated spontaneous current and potential oscillations as well as cyclic voltammograms. We anticipate that the ODE model developed in the present work will provide valuable insights into dynamic changes of pHs during electrocatalytic reactions.
Materials and Methods
The electrochemical measurements in this work were performed using a three-electrode system at room temperature, in conjunction with a polycrystalline Pt or Ag working electrode (WE). A Pt wire was used as the counter electrode and a saturated mercury–mercurous sulfate electrode (MSE, 0.64 V vs. a standard hydrogen electrode (SHE) at 25°C) was used as the reference electrode. Throughout this paper, all potentials are referred to relative to a SHE.
Results and Discussion
Experimental Results for the Hydrogen Evolution Reaction and Hydrogen Peroxide (H2O2) Reduction Reaction
Here, it is helpful to briefly discuss the electrochemical formation and desorption of hydrogen atoms on a Pt electrode. It is known that there are two types of adsorbed hydrogen atoms: under-potentially-deposited hydrogen (upd-H) and on-top H. These are generated at potentials more positive and negative than the onset potential of the HER, respectively. The corresponding reactions are as follows.
In an acidic medium, the HER is known to proceed via the V-T mechanism (Lamy-Pitara et al., 2000; Schmickler and Santos, 2010; Skúlason et al., 2010), with on-top H as the reaction intermediate. The associated reaction is provided below.
In each of the above equations, ki (i = 1, −1, 2, −2 or 3) is the corresponding rate constant. In contrast, in a basic medium, water molecules are directly reduced via the process in the following reaction.
The onset potential of the HER follows Nernstian behavior (that is, changes according to the ratio −0.059 V/pH) over a wide pH range. The standard redox potentials of the HER in acidic media at pH of 0 and basic media with a pH of 14 are 0 and −0.828 V (vs. SHE), respectively, at 25°C.
Figure 1 presents the I–U curves previously reported for Pt and Ag electrodes in H2SO4 solutions (Mukouyama et al., 2008; Mukouyama et al., 2014). The characteristics of these curves are determined both by the concentration of the H2SO4 solution and by the presence or absence of Na2SO4. In the absence of Na2SO4, the absolute value of the HER current increases linearly as U decreases when the H2SO4 concentration is 0.07 M or higher. However, at lower concentrations (the red curve in Figure 1A), the I–U relationship exhibits a plateau over the potential region between −0.9 and −1.7 V, i.e., the current is almost constant in the region. Our prior work established that this plateau appears because of a limitation related to the diffusion of H+. At more negative potentials (U < −1.7 V), the reduction current again increases as U decreases. Specifically, the limited H+ supply eventually leads to an increase in pHs, which in turn results in the reduction of H2O (as in Eq. 4) at U < −1.7 V.
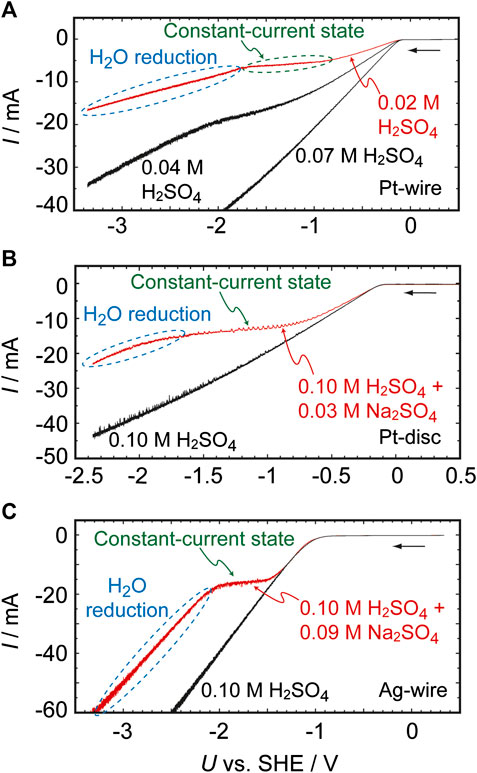
FIGURE 1. Current (I)–potential (U) curves for H2SO4 solutions and H2SO4 + Na2SO4 solutions as obtained under controlled potential conditions at a scan rate of 0.01 V s−1. The working electrodes were (A) a 0.5 mm diameter, 4 mm long Pt wire, (B) a 2 mm diameter Pt disc, and (C) a 0.5 mm diameter, 4 mm long Ag wire.
In the presence of Na2SO4, the plateau effect is observed even in 0.1 M H2SO4 (Figures 1B,C). In addition, the reduction of water occurs at potentials more negative than the potential of the plateau, indicating that the local environment at the electrochemical interface becomes basic even though the bulk electrolyte is strongly acidic (with a pH of approximately 1). It should be noted that, in negative potentials, the curve coincides with that obtained for a 0.1 M NaOH solution, as shown in Supplementary Figure S1. This result clearly indicates that a pHs of approximately 13 is obtained at U = −1.8 V. Significant increases in pHs were also confirmed when other salts, such as Li2SO4 and K2SO4, were added to the electrolyte, and when perchlorate ions are present in the solution instead of (bi)sulfate ions (Supplementary Figure S2). Although the mass transport of H+ to the electrode surface is generally driven by diffusion, convection and electromigration, the migration of H+ is suppressed in the presence of these salts because alkaline metal cations diminish the migration process. For this reason, pHs becomes significantly higher in the presence of these salts. This is strongly supported by the fact that the essentially same behavior is observed when the concentration of the salts is remarkably high, e.g., 0.2 M (Supplementary Figure S3), and hence the migration process is negligible. Importantly, these effects are observed not only on Pt but also with various other metals, including Ag, Au, Cu, Fe, Ni, W, and Zn, providing further evidence that the increase in pHs during these reactions has a physical origin.
It is also helpful to examine the pHs increase during the HPRR with a Pt electrode in an H2SO4 solution (Mukouyama et al., 2017a; Mukouyama et al., 2017b). As shown in Figure 2A, using a solution containing 0.1 M H2SO4 and 0.1 M H2O2 as the electrolyte, the HPRR current begins at 0.75 V and the HER occurs at U = −0.15 V. Because the HPRR proceeds via the potential-independent dissociative adsorption of H2O2 to generate adsorbed OH (Pt-OH) (Eqs. 5 and 6), a constant current flows over the wide potential range of 0.6 to −0.1 V. The associated reactions are provided below.
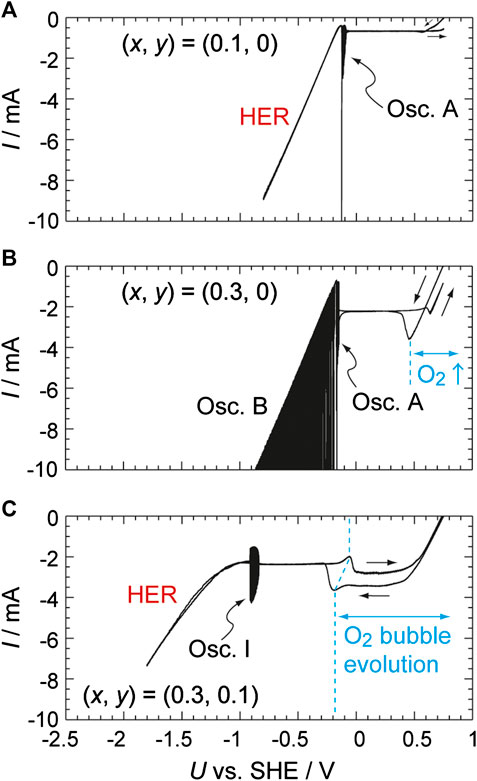
FIGURE 2. I–U curves obtained using a Pt disc electrode (2 mm in diameter) in 0.1 M H2SO4 + x M H2O2 + y M Na2SO4, where (x, y) = (0.1, 0) (0.3, 0) and (0.3, 0.1) going from top to bottom, under controlled potential conditions at a sweep rate of 0.01 V s−1.
The HPRR was suppressed at around −0.1 V by the formation of upd-H, and consequently a current oscillation (named oscillation A) appeared. When the concentration of H2O2 was increased to 0.3 M (Figure 2B), another type of oscillation (named oscillation B) appeared in the potential region of the HER. Note that pHs was still acidic though H+ was efficiently consumed by the HPRR. The mechanisms of the oscillations have been already clarified (Mukouyama et al., 1999; Mukouyama et al., 2001) and these phenomena are not in the scope of the present work.
Just as was the case for the HER data presented in Figure 1, when a sufficient quantity of Na2SO4 is added to the solution (Figure 2C), pHs increases during the HPRR, resulting in the disappearance and appearance of H+ reduction and H2O reduction currents, respectively. Depending on the Na2SO4 concentration, another type of current oscillation (named oscillation I) appeared at around −0.9 V due to the formation of upd-H. Furthermore, since the pKa value of H2O2 is approximately 11.7, the first step of the HPRR is altered as follows.
We have previously demonstrated that the generation of O2 bubbles via the disproportionation reaction of H2O2 leads to hysteresis in the potential region of 0.6 V to −0.2 V. However, because this phenomenon has no relation to the scope of the present work, it is not discussed further in the present work.
Ordinary Differential Equation Modeling
The ion-product constant of water, KW = CHCOH, is 1.0 × 10⁻²⁰ at 25°C, where C is the concentration of each species. In this paper, C is in units of mol cm−3 and the superscripts “s” and “b” when applied to concentrations (that is, CHs and CHb) indicate values at the electrode surface and in the solution bulk, respectively. Note that the value of KW changes to 1.0 × 10⁻¹⁴ if concentration units of mol L−1 are employed. In our earlier work (Mukouyama et al., 2015; Mukouyama et al., 2017a), the experimental results shown in Figure 2A were simulated employing a Randles-type equivalent circuit (Figure 3), just like the original model developed by Koper and Sluyters (1991). The applied potential (U) was treated as a controlled parameter while E was a time-dependent variable. The rate constants for the associated electrochemical reactions, which are functions of the true electrode potential (E), can be described using the Butler-Volmer equations below.
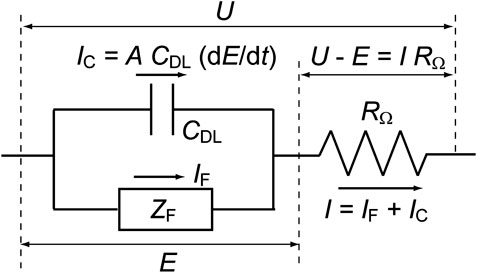
FIGURE 3. The equivalent circuit from which the time dependence of the true electrode potential (dE/dt) is derived. The total current from the electrode (I) is the sum of the Faraday current (IF) and the charging current of the electric double layer at the electrode surface (IC). Here, U is the applied potential, E the true electrode potential, A the electrode area, ZF the Faraday impedance, CDL the double layer capacitance, and RΩ the solution resistance between the working and reference electrodes.
Here, Ei0 is the equilibrium redox potential, ki0 is the rate constant at E = Ei0, αi is the transfer coefficient, n is the number of transferred electrons (with a value of 1), F is the Faraday constant (96,500 C mol−1), R is the gas constant (8.31 J K−1 mol−1), and T is the absolute temperature. The kinetics of the HER based on the V-T mechanism can be expressed using the coverage of on-top H (ΘH) and CHs as time-dependent variables. Hence, the following ODEs can be derived for dE/dt and dΘH/dt.
Here, A is the electrode area, CDL is the double layer capacity, RΩ is the solution resistance between the working and reference electrodes, IF is the Faraday current, and N0 is the total number of surface sites per unit area (2.2 × 10⁻⁹ mol cm−2 for a Pt surface). The HER current is much larger than that due to Reaction 1 (associated with the formation of upd-H and the oxidation of this species), and so the latter process is not included in Eq. 10. It should also be noted that Eqs. 10 and 11 reflect the Nernstian behavior of the HER because it contains CHs (Mukouyama et al., 1999).
When considering the pHs change, both the kinetics at the electrochemical interface and the diffusion process must be taken into account. As an example, Grozovski et al. developed a diffusion layer model that is divided into two regimes for the numerical simulation of the HER on a Ni electrode (Grozovski et al., 2017). These regimes are separated by a reaction plane over which the local concentrations of H+ and OH− (COHs) generated by direct H2O reduction are balanced. In this model, OH− can be present in the region close to the electrode surface whereas H+ is present further away from the surface.
The present simulations aimed to establish an ODE-based model that can estimate increases in pHs and incorporated both the reaction plane concept developed by Grozovski and the conventional Nernst diffusion layer model to simulate diffusion processes for pHs > 7 and pHs ≤ 7, respectively. Based on the fact that the pHs increase is enhanced by limited transportation of H+, as has been described, the following three assumptions are made: (1) the electromigration of ions is neglected, (2) the thickness of the diffusion layer remains constant due to solution convection, and (3) the concentration profiles of H+ and OH− in the layer are linear (i.e., a stationary state is assumed). Note that the third assumption does not require that CHs is constant.
In the case of pHs ≤ 7 (i.e., when CHs ≥ COHs (= Kw/CHs), Figure 4A), the quantity of OH− is negligible and thus the diffusion of H+ to the electrode surface can be simply expressed by the Nernst diffusion layer model. In contrast, at pHs > 7 (i.e., when CHs < COHs, Figure 4B), OH− and H+ ions diffuse to a reaction plane from the electrode surface and from the solution bulk, respectively, and CH and COH are balanced (such that CH = COH =
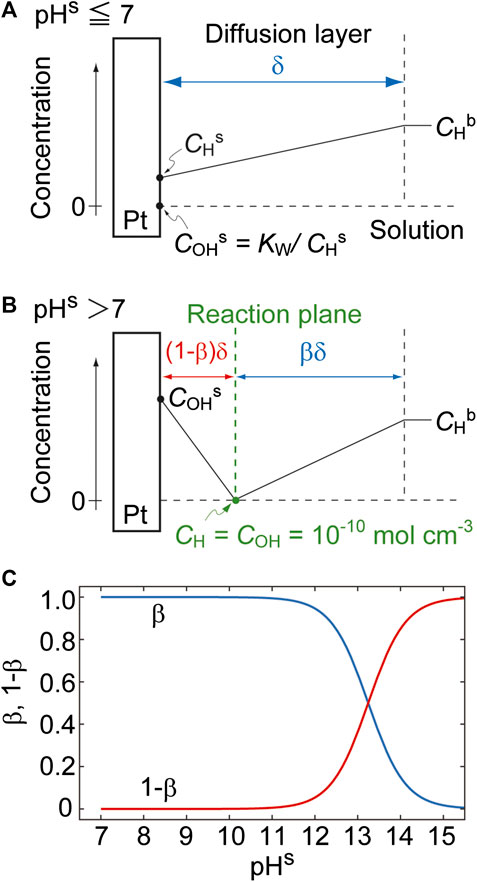
FIGURE 4. The near-surface concentration profiles for (A) pHs ≤ 7 and (B) pHs > 7. (C) The effects of pHs on β and 1 − β with pHb set to 1 (i.e., CHb = 10–4 mol cm−3).
Here, DH is the diffusion coefficient of H+ (9.31 × 10⁻⁵ cm2 s−1) and DOH that of OH− (5.30 × 10⁻⁵ cm2 s−1). From Eq. 12, β and its derivative with respect to CHs,
Figure 4C shows the effect of pHs on β and 1 − β for a pHb value of 1. As expected, the thicknesses of the OH− (red curve) and H+ (blue curve) regions increase and decrease with increases in pHs, respectively. Note that β is defined at pHs > 7.
The derivative of CHs with respect to time, dCHs/dt, can be derived by considering a small change in the amount of H+ in the diffusion layer. Assuming a stationary state, such changes can be considered equivalent to the area of the shaded triangles in Figure 5, where ΔCHs and ΔCOHs indicate small increases in CHs and COHs over a short time interval, Δt, respectively. In the case that pHs ≤ 7, the area of the triangle is determined by both the H+ diffusion and the reaction of H+. As such, we have the following equations.
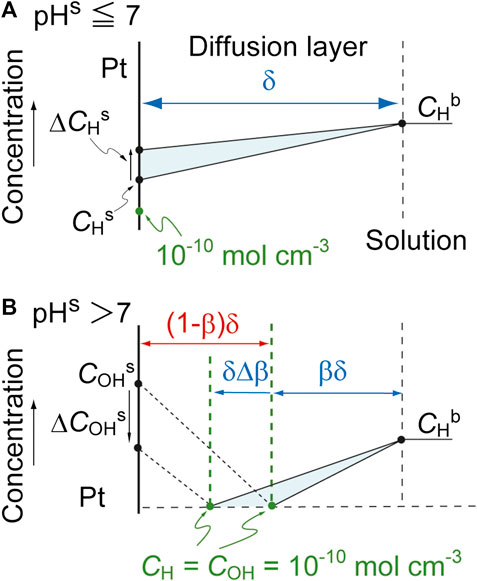
FIGURE 5. Changes in the near-surface concentration profiles for (A) pHs ≤ 7 and (B) pHs > 7. Here, ΔCs is a small change in Cs over a brief time interval, Δt, and ΔCHs is assumed to be positive.
The variable rH is referred to as the reaction term and has the opposite sign but the same magnitude to the net consumption rate of H+ at the electrode surface. The introduction of rH provides a generic model that is applicable to various reactions, as discussed further on. Thus,
In contrast, at pHs > 7, the reaction plane moves towards the electrode as
This can be transformed to the following equations.
Finally, dCHs/dt can be described as follows.
Numerical Simulation of the Hydrogen Evolution Reaction
We attempted to verify the validity of the above ODE-based model by simulating the I–U curve obtained from a Pt electrode in a solution containing 0.1 M H2SO4 and 0.03 M Na2SO4 (Figure 6). This simulation was performed using MATLAB (MathWorks) and the parameter values used are summarized in the figure caption. The second dissociation of H2SO4 was ignored in these calculations because the second dissociation constant is much smaller than the first one, and so CHb was set to 10–4 mol cm−3. This simulation used δ, a fitting parameter having a value of 0.01 cm. This value was considered reasonable because, during the actual experiment, the solution near the electrode surface was continuously agitated as a result of the formation of hydrogen bubbles. The values of CDL, Ei0, ki0 and αi were the same as those employed in prior work (Mukouyama et al., 2015; Mukouyama et al., 2017a) and Eqs 17 and 18 were respectively used for pHs ≤ 7 and pHs > 7. The resulting I–U curve (Figure 6A) reproduces the essential features of the experimental results (Figure 1B, red curve). Specifically, the current is constant in the potential region between −0.5 and −1.6 V and the absolute value of the current increases as U decreases from −1.6 V. Importantly, these calculations provided a valuable insight of how pHs changes in the potential range studied: pHs significantly increases, from approximately 2.5 to 12, in the constant-current state and reaches 13 at −1.8 V (Figure 6C).
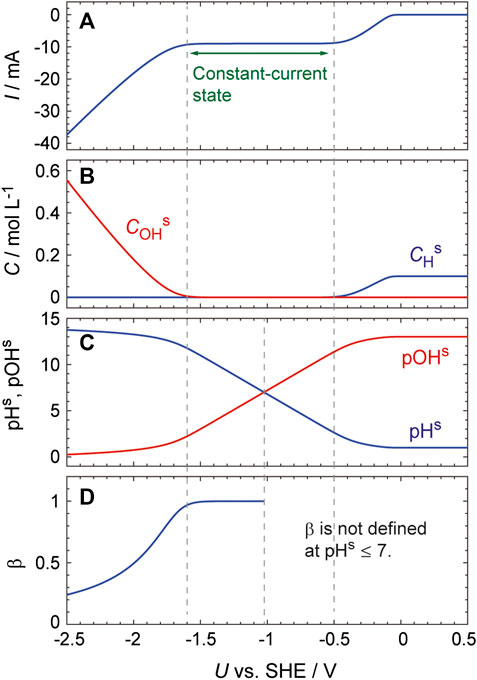
FIGURE 6. Simulated curves generated with U being scanned at a rate of 0.01 Vs−1 from 0.5 V. The parameter values used were: CHb = 1.0 × 10⁻⁴ mol cm−3, δ = 0.01 cm, T = 300 K, N0 = 2.2 × 10⁻⁹ mol cm−2, CDL = 2.0 × 10⁻⁵ F cm−2, A = 0.1 cm2, RΩ = 20 Ω, E20 = E−20 = −0.08 V vs. SHE, k20 = 5.0 × 10⁻³ cm s−1, k−20 = 5.0 × 10⁻⁶ mol cm−2 s−1, k30 = 5.0 × 10⁻⁶ mol cm−2 s−1, α2 = α−2 = 0.5.
To understand the mechanism responsible for the significant increase in pHs, the calculated results were examined in detail. In the potential region associated with the large pH increase (i.e., −0.5 to −1.6 V), the reduction current is almost constant and the slope of the current increase was only approximately 1.2 × 10⁻⁴ mAV−1 in the vicinity of pHs = 7. However, the rate constant for the formation of on-top H, k2, increases exponentially with decreases in U (Eq. 7), and this in turn increases the rate at which H+ is consumed at the electrode surface. Thus, pHs rapidly increases as U decreases in this potential region due to the exponential increase in k2.
To clarify the role of the reaction plane, a simulation is performed without using Eq. 18 but using the following equation, which is obtained from a simple modification of Eq. 17, at various pHs values.
Although β is defined at pHs > 7, the thickness of the H+ diffusion region can be expressed using β (i.e., the thickness = βδ) even at pHs ≤ 7 (Supplementary Figure S4, right), since the β value is practically equal to 1 under these conditions. Thus, the thickness can be expressed as βδ at any value of pHs, which allows us to utilize Eq. 17-2 to a wide pHs range. The parameters used in this simplified simulation are the same as Figure 6. As shown in Supplementary Figure S4, I–U curve obtained from this calculation can be regarded as essentially identical to that shown in Figure 6A: the largest difference is only 0.03 mA at pHs = about 12.
As shown in Figure 6 and Supplementary Figure S4, the HER current starts to increase when the pHs value reaches about 12. This effect is attributed to the rapid decrease in β at pHs > 12, as can be seen in Figure 4C. As β decreases, the flux of H+ ions toward the reaction plane increases because it is inversely proportional to βδ (Eq. 12), which in turn results in an increase in the HER current. We thus conclude that the increase in the H+ flux agrees with the experimental observation that water reduction occurs at low potentials.
Further evidence for this effect was obtained by performing the same calculations using Eq. 17 at various pHs values, i.e., without using the concept of the reaction plane. As expected, in this case, an increase in the HER current is not seen even at very low potentials despite the pHs increasing to greater than 12 (Figure 7).
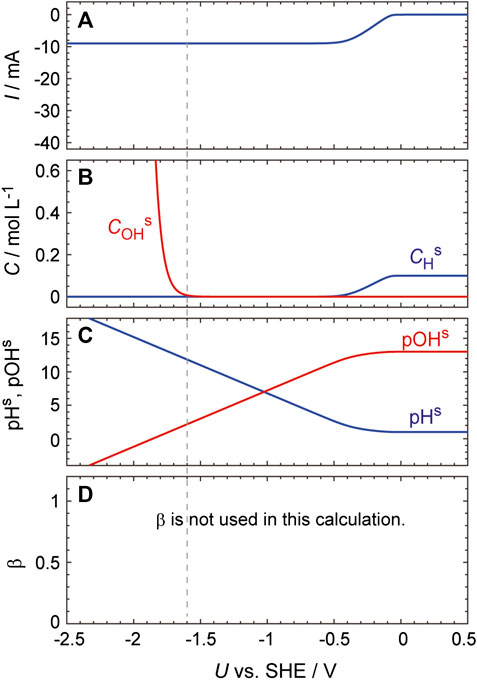
FIGURE 7. Simulated curves generated using the same process as described in the caption to Figure 6 except that Eq. 17 was used to calculate dCHs/dt.
Numerical Simulation of the Hydrogen Peroxide Reduction Reaction
One of the advantages of our model is that it can be applied to various reaction systems simply by replacing the reaction term, rH (Eq. 16). Therefore, we subsequently verified the versatility of our newly developed process by simulating the HPRR on a Pt electrode. The HPRR system is much more complex than the HER because H2O2 dissociates into HO2− in the diffusion layer (H2O2 ⇌ HO2− + H+) depending on pHs. Furthermore, the oxidation reactions of both H2O2 and HO2− must also be considered. The associated reaction equations are as follows.
Rate equations for the reduction and oxidation reactions include the surface concentrations of H2O2 (CHOs) and HO2− (CHOas). Using these variables, ODEs describing the derivatives of the coverages of adsorbed species with respect to time can be derived, as shown below.
Here, θH is the coverage of upd-H, θOH that of Pt-OH and θOOH that of Pt-OOH, while θva is the area associated with vacant sites (equal to 1 – θH – θOH – θOOH) and vi is the rate of the corresponding reaction. Note that the on-top H will be located at different sites from other adsorbed species, and so the coverage of on-top H (ΘH) is not included in θva. The reaction term (rH) can then be expressed as follows.
For simplicity, it is assumed that H2O2 dissociates only at the electrode surface, and hence the diffusion constant of H2O2 is the same as that of HO2−. Based on this assumption, the derivative of Cs (= CHOs + CHOas) with respect to time can be obtained, as provided below.
Here, DHO is the diffusion coefficient of H2O2 (1.7 × 10⁻⁵ cm2 s−1). The thickness of the H2O2 diffusion layer is assumed to be equal to that of the H+ diffusion layer (δ) at all pHs for the following reason. The solution was strongly agitated due to vigorous generation of hydrogen (or oxygen) bubbles, and a bubble detaches from the electrode surface when its diameter reaches about 0.01 cm (Mukouyama et al., 2014). Therefore, in the region of the electrolyte that is more than 0.01 cm away from the electrode, the concentration of the electroactive species is considered to be uniform due to the agitation effect caused by the bubble generation. Thus, it can be assumed that the thickness of the diffusion layer is determined by the size of the bubbles, regardless of the kinds of electroactive species. The surface concentrations of H2O2 and HO2− (CHOs and CHOas) are subsequently determined based on the law of mass action (that is, Ka = CHOasCHs/CHOs where Ka is the acid dissociation constant of H2O2). Hence, we can write the following.
We obtain Ka = 1.995 × 10⁻¹⁵ mol cm−3 (=1.995 × 10⁻¹² mol L−1) from pKa = 11.7.
Figure 8 shows the results calculated under the above assumptions, together with those calculated by assuming that pHs does not change from pHb. This model reproduces the essential features of the experimental observations presented in Figure 2. The HPRR current is shown to be constant over the potential region from 0.6 to 0.1 V. In addition, if pHs is fixed at a constant value (as shown in the left panels in the figure), a current oscillation (oscillation A) appears at ca. −0.05 V and the HER current starts to increase at −0.1 V. Oscillation B, which appeared in the HER region during the actual experiment (Figure 2B), is not reproduced. This is because the essential factors to induce oscillation B, namely, an electrode surface inhomogeneity and bubble-induced convection (Mukouyama et al., 2001), are not considered in this simulation.
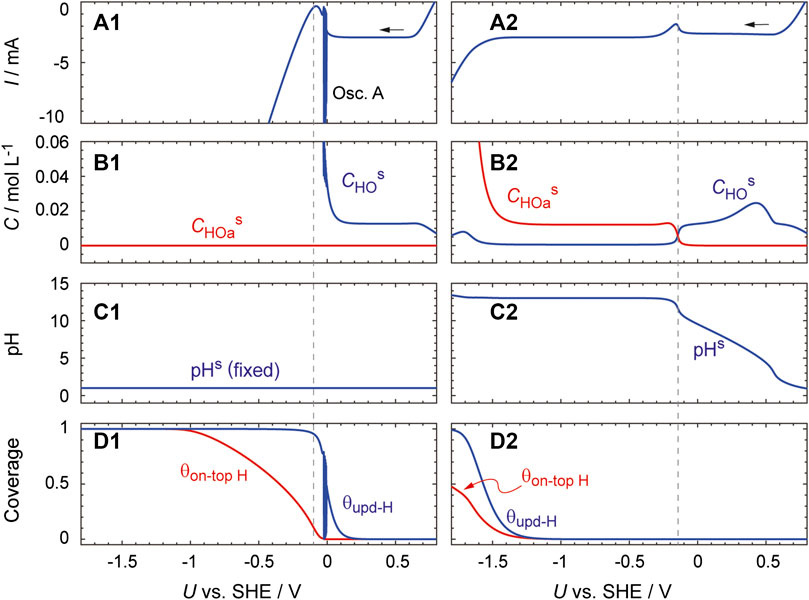
FIGURE 8. Simulated curves generated with U being scanned at a rate of 0.01 V s−1 from 1.0 V. They were obtained (left) by performing the calculation with dCHs/dt = 0 and (right) by using Eqs. 17 and 18 to calculate dCHs/dt. Parameter values used were: CHb = 1.0 × 10⁻⁴ mol cm−3, CHOb = 3.1 × 10⁻⁴ mol cm−3, A = 0.03 cm2, E10 = E−10 = 0.14 V, E60 = E−190 = 1.13 V, E190 = 0.84 V, E200 = E210 = 0 V, k10 = 1.0 × 10⁻² cm s−1, k−10 = 1.0 × 10⁻⁵ mol cm−2 s−1, k50 = k5a0 = 4.0 × 10⁻² cm s−1, k60 = k−190 = 1.0 × 10⁻⁵ cm s−1, k190 = k200 = 1.2 × 10⁻¹ cm s−1, k210 = 1.2 × 104 cm s−1, α1 = 0.3, α−1 = 0.7, α6 = 0.72, αi = 0.5 (i = 19, −19, 20, or 21). The other parameters (namely, δ, T, N0, RΩ, CDL, E20, E−20, k20, k−20, k30, α2, α−2) were the same as those used for Figure 6. The initial values of CHs and Cs are set at CHb and CHOb, respectively. To remove errors at an initial stage, the data obtained at U ≤ 0.8 V are displayed.
In the case that a pHs increase is considered (the right panels), the HPRR current is constant in the potential region below −0.3 V and the HER current increases not at −0.1 V but at −1.45 V. Importantly, the increase in pHs as U decreases is almost linear and H2O2 dissociates into HO2− at pHs values above approximately 11.7 (panels B2 and C2). Oscillation I is absent in contrary to the actual experiment displayed in Figure 2C, implying that the simulation of oscillation I requires additional factors. Remarkably, when Eq. 17 is used to calculate dCHs/dt, the current increase is not reproduced even for U < −1.45 V (Supplementary Figure S5). These results indicate that the concept of the reaction plane is necessary to capture the essential features of the HPRR.
Conclusion
The present work successfully developed an ODE model that can generate simulated pHs values for various electrochemical reactions. This technique is based on introducing a reaction plane in which the H+ and OH− concentrations are balanced under the assumption of a stationary state. Numerical calculations employing this model were able to predict increases in pHs during the HER at a Pt electrode in H2SO4 solutions. This process suitably reproduced the experimental results, including the appearance of a current plateau originating from the limited diffusion of H+ ions and the occurrence of direct water reduction at low potentials (−1.8 V or lower). Notably, our model has another significant advantage in that it is generally applicable to various reactions simply by replacing the reaction term, rH (Eq. 16). This was demonstrated by simulating both the HER and HPRR, the latter of which exhibits complicated effects of pH. Thus, this work shows that the ODE model permits quantitative estimations of pHs during various reactions in which H+ or OH− are involved, such as the reductions of CO2 and NO3−. Furthermore, with a slight modification, the model can be adopted to the electrochemical oxidations of H2O and certain organic compounds. We anticipate that this new process will contribute to the future development of various electrocatalysts.
Data Availability Statement
The original contributions presented in the study are included in the article/Supplementary Material, further inquiries can be directed to the corresponding author.
Author Contributions
All authors listed have made a substantial, direct, and intellectual contribution to the work and approved it for publication.
Funding
This work was partially supported by JSPS KAKENHI Grant No. 19K22232.
Conflict of Interest
The authors declare that the research was conducted in the absence of any commercial or financial relationships that could be construed as a potential conflict of interest.
Supplementary Material
The Supplementary Material for this article can be found online at: https://www.frontiersin.org/articles/10.3389/fenrg.2020.582284/full#supplementary-material.
References
Auinger, M., Katsounaros, I., Meier, J. C., Klemm, S. O., Biedermann, P. U., Topalov, A. A., et al. (2011). Near-surface ion distribution and buffer effects during electrochemical reactions. Phys. Chem. Chem. Phys. 13 (36), 16384–16394. doi:10.1039/c1cp21717h
Ayemoba, O., and Cuesta, A. (2017). Spectroscopic evidence of size-dependent buffering of interfacial pH by cation hydrolysis during CO2 electroreduction. ACS Appl. Mater. Interfaces 9 (33), 27377–27382. doi:10.1021/acsami.7b07351
Billy, J. T., and Co, A. C. (2017). Experimental parameters influencing hydrocarbon selectivity during the electrochemical conversion of CO2. ACS Catal. 7 (12), 8467–8479. doi:10.1021/acscatal.7b02373
Carneiro-Neto, E. B., Lopes, M. C., and Pereira, E. C. (2016). Simulation of interfacial pH changes during hydrogen evolution reaction. J. Electroanal. Chem. 765, 92–99. doi:10.1016/j.jelechem.2015.09.029
Deligianni, H., and Romankiw, L. T. (1993). In situ surface pH measurement during electrolysis using a rotating pH electrode. IBM J. Res. Dev. 37 (2), 85–95. doi:10.1147/rd.372.0085
Dunwell, M., Yang, X., Setzler, B. P., Anibal, J., Yan, Y., and Xu, B. (2018). Examination of near-electrode concentration gradients and kinetic impacts on the electrochemical reduction of CO2 using surface-enhanced infrared spectroscopy. ACS Catal. 8 (5), 3999–4008. doi:10.1021/acscatal.8b01032
Fuladpanjeh-Hojaghan, B., Elsutohy, M. M., Kabanov, V., Heyne, B., Trifkovic, M., and Roberts, E. P. L. (2019). In-operando mapping of pH distribution in electrochemical processes. Angew Chem. Int. Ed. Engl. 58 (47), 16815–16819. doi:10.1002/anie.201909238
Grozovski, V., Vesztergom, S., Láng, G. G., and Broekmann, P. (2017). Electrochemical hydrogen evolution: H+ or H2O reduction? A rotating disk electrode study. J. Electrochem. Soc. 164 (11), E3171–E3178. doi:10.1149/2.0191711jes
Hall, A. S., Yoon, Y., Wuttig, A., and Surendranath, Y. (2015). Mesostructure-induced selectivity in CO2 reduction catalysis. J. Am. Chem. Soc. 137 (47), 14834–14837. doi:10.1021/jacs.5b08259
Ji, J., Cooper, W. C., Dreisinger, D. B., and Peters, E. (1995). Surface pH measurements during nickel electrodeposition. J. Appl. Electrochem. 25 (7), 642–650. doi:10.1007/BF00241925
Kas, R., Kortlever, R., Yılmaz, H., Koper, M. T. M., and Mul, G. (2015). Manipulating the hydrocarbon selectivity of copper nanoparticles in CO2 electroreduction by process conditions. Chem. Electro. Chem. 2 (3), 354–358. doi:10.1002/celc.201402373
Katsounaros, I., Meier, J. C., Klemm, S. O., Topalov, A. A., Biedermann, P. U., Auinger, M., et al. (2011). The effective surface pH during reactions at the solid-liquid interface. Electrochem. Commun. 13 (6), 634–637. doi:10.1016/j.elecom.2011.03.032
Koper, M. T. M., and Sluyters, J. H. (1991). Electrochemical oscillators: their description through a mathematical model. J. Electroanal. Chem. Interfacial Electrochem. 303 (1), 73–94. doi:10.1016/0022-0728(91)85117-8
Lamy-Pitara, E., El Mouahid, S., and Barbier, J. (2000). Effect of anions on catalytic and electrocatalytic hydrogenations and on the electrocatalytic oxidation and evolution of hydrogen on platinum. Electrochim. Acta. 45 (25-26), 4299–4308. doi:10.1016/s0013-4686(00)00522-3
Leenheer, A. J., and Atwater, H. A. (2012). Imaging water-splitting electrocatalysts with pH-sensing confocal fluorescence microscopy. J. Electrochem. Soc. 159 (9), H752–H757. doi:10.1149/2.022209jes
Ma, M., Trześniewski, B. J., Xie, J., and Smith, W. A. (2016). Selective and efficient reduction of carbon dioxide to carbon monoxide on oxide-derived nanostructured silver electrocatalysts. Angew. Chem. Int. Ed. 55 (33), 9748–9752. doi:10.1002/anie.201604654
Mukouyama, Y., Hommura, H., Nakanishi, S., Nishimura, T., Konishi, H., and Nakato, Y. (1999). Mechanism and simulation of electrochemical current oscillations observed in the H2O2-reduction reaction on platinum electrodes in acidic solutions. Bull. Chem. Soc. Jpn. 72 (6), 1247–1254. doi:10.1246/bcsj.72.1247
Mukouyama, Y., Kawasaki, H., Hara, D., and Nakanishi, S. (2015). Transient chaotic behavior during simultaneous occurrence of two electrochemical oscillations. J. Solid State Electrochem. 19 (11), 3253–3263. doi:10.1007/s10008-015-2813-z
Mukouyama, Y., Kawasaki, H., Hara, D., Yamada, Y., and Nakanishi, S. (2017a). Appearance of new oscillation (named oscillation H) induced by Na2SO4 and K2SO4 in electroreduction of H2O2 on platinum. J. Electrochem. Soc. 164 (2), H1–H10. doi:10.1149/2.0011702jes
Mukouyama, Y., Kawasaki, H., Hara, D., Yamada, Y., and Nakanishi, S. (2017b). Appearance of new oscillations (named oscillations I and J) during reduction of H2O2 on platinum electrode. J. Electrochem. Soc. 164 (9), H675–H684. doi:10.1149/2.1561709jes
Mukouyama, Y., Kikuchi, M., and Okamoto, H. (2008). Appearance of new potential oscillation during hydrogen evolution reaction by addition of Na2SO4 and K2SO4. J. Electroanal. Chem. 617 (2), 179–184. doi:10.1016/j.jelechem.2008.02.006
Mukouyama, Y., Nakanishi, S., Konishi, H., Ikeshima, Y., and Nakato, Y. (2001). New-type electrochemical oscillation caused by electrode-surface inhomogeneity and electrical coupling as well as solution stirring through electrochemical gas evolution reaction. J. Phys. Chem. B 105 (44), 10905–10911. doi:10.1021/jp012461s
Mukouyama, Y., Nakazato, R., Shiono, T., Nakanishi, S., and Okamoto, H. (2014). Potential oscillation during electrolysis of water in acidic solutions under numerous conditions. J. Electroanal. Chem. 713, 39–46. doi:10.1016/j.jelechem.2013.11.002
Ooka, H., Figueiredo, M. C., and Koper, M. T. M. (2017). Competition between hydrogen evolution and carbon dioxide reduction on copper electrodes in mildly acidic media. Langmuir 33 (37), 9307–9313. doi:10.1021/acs.langmuir.7b00696
Rudd, N. C., Cannan, S., Bitziou, E., Ciani, I., Whitworth, A. L., and Unwin, P. R. (2005). Fluorescence confocal laser scanning microscopy as a probe of pH gradients in electrode reactions and surface activity. Anal. Chem. 77 (19), 6205–6217. doi:10.1021/ac050800y
Ryu, J., Wuttig, A., and Surendranath, Y. (2018). Quantification of interfacial pH variation at molecular length scales using a concurrent non-faradaic reaction. Angew. Chem. Int. Ed. 57 (30), 9300–9304. doi:10.1002/anie.201802756
Schmickler, W., and Santos, E. (2010). Interfacial electrochemistry. 2nd edn. Berlin, Germany: Springer-Verlag.
Sen, S., Liu, D., and Palmore, G. T. R. (2014). Electrochemical reduction of CO2 at copper nanofoams. ACS Catal. 4 (9), 3091–3095. doi:10.1021/cs500522g
Singh, M. R., Clark, E. L., and Bell, A. T. (2015). Effects of electrolyte, catalyst, and membrane composition and operating conditions on the performance of solar-driven electrochemical reduction of carbon dioxide. Phys. Chem. Chem. Phys. 17 (29), 18924–18936. doi:10.1039/c5cp03283k
Singh, M. R., Kwon, Y., Lum, Y., Ager, J. W., and Bell, A. T. (2016). Hydrolysis of electrolyte cations enhances the electrochemical reduction of CO2 over Ag and Cu. J. Am. Chem. Soc. 138 (39), 13006–13012. doi:10.1021/jacs.6b07612
Skúlason, E., Tripkovic, V., Björketun, M. E., Gudmundsdóttir, S., Karlberg, G., Rossmeisl, J., et al. (2010). Modeling the electrochemical hydrogen oxidation and evolution reactions on the basis of density functional theory calculations. J. Phys. Chem. C 114 (42), 18182–18197. doi:10.1021/jp1048887
Song, J., Song, H., Kim, B., and Oh, J. (2019). Towards higher rate electrochemical CO2 conversion: from liquid-phase to gas-phase systems. Catalysts 9 (3), 224. doi:10.3390/catal9030224
Suzurikawa, J., Nakao, M., Kanzaki, R., and Takahashi, H. (2010). Microscale pH gradient generation by electrolysis on a light-addressable planar electrode. Sensor. Actuator. B Chem. 149 (1), 205–211. doi:10.1016/j.snb.2010.05.058
Varela, A. S., Kroschel, M., Reier, T., and Strasser, P. (2016). Controlling the selectivity of CO2 electroreduction on copper: the effect of the electrolyte concentration and the importance of the local pH. Catal. Today 260, 8–13. doi:10.1016/j.cattod.2015.06.009
Yang, K. D., Ko, W. R., Lee, J. H., Kim, S. J., Lee, H., Lee, M. H., et al. (2017). Morphology-directed selective production of ethylene or ethane from CO2 on a Cu mesopore electrode. Angew. Chem. Int. Ed. 56 (3), 796–800. doi:10.1002/anie.201610432
Yoon, Y., Hall, A. S., and Surendranath, Y. (2016). Tuning of silver catalyst mesostructure promotes selective carbon dioxide conversion into fuels. Angew. Chem. Int. Ed. 55 (49), 15282–15286. doi:10.1002/anie.201607942
Keywords: electrochemistry, local pH simulation, hydrogen evolution, hydrogen peroxide reduction, electrocatalysts
Citation: Mukouyama Y and Nakanishi S (2020) An Ordinary Differential Equation Model for Simulating Local-pH Change at Electrochemical Interfaces. Front. Energy Res. 8:582284. doi: 10.3389/fenrg.2020.582284
Received: 11 July 2020; Accepted: 09 October 2020;
Published: 23 December 2020.
Edited by:
Hideshi Ooka, RIKEN, JapanReviewed by:
Marc Koper, Leiden University, NetherlandsJoel Ager, University of California, Berkeley, United States
Copyright © 2020 Mukouyama and Nakanishi. This is an open-access article distributed under the terms of the Creative Commons Attribution License (CC BY). The use, distribution or reproduction in other forums is permitted, provided the original author(s) and the copyright owner(s) are credited and that the original publication in this journal is cited, in accordance with accepted academic practice. No use, distribution or reproduction is permitted which does not comply with these terms.
*Correspondence: Yoshiharu Mukouyama, bXVrb3lhbWFAbWFpbC5kZW5kYWkuYWMuanA=; Shuji Nakanishi, bmFrYW5pc2hpQGNoZW0uZXMub3Nha2EtdS5hYy5qcA==