 Seyedehhoma Ghavam
 Caroline M. Taylor2
 Peter Styring
- 1Department of Chemical and Biological Engineering, The University of Sheffield, Sheffield, United Kingdom
- 2EarthShift Global LLC, Kittery, ME, United States
Global demand for both clean energy carriers and agricultural nutrients continues to grow rapidly, alongside increasing quantities of waste globally, interlinked challenges that may be addressed with interlinked solutions. We report on the potential efficiency and Greenhouse Gas (GHG) intensity of several configurations of a new, sustainability-driven ammonia (NH3) production processes to determine whether a waste-based process designed first around carbon dioxide (CO2) capture can compete with other available NH3 technologies. This is assessed via different scenarios: Two hydrogen generating options are paired with four CO2 fates. For either an anaerobic digestion-centered process or a two-stage dark fermentation coupled with anaerobic digestion process, the resultant CO2 may be captured and injected, sold to the marketplace, released directly in the atmosphere, or converted to urea in order to produce a green substitute for synthetic NH3. Modeled yields range from 47 t NH3 when the resultant CO2 is released or captured, or 3.8 t NH3 and 76.5 t urea when the system is designed to produce no unutilized CO2. Among the technologies assessed, NH3 production where CO2 is captured for anaerobic digestion-only is the most efficient for GHG emissions and water consumption, while the two-stage requires less energy on a fertilizer-N basis. GHG emissions for anaerobic digestion-only are approximately 8% lower than the two-stage. The best of the proposed technology configurations consumes about 41% less energy than water electrolysis coupled with Haber-Bosch and approximately 27% lower energy than Steam Methane Reforming (SMR) coupled with Haber-Bosch per kg NH3.
GRAPHICAL ABSTRACT. Proposing a new sustainably driven waste-based ammonia production route along with four possible CO2 fates for each process configuration.
Introduction
Ammonia is the second most produced chemical compound globally (146 million tonnes reported in 2016) after sulfuric acid (H2SO4), with fossil fuels being the main feedstock for its production (CICE, 2016; Soloveichik, 2017). Due to the important role of NH3 as a fertilizer in the agricultural industry and its promising prospects as an energy carrier, many studies have recently attempted to find the most environmentally benign, energy efficient, and economically viable production process for NH3 synthesis.
Ammonia production technologies currently in use require either a steady supply of deionized water in high volumes to operate and/or result in high CO2 production. The most commonly utilized NH3 production method is the Haber-Bosch process. The downside of this technology is high GHG emissions, surpassing 2.16 kg CO2 eq/kg NH3 and high energy consumption. For the production of 1 t of NH3 through SMR coupled with Haber-Bosch, 0.66 t H2O is utilized and 9–10 t CO2 eq is produced, over its full life cycle (Parkinson et al., 2018). For producing 1 t of NH3 through water electrolysis 1.6 t H2O is consumed (Will and Lukas, 2018). In order to replace the existing high impact NH3 technologies currently in use, a new sustainability-driven waste-based technology that is competitive for carbon emissions, water use, and power use has been designed around carbon capture/utilization. The design strategy was based on optimizing production while mitigating and valorizing waste and reducing emissions.
Bioconversion of wastes such as food and Human Waste (HW) into important chemical compounds such as NH3 and urea (CH4N2O) offers, to some extent, a new resource recovery alternative for fossil-based chemicals. The overabundance of these waste streams poses significant threats for GHG control. Uncontrolled decomposition of organic waste in landfills, if left untreated, leads to the discharge of methane (CH4), a potent GHG trapping approximately 85 times more heat than CO2 through the first 20 years from when it is discharged. Methane accounts for 20% of the global warming that is currently being experienced (IPCC, 2013; MIT News, 2017). In 2015, the U.S. Environmental Protection Agency (USEPA) reported that the GHG emissions resulting from waste landfills was 115.7 Mt of CO2 eq (Lee et al., 2017). While in the same year, the UK government reported GHG emissions of waste disposed of in landfills was approximately 18 Mt of CO2 eq (BEIS, 2017). As shown in Figure 1, the increase in the amount of Food Waste (FW) keeps pace with nutrient N demand and this trend is projected to continue. FW has increased by 40% over the course of the 34 years; while the nutrient N demand has increased approximately 49% over the same time period.
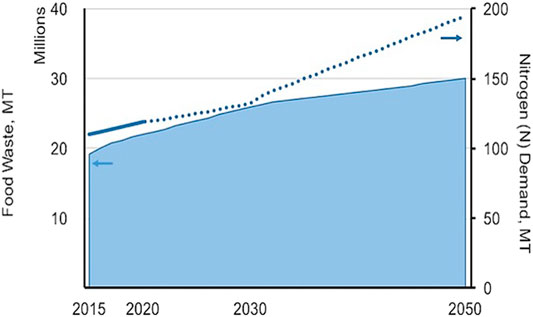
FIGURE 1. Projected amount of FW and nutrient N demand from 2016–2050 (data from FAO, 2017; Read et al., 2020).
A particular benefit of a waste-based process such as the green NH3 technology developed here is the potential to avoid CH4 that could have been released from uncontained degradation of waste. The potential GHG mitigation benefit with the technology depending on how much of the processed waste was diverted from uncontained degradation is illustrated in Figure 2. About 74 kg of CH4 is released with open degradation of a tonne of food waste comprised of about half vegetable and a quarter meat wastes (Quantis, 2019). If 10% of each tonne of processed food waste resulted from diversion, that would avoid releasing about 7.4 kg CH4 or 200 kg CO2 eq; at 50% rescued material that grows to nearly 1 kg of CO2 eq/kg FW processed and at 90%, almost 1.85 kg CO2 eq/kg FW would be prevented from directly reaching the atmosphere.
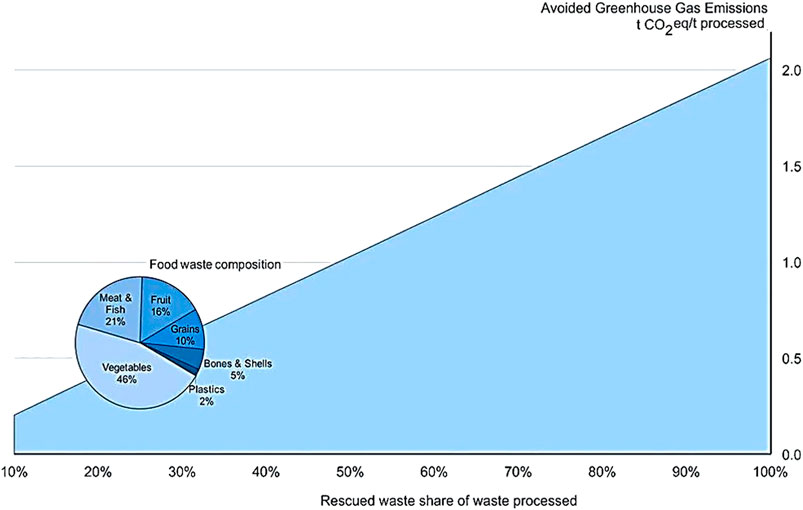
FIGURE 2. Carbon dioxide mitigation potential per tonne processed food waste as a function of fraction diverted into various processes instead of landfilling, calculated with WBCSD’s Food Loss and Waste Value Calculator (Quantis 2019) with composition of FW (vegetables, meat and fish, fruit, grains, bones and shells, and plastics) selected to assess the avoided emissions throughout this study (food waste composition for South East Asia (Paudel et al., 2017)).
As the population grows the need for more food production leads to the demand for more fertilizers, which results in higher food demands and more HW generation. The projected global population along with the total nitrous oxide (N2O) and CH4 emissions from human sewage and domestic wastewater from 1990–2030 are shown in Figure 3. The amount of HW necessarily increases proportionally with the global population. The amount of HW has increased by approximately 51% over the course of 40 years, while the population growth is approximately 47% over the same time period.
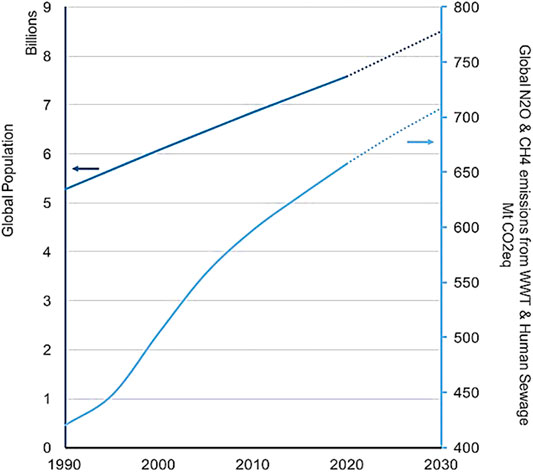
FIGURE 3. The projected global population along with the total nitrous oxide and methane emissions from human sewage and domestic wastewater in Mt CO2 eq from 1990–2030 (data from USEPA, 2012; Isaksson et al., 2020).
Both FW and HW are rich in readily biodegradable organic matter, therefore they decompose rapidly, and, in addition to their contributions to global GHG balances, may potentially result in other serious environmental implications if not properly managed. FW and HW are readily biodegradable in the environment which indicates their potential in industrial bioconversion. As a result, designing a sustainable waste management process which reduces the GHG emissions such as the utilization of AD will be an effective pathway to target the replacement of higher impact, fossil-based chemicals.
This work describes the results of a study implementing this design strategy, developing a green and viable NH3/urea process in order to reduce waste and prevent the release of additional CO2 (from primarily biogenic sources) into the atmosphere.
Introducing a Sustainable Waste Management Approach for Ammonia Production
Simplified Process Description
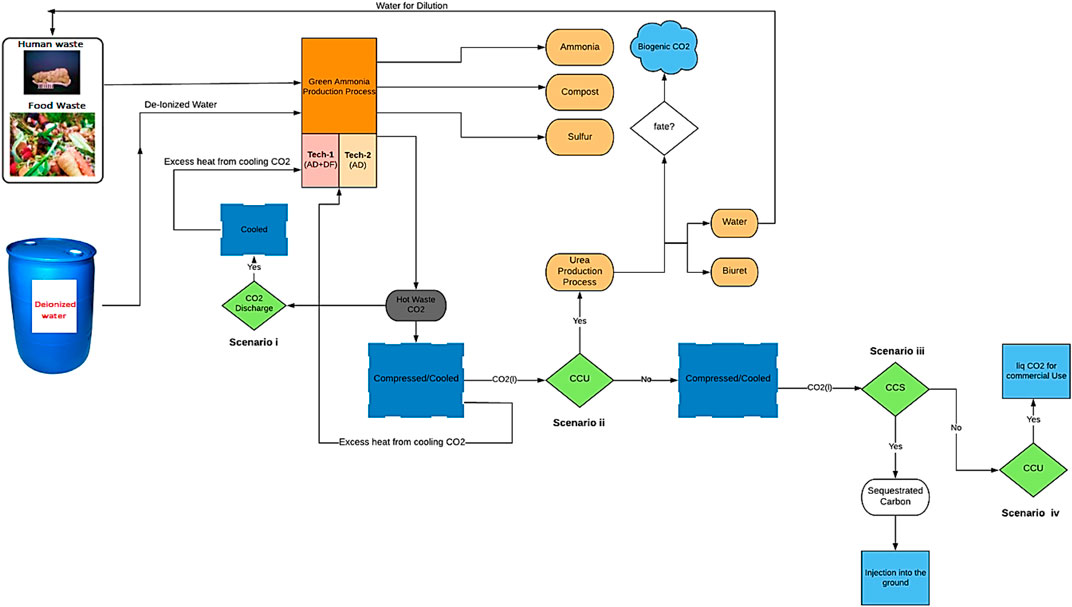
In the processes designed and modeled, waste (FW and human faeces) is fed into a two-stage bioreactor, resulting in the production of biogas. Hydrogen (H2) is separated from the gas mixture through a series of operating stages (membranes) and reacts with nitrogen (N2) derived from the migration of air through a membrane, in order to produce NH3. The CO2 recovered along with the NH3 can be used for urea production (a simplified process flow diagram is shown in Figure 4). This process is compared to the case where the CO2 is not captured/utilized, as well as to cases where the CO2 is captured, compressed, liquefied, and either injected into the ground (Carbon Capture and Sequestration (CCS)) or assumed to enter the commodity liquid CO2 market (base Carbon Capture and Utilization (CCU)) (scenarios i–iv).
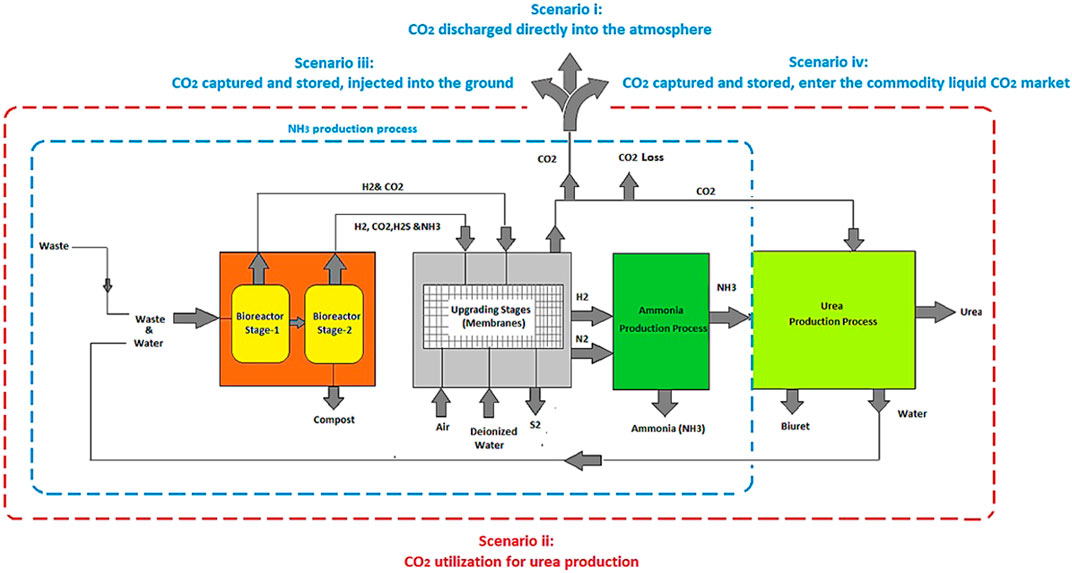
FIGURE 4. A simplified process flow diagram of the proposed ammonia/urea production process.
Plant Components Incorporated into the Modeled Process
The core component of this proposed NH3 production process is waste processing, utilizing either a two-stage Dark Fermentation Bioreactor (DFB) coupled with an Anaerobic Digestion Bioreactor (ADB) or the latter alone. For each component involved in this proposed process a model section will be presented. The modeling components are comprised of: Dark Fermentation (DF), Anaerobic Digestion (AD), Micro Filtration Index (MFI), Electrochemical Membrane Separation (EMS), Ion Transport Membrane (ITM), CH4 assisted-Solid Oxide Fuel Electrolysis Cell (SOFEC), Solid State Ammonia Synthesis (SSAS), Solid Oxide Fuel Cell (SOFC), and a urea production plant. The description of the plant components is shown in Table 1. A critical analysis of why EMS, ITM, CH4 assisted-SOFEC, SSAS, and SOFC have been chosen as process components is presented in the study conducted by (Ghavam et al., 2021).
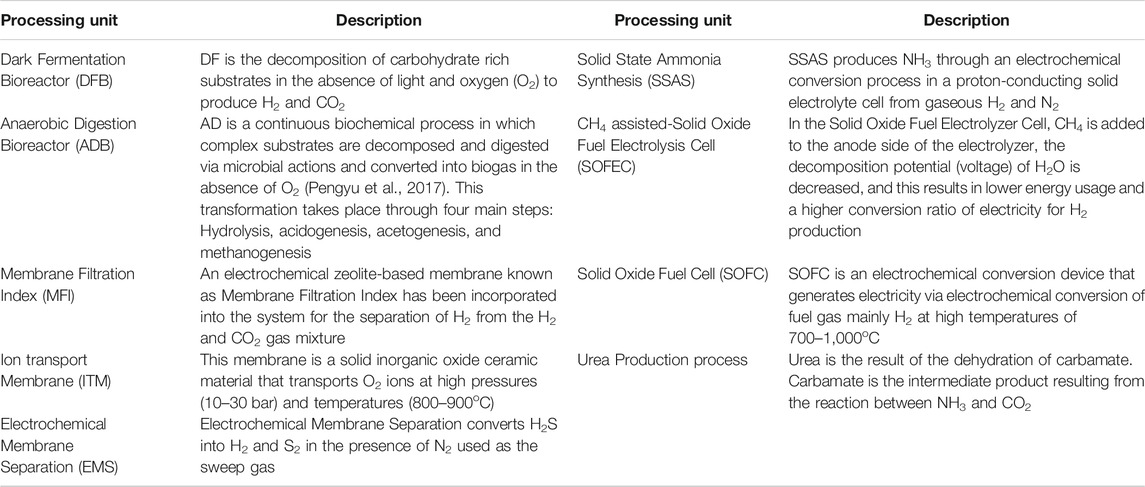
TABLE 1. Description of the plant components.
The main components for NH3 production are H2 and N2. Hydrogen is the output from MFI and CH4 assisted-SOFEC, while N2 comes from the ITM. These two components enter the SSAS for NH3 synthesis.
Incorporating Urea into the Modeled Process
A urea production process is an effective pathway for harnessing the CO2 that might otherwise have been directly released into the atmosphere. Eventually this CO2 that is utilized for urea production will be discharged, as a result, incorporating a urea plant cannot solve the carbon emission problem but merely delays it while getting useful services (in this case offsetting the production of conventional urea, which uses significant fossil resources and results in significant life cycle GHGs). From a low carbon design point of view, which is the aim of this study, offsetting urea production has a greater environmental benefit than releasing the CO2 directly from the process on a life cycle basis, despite the increase in energy demand. There is a side unwanted reaction during urea synthesis which produces biuret and thus lowers production yields. In order to prevent high biuret formation, a vacuum evaporator is utilized followed by a cooling system. Our aim is to optimize the process for maximum urea purity and to minimize biuret formation.
Significance of Membrane Incorporation in the Modeled Process
Our process is designed around membranes to address the challenges in necessary gas upgrading and purification, reduce the need for external sources of both chemicals and water, while minimizing the physical footprint of the processing units. To obtain the necessary purity level from biogas resulting from waste (food and Brown Water (BW)), the CH4 stream needs to be upgraded to separate impurities such as CO2, hydrogen sulfide (H2S) and traces of other compounds. The cost of the available technologies for upgrading biogas such as water scrubbing, Pressure Swing Adsorption (PSA), chemical absorption, cryogenic distillation, amine scrubber, etc. are comparatively high due to energy, water, chemical usage, and large physical footprint, and/or the combination of these factors (Fouladvand, 2016).
In place of processing units, such as an amine scrubber, with large physical footprint, an MFI membrane is used for the separation of H2 and CO2 from DF. For example, a single MFI module has the same throughput/output as a large, expensive and energy-intensive amine scrubber (Korelskiy et al., 2015).
This proposed process is also designed in order to increase the production of H2 required for NH3 synthesis through an environmentally benign, energy efficient, and cost-effective manner. The design objectives have been achieved by utilizing CO2 for urea synthesis, converting H2S into sulfur (S2) and H2 via a membrane, converting the byproduct of the AD process into compost, utilizing renewable energy sources, and processing units with a low physical footprint for its operation. These processing units include certain types of membranes which reduce the production costs, such as ITM that is used for air separation (Sun et al., 2011).
Modeling Approach
The CO2 emissions, water, and energy usage of this novel process for the production of NH3 and urea from waste are analyzed computationally. A mathematical model to simulate the performance of the NH3 production process from co-digestion of FW and BW is developed with mass, heat, and energy balance equations. This is implemented in the Visual Basic for Applications (VBA) platform embedded in the Microsoft excel program. The coupled mass and energy balance of this simulated model is assessed under various physical and chemical conditions (temperature, pressure, flow rates, specific heat capacity, porosity, tortuosity, flux, and permeability) and sizing of various processing units (thickness, area, number of tubes, cells, and modules). Assumptions and mathematical equations (mass transfer, energy transfer, thermodynamics, and kinetics) are determined for each processing unit. Since the entire process operates sequentially, the output and the performance of each component affects the input of the other components except for the bioreactors and ITM which are the initial processing units of this proposed process. The modeling framework is comprised of equation-oriented and sequential modular approaches. Through this approach, the components (processing units) are modeled using an equation-based approach in sequence, starting with the feed stream and the entire process flow is treated as a set of mathematical equations which need to be solved simultaneously.
Although there are a variety of different thermodynamic simulators capable of modeling and optimizing different processes, none offer membranes among their standard process functions (Hoorfar et al., 2018). Commercial tools such as AspenPlus® do not have the option to model the membrane operation, and so it is necessary to program the membranes in Matlab, FORTRAN, VBA, or other programs. VBA enables us to expose direct optimization of membrane parameters.
Assumptions
The results presented here are based on the calculations for 20 tpd of input waste (FW and BW). Although other scaling can be evaluated with the implemented model, this figure is calculated to roughly show the size of a mid-size city such as Bakersfield, California. The main assumptions used in this study are listed in Table 2.
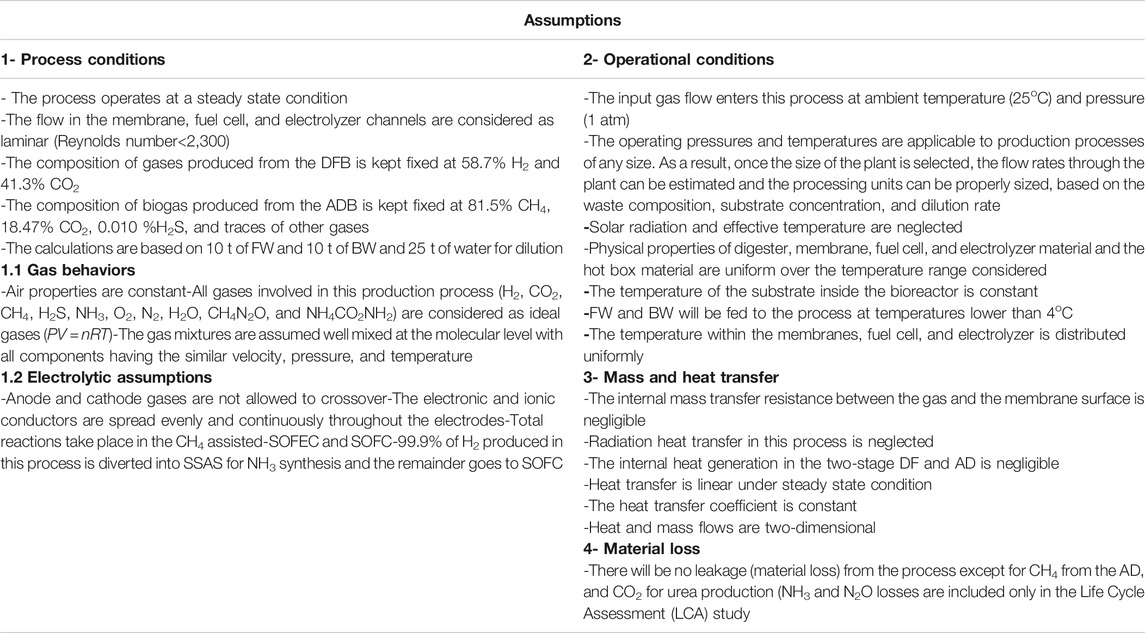
TABLE 2. List of assumptions used in this study.
Process Description
This proposed process is assessed through two configurations: Technology-1: Ammonia production through a two-stage DF coupled with AD and Technology-2: Ammonia production through AD-only. Each configuration has four possible CO2 fates, Scenario i: CO2 is discharged directly into the atmosphere, Scenario ii: (CCU) CO2 is utilized for urea production, Scenario iii: (CCS) CO2 is compressed, liquefied, captured, and injected into the ground, and Scenario iv: (CCU) CO2 is compressed, liquefied, captured, and enter the commodity liquid CO2 market. All four scenarios are evaluated for two situations, one where SOFC is used, and one where it is not.
For both technologies (1 and 2) there are four sets of scenarios. The process configuration and computational model behavior change depending on scenario configuration. For scenarios i, ii, and iv all the produced CO2 is compressed, cooled, and liquefied, then either discharged directly, captured and injected into the ground, or sold commercially. The CH4 and H2 resulting from AD/DF are upgraded into pure H2 for NH3 synthesis via multiple membrane types (MFI and CH4 assisted-SOFEC). If the process does not utilize SOFC, the calculation ends at this point. When SOFC is incorporated into the process, the SSAS/SOFC hydrogen ratio is set, the SOFC calculations are conducted and the ITM, N2 throughput is attenuated.
For scenario iii the entirety of the CO2 produced is utilized for urea production and the upgraded H2 is used for the production of the required NH3 for urea synthesis. As with the other scenarios, the inclusion of SOFC determines the algorithm from here. If SOFC is incorporated into the process, the SOFC calculations are conducted and the SSAS/SOFC hydrogen ratio is set at this point. In the absence of the SOFC module, the N2 from ITM is used without attenuation along with the excess H2 for NH3 synthesis rather than entering the SOFC module (detailed information on the logical flow diagram is provided in Supplementary Figure S1 in the supplementary materials).
Technology Pathways
Digestion efficiencies in co-digestion of FW and HW are generally higher when urine has been removed (Rajagopal et al., 2014). This separation is done in order to increase the hydrolytic and acidogenic potential of co-digestion of FW and BW (Colón et al., 2015). Moreover, co-digestion of excreta along with other organic compounds enhances the process efficiencies that are prevented by excreta characteristics.
General technology structures are shown in Figure 5 (two-stage DF coupled with AD and AD-only process). Detailed technology descriptions are as follows.
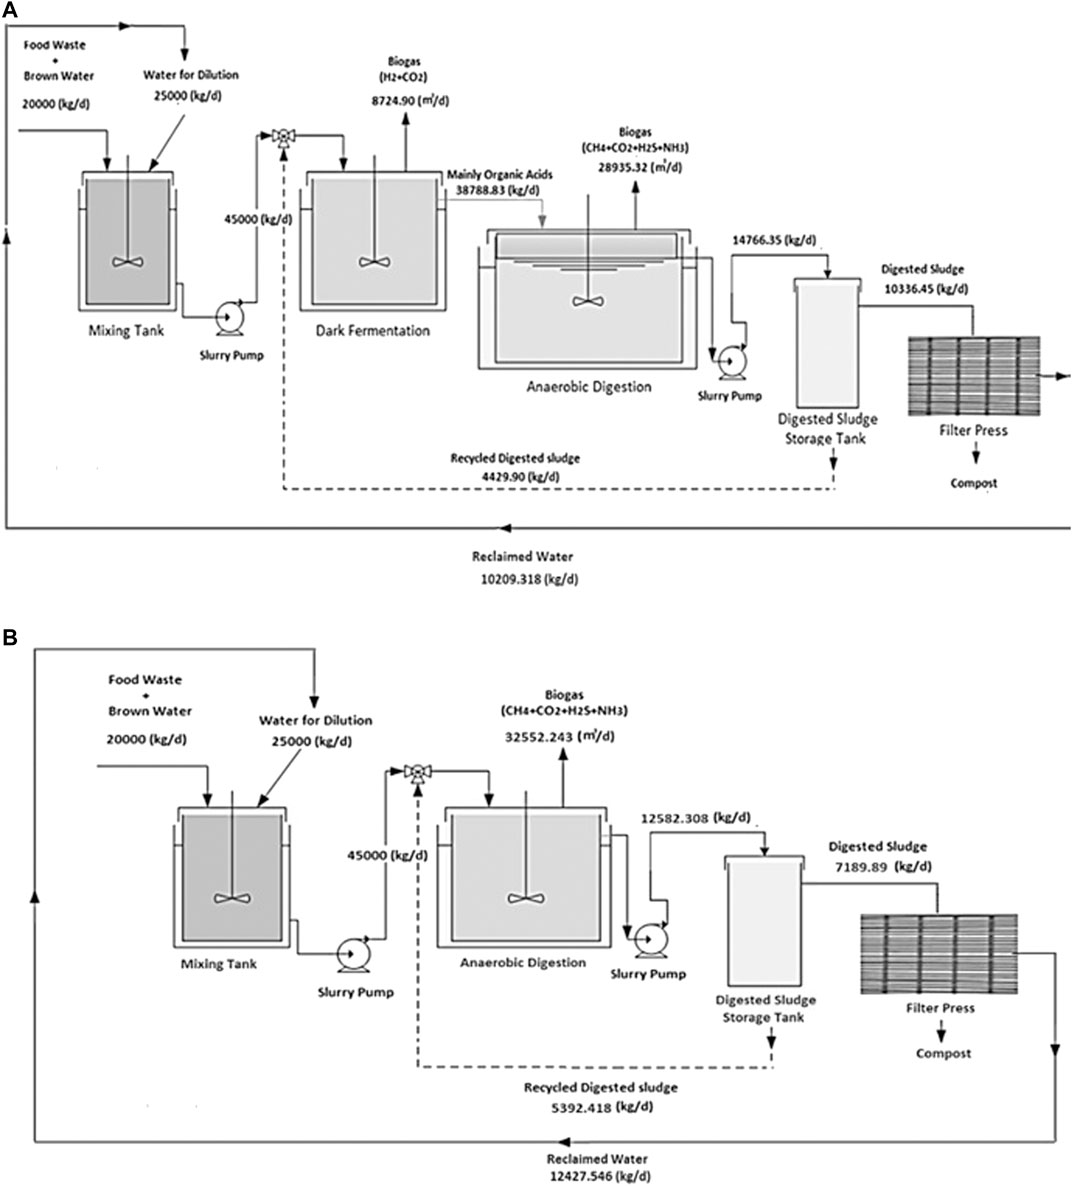
FIGURE 5. A schematic of waste processing portions of the ammonia production processes through (A) two-stage DF coupled with AD and (B) AD-only.
Technology-1: Process Description of Ammonia Production Through a Two-Stage DF Coupled With AD
Hydrogen is separated from the H2 and CO2 gas mixture resulting from DFB by using an MFI. The separated H2 provides the process with the required H2 for NH3 synthesis. The H2 along with the needed N2 resulting from the ITM, enters into the SSAS for NH3 production. The organic acids which are the byproducts of DF are used as the substrate for AD in order to produce biogas which is comprised of CH4, CO2, and H2S. Hydrogen sulfide must be removed from the biogas stream, which is accomplished here using an EMS system. This H2S is converted into traces of H2 and S2 in the presence of a sweep gas (N2) which is separated via ITM. The CO2 along with CH4 is introduced into a CH4 assisted-SOFEC for H2 production. Throughout this conversion, CO2 is also separated from the H2 stream in this electrolyzer. The H2 then enters the SSAS, producing NH3 which is required in the event where urea is required (only for scenario ii). A portion of the H2 resulting from the CH4 assisted-SOFEC is fed into a SOFC for generating heat, power, and steam for a part of the process. The NH3 produced along with the CO2 resulting from both MFI and CH4 assisted-SOFEC enter the urea production process or the CO2 is released directly into the atmosphere (scenario i), captured and injected into the ground (scenario iii) or assumed to enter the commodity liquid CO2 market (scenario iv).
Technology-2: Process Description of Ammonia Production Through AD-Only
Biogas resulting from AD, needs to be upgraded in order to provide the H2 required for NH3 synthesis. The H2 along with the needed N2 resulting from the ITM, enters into the SSAS for NH3 production. Hydrogen sulfide must be removed from the biogas stream, accomplished here using an EMS system. Hydrogen sulfide is converted into traces of H2 and elemental S2 in the presence of a sweep gas (N2) which is separated via ITM. The CO2 along with CH4 are introduced into a CH4 assisted-SOFEC for H2 production. Throughout this conversion, CO2 is also separated from the H2 stream in the electrolyzer.
The H2 along with the N2 resulting from the separation of air in an ITM then enters the SSAS for producing NH3 which in turn is required for urea production. A portion of the H2 resulting from the CH4 assisted-SOFEC is fed into a SOFC for generating heat, power, and steam for part of the process. The NH3 produced along with the CO2 resulting from CH4 assisted-SOFEC enter the urea production process (only for scenario ii). The CO2 resulting from the CH4 assisted-SOFEC can be released directly into the atmosphere (scenario i), captured and injected into the ground (scenario iii) or assumed to enter the commodity liquid CO2 market (scenario iv).
Energy Flows of Ammonia Production Through a Two-Stage DF Coupled With AD Process
The need for external energy sources is minimized and heat recovery is maximized when the heat integration method is adopted. A heat balance model is presented in Figures 6A,B. for the proposed NH3 production process. It illustrates the energy flow diagram utilizing heat integration and is divided into three parts I, II,III, and IV described below:
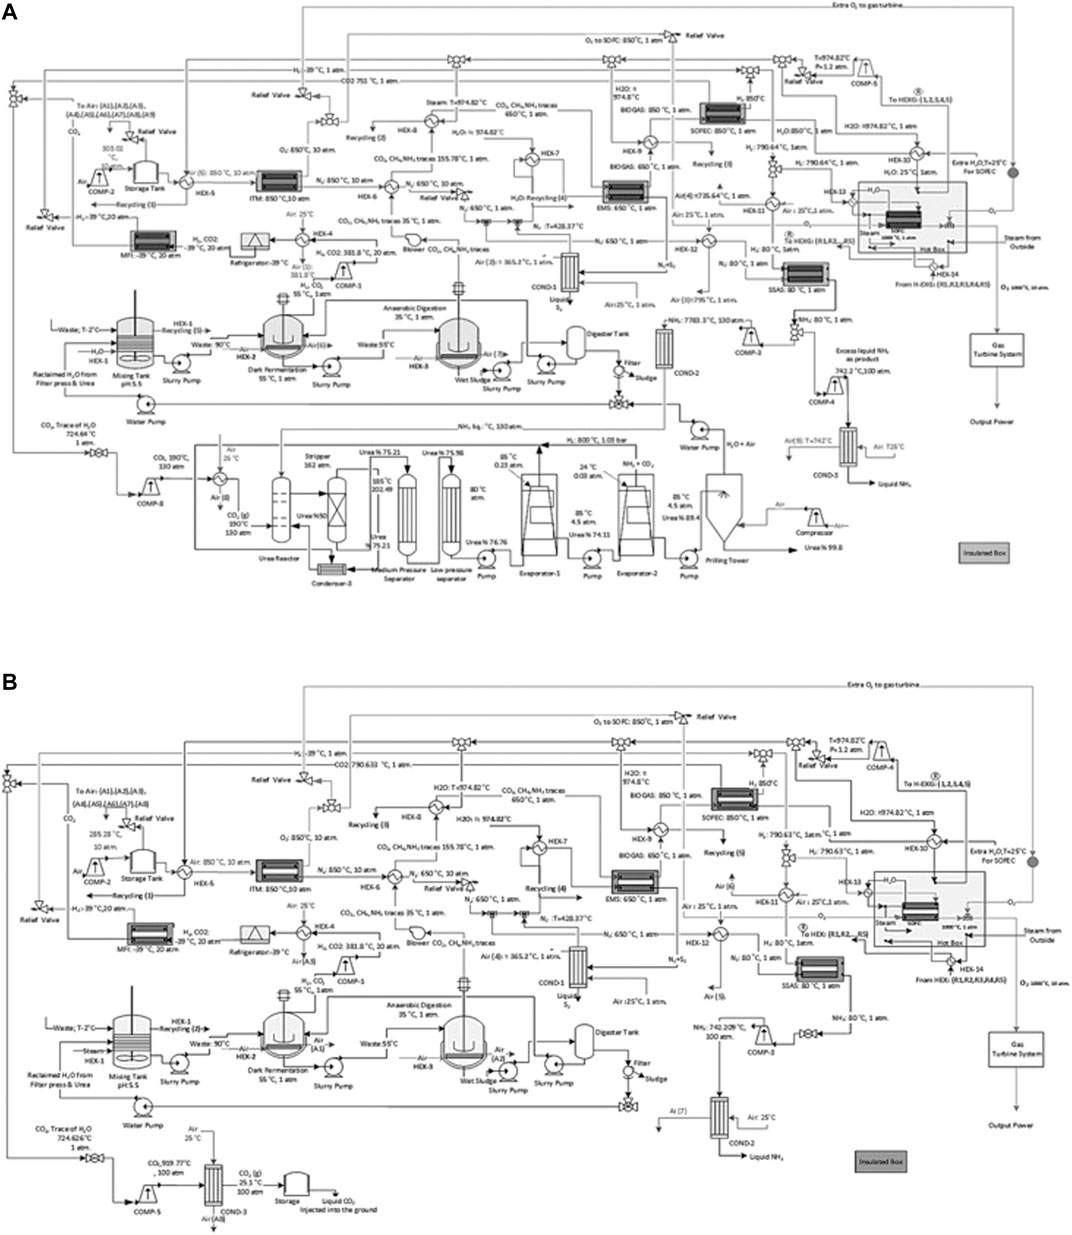
FIGURE 6. A schematic of the process flow diagram of the proposed ammonia production process through, (A) a two-stage DF coupled with AD with urea production and by incorporating SOFC and (B) a two-stage DF coupled with AD without urea production with CCS and by incorporating SOFC.
I: The process streams are cooled with the input air flow at 25°C before entering the ITM and heated with recirculated steam at about 974.8°C resulting from an external source of water at 920°C which enters a compressor before being used for heating up the process at a steady state condition. The input air enters a compressor in order to reach the desired pressure in the range of 10–30 atm before entering the ITM. This air stream is heated from ambient temperature to 850°C. The separated O2 is divided into two streams. The first stream enters the SOFC as one of the main feedstocks for its operation. The remaining O2 passes through the SOFC hot box in order to enter the gas turbine system for power generation. The remaining N2 is also divided into two streams. The first stream enters the relief valve to reach the pressure of 1 atm and is cooled down with air before entering the SSAS at 80°C. The second stream is also cooled down with air and lowered to 650°C before entering the EMS used as the sweep gas.
II: FW and BW enter the process at 2°C and are heated to 90°C in a mixing tank along with the water for dilution. The mixture is then cooled with air to 55°C in the DFB. The temperature is monitored through the entire process to increase the H2 produced. The H2 and CO2 resulting from DF is compressed and passes through a refrigerator in order to reach a pressure of 20 atm and temperature of −39°C before entering the MFI. The sludge is then pumped into the ADB and is cooled to 35°C.
III: The biogas resulting from the ADB enters a heat exchanger to reach 650°C before entering the EMS. The resulting N2 + S2 from the EMS enter a condenser in order to separate N2 from S2. The separated N2 will then be recirculated back into the EMS as the sweep gas. The remaining biogas stream from the EMS is then heated to 850°C and the steam is cooled to the same temperature (850°C) in order to enter CH4 assisted-SOFEC for CO2 separation and H2 production. The resulting sludge from the ADB passes through a filter press to remove its moisture for producing compost. The reclaimed water is then recycled back into the mixing tank used as the diluted water.
IV: The separated CO2 from both the MFI and CH4 assisted-SOFEC are mixed, compressed, and cooled before entering the urea production process at 130 atm and 190°C (Figure 6A). While for the process without urea production the separated CO2 is compressed and cooled to 100 atm and 25.1°C before being captured and injected into the ground or sold commercially (Figure 6B). Simultaneously the separated H2 from both the MFI and CH4 assisted-SOFEC is also mixed before entering the SSAS at 80°C and 1 atm. The NH3 produced from the SSAS is divided into two streams, the first stream enters the urea production process (Figure 6A). The second stream is compressed to 100 atm, cooled, and finally liquified (Figure 6B). The remaining H2 is heated to 1,000°C before entering the SOFC along with the O2 from the ITM.
Energy Flows of Ammonia Production Through AD-Only Process
A heat balance model for the proposed NH3 production process demonstrating the energy flow diagram with heat integration is presented in Figures 7A,B. Part I and III have the same energy flows as described above. While part II and IV have different configurations that are described below.
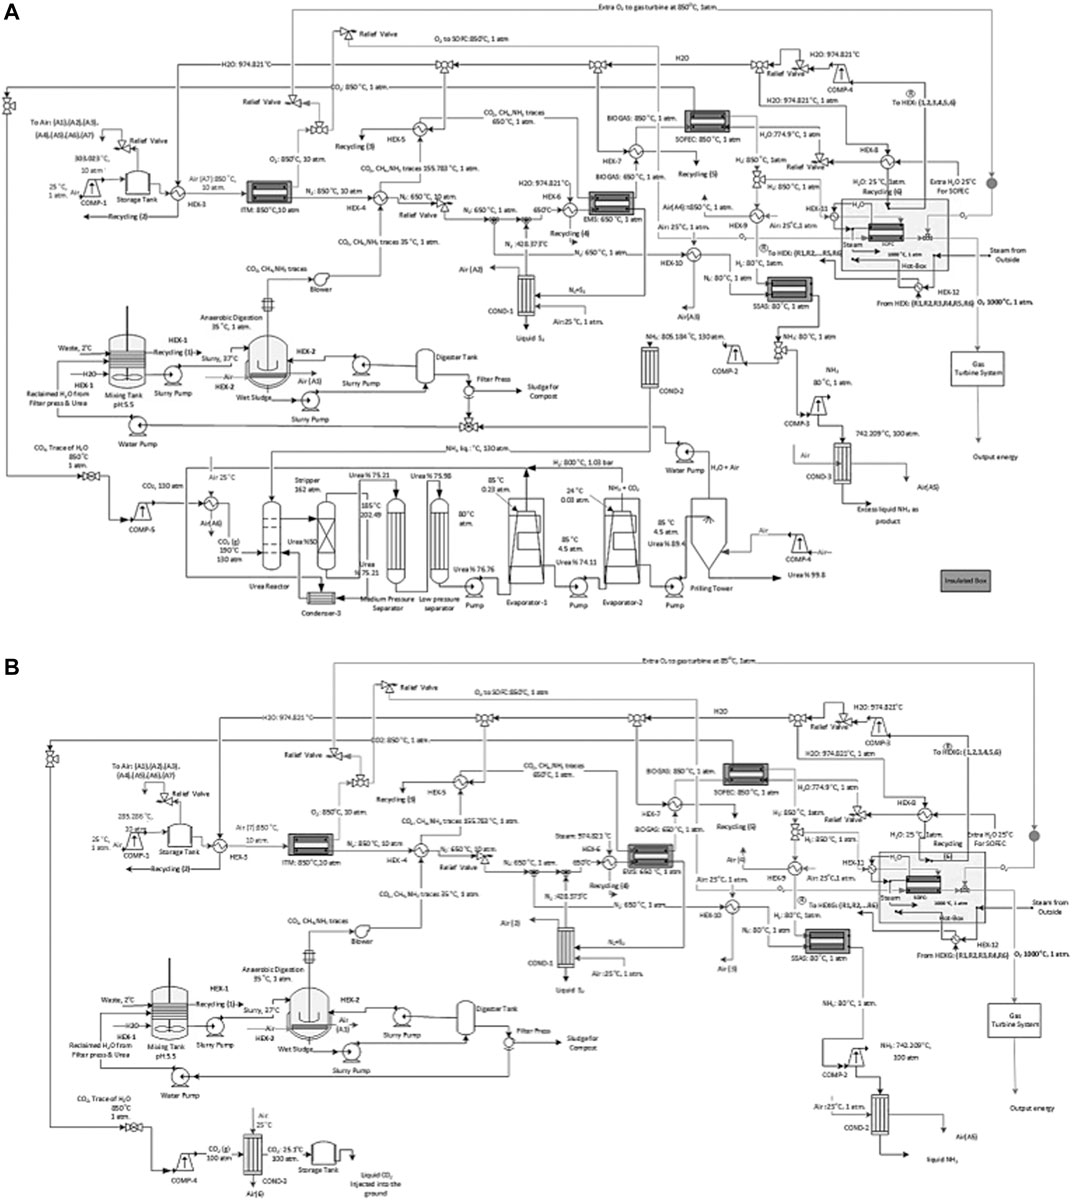
FIGURE 7. A schematic of the process flow diagram of the proposed ammonia production process through, (A) AD with urea production and by incorporating SOFC and (B) AD without urea production with CCS and by incorporating SOFC.
II: The waste stream enters the AD process at 37°C and is cooled to 35°C.
IV: The separated CO2 from the CH4 assisted-SOFEC is mixed, compressed, and cooled before entering the urea production process at 130 atm and 190°C (Figure 7A). While for the process without urea production, the separated CO2 is compressed and cooled to 100 atm and 25.1°C before being captured and injected into the ground or sold commercially (Figure 7B). Simultaneously the separated H2 from the CH4 assisted-SOFEC reaches 80°C before entering the SSAS. The NH3 produced from the SSAS is divided into two streams, the first stream enters the urea production process (Figure 7A). The second stream is compressed to 100 atm, cooled, and finally liquified (Figure 7B). The remaining H2 is heated to 1,000°C before entering the SOFC along with the O2 from the ITM.
Results and Discussion
Technology-1: Modeling Results of Ammonia Production Through a Two-Stage DF Coupled with AD
Input and output waste compositions to and from DF and AD along with the gas/biogas specifications, yields, and the output composition of H2 and CO2, CH4, H2S, etc. are presented in the supplementary materials. The composition of the gas stream from DF is based on a H2 content of 58.7%. If the ratio of H2/CO2 is ≥ 58.7%, the proposed production process produces both steam and power for SOFC, excess NH3, and urea. When the ratio of H2/CO2 ≤ 58.7%, the only output product is urea.
The biogas composition from AD is based on a CH4 content of 81.5%, which is a controllable aspect of the proposed process. If the ratio of CH4/CO2 is ≥ 81.5% the proposed production process produces both steam and power for SOFC, excess NH3, and urea. With the ratio of CH4/CO2 ≤ 81.5% the only output product is urea.
Technology-2: Modeling Results of Ammonia Production Through AD-Only
Input and output waste compositions to and from AD along with the biogas specifications, yields, and the output composition of biogas are shown in supplementary materials.
The biogas composition from AD is based on a CH4 content of 81.5%. If the ratio of CH4/CO2 ≥ 75%, the proposed production process produces both steam and power for SOFC, excess NH3, and urea. When the ratio of CH4/CO2 ≤ 75% the only output product is urea.
Energy Balance Results
A. Energy Balance Results of Ammonia Production Through a Two-Stage DF Coupled with AD
The energy draw is driven primarily by the urea production process, which accounts for approximately 93% of the total energy consumed (Figure 8A). This is followed by the energy loss (6.04 MW), power required for supplying steam (5.2 MW), and driving the impellers. Other energy uses are much smaller; indeed, the next highest energy use is the air compressor (COMP-2) with 1.72 MW. This process is designed with renewable electricity supply (solar/wind).
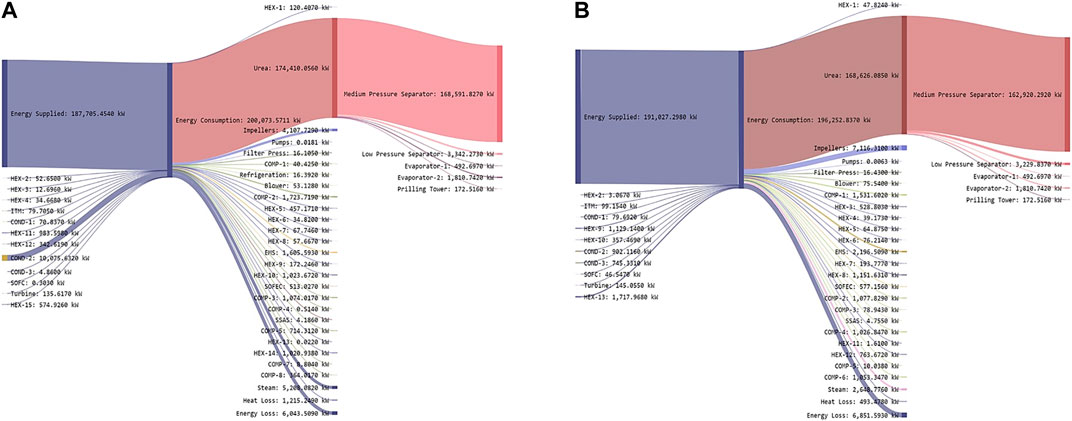
FIGURE 8. Energy flows in the proposed ammonia production through, (A) two-stage DF coupled with AD (Based on Figure 6A) and (B) AD-only process (Based on Figure 7A).
The energy production and consumption for the two-stage process as shown in Sankey diagram (Figure 8A) is calculated based on Eqs (2,3).
The required power for running the membranes is carried out using Eq. (1):
Where, P is the power (kW), I is the total current (A), (Area× current density), and V the total voltage (Ecell ×number of cells).
B. Energy Balance Results of Ammonia Production Through AD-Only
As with the two-stage configuration, urea production is the largest energy user (Figure 8B), accounting for 85% of the energy draw. This is followed by the power required for driving the impellers (7.11 MW), energy loss (6.85 MW), and power required for supplying steam (2.64 MW) as shown in Figure 8B. Other energy uses are smaller, the next highest energy use is the required power for the EMS with 2.19 MW. The source of this electricity is renewable energy sources (solar/wind).
The energy draw in this process (AD-only) is about 8% lower than the two-stage due to higher NH3 production. This is due to higher NH3 yields driven by increased CO2 production resulting from the incorporation of DF. With AD-only, the energy draw goes up due to higher H2S handling by the EMS when DF is not used.
The energy production and consumption for the AD-only process as shown in Sankey diagram (Figure 8B) is calculated based on Eqs. (4,5).
Comparison of Total Daily Production and Consumption Results for the Two Technologies and Seven Scenarios
The highest NH3 yields are obtained from AD, which produces about 6.5 times that of the two-stage process. However, the two-stage process makes more urea in urea-producing configurations. This is due to more CO2 produced with the incorporation of the DF process. Based on Table 3A, the two-stage process consumes less energy and water compared to the AD-only. The AD-only produces about 3.5% less CO2 compared to the two-stage process.
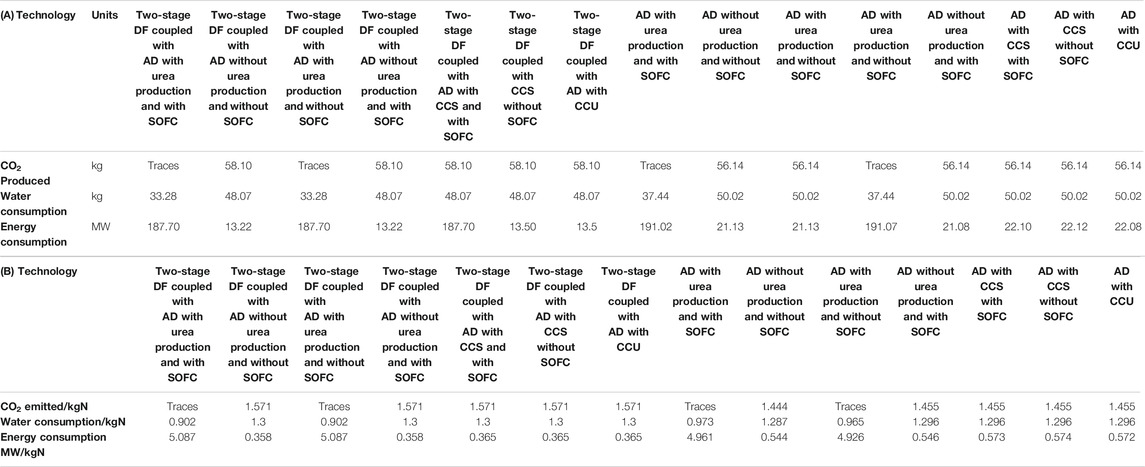
TABLE 3. A comparison of the modeling results of the proposed processes for a 20 tpd waste facility in terms of CO2 emissions, water, and energy consumption (A) daily basis and (B) per kg utilized-N.
Although all calculations for the proposed process are carried out on the basis of per kg NH3 produced, a comparison needs to be conducted for per kg-N basis, since in each of the two technologies when using scenario ii, both urea and NH3 are produced. Table 3B shows the efficiencies of different proposed processes per kg-N basis. The AD-only process is superior to the two-stage in terms of the CO2 emitted/kg-N with 1.455 compared to 1.571. The water usage/kg-N through AD is lower compared to the two-stage except in the case where urea is produced with 0.902 compared to 0.973 for AD process. The energy consumption (MW/kg-N) for the two-stage process is lower than the process with AD except in the case where urea is produced with 5.087 MW compared to 4.961 MW for the AD-only process.
A Comparison of the Proposed Processes with Ammonia Technologies Currently in Use
A comparison of the proposed NH3 production process with conventional methods (SMR and water electrolysis coupled with Haber-Bosch process) in terms of water usage (kg/tNH3), CO2 emissions (kg/tNH3), and energy consumption (kW/tNH3) at steady state condition is shown in Figure 9 (for detailed information see the supplementary materials). This figure shows that the proposed NH3 process through a two-stage DF coupled with AD both with a and without the incorporation of SOFC is the most efficient in terms of water consumption compared to the other technologies. SMR-Haber-Bosch (H-B) uses 0.66 kgH2O/tNH3. While the consumption rate for water electrolysis is approximately 82% higher than SMR-H-B. In terms of CO2 emissions, this process is similar to water electrolysis, assuming that both processes are powered by renewable energy sources. However, the energy consumption of water electrolysis is 0.44 kW/tNH3 which is approximately 15% higher than SMR-H-B and approximately 41% higher than the two-stage process and about 6% lower than the AD-only process.
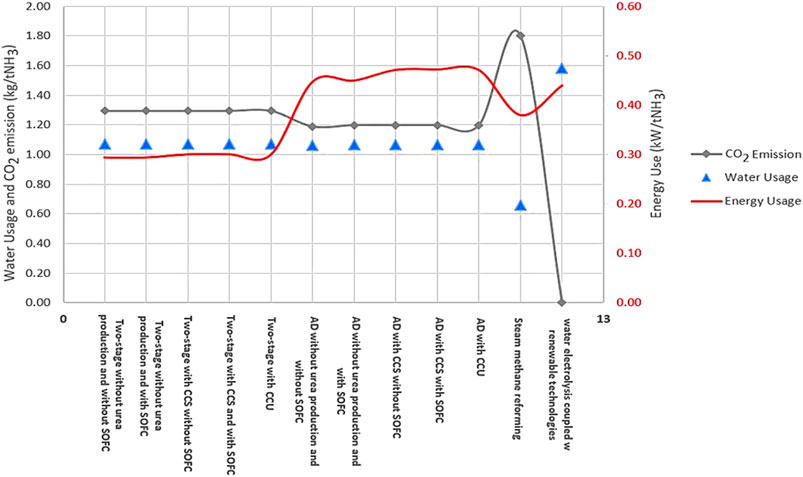
FIGURE 9. A comparison of different proposed ammonia production processes with conventional methods in terms of carbon dioxide emissions, water, and energy usage.
Carbon Dioxide Mitigation by Diverting Different Fractions of FW into the Modeled Process
Assuming 10%, 33%, 50%, and 100% of the FW is directed into our proposed process instead of degrading openly in landfills, this will prevent the release of about 5,159.06, 17,024.91, 25,795.32, and 51,590.64 kg CO2 eq respectively from directly reaching the atmosphere, which results from the open decomposition of FW (see Supplementary Figure S4 in Supplementary Materials).
Sensitivity Analysis
The sensitivity analysis studies the dependency in the output of the proposed model (gas and biogas production, output flow rate of NH3 and urea, number of cells/tubes for membranes, energy demand, water and energy consumption) and the identifiability and significance of the parameters involved (waste compositions, substrate concentrations, input air flow rates, and different dilution ratios). The Total Solid (TS) and Volatile Solid (VS) contents of a substrate affect the functionality of both DF and AD. Changing the TS content of the substrate will result in variations in microbial morphology of DF and AD (Orhorhoro et al., 2017).
Changing the TS of FW and BW for a two-stage DF coupled with AD leads to changes in energy consumption. Sensitivity analysis has been conducted in order to assess how the above-mentioned functionalities respond to changes in these and other key parameters, and about how much variability in these streams may matter to the process conditions, yields, and process outputs. By keeping the VS of FW and BW parameters fixed throughout the sensitivity analysis, the following results as shown in Figure 10 were obtained. The energy consumption of the two-stage DF coupled with AD process (1) is approximately 1.7% higher than the AD-only process (2). As the TS of FW and BW goes up, the energy consumption of both processes (1) and (2) drops significantly due to lower gas/biogas production.
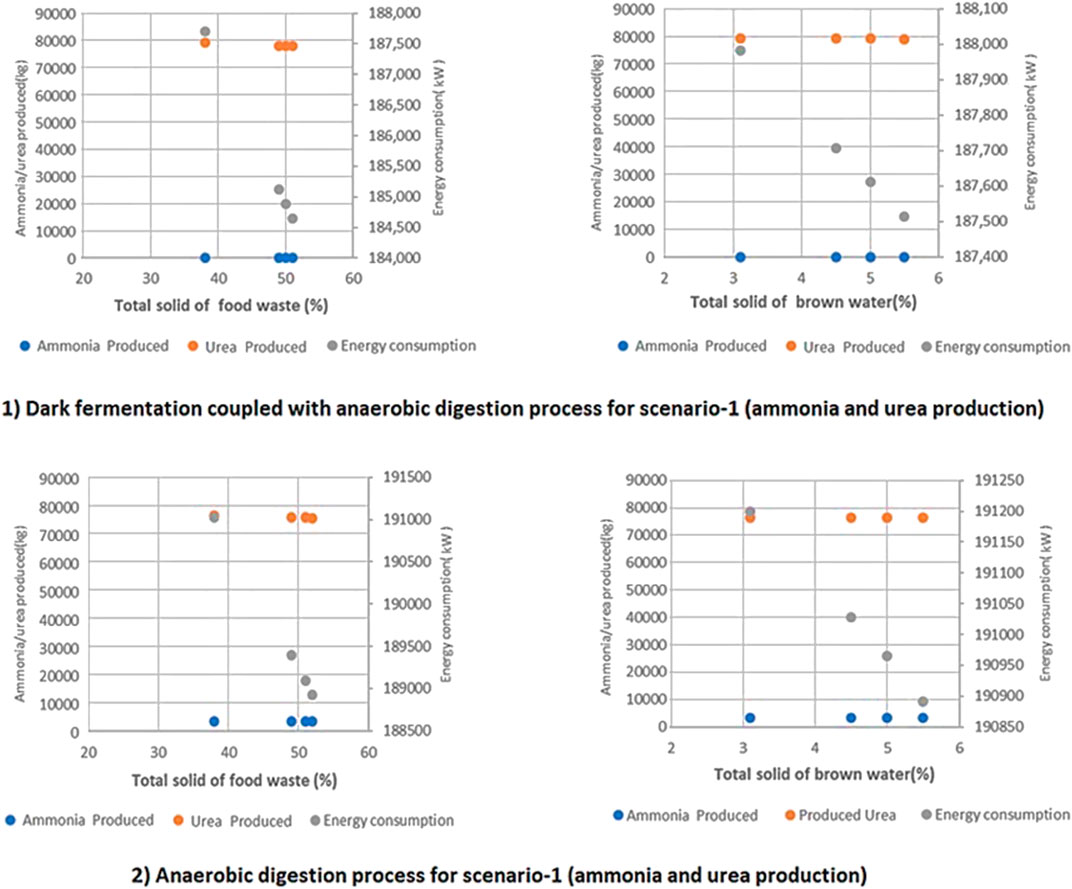
FIGURE 10. A comparison of the two proposed technologies for ammonia production in terms of energy consumption, ammonia, and urea produced at different TS of FW and BW in a 20 tpd facility for 1) two stage DF coupled with AD 2) AD-only process.
Variations on the VS removal of FW have a more significant impact on the two-stage DF coupled with AD process (1) on Organic Loading Rate (OLR) and the theoretical biogas yields compared to the AD-only process (2). This effect becomes more evident by varying the VS removal of FW compared to BW as shown in Figure 11.
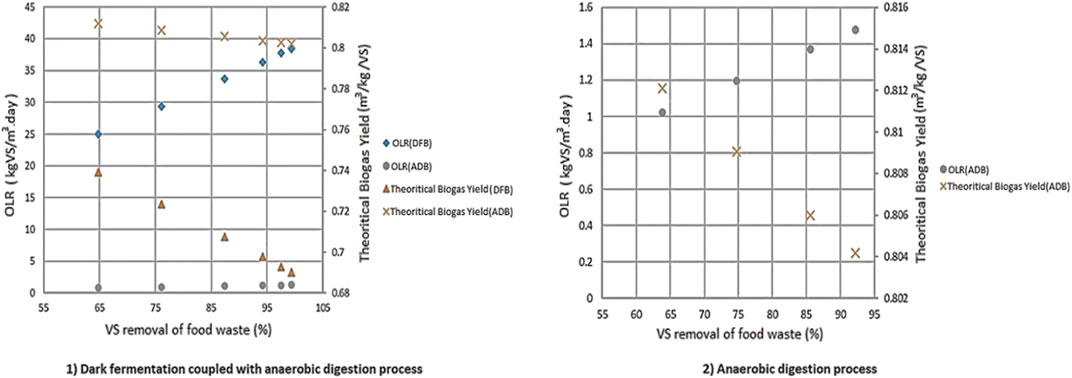
FIGURE 11. The effects of VS removal on both OLR and theoretical biogas yields for 1) two stage DF coupled with AD and 2) AD-only process.
For the two-stage DF coupled with AD process (2), increasing the ratio of FW/BW results in a decrease in the produced H2, NH3, urea, and compost. However, the decrease in urea production is sharper than in the other process outputs. When the ratio of FW/BW is 0.5 the optimum production yields were achieved. Conversely, for the two-stage DF coupled with AD process (2), the NH3 production yield goes up when the ratio of FW/BW increases. This is due to higher CO2 production resulting from the presence of DF in the proposed process based on our modeling method described in the logical flow diagram which can be seen in the supplementary materials. Increasing the dilution rate will result in an increase in compost and CH4 production in both processes. An increase in CH4 production will in turn result in higher NH3 and urea production (Figure 12).
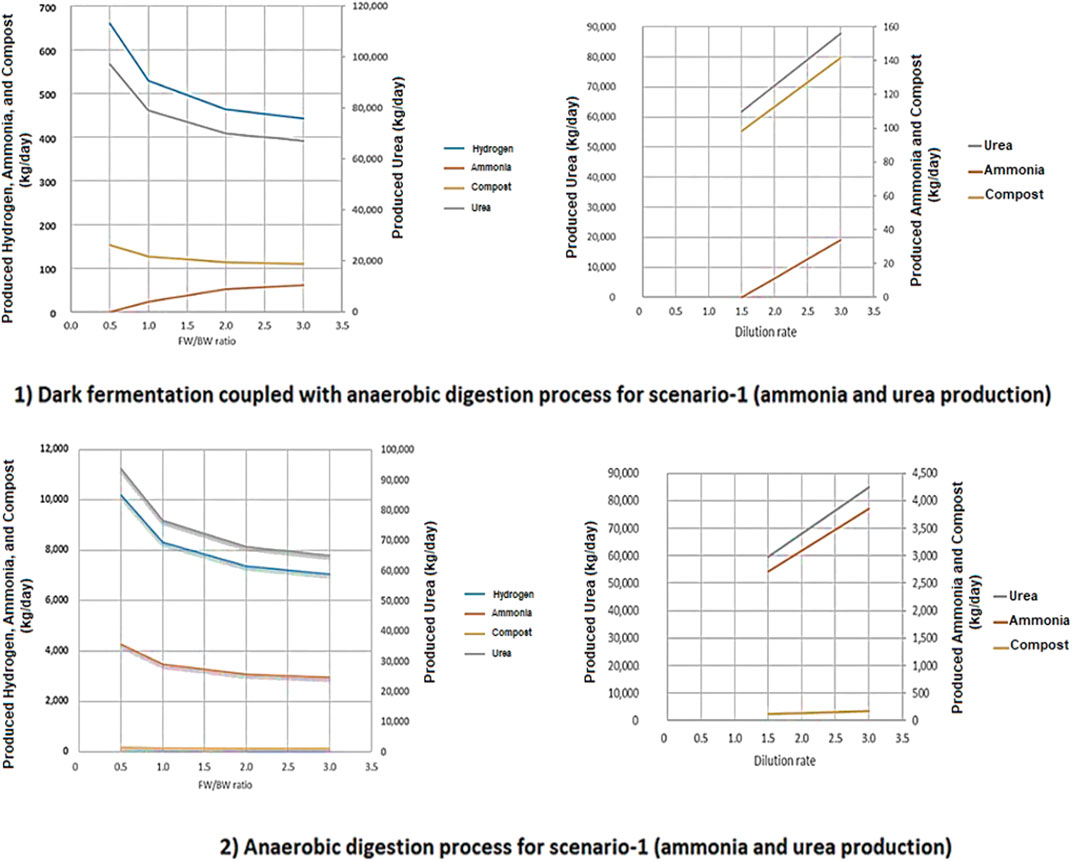
FIGURE 12. The effect of FW/BW ratio and dilution rate on produced hydrogen, ammonia, urea, and compost for both 1) two stage DF coupled with AD and 2) AD-only process.
Conclusion
The results above indicate that among the proposed technologies, the AD-only is the most efficient for GHG emissions, while the two-stage DF coupled with AD process requires less energy per kgNH3 basis. When comparing the proposed NH3 processes to the literature data, water electrolysis powered by renewable technologies is the best of all processes in terms of GHG emissions while steam reforming coupled with Haber-Bosch has the lowest water consumption of all the processes mentioned.
Additional research is needed in a few key areas of research on the production of NH3/urea through waste utilization, environmental impact of water usage for NH3 production and where an NH3 production plant needs to be located, in terms of both availability of feedstock and sustainability (accessibility to renewable energy sources such as solar Photovoltaic (PV) and wind power, distance from the waste hub to the production plant, etc.). Location is an important factor in the development of sustainable production methods, for maximizing productivity and sustainability in the production of chemical compounds such as NH3. Since the inputs and outputs of this proposed NH3 production process are FW and BW, wastewater treatment and solid waste management facilities are resources of interest.
A waste-based, CO2 aware, NH3 production technology leveraging emerging membrane technologies in concert with local infrastructure can provide a viable route to green NH3 and to green fertilizers, providing an effective strategy to address multiple sustainability/sustainable development needs simultaneously.
Data Availability Statement
The raw data supporting the conclusions of this article will be made available by the authors, without undue reservation.
Author Contributions
SG is the lead author and did the model development, analysis, and drafting of the paper. CT gave conceptual input on the model and contributed to the draft. PS was the PhD Supervisor.
Funding
We wish to thank UKRI-BBSRC for funding to PS on grant BB/M011917/1, Renewable Fertilizer Production to Improve Agricultural Efficiencies and Avoid Environmental Harm.
Conflict of Interest
Author CT was employed by the company EarthShift Global LLC.
The remaining authors declare that the research was conducted in the absence of any commercial or financial relationships that could be construed as a potential conflict of interest.
Acknowledgments
The authors want to thank Ahmad G. Adl Tabatabai for his cooperation on this paper.
Supplementary Material
The Supplementary Material for this article can be found online at: https://www.frontiersin.org/articles/10.3389/fenrg.2021.600071/full#supplementary-material
Glossary
ADB Anaerobic Digestion Bioreactor
BW Brown Water
CCS Carbon Capture and Sequestration
CCU Carbon Capture and Utilization
COMP Compressor
COND Condenser
DFB Dark Fermentation Bioreactor
EMS Electrochemical Membrane Separation
EPA Environmental Protection Agency
FAO Food and Agriculture Organization
FW Food Waste
GHG Greenhouse Gas
HEX Heat Exchanger
HW Human Waste
ITM Ion Transport Membrane
LCA Life Cycle Assessment
MFI Membrane Filtration Index
PSA Pressure Swing Adsorption
PV Photovoltaic
SMR Steam Methane Reforming
SOFC Solid Oxide Fuel Cell
SOFEC Solid Oxide Fuel Electrolysis Cell
SRT Solid Retention Time
SSAS Solid State Ammonia Synthesis
TVFA Total Volatile Fatty Acid
USEPA U.S. Environmental Protection Agency
VBA Visual Basic for Applications
Nomenclature
A Surface Area
CO2 eq Carbon Dioxide Equivalent
COD Chemical Oxygen Demand
FE (%) Faradaic efficiency (%)
I Total Current
OLR Organic Loading Rate
P Power
SCOD Soluble Chemical Oxygen Demand
TCOD Total Chemical Oxygen Demand
TVFA Total Volatile Fatty Acid
TS Total Solid
V Total Voltage
VS Volatile Solid
References
BEIS (2017). 2015 UK greenhouse gas emissions, final figures, London: Department for Business, Energy & Industrial Strategy Available at: https://assets.publishing.service.gov.uk/goverment/uploads/attachment_data/file/604350/2015_final_emissions_statistics.pdf [Accessed 10 August, 2020].
CICE (2016). The essential chemical industry. Available at: http://essential chemicalindustry.org/chemicals/ammonia.html [Accessed June 5, 2020].
Colón, J., Forbis-Stokes, A. A., and Deshusses, M. A. (2015). Anaerobic digestion of undiluted simulant human excreta for sanitation and energy recovery in less-developed countries. Energy Sust. Develop. 29, 57–64. doi:10.1016/j.esd.2015.09.005
FAO (2017). World fertilizer trends and outlook to 2020, Rome: FAOAvailable at: http://www.fao.org/3/a-i6895e.pdf [Accessed 07 January, 2020].
Fouladvand, S. (2016). Study of MFI zeolite membranes for CO2 separation. Ph.D. Thesis, Luleå: Luleå University of TechnologyAvailable at: http://Itu.diva-portal.org/smash/get/diva2:1033820/FULLTEXT01.pdf [Accessed 07 January, 2020].
Ghavam, S., Garcia, G. G., and Styring, P. (2021). A novel approach to ammonia synthesis from hydrogen sulfide. Int. J. Hydrogen Energy 46, 4072–4086. doi:10.1016/j.ijhydene.2020.10.192
Hoorfar, M., Alcheikhhamdon, Y., and Chen, B. (2018). A novel tool for the modeling, simulation and costing of membrane based gas separation processes using Aspen HYSYS: optimization of the CO2 /CH4 separation process. Comput. Chem. Eng. 117, 11–24. doi:10.1016/j.compchemeng.2018.05.013
IPCC (2013). Climate change 2013: the physical science basis. Intergovernmental Panel on Climate Change. Available at: https://www.ipcc.ch/report/ar5/wg1/ [Accessed 10 May, 2018].
Isaksson, L. H., Sanabria, A. G., Klimont, Z., Rafaj, P., and Schöpp, W. (2020). Technical potentials and costs for reducing global anthropogenic methane emissions in the 2050 timeframe–results from the GAINS model. Environ. Res. Commun. 2 (025004), 1–21. doi:10.1088/2515-7620/ab7457
Korelskiy, D., Ye, P., Fouladvand, S., Karimi, S., Sjoberg, E., and Hedlund, J. (2015). Efficient ceramic zeolite membranes for CO2/H2 separation. J. Mater. Chem. A 3, 12500–12506. doi:10.1039/C5TA02152A
Lee, U., Han, J., and Wang, M. (2017). Evaluation of landfill gas emissions from municipal solid waste landfills for the life-cycle analysis of waste-to-energy pathways. J. Clean. Prod. 166, 335–342. doi:10.1016/j.jclepro.2017.08.016
MIT News (2017). Explained: greenhouse gases. Available at: http://news.mit.edu/2017/explained-greenhouse-gases-0130 [Accessed June 9, 2018].
Orhorhoro, E. K., Ebunilo, P. O., and Sadjere, G. E. (2017). Experimental determination of effect of total solid (TS) and volatile solid (VS) on biogas yield. Sci. PG 3 (6), 131–135. doi:10.11648/j.ajme.20170306.13
Parkinson, B., Tabatabaei, M., Upham, D. C., Ballinger, B., Greig, C., Smart, S., et al. (2018). Hydrogen production using methane: technoeconomics of decarbonizing fuels and chemicals. Int. J. Hydrogen Energy 43, 2540–2555. doi:10.1016/j.ijhydene.2017.12.081
Paudel, S., Kang, Y., Yoo, Y. S., and Seo, G. T. (2017). Effect of volumetric organic loading rate (OLR) on H2 and CH4 production by two-stage anaerobic co-digestion of food waste and brown water. Waste Manag. 61, 484–493. doi:10.1016/j.wasman.2016.12.013
Pengyu, D., Lianhua, L., Feng, Z., Xiaoying, K., Yongming, S., and Yi, Z. (2017). Comparison of dry and wet milling pre-treatment methods for improving the anaerobic digestion performance of the Pennisetum hybrid. RSC Adv. 7, 12610–12619. doi:10.1039/C6RA27822A
Quantis (2019). Food loss and waste value calculator. Available at: https://www.flwprotocol.org/why-measure/food-loss-and-waste-value-calculator/ [Accessed July 10, 2020].
Rajagopal, R., Ahamed, A., and Wang, J. Y. (2014). Hydrolytic and acidogenic fermentation potential of food waste with source segregated feces-without-urine as co-substrate. Bioresour. Technol. 167, 564–568. doi:10.1016/j.biortech.2014.06.024
Read, Q. D., Brown, S., Cuéllar, A. D., Finn, S. M., Gephart, J. A., Marston, L. T., et al. (2020). Assessing the environmental impacts of halving food loss and waste along the food supply chain. Sci. Total Environ. 712, 136255. doi:10.1016/j.scitotenv.2019.136255
Soloveichik, G. (2017). “Future of ammonia production: improvement of haber-bosch process or electrochemical synthesis?” AIChE annual meeting, topical conference: NH3 energy. Minneapolis, November 1, 2017. Available at: https://www.ammoniaenergy.org/wp-content/uploads/2019/12/NH3-Energy-2017-Grigorii-Soloveichik.pdf [Accessed 05 January, 2018].
Sun, C., Larpudomlert, R., and Thepwatee, S. (2011). Coal Conversion and utilization for reducing CO2 emissions from a power plant, State College: Penn State UniversityAvailable at: https://personal.ems.psu.edu/∼fkd/courses/egee580/2011/Final%20Reports/coal_igcc_report.pdf [Accessed 05 January, 2018].
USEPA (2012). Global anthropogenic non-CO2 Greenhouse gas emissions: 1990–2030, Washington, DC: EPAAvailable at: https://19january2017snapshot.epa.gov/sites/production/files/2016-08/documents/epa_global_nonco2_projections_ dec2012.pdf [Accessed 05 January, 2018].
Keywords: green hydrogen, green ammonia, waste utilization, carbon capture and sequestration (CCS), carbon capture and utilization (CCU), dark fermentation, anaerobic digestion
Citation: Ghavam S, Taylor CM and Styring P (2021) Modeling and Simulation of a Novel Sustainable Ammonia Production Process From Food Waste and Brown Water. Front. Energy Res. 9:600071. doi: 10.3389/fenrg.2021.600071
Received: 28 August 2020; Accepted: 25 January 2021;
Published: 26 April 2021.
Edited by:
Youngjune Park, Gwangju Institute of Science and Technology, South KoreaReviewed by:
Xuezhong He, Guangdong Technion-Israel Institute of Technology (GTIIT), ChinaShantanu Roy, Indian Institute of Technology, India
Copyright © 2021 Ghavam, Taylor and Styring. This is an open-access article distributed under the terms of the Creative Commons Attribution License (CC BY). The use, distribution or reproduction in other forums is permitted, provided the original author(s) and the copyright owner(s) are credited and that the original publication in this journal is cited, in accordance with accepted academic practice. No use, distribution or reproduction is permitted which does not comply with these terms.
*Correspondence: Seyedehhoma Ghavam, c2doYXZhbTFAc2hlZmZpZWxkLmFjLnVr