 Jun Xiao1
 Ying Wang
- 1Key Laboratory of Smart Grid of Ministry of Education, Tianjin University, Tianjin, China
- 2State Grid Tianjin Electric Power Research Institute, Tianjin, China
This work proposes a method to analyze distributed generation (DG) accommodation in a flexible distribution network (FDN). Firstly, the DG-load matching degree is proposed to quantitatively describe the power balance degree of DG and load in a distribution network. Secondly, the accommodation ratio of DG is proposed and divided into a DG-load accommodation ratio and DG-network-load accommodation ratio, to distinguish whether the index takes the network operational constraints into account. We derive the DG-load accommodation ratio directly from the matching degree and propose the simulation model of sequential production to solve the DG-network-load accommodation ratio. Finally, the cases of FDN under the scenarios of different matching degrees are studied and compared with those of the traditional rigid distribution network. The results show that the improvement of the accommodation ratio by upgrading the rigid distribution network to an FDN is conditional, which is related to not only the matching degree of the whole network but also that of each local network. The DG-network-load accommodation ratio will tend to the DG-load accommodation ratio if proper planning or optimization measures are taken. We find that the capacity of branches adjacent to the DG bus mainly limit the DG accommodation in the FDN, and it is recommended to relocate the DGs and enlarge the capacity of those branches.
Introduction
The installed capacity of distributed generations (DGs) is rapidly increasing in distribution networks in recent years. Due to the intermittency and uncertainty of DGs, it is difficult to accommodate a large number of DGs in the traditional distribution networks (Stram, 2016).
The development of power electronics technology provides a new idea to solve this problem (Huang et al., 2011; Rueda-Medina and Padilha-Feltrin, 2013). The flexible power electronic equipment, such as the soft open point (SOP) (Zhu et al., 2018), is with great power flow control capability. SOPs refer to the flexible switches in distribution networks usually using back-to-back voltage source converters. SOPs are installed previously at normally open points (NOPs) of the distribution network (Cao et al., 2016). An SOP is able to provide the dynamic and continuous active/reactive power flow controllability and limit the short current (Escalera et al., 2020). The application of the SOP will promote the flexibility and controllability of the distribution system. The SOP improves the capability of the distribution network to host high-penetration DGs (Shafik et al., 2019). The SOP relives the negative effect of intermittent DGs on the operation of distribution networks (Guo et al., 2020). In addition, through controlling the SOPs, the network losses can be reduced and the voltage levels can be well maintained (Flottemesch and Rother, 2004) without involving open/close switch operations. The SOPs can also avoid the power outage when the system is in fault and improve the system reliability (Barragan et al., 2012). Some pilot projects have demonstrated that the SOP is beneficial to a distribution network in many aspects, such as optimal power flow, load balancing, voltage regulation, power supply restoration, and accommodation of DG, which indicates its potential in the future distribution network (Western Power Distribution, 2016; SP Energy Networks, 2016).
The article (Xiao et al., 2018b) proposes the system-level concept of the flexible distribution network (FDN). An FDN is defined as the distribution network with flexible power flow controllability using multiterminal SOPs (including two-terminal SOPs). The article (Xiao et al., 2017a) proposes the total supply capability (TSC) of the FDN. The articles (Xiao et al., 2017b) and (Xiao et al., 2020) adopt the region method to observe the FDN and propose the model and observation approach of the dispatchable region of the FDN. However, the DG accommodation in the FDN has not been studied yet in the existing researches. This work analyzes the DG accommodation in the FDN, which will provide fundamental results for the planning scheme of the FDN to accommodate more DGs.
As for the assessment of the DG accommodation capability of distribution networks, the classical indices include the maximum admissible wind/solar power, wind/solar curtailment rate (Liu and Chu 2018; Ye et al., 2019), etc. However, these indices cannot reflect the essence of DG accommodation capability, which is determined by the location and power balance of DG and load, as well as network operational constraints. This paper proposes the concept of DG-load matching degree, to quantitatively describe the relative value of the power energy output from DG and load consumption in a distribution network. The DG accommodation ratio is proposed and divided into two subindices, including the DG-load accommodation ratio and DG-network-load accommodation ratio. DG-load accommodation ratio is derived directly from matching degree and DG-network-load accommodation ratio is solved by simulation model of sequential production. The proposed DG accommodation analysis method is simple and effective. It directly reflects the effect of DG accommodation capability caused by location and power balance between DG and load, as well as network operational constraints. The accommodation ratio of the traditional rigid distribution network and FDN are calculated and analyzed on case studies. The results discover the bottleneck of DG accommodation in the FDN, and the measures are proposed to remove these bottlenecks.
Concepts of Matching Degree and Accommodation Ratio
The primary constraint of DG accommodation capability is to keep the real-time power balance of production and consumption. For an ideal distribution system without network operational constraints (i.e., thermal capacity constraints and voltage profile constraint), the DG accommodation capability is determined only by the load power. Therefore, the core idea of DG accommodation is to utilize load. The concept of DG-load matching degree is proposed in this section. Furthermore, the DG-load accommodation ratio and DG-network-load accommodation ratio are proposed to assess the influence of load on the DG accommodation.
Matching Degree
It is said the DG and load are “matched” in a distribution network during a period T only if the following condition is satisfied:
Otherwise, it is said the DG and load are “unmatched” if
In Eqs. 1, 2, T is the period of observation, and the unit is hour.
If the DG and load are matched in a distribution network, that is, Eq. 1 is satisfied, the matching degree, represented by EΩ, is defined as
where,
If the DG and load are unmatched in a distribution network, that is, Eq. 1 is not satisfied, the matching degree is defined as
where
According to Eqs. 1-4, it can be seen that “EΩ ≥ 0” is equivalent to “matched,” while “EΩ < 0” is equivalent to “unmatched”.
The DG output power is characterized by intermittency and uncertainty due to the uncertain weather conditions. Therefore, it is necessary to take uncertain weather conditions into account in the DG-load matching degree, which makes it to be calculated by an integral expression. Generally, the calculation speed can be improved by simplifying the integral. For example, the DG output curve can be simplified by assuming the DG output power is constant during a certain time. The result is relatively conservative, but the calculation speed is improved. In practical application, the speed and accuracy of calculation can be reasonably balanced according to the requirement of planning issues.
In distribution network planning, the DG-load matching degree can be applied to the primary capacity planning for the DG integrated in distribution networks. On the basis of the typical load curve of the distribution network, DG installed capacity can be obtained with the goal of maximum DG-load matching degree. The result is the maximum DG installed capacity such that the output power of the DG can be totally accommodated. When DGs are connected to the distribution network, the DG locations can be optimized by taking them as variables of the DG planning model.
Accommodation Ratio
The accommodation ratio is used in this work to assess the DG accommodation capability of a distribution network. The accommodation ratio, represented by λDG, is defined as the proportion of the actual output power energy to the maximum available output power energy of all the DGs in a distribution network during period T, as is shown in the following equation:
where
Load power and network operational constraints are the key influences of DG accommodation capability. To analyze the influences separately, the accommodation ratio is divided into two subindices, including the DG-load accommodation ratio and DG-network-load accommodation ratio.
The DG-load accommodation ratio, represented by λGL, is equal to the accommodation ratio without any network operational constraints. The definition of the DG-load accommodation ratio is consistent with the matching degree, which reflects the overall DG-load power balance. The concept of DG-load accommodation ratio is similar to the “substation capacity-load ratio” (Xiao et al., 2018a), which is a classical index for distribution network planning, and also neglects the network operational constraints.
The DG-network-load accommodation ratio, represented by λGNL, is equal to the accommodation ratio considering network operational constraints. The definition of the DG-network-load accommodation ratio reflects the effects of network operational constraints on the DG accommodation capability, which is effective supplementary to the DG-load accommodation ratio.
The DG-load accommodation ratio (λGL) and DG-network-load accommodation ratio (λGNL) are depicted in Figure 1. The area between the blue dot line (λDG = 100%) and red curve (λGL) is the power energy curtailment of the DG due to the load power limit. The area between the red curve (λGL) and green curve (λGNL) is the power energy curtailment of the DG due to the network operational constraints limit.
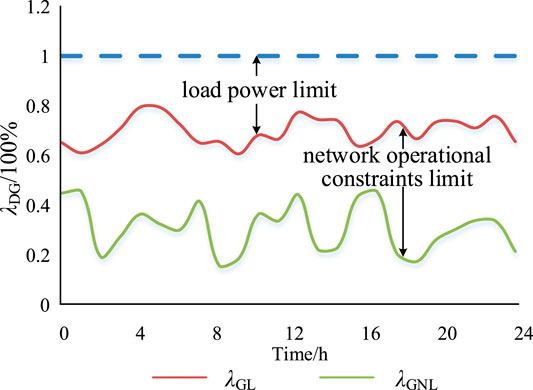
FIGURE 1. Influences on DG accommodation of load power and network operational constraints.
The DG-network-load accommodation ratio curve will tend to the DG-load accommodation ratio curve if proper planning or optimization measures are taken, such as regulating voltage and expanding feeder capacity. Particularly, λGNL = λGL if the network operational constraints are completely eliminated.
The proposed accommodation ratio is similar to the existing DG penetration (Anderson et al., 2009). The DG penetration can be divided into power penetration, capacity penetration, and energy penetration. The power penetration and capacity penetration are the power ratios of DG to load (Anderson et al., 2009); the energy penetration (Moghaddam et al., 2018), which is most similar to the concept of accommodation ratio, is the energy ratio of DG to load. The accommodation ratio and energy penetration both utilize the power energy of the DG and load to analyze the DG accommodation capability. The difference is that the accommodation ratio, which reflects the utilization of DG, is the proportion of the actual output power energy to the maximum available output power energy of the DG, while the energy penetration, which reflects the supply capability of the DG in the distribution network, is the proportion of the maximum available output power energy of the DG to load consumption. Compared with energy penetration, the accommodation ratio can separately reflect the effects of load power and network operational constraints on the DG accommodation capability directly.
Calculation of the DG-Load Accommodation Ratio
Since the network operational constraints are not considered in the DG-load accommodation ratio, it can be directly deduced from the matching degree.
Firstly, a distribution network is usually not fully connective. However, it can be divided into several fully connective local networks. The division boundary is the normally open tie switches. As shown in Figure 2, the distribution network is divided into four local networks Ω1, …, Ω4.
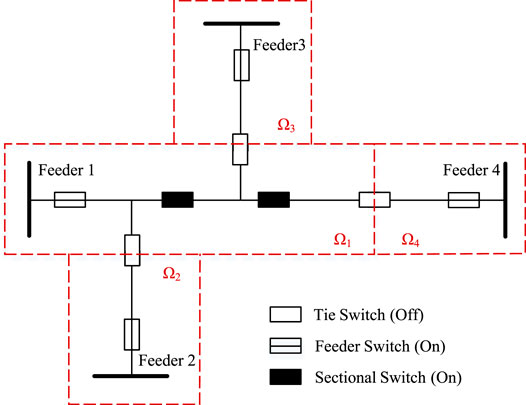
FIGURE 2. Schematic diagram of the distribution network division.
For a fully connective local network Ω, based on Eqs. 3-5, the DG-load accommodation ratio (λGL) can be formulated as
where C is a constant. The detailed deduction is shown as follows:
(1) When EΩ ≥ 0, that is, the DG and load are matched,
(2) When EΩ < 0, that is, the DG and load are unmatched,
where C is a constant,
It can be seen from Eq. 6 that
(1) when EΩ ≥ 0, that is, the DG and load are matched, the output power of the DG can be totally accommodated, and the DG-load accommodation ratio is 100%.
(2) when EΩ < 0, that is, the DG and load are unmatched, the DG-load accommodation ratio is determined by the matching degree and sum of the maximum available output power energy of DGs.
The FDN is fully connective because all the mechanical normally open tie switches are replaced with SOPs. Therefore, the DG-load accommodation ratio of the FDN can be directly calculated with Eq. 6.
However, for a rigid distribution network, which is not fully connective, the DG-load accommodation ratio should be calculated as follows. Assuming that a rigid distribution network is composed of N fully connective local networks Ω1,…, Ωi,…, ΩN,
(1) the DG-load accommodation ratio of each local network is calculated according to Eq. 6, and
(2)
(3)WDG is applied to Eq. 5, and the DG-load accommodation ratio of the rigid distribution network is obtained.
Calculation of the DG-Network-Load Accommodation Ratio
Since the DG-network-load accommodation ratio takes the network operational constraints into account, it cannot be directly obtained based on the matching degree, which is different from the DG-load accommodation ratio. The simulation model of sequential production (Shu et al., 2017), which is usually used for the transmission network planning issue, is used here to solve the DG-network-load accommodation ratio. In this section, the calculation of the DG-network-load accommodation ratio of the FDN will be studied. The DG-network-load accommodation ratio of the rigid distribution network is just a bit different from that of the FDN in the network operational constraints (Wang et al., 2017) of the simulation model of sequential production.
Assumptions
This work is mainly focused on the urban distribution network, which is featured as high load density and short power supply range. Thus, the following assumptions are used:
(1) DC power flow (Purchala et al., 2005) is used. First, the network loss can be included in the power flow of the feeder outlets (Xiao et al., 2011) because the feeders are usually short in length and the network loss ratio is small in the urban power grid. Second, the voltage constraints can be neglected because the system and the DGs are all capable of regulating the bus voltage; thus, the voltage can be kept within the security limits (Shi et al., 2016).
(2) The power cannot flow reversely from 10 kV feeders to an upper-level substation because the upper-level power grid needs great changes for reverse power flow, such as relay protection settings, which is hardly realized in the short term (Fernandez et al., 2020).
Simulation Model of Sequential Production of the FDN
(1) Objective function
The objective is to maximize the sum of the actual output power energy of all the DGs during period T,
where
(2) Network operational constraints
The network operational constraints include power flow constraints and security constraints. The power which flows out of bus, such as load consumption power, is noted as positive, while the power which injects into of bus, such as DG output power, is noted as negative. The power which flows from a substation to a feeder terminal is noted as positive. The power which flows from a feeder to the connected SOP is noted as positive. Due to the assumptions in Assumptions, the constraints are simplified as follows.
The branch flow PBi,j can be expressed as the algebraic sum of the net power of downstream nodes and the power injected into the downstream SOPs. The power flow equations are formulated as follows:
where Bi,j is the branch j of feeder Fi.
Due to the assumptions in Assumptions, the voltage constraints are neglected. The security constraints of the FDN with DG installed are mainly thermal capacity constraints, including the feeder capacity constraints, node power constraints, DG output constraints, SOP capacity constraints, and the reverse power flow constraints.
where
Algorithm
The model in Simulation Model of Sequential Production of the FDN is linear, which can be solved by the linear programming software after identical deformation (Xiao et al., 2011). The detailed deformation is shown in Supplementary Material 1. In this paper, LINGO is used to solve the model to obtain WDG. WDG is applied to Eq. 5, and the DG-network-load accommodation ratio is obtained.
Case Study
In this section, cases of FDN with different matching degrees are studied. For three scenarios with different DG planning, the DG-load accommodation ratio and DG-network-load during 1 h are calculated, and their trends during one day are analyzed. Meanwhile, the DG-load accommodation ratio and DG-network-load accommodation ratio of a rigid distribution network are also analyzed as a comparison. The bottlenecks of the FDN to improve DG accommodation capability are analyzed, and the improvement measurements are proposed.
Case Grid
The case grid of the FDN is shown in Figure 3. For comparison, the case grid of a rigid distribution network (RDN) with the same topology is used, and the FDN is divided into two local networks corresponding to the RDN. The total daily power energy of the load is 597.8 MWh for both the FDN and rigid distribution network, and the details are shown in Supplementary Tables S1 and S2. For both the FDN and rigid distribution network, each DG capacity is 8 MW and the distribution transformer capacity is 10 MVA. For the FDN, each terminal of the SOP is 10 MVA.
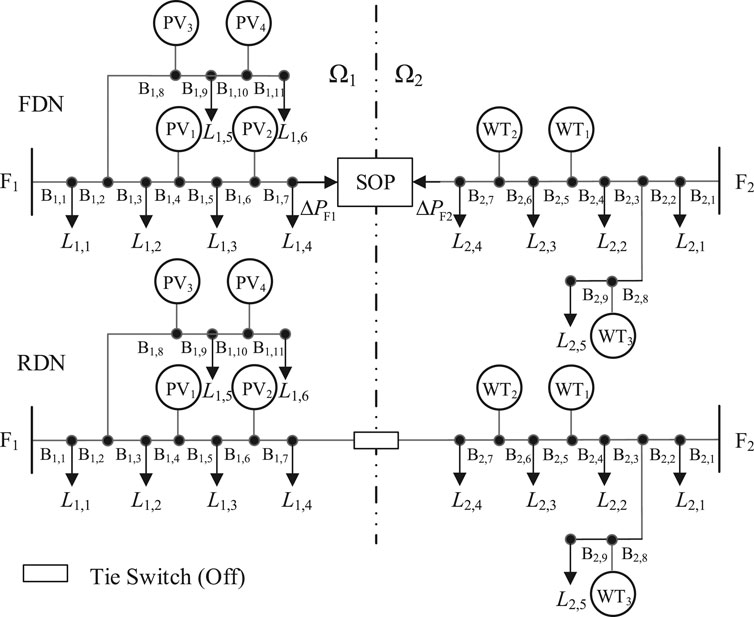
FIGURE 3. Case grid of the FDN and RDN.
However, considering the uncertainty of DG output power caused by weather conditions, three typical scenarios are designed to represent the different matching degrees, as is shown in Table 1.
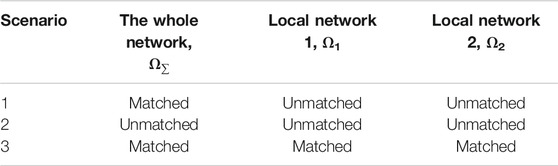
TABLE 1. Three typical scenarios of case grids.
Scenario 1
Matching Degree Calculation
The daily curve of the maximum available output power of DGs and actual consumption power of the load is shown in Figure 4.
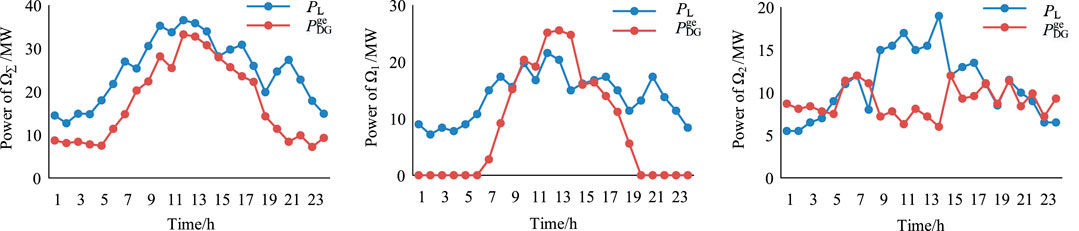
FIGURE 4. Scenario 1: daily curve of the available output power of DGs and consumption power of the load.
According to Figure 4, the matching degree (MD) is calculated using Eqs. 3, 4. For the whole network, MD = 70.3%. For local network 1, MD = −5%. For local network 2, MD = −5.3%.
Daily Trend of the Accommodation Ratio
According to Figure 4, for the case grids of both the FDN and rigid distribution network (RDN), the DG-load accommodation ratio and DG-network-load accommodation ratio during each hour are calculated using Eqs. 6, 9. Then, the DG-load accommodation ratio (GLAR, represented by λGL) and DG-network-load accommodation ratio (GNLAR, represented by λGNL) of all 24 h are used to form the daily accommodation ratio curve, as is shown in Figure 5.
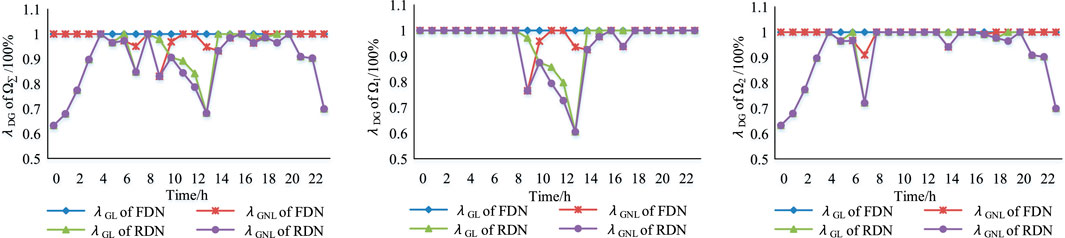
FIGURE 5. Scenario 1: daily GLAR and GNLAR curve of both the FDN case and RDN case.
It can be seen from Figure 5 that
(1) the DG-load accommodation ratio of the FDN is higher than that of the rigid distribution network during 66.7% of a day’s period. The reason is that the FDN can adjust the power flow flexibly to increase DG accommodation.
(2) the DG-network-load accommodation ratio of the FDN is higher than that of the rigid distribution network during 58.3% of a day’s period. The reason is that the FDN increases the DG accommodation by adjusting the power flow, while the increase extent of DG accommodation is limited by network operational constraints. For the PV accommodation of local network 1, it is focused in midday that the DG-network-load accommodation ratio of the FDN is higher than that of the rigid distribution network. For the WT accommodation of local network 2, it is focused from dusk to the next morning such that the DG-network-load accommodation ratio of the FDN is higher than that of the rigid distribution network.
(3) the DG-load accommodation ratio of the FDN can reach 100% anytime. The reason is that the FDN is capable to fully accommodate the DGs by adjusting the power flow flexibly, when the load and DG of the whole network are matched.
(4) the DG-network-load accommodation ratio of the FDN is lower than the DG-network-load accommodation ratio during 37.5% of a day’s period. The reason is that network operational constraints limit the FDN adjusting power flow.
Analysis of the Daily Accommodation Ratio
According to Figure 4, for the case grids of both the FDN and rigid distribution network (RDN), the DG-load accommodation ratio (GLAR) and DG-network-load accommodation ratio (GNLAR) during a whole day are calculated using Eqs. 6, 9, which is shown in Table 2.
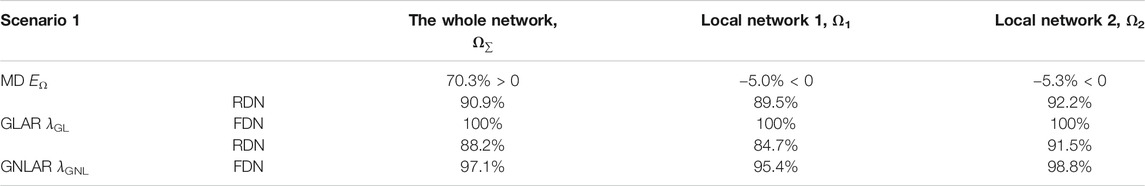
TABLE 2. Matching degree and daily accommodation ratio of scenario 1.
It can be seen from Table 2 that
(1) since matching degree of scenario 1 is positive, the daily DG-load accommodation ratio of the FDN is 100%.
(2) due to the network operational constraints, the daily DG-network-load accommodation ratio of local network 1 and local network 2 of the FDN case is reduced by 4.6% and 1.2%, respectively. The daily DG-network-load accommodation ratio of the whole network of the FDN is reduced by 2.9%.
(3) since matching degrees of local network 1 and local network 2 are all negative, the rigid distribution network case cannot fully accommodate all DGs, and the daily DG-load accommodation ratio of the rigid distribution network is lower than 100%.
(4) due to the network operational constraints, the daily DG-network-load accommodation ratio of local network 1 and local network 2 of the rigid distribution network case is reduced by 4.8% and 0.7%, respectively. The daily DG-network-load accommodation ratio of the whole network of the rigid distribution network is reduced by 2.7%.
(5) compared with the rigid distribution network, the FDN can improve the daily DG-load accommodation ratio by 9.1% and daily DG-network-load accommodation ratio by 8.9%.
Scenario 2
Matching Degree Calculation
The daily curve of the maximum available output power of DGs and actual consumption power of the load is shown in Figure 6.
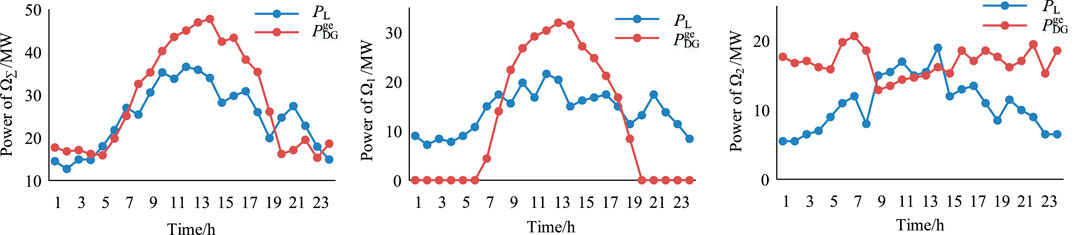
FIGURE 6. Scenario 2: daily curve of the available output power of DGs and consumption power of the load.
According to Figure 6, the matching degree (MD) is calculated using Eqs. 3, 4. For the whole network, MD = −16.8%. For local network 1, MD = −20.3%. For local network 2, MD = −48.2%.
Daily Trend of the Accommodation Ratio
According to Figure 6, for the case grids of both the FDN and rigid distribution network (RDN), the DG-load accommodation ratio and DG-network-load accommodation ratio during each hour are calculated using Eqs. 6, 9. Then, the DG-load accommodation ratio (GLAR, represented by λGL) and DG-network-load accommodation ratio (GNLAR, represented by λGNL) of all 24 h are used to form the daily accommodation ratio curve, as is shown in Figure 7.
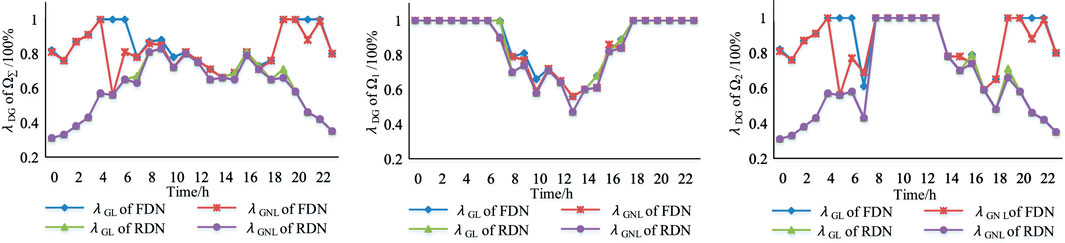
FIGURE 7. Scenario 2: daily GLAR and GNLAR curve of both the FDN case and RDN case.
It can be seen from Figure 7 that
(1) the DG-load accommodation ratio of the FDN is higher than that of the rigid distribution network during 83.3% of a day’s period. The reason is that the FDN can adjust the power flow flexibly to increase DG accommodation.
(2) the DG-network-load accommodation ratio of the FDN is higher than that of the rigid distribution network during 83.3% of a day’s period. The reason is that the FDN increases the DG accommodation by adjusting the power flow, while the increase extent of DG accommodation is limited by network operational constraints. For the PV accommodation of local network 1, it is focused that the DG-network-load accommodation ratio of the FDN is just a little higher than that of the rigid distribution network in daytime. For the WT accommodation of local network 2, it is focused from dusk to the next morning that the DG-network-load accommodation ratio of the FDN is much higher than that of the rigid distribution network.
(3) the DG-load accommodation ratio of the FDN cannot reach 100% during 70.8% of a day’s period. The reason is that the FDN cannot fully accommodate the DGs by adjusting the power flow, when the load and DG of the whole network are unmatched.
(4) the DG-network-load accommodation ratio of the FDN is lower than the DG-load accommodation ratio during 37.5% of a day’s period. The reason is that network operational constraints limit the FDN adjusting power flow.
Analysis of the Daily Accommodation Ratio
According to Figure 6, for the case grids of both the FDN and rigid distribution network (RDN), the DG-load accommodation ratio (GLAR) and DG-network-load accommodation ratio (GNLAR) during a whole day are calculated using Eqs. 6, 9, which is shown in Table 3.

TABLE 3. Matching degree and daily accommodation ratio of scenario 2.
It can be seen from Table 3 that
(1) since the matching degree of scenario 2 is negative, the daily DG-load accommodation ratio of the FDN is 81.9% (<100%).
(2) due to the network operational constraints, the daily DG-network-load accommodation ratio of local network 1 and local network 2 of the FDN case is reduced by 2.2% and 3.5%, respectively. The daily DG-network-load accommodation ratio of the whole network of the FDN is reduced by 3.0%.
(3) since matching degrees of local network 1 and local network 2 are all negative, the rigid distribution network case cannot fully accommodate all DGs, and the daily DG-load accommodation ratio of the rigid distribution network is lower than 100%.
(4) due to the network operational constraints, the daily DG-network-load accommodation ratio of local network 1 and local network 2 of the rigid distribution network case is reduced by 1.3% and 0.4%, respectively. The daily DG-network-load accommodation ratio of the whole network of the rigid distribution network is reduced by 0.8%.
(5) compared with the rigid distribution network, the FDN can improve the daily DG-load accommodation ratio by 16.3% and daily DG-network-load accommodation ratio by 14.1%.
Scenario 3
Matching Degree Calculation
The daily curve of the maximum available output power of DGs and actual consumption power of the load is shown in Figure 8.
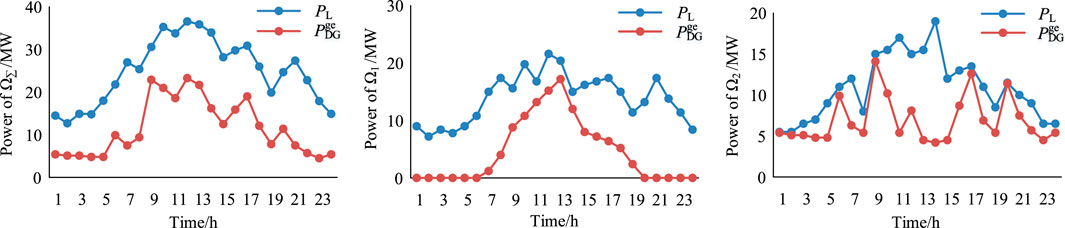
FIGURE 8. Scenario 3: daily curve of the available output power of DGs and consumption power of the load.
According to Figure 8, the matching degree (MD) is calculated using Eqs. 3, 4. For the whole network, MD = 46.4%. For local network 1, MD = 33.3%. For local network 2, MD = 63.1%.
Daily Trend of the Accommodation Ratio
According to Figure 8, for the case grids of both the FDN and rigid distribution network (RDN), the DG-load accommodation ratio and DG-network-load accommodation ratio during each hour are calculated using Eqs. 6, 9. Then, the DG-load accommodation ratio (GLAR, represented by λGL) and DG-network-load accommodation ratio (GNLAR, represented by λGNL) of all 24 h are used to form the daily accommodation ratio curve, as is shown in Figure 9.
FIGURE 9. Scenario 3: daily GLAR and GNLAR curve of both the FDN case and RDN case.
It can be seen from Figure 9 that
(1) the DG-load accommodation ratio of the FDN is equal to that of the rigid distribution network anytime. The reason is that the rigid distribution network is capable of accommodating the DGs; thus, the FDN cannot increase DG accommodation by adjusting the power flow.
(2) the DG-network-load accommodation ratio of the FDN is higher than that of the rigid distribution network during 16.7% of a day’s period. The reason is that DG accommodation in the rigid distribution network is limited by network operational constraints, and it is increased in the FDN by adjusting the power flow. For the PV accommodation of local network 1, it is focused in midday that the DG-network-load accommodation ratio of the FDN is higher than that of the rigid distribution network. For the WT accommodation of local network 2, it is focused from dusk to the next morning that the DG-network-load accommodation ratio of the FDN is higher than that of the rigid distribution network.
(3) the DG-load accommodation ratio of the FDN can reach 100% anytime. The reason is that the FDN is capable of fully accommodating the DGs, when the load and DG of the whole network are matched.
(4) the DG-network-load accommodation ratio of the FDN is lower than the DG-load accommodation ratio during 20.8% of a day’s period. The reason is that network operational constraints limit the FDN adjusting power flow.
Analysis of the Daily Accommodation Ratio
According to Figure 8, for the case grids of both the FDN and rigid distribution network (RDN), the DG-load accommodation ratio (GLAR) and DG-network-load accommodation ratio (GNLAR) during a whole day are calculated using Eqs. 6, 9, which is shown in Table 4.
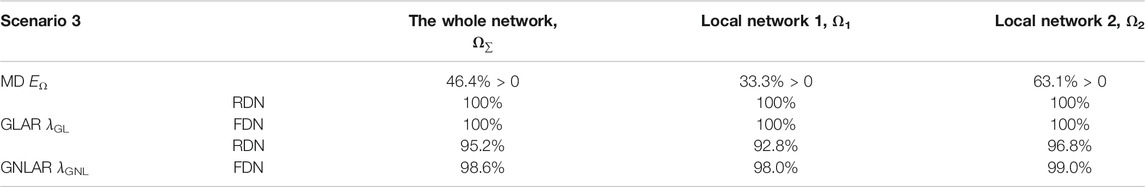
TABLE 4. Matching degree and daily accommodation ratio of scenario 3.
It can be seen from Table 4 that
(1) since the matching degree of scenario 3 is positive, the daily DG-load accommodation ratio of the FDN is 100%.
(2) due to the network operational constraints, the daily DG-network-load accommodation ratio of local network 1 and local network 2 of the FDN case is reduced by 2.0% and 1.0%, respectively. The daily DG-network-load accommodation ratio of the whole network of the FDN is reduced by 1.4%.
(3) since matching degrees of local network 1 and local network 2 are all positive, the daily DG-load accommodation ratio of the rigid distribution network is 100%.
(4) due to the network operational constraints, the daily DG-network-load accommodation ratio of local network 1 and local network 2 of the rigid distribution network case is reduced by 7.2% and 3.2%, respectively. The daily DG-network-load accommodation ratio of the whole network of the rigid distribution network is reduced by 4.8%.
(5) compared with the rigid distribution network, the FDN cannot improve the daily DG-load accommodation ratio under scenario 3.
Overall Analysis for 3 Scenarios
In Figure 10, the results of the FDN and rigid distribution network (RDN) in three scenarios are summarized, including DG-load matching degrees (MDs, represented by EΩ), DG-load accommodation ratios (GLARs, represented by λGL), and DG-network-load accommodation ratios (GNLARs, represented by λGNL).
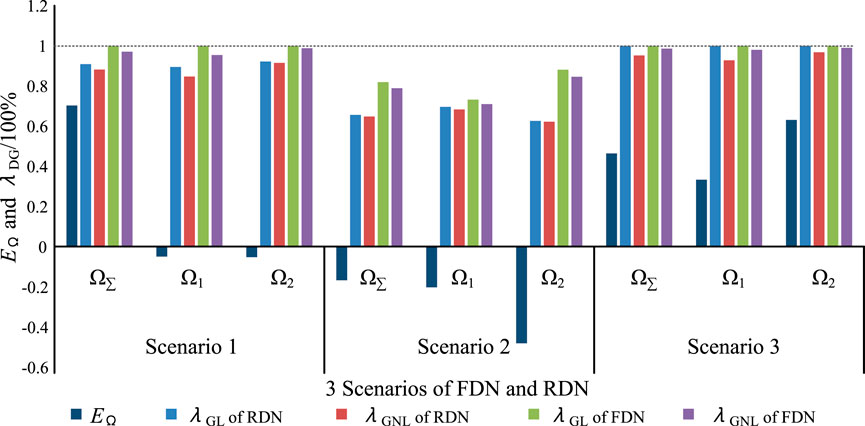
FIGURE 10. MDs, GLARs, and GNLARs of all 3 scenarios for both the FDN and RDN.
According to the conclusion of Scenarios 1–3 and Figure 10, it can be seen that
(1) the DG-load accommodation ratio of a distribution network is determined by the matching degree of each local network. Particularly, since the FDN is overall connective, the DG-load accommodation ratio of the FDN is only determined by the overall matching degree.
(2) Only when at least one local network of a distribution network is DG-load unmatched can the DG-load accommodation ratio of the FDN be larger than that of the rigid distribution network. The increase extent of the DG-load accommodation ratio is determined by the matching degrees of the whole network and local networks together. Particularly, if the load and DG of every local network are matched, that is, the DG-load accommodation ratio of every local network reaches its maximum value 100%, it is evident that the DG-load accommodation ratio cannot be further improved by any measures, including the FDN upgrading. In this case, the rigid distribution network is capable of accommodating the DGs due to the perfect DG-load coordinated planning, although it is unusual in a real rigid distribution network.
(3) the increase extents of the hourly DG-load accommodation ratio and hourly DG-network-load accommodation ratio by the FDN fluctuate during one day. It can be seen that the improvements of the hourly DG-load accommodation ratio and hourly DG-network-load accommodation ratio are more obvious in midday and night because the output power of PVs and WTs is sequentially complementary and PVs and WTs are just located in different local networks in the cases.
(4) the DG-network-load accommodation ratio is always lower than the DG-load accommodation ratio in a real FDN. This is because the network operational constraints, such as thermal capacity constraints, limit the DG accommodation. According to the analysis of all three scenarios, we find that it is the branches adjacent to the DG bus that mainly limit the DG accommodation.
Measures to Improve the DG-Network-Load Accommodation Ratio of the FDN
To remove the bottlenecks of DG accommodation in the FDN, the following measures are proposed:
(5) If the locating of DGs is under discussion, it is recommended that the DGs should be integrated to the areas with enough load to ensure the output power of DGs can be accepted instead of exporting.
(6) If the locating of DGs is finished or measure 1 is not enough to remove the bottlenecks of DG accommodation, it is recommended that the capacity of branches adjacent to the DG bus should be properly enlarged according to the maximum output power of DGs. Besides, the capacity of SOP terminals should not be smaller than that of adjacent feeders.
For the cases in this work, the specific measures are as follows:
Measure 1: change the location of DGs, enlarge the capacity of feeders, and increase the capacity of the SOP terminal to 10.5 MVA, as is shown in Table 5.
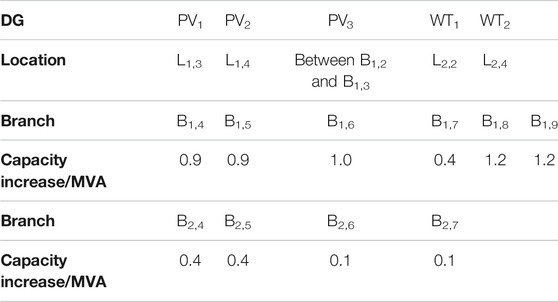
TABLE 5. DG location and feeder capacity improvement measures.
Measure 2: based on measure 1, adjust the incremental capacity. The capacity of branch B1,5 is increase by 0.9 MVA, B1,7 0.4 MVA, B1,8 4.8 MVA, B2,4 0.7 MVA, and B2,7 8.8 MVA. The capacity of the rest of the branches is increased as shown in Table 5. The details are shown in Supplementary Table S3.
The cases with overall higher capacity of DGs are also studied to verify the conclusion mentioned above, as is shown in Supplementary Material 4.
Conclusions
The FDN is a looped-operational distribution network using advanced power electronics technology, such as the SOP. This article studies the intermittent DGs accommodation in the FDN and makes comparison with the rigid distribution network. The main contributions are as follows:
(1) The matching degree is proposed to describe the relation of the load and location and size of the DG.
(2) The proposed index, accommodation ratio, is further divided into the DG-network-load accommodation ratio and DG-load accommodation ratio, to distinguish whether the index takes the network operational constraints into account.
(3) The calculation of the DG-load accommodation ratio is proposed based on the matching degree; the calculation of the DG-network-load accommodation ratio is proposed based on the simulation model of sequential production.
(4) The accommodation ratio of the FDN and rigid distribution network is studied on cases with different matching degrees, and it is concluded that:
(a) the DG-load accommodation ratio is determined by the matching degree only. The DG-load accommodation ratio of the FDN is determined by the overall matching degree of the whole network. The DG-load accommodation ratio of the rigid distribution network is determined by the overall matching degree of the whole network, as well as the matching degrees of local networks.
(b) when at least one local network of a distribution network is DG-load unmatched, the DG-load accommodation ratio of the FDN will be larger than that of the rigid distribution network because the SOP can redistribute the power flow among different local networks.
(C) the DG-network-load accommodation ratio is determined by the matching degree and network operational constraints. The DG-network-load accommodation ratio will tend to the DG-load accommodation ratio if proper planning or optimization measures are taken, such as regulating voltage and expanding feeder capacity.
(d) the branches adjacent to the DG bus mainly limit the DG accommodation in the FDN. It is recommended to relocate the DGs and enlarge the capacity of feeders.
Compared with traditional distribution network analysis, the proposed DG accommodation analysis method can reflect the essence of DG accommodation capability clearly, which is determined by the location and power balance of the DG and load, as well as network operational constraints. Under the guidance of DG-network-load coordination and planning, the advantages of the FDN can be maximized. Future research will consider the reverse power flow in the 35 kV and 110 kV network and the influences of voltage constraints and energy storage.
Data Availability Statement
The original contributions presented in the study are included in the article/Supplementary Material; further inquiries can be directed to the corresponding author.
Author Contributions
JX was responsible for conceptualization, methodology, investigation, formal analysis, validation, resources, reviewing and editing the manuscript, supervision, project administration, and funding acquisition. YW was responsible for conceptualization, methodology, investigation, software, validation, data curation, formal analysis, writing the original draft, visualization, and project administration. GZ was involved in investigation, validation, formal analysis, and writing the original draft, review, and editing.
Funding
This work was supported by the National Key Research and Development Program of China (2016YFB0900100), National Natural Science Foundation of China (51877144), and China Post-doctoral Science Foundation (2020M670668).
Conflict of Interest
The authors declare that the research was conducted in the absence of any commercial or financial relationships that could be construed as a potential conflict of interest.
Supplementary Material
The Supplementary Material for this article can be found online at: https://www.frontiersin.org/articles/10.3389/fenrg.2021.634770/full#supplementary-material.
Nomenclature
Variables
T period of observation (unit is hour)
Indices and sets
Ωi local network i
Ω∑ whole network
Bi,j branch j of feeder Fi
Fi feeder i
SOPm SOP m
B set of all the branches
G set of all the DG nodes
L set of all the load nodes
S set of all the SOPs
Parameters
References
Anderson, K., Coddington, M., Burman, K., Hayter, S., Kroposki, B., and Watson, A. (2009). Interconnecting PV on New York City’s Secondary Network Distribution System. National Renewable Energy Laboratory, Golden, Colorado, USA.
Barragan, M., Mauricio, J. M., Marano, A., Nieves, M., Churio, J., Maza-Ortega, J. M., et al. (2012). “Operational benefits of multiterminal DC-links in active distribution networks,” in Power and energy society general meeting, San Diego, CA, USA, July 22–26, 2012 (IEEE), 6.
Cao, W., Wu, J., Jenkins, N., Wang, C., and Green, T. (2016). Benefits analysis of Soft Open Points for electrical distribution network operation. Appl. Energy 165, 36–47. doi:10.1016/j.apenergy.2015.12.022
Escalera, A., Prodanovic, M., Castronuovo, E. D., and Roldan-Perez, J. (2020). Contribution of active management technologies to the reliability of power distribution networks. Appl. Energy 267, 114919. doi:10.1016/j.apenergy.2020.114919
Fernandez, G., Galan, N., Marquina, D., Martinez, D., Sanchez, A., Lopez, P., et al. (2020). Photovoltaic generation impact analysis in low voltage distribution grids. Energies 13 (17), 4347. doi:10.3390/en13174347
Flottemesch, J., and Rother, M. (2004). “Optimized energy exchange in primary distribution networks with DC links,” in Proceedings of the 2004 IEEE International conference on electric utility deregulation, restructuring and power technologies, Hong Kong, China, April 5–8, 2004 (IEEE), Vol. 1–2, 108–116.
Guo, X. M., Huo, Q. H., Wei, T. Z., and Yin, J. Y. (2020). A local control strategy for distributed energy fluctuation suppression based on soft open point. Energies 13 (6), 1520. doi:10.3390/en13061520
Huang, A. Q., Crow, M. L., Heydt, G. T., Zheng, J. P., and Dale, S. J. (2011). The future renewable electric energy delivery and management (FREEDM) system: the energy internet. Proc. IEEE 99 (1), 133–148. doi:10.1109/jproc.2010.2081330
Liu, P., and Chu, P. (2018). Wind power and photovoltaic power: how to improve the accommodation capability of renewable electricity generation in China?. Int. J. Energy Res. 42 (7), 2320–2343. doi:10.1002/er.4013
Moghaddam, I. N., Chowdhury, B. H., and Mohajeryami, S. (2018). Predictive operation and optimal sizing of battery energy storage with high wind energy penetration. IEEE Trans. Ind. Electron. 65 (8), 6686–6695. doi:10.1109/tie.2017.2774732
Purchala, K., Meeus, L., Van Dommelen, D., and Belmans, R. (2005). “Usefulness of DC power flow for active power flow analysis,” in IEEE power engineering society general meeting, San Francisco, CA, USA, June 16, 2005, Vol. 1–3, 454–459.
Rueda-Medina, A. C., and Padilha-Feltrin, A. (2013). Distributed generators as providers of reactive power support-A market approach. IEEE Trans. Power Syst. 28 (1), 490–502. doi:10.1109/tpwrs.2012.2202926
Shafik, M. B., Chen, H., Rashed, G. I., El-Sehiemy, R. A., Elkadeem, M. R., and Wang, S. (2019). “Adequate topology for efficient energy resources utilization of active distribution networks equipped with soft open points,” in IEEE Access, Vol. 7, 99003–99016.
Shi, Q., Hu, H., Xu, W., and Yong, J. (2016). Low-order harmonic characteristics of photovoltaic inverters. Int. Trans. Electr. Energ. Syst. 26 (2), 347–364. doi:10.1002/etep.2085
Shu, Y., Zhang, Z., Guo, J., and Zhang, Z. (2017). Study on key factors and solution of renewable energy accommodation. Proc. Chin. Soc. Electr. Eng. 37 (1), 1–8. doi:10.13334/j.0258-8013.pcsee.162555
SP Energy Networks (2016). Electricity NIC submission: SP energy networks – ANGLE-DC. Available at: https://www.ofgem.gov.uk/publications-and-updates/electricity-nic-submission-sp-energy-networks-angle-dc (Accessed November 30, 2015).
Stram, B. N. (2016). Key challenges to expanding renewable energy. Energy Policy 96, 728–734. doi:10.1016/j.enpol.2016.05.034
Wang, B., Xiao, J., Zhou, J., Zhou, H., Liu, Y., and Zu, G. (2017). Dispatchable region of distributed generators and microgrids in distribution systems. Power Syst. Technol. 41, 365–372. doi:10.13335/j.1000-3673.pst.2016.2430
Western Power Distribution (2016). Low carbon networks fund submission from Western Power Distribution–Network Equilibrium. Available at: https://www.ofgem.gov.uk/publications-and-updates/ (Accessed November 24, 2014).
Xiao, J., Gang, F., Deng, W., Huang, R., He, Y., and Yi, L. (2017a). Security region model for flexible distribution network. Appl. Energy 41 (12), 3764–3771. doi:10.1016/j.apenergy.2019.114425
Xiao, J., Gang, F., Huang, R., Shu, B., Yang, N., and Yu, X. (2017b). Total supply capability model for flexible distribution network. Autom. Electr. Power Syst. 41 (5), 30–38. doi:10.7500/AEPS20160713007
Xiao, J., Li, F., Gu, W. Z., Wang, C. S., and Zhang, P. (2011). Total supply capability and its extended indices for distribution systems: definition, model calculation and applications. IET Gener. Transm. Distrib. 5 (8), 869–876. doi:10.1049/iet-gtd.2010.0769
Xiao, J., Wang, Y., Luo, F., Bai, L., Gang, F., Huang, R., et al. (2018a). Flexible distribution network: definition, configuration, operation, and pilot project. IET Gener. Transm. Distrib. 12 (20), 4492–4498. doi:10.1049/iet-gtd.2018.5641
Xiao, J., Zhang, T., Zu, G. Q., Li, F. X., and Wang, C. S. (2018b). TSC-based method to enhance asset utilization of interconnected distribution systems. IEEE Trans. Smart Grid 9 (3), 1718–1727. doi:10.1109/TSG.2016.2598816
Xiao, J., Zu, G., Wang, Y., Zhang, X., and Jiang, X. (2020). Model and observation of dispatchable region for flexible distribution network. Appl. Energy 261, 114425. doi:10.1016/j.apenergy.2019.114425
Ye, L., Zhang, C., Xue, H., Li, J., Lu, P., and Zhao, Y. (2019). Study of assessment on capability of wind power accommodation in regional power grids. Renew. Energy 133, 647–662. doi:10.1016/j.renene.2018.10.042
Keywords: accommodation ratio, distributed generation, flexible distribution network, matching degree, DG-load accommodation ratio, DG-network-load accommodation ratio
Citation: Xiao J, Wang Y and Zu G (2021) Analysis of Distributed Generation Accommodation in Flexible Distribution Networks. Front. Energy Res. 9:634770. doi: 10.3389/fenrg.2021.634770
Received: 28 November 2020; Accepted: 25 January 2021;
Published: 20 April 2021.
Edited by:
Yang Mi, Shanghai University of Electric Power, ChinaReviewed by:
Yonghui Sun, Hohai University, ChinaTao Jiang, Northeast Electric Power University, China
Zhenkun Li, Shanghai University of Electric Power, China
Copyright © 2021 Xiao, Wang and Zu. This is an open-access article distributed under the terms of the Creative Commons Attribution License (CC BY). The use, distribution or reproduction in other forums is permitted, provided the original author(s) and the copyright owner(s) are credited and that the original publication in this journal is cited, in accordance with accepted academic practice. No use, distribution or reproduction is permitted which does not comply with these terms.
*Correspondence: Guoqiang Zu, enVndW9xaWFuZ190anVAMTYzLmNvbQ==