 Wei Liu1
 Yu Hong
- 1Business School, East China University of Political Science and Law, Shanghai, China
- 2Economic School, Anhui University, Anhui, China
The problem of unbalanced energy development in China still exists. How to adjust the energy structure is the key to high-quality economic development in China. This paper analyses the impact of regional energy development levels on high-quality economic development in China from 2016 to 2017, with the global ML methodology and structural equation model. Firstly, from two aspects of environmental and technological factors, the Global Malmquist-Luenberger (GML) production function is used to measure the environmental endowment index of regional energy development in China. Secondly, the evaluation system of China’s energy development is established. The structural equation model is used to measure and evaluate the degree of China’s regional energy development. Combined with the environmental endowment index of regional energy development, the gap between the proportion of regional renewable energy and the optimal energy structure is analyzed. Thirdly, this paper explores the supporting effect of different energy development levels on high-quality economic development. It is concluded that the environmental endowment index of energy development varies among different regions in China, most of which are still underdeveloped, but a few of which have redundant technical elements of renewable energy development. China’s regional energy development model is still dominated by fossil fuel energy, and the proportion of renewable energy driving economic growth is relatively low. Renewable energy can effectively replace the use of fossil fuel energy and have a higher impact on high-quality economic development. Finally, on the basis of the above study, the paper puts forward policy suggestions for Chinese governments to adjust energy structure and promote high-quality economic development.
Introduction
Energy is considered as the cornerstone of national security and the foundation of national economy. From a global perspective, new trends on the energy development mode have emerged, and the renewable energy has been developing rapidly: Many countries have successively issued energy reform measures led by renewable energy. Among various forms of renewable energies, photovoltaic power and wind power are the main forms of energy conversion, and hydropower is the second choice. The transformation of the global energy structure is inevitably called forth by the renewable energies. There are two reasons for the rapid development of the renewable energy in the global market. One is the bottleneck of crude oil supply, caused by the unstable oil production, the violent fluctuation of international oil price, and the challenged energy security. The other one is the global problems caused by the fossil energy consumption, such as the climate change issue, the health and safety issue, and the economic loss issue (Abbasi et al., 2020; Ahmed et al., 2020). China, as a major energy consumer, has attracted wide attention on its energy development mode from the other countries. During the 13th 5-Year Plan period, China has accomplished remarkable achievements on the development of the renewable energy. The power generation of renewable energy in 2019 is 1.7 times that of 2015. In terms of consumption and utilization, the target of 95% utilization was achieved 1 year ahead of schedule (Chen et al., 2019). Still, there are some problems on the renewable energy development, such as the difficulties on implementing plans, the increased subsidy fund gap and the power restriction in some local areas. The current energy system in China that relies heavily on fossil fuels contradicts the strategic requirements of sustainable development and accelerates the transformation of renewable energy (Dong et al., 2018). How to adjust the regional energy development mode, so as to improve the utilization of renewable energy and to promote economic growth steadily, is the key to China’s high-quality development in the new era.
In the existing papers on the impact of China’s regional energy development level on high-quality economic development, there are two main problems: Firstly, based on the static theory, the weight of renewable energy and non-renewable energy is the same, and the environmental compensation benefits of renewable energy are ignored (Hacıimamovglu and Sandalcılar, 2020). Secondly, for the more abstract problems such as measuring the level of development, the traditional weighting method is lack of objectivity, the classical hypothesis model does not have a high degree of identification of the direction of variables, and the measurement results are often difficult to be convinced (Jin and Li, 2017). In order to solve the above problems, firstly, from two aspects of environmental and technological factors, the Global Malmquist-Luenberger (GML) production function is used to measure the environmental endowment index of regional energy development in China. Secondly, the evaluation system of China’s energy development is established. The structural equation model is used to measure and evaluate the degree of China’s regional energy development. Combined with the environmental endowment index of regional energy development, the gap between the proportion of regional renewable energy and the optimal energy structure is analyzed. Then, this paper explores the supporting effect of different energy development levels on high-quality economic development. Finally, on the basis of the above study, the paper puts forward inspiring policy suggestions for the Chinese government. This study has important implications for China’s energy structure transformation, renewable energy utilization, and high-quality economic development in the new era.
Literature Review
Regarding the level of regional energy development and its impact on high-quality economic development, relevant scholars and departments at home and abroad have conducted some studies and achieved certain results.
At present, there are many researches using evaluation system to measure the level of regional energy development. For example, Li et al. (2011) comprehensively evaluated China’s renewable energy development level from four aspects–economy, technology, resources, and environment–by using an analytic hierarchy process. Byrne et al. (2007) used GIS technology to explore the prospect of renewable energy demand of rural residents in China from the aspects of resources, economy, technology, and residents’ life. Heo et al. (2010) used an analytic hierarchy process and fuzzy comprehensive evaluation to measure the popularization level of new energy in South Korea by selecting five indicators: technology, market, economy, environment, and policy. To a certain extent, the above research objectively reflects the energy development level of the region, but for measuring the development level, the traditional hypothesis model does not have a high degree of direction identification of variables, and the measurement results are often difficult to be convincing (Lu et al., 2019); at the same time, the scientificity and operability of the measurement index of regional energy development level and the weight determination method also need to be further improved (Wang and Chen, 2012). Therefore, the evaluation system of regional energy development level includes three aspects: renewable energy, non-renewable energy, and economic development (Wang, 2008); the structural equation model is selected as a quantitative analysis method, because it contains both explicit and latent variables, which can more comprehensively analyze the influence path and effect between variables. It is an important supplement to the traditional quantitative analysis method that cannot analyze the influence effect of potential factors in the evaluation system.
Renewable energy has strong technological dependence, high initial cost, dense industrial agglomeration, and high adaptability to regional environmental resources (Dranka et al., 2020; Khan et al., 2020). The regional economic growth might be inhibited if the regional energy structure is not properly allocated, the proportion of renewable energy structure is too large, and the fossil fuel energy utilization is inefficient (Ji and Zhang, 2019. For example, Ocal and Aslan (2013) thinks that, compared with the traditional fossil fuel energy system, the renewable energy development currently does not have either technological or cost advantages. Ocal’s paper also uses the autoregressive lag model for analysis and concludes that for every 1% increase in renewable energy development, the regional GDP decreases by 0.3%. Qi and Li (2018) believes that the energy transformation is economically costly and the technology advantage of renewable energy is not great enough to recover the cost of energy transformation. In China, the internal motivation of energy development is the subsidy policy, and excessive renewable energy subsidies limit economic growth. Dong et al. (2020) clams that if we want to maintain a high economic growth rate, it may inhibit the utilization rate of renewable energy. The above research demonstrates that the unreasonable energy structure inhibits the high-quality development of regional economy, which is mainly caused by the improper allocation of renewable energy. However, there are still two limitations in the current research on how to improve the regional energy structure: first, based on the static theory, the weights of renewable energy and non-renewable energy are consistent, ignoring the environmental compensation benefits of renewable energy (Wang et al., 2020); second, the optimal proportion of energy structure is deduced without considering the regional environmental resource endowment (Yan et al., 2018; Zhang, 2019). In order to solve the above problems, this paper puts forward the hypothesis: moderately increasing the proportion of renewable energy can promote the overall level of regional energy development and can be conducive to high-quality economic development. On this basis, two factors of technology and environment are selected to calculate the environmental endowment index of regional energy development, which is used as the weight to estimate the optimal energy structure of the region, and to explore the gap between the proportion of regional renewable energy and the optimal energy structure.
From the existing literature, due to the different understanding of the energy development path, the selected evaluation index, the measurement method, and the constructed evaluation system are different, so the research conclusions are often inconsistent. Meanwhile, the scientificity and operability of the measurement index of regional energy development level and the weight determination method also need to be further improved; some literatures only measure the structure proportion or economic benefit of renewable energy, which lacks systematic analysis on the impact path and effect of regional energy development. This paper uses the global ML production function to measure the environmental endowment index of China’s regional energy development. On this basis, the structural equation model is used to measure and evaluate the degree of regional energy development in China. Combining the regional energy development environmental endowment index, this paper analyses the gap between the proportion of regional renewable energy and the optimal energy structure and then explores the supporting role of different energy development levels on high-quality economic development, so as to provide reference for local governments to adjust the energy structure and improve relevant policies and measures.
Model Specification
Energy Development Environmental Endowment Index (GML)
Global Malmquist-Luenberger (GML) Production Function Based on SBM Model Framework
The traditional productivity index method primarily has four weaknesses: (1) There is no transitivity in the geometric form. (2) If the research objects are samples from different periods, there may be no solution to the linear solution in the calculation process. (3) In the process of factor decomposition, there might be too large or too small factors. (4) There are two kinds of problems: laxity and radiality. Radiality refers to the idea that the traditional radial DEA model framework may overestimate the efficiency of the research object when the input and output are scaled up or down in equal proportion (Kim et al., 2019). In order to solve these problems and reduce measurement errors, this paper firstly uses the global ML production function to measure the environmental endowment of regional energy development in China (Liu et al., 2019). Compared with the traditional production function, the technology set of global ML production function includes the observation samples of the whole period, which avoids the situation that linear programming has no feasible solution. At the same time, its non-circular geometric form also solves the transitive problem of the traditional production function. Secondly, the SBM model is selected as the framework. The advantage of the SBM model is that it is non-radial considering the influence of non-balance variables. It can reduce the impact of non-pure efficiency of energy development by finding the minimum ratio to reach the optimal efficiency frontier and can distinguish the scale effectiveness. Compared with other analysis models, the SBM model is better to evaluate the reasonableness of resource allocation. The above model calculation formulas are expressed as follows:
In Eq. 1, PG(x) = P1∪P2∪…∪Pt. T represents the reference yield set in cycle t. PG encloses all Pt by constructing a single PPS through panel data on the input and output of all relevant DMU. Therefore, PG is called the global technology set. In Eq. 2, DGxt,yt,bt) represents DGx,y,b;gy,gb), which is the DDF defined on the global technology set PG. If GMLt,t + 1 of the DMU is greater than 1, the production activities of this DMU will increase the expected output and reduce the undesired output. Similarly, if GMLt,t + 1 of the DMU is less than 1, the production activities of the DMU will reduce the required output. Equation 3 represents the factor decomposition part, and ECt,t + 1 is the efficiency change item, which is used to measure the technological change of the DMU in the t and t + 1 period; BPCt,t + 1 is the best practice gap by measuring the gap between the technological frontier in the same period and the global technological frontier and estimates whether the technological frontier in the same period is closer to the whole technological frontier.
Variable Selection
With reference to Zhang’s (2014) practice of building total factor productivity of new energy consumption, hydroelectric power generation (I1), wind power generation (I2), solar power generation (I3), and thermal power generation (I4) are selected as input indicators; electricity consumption (Q1) is regarded as expected output; and carbon dioxide (CO2), sulfur dioxide (SO2), and chemical oxygen demand (COD) emissions are regarded as non-expected output to build energy development environmental endowment index. According to the carbon emission accounting method of IPCC 2006 Guidelines for National Greenhouse Gas Inventory, the formula of carbon dioxide emission is as follows: , where i represents kerosene, oil, and natural gas; E represents the above energy consumption; NCV represents the low calorific value of the three energy sources; CEF represents the carbon emission coefficient; COF represents the carbon oxidation factor, among which, the factor coefficients of coal, oil, and natural gas are 0.99, 1.44, and 12, respectively; and 44/12 is the molecular weight ratio of carbon dioxide and carbon element.
Regional Energy Development Level
Overview of Structural Equation Model
The structural equation model uses generalized linear equation to represent the causal relationship between latent variables and explicit variables. The explicit variables can also be called measurable variables, which often represent the objective and essential factors of the analysis object. The latent variables are also called unmeasured variables. Because there are many existing indicators in real life that cannot be quantified, the introduction of the latent variables is necessary to specify the immeasurable index variables and to represent the potential factors of the analysis object. This consists with the objectivity of the economic and social research and improves the accuracy and comprehensiveness of the actual analysis. The advantage of the structural equation model is that the model introduces the concepts of latent variables and explicit variables, which can analyze the immeasurable variable model and study the endogeneity between variables and possible path dependence. It is perfect for the regional energy development mode study, which is a multifaceted and complex industrial economic problem (Hong, 2019).
Variable Selection
Based on the energy system constructed by China’s energy statistics department, on the premise that there is a clear causal relationship between renewable energy, non-renewable energy, and economic growth variables, a priori hypothesis is put forward according to the nature of various types of energy so as to establish a reasonable energy development model evaluation index system. Table 1 shows the results.
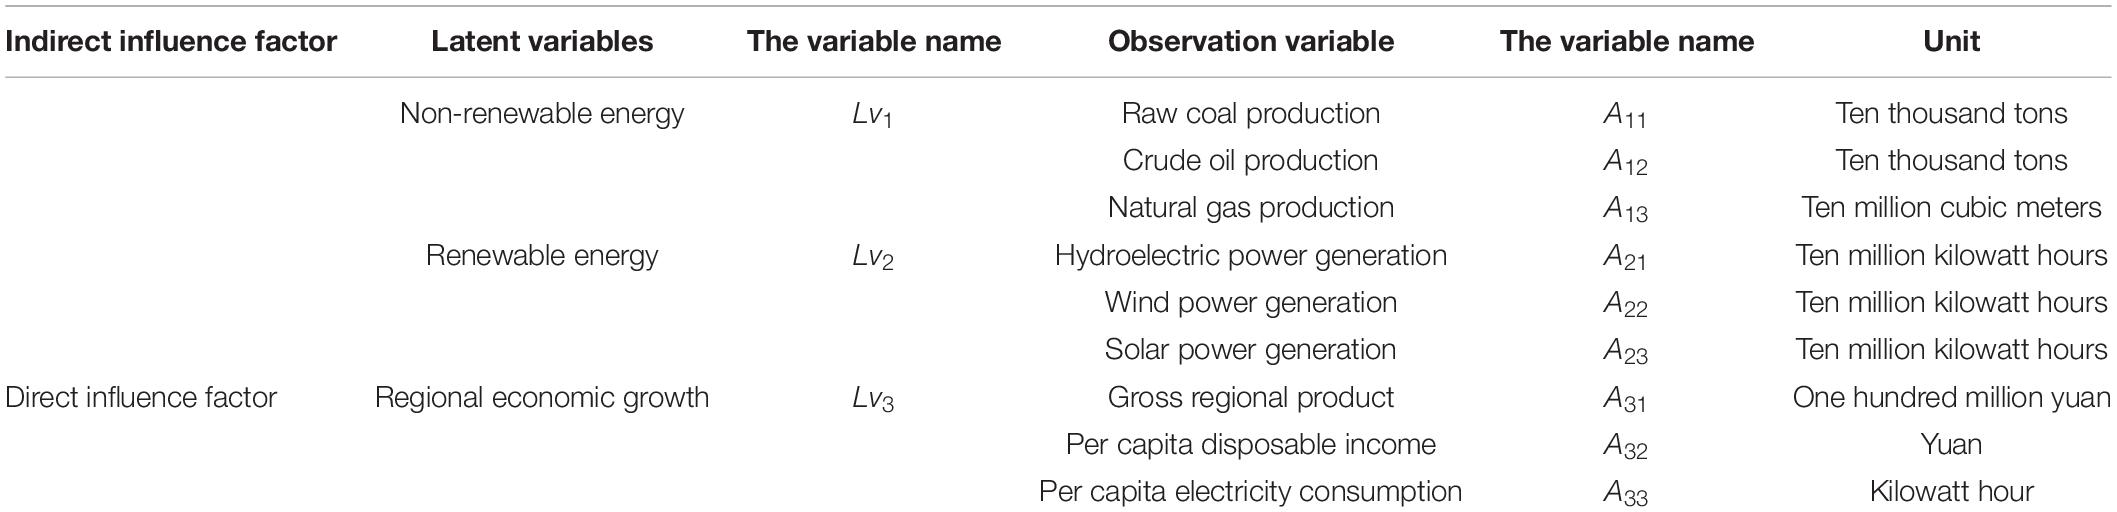
Table 1. Evaluation index system of China’s regional energy development level.
Model Assumption
Variables are selected and assumed conditions are set according to the structural equation model:
(1) “Non-renewable energy,” “renewable energy,” and “regional economic growth” are latent variables of the structural equation model. Among them, “non-renewable energy” and “renewable energy” are the endogenous latent variables of energy development level. They influence each other and jointly affect “regional economic growth.” Therefore, the latter is the exogenous latent variable of the structural equation model.
(2) The nine indicators, i.e., “raw coal production,” “crude oil production,” “natural gas production,” “hydroelectric generation,” “wind power generation,” “solar power generation,” “gross regional product,” “per capita disposable income,” and “per capita electricity consumption,” are the observed variables of the structural equation model. Among them, “gross regional product,” “per capita disposable income,” and “per capita electricity consumption” are exogenous explicit variables that directly determine the level of regional economic development, while the other six observed variables are endogenous explicit variables of the structural equation, which indirectly affect regional economic growth.
Based on the above assumptions and evaluation factors, the following models are established to analyze China’s energy development level:
Among them, Eq. 4 represents the measurement equation of the exogenous variables of the energy development level; x is the vector set consisting of the explicit variables of “gross regional product,” “per capita disposable income,” and “per capita electricity consumption”; ξ represents “regional economic growth” vector set; Λx represents the factor loading matrix of x on ξ; and δ is the error of the exogenous variable measurement equation. Similarly, Eq. 5 represents the measurement equation of endogenous variables. The letter y is the set of explicit variables composed of “raw coal production,” “crude oil production,” “natural gas production,” “hydroelectric power generation,” “wind power generation,” and “solar power generation”; η is the latent variable set composed of endogenous variables of “non-renewable energy” and “renewable energy”; Λx represents the factor loading matrix of y on η; and ε is the error of the endogenous variable measurement equation. The structural equation model assumes that there is a causal relationship between the endogenous latent variables and exogenous latent variables in the model. Therefore, Eq. 6 is a description of this relationship. According to the above conditions, η represents the endogenous latent variable, ξ represents the external latent variable, B represents the relationship matrix of the interaction between the endogenous latent variables η, Γ is the relationship matrix of the influence of the exogenous latent variable ξ on its endogenous latent variable η, and ζ represents the part that the equation cannot explain.
According to the needs of practical research, the evaluation results of the energy development model evaluation index system are different for different evaluation purposes. Therefore, the evaluation results of the energy development level in the empirical analysis vary according to the established index system. It is necessary to have different evaluation purposes and extract valuable information according to the actual needs. To this end, the energy development mode evaluation index system is divided into three groups according to different evaluation purposes, i.e., “the impact of non-renewable energy development on regional economic growth,” “the impact of renewable energy development on regional economic growth,” and “the impact of comprehensive energy development on regional economic growth.” These purposes match the corresponding indicator of explicit and latent variables. Table 2 shows the results.
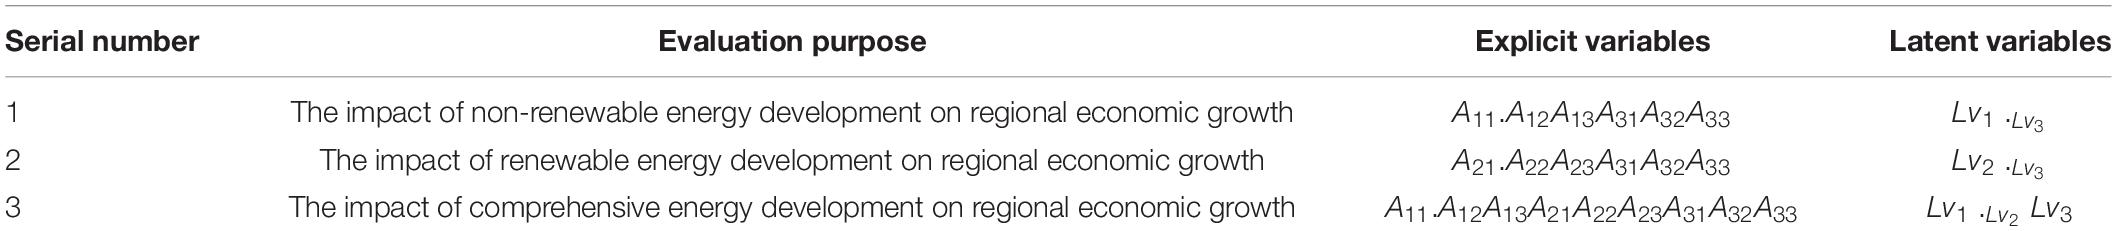
Table 2. Evaluation objectives of energy development level.
Empirical Analysis
Data Sources
Structural equation model is suitable for the analysis of cross-section data, so this paper takes the energy development of 31 provinces in China during 2016–2017 as the research sample. The data in this paper are from China Statistical Yearbook, China Energy Statistical Yearbook, China Industrial Statistical Yearbook, and annual report data of relevant provinces from 2017 to 2019. In order to eliminate the impact of price factors, all prices in this paper accounted for the constant price in 2011. Data processing was completed with the help of SPSS 20, Stata14.0 and DEAMAX.
Energy Development Environmental Endowment Index
The global ML production function is used to calculate and decompose the total factor productivity of energy, of which GML is the environmental endowment index of energy development. The results are shown in Table 3 (the global ML production function is estimated in a backward period, so the calculation results in 2016 are not shown).
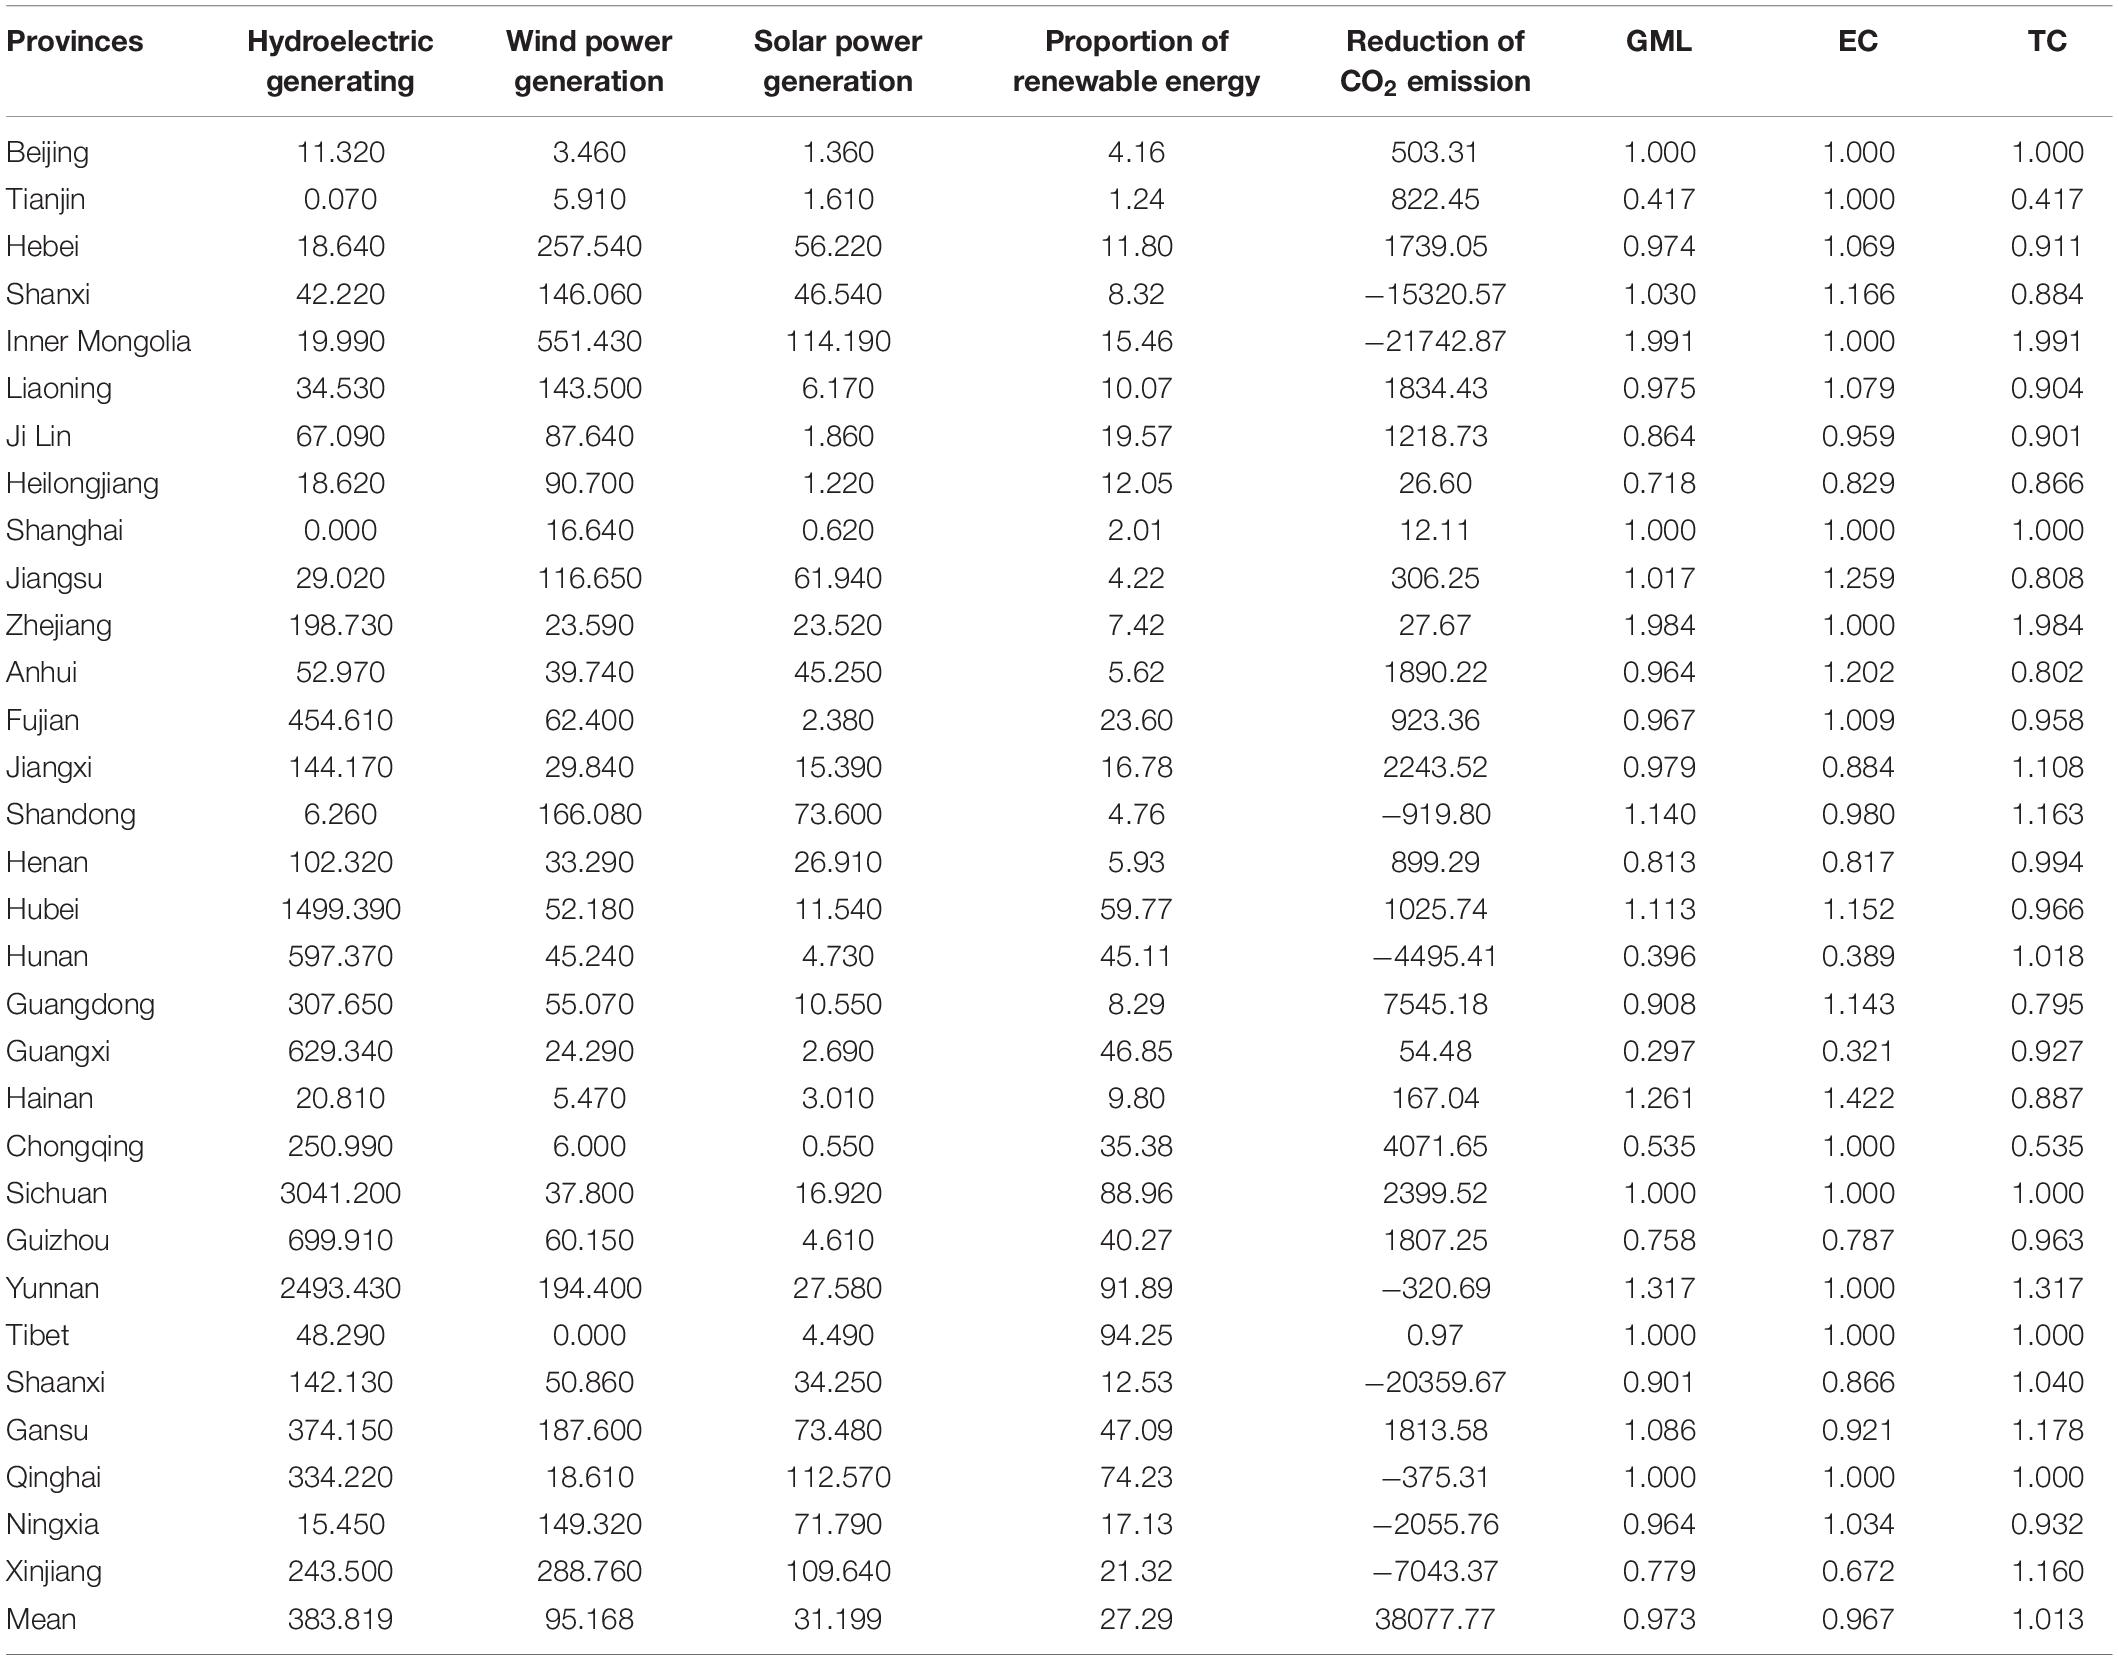
Table 3. China’s regional renewable energy structure and energy development environmental endowment index in 2017.
The following conclusions can be reached from Table 3:
(1) The environmental endowment index of energy development has two connotations: technology and environment. From the perspective of regional endowment indexes, the environmental endowment index of energy development in various regions in China is different, but the average index is below 1, indicating that the overall level of China’s regional energy endowment has become worse, and energy development technology and environmental problems are becoming increasingly serious. In terms of the environment, the average value of CO2 emissions decreased by 380.8 million tons, indicating that China’s energy production and pollution treatment capacity have improved. However, from the perspective of regional CO2 emissions, carbon emissions in Shanxi, Inner Mongolia, Shaanxi, and other provinces are still relatively large, the energy structure mainly using fossil fuels has not been improved, and regional energy development environmental problems are still serious. From the perspective of technology, China’s energy technology level fluctuates, but the average level of technological progress is below 1, and the scale efficiency of technology is above 1, indicating that the technological frontier has decreased compared with the previous year. The general trend is technological regression, but the energy utilization efficiency has improved. Among them, Beijing, Shanghai, Zhejiang, Sichuan, Yunnan, Tibet, and other provinces made relatively large progress, indicating that these provinces had attached importance to the development of energy science and technology innovation and taken technological progress as the major driving force of energy structure transformation. Regional energy production has become increasingly environmentally friendly, with low consumption and high efficiency. Different from previous regions, provinces such as Tianjin, Hebei, Shanxi, Jiangsu, and Anhui had relatively low technological progress in 2016–2017, with their level of technological progress below 1, manifesting as technological retrogression. Taking into account the distribution characteristics of regional environmental resources, most of the retrogressing provinces are located in Central China, having rich coal resources and using fossil fuel energy as the major energy production mode. They still lag on the energy structure transformation and the technology-driven transformation and the energy structure needs to be improved urgently.
(2) From the perspective of the main types of renewable energy in various regions of China, hydroelectric power generation is in the leading position, with an average power generation of 3.8382 billion kWh in 2017, mainly consumed by Hubei, Sichuan, Yunnan, and some other provinces. Solar power generation is at the end of renewal energy structure, with an average power generation of 312 million kWh in 2017, which is mainly consumed by Inner Mongolia, Qinghai, Xinjiang, and some other provinces. Wind power generation is at the middle position, with an average power generation of 951.7 million kWh in 2017 and Hebei, Inner Mongolia, Gansu, Xinjiang, and some other provinces as the major consumers. From the perspective of the proportion of renewable energy in various regions of China, the average proportion of China’s renewable energy power generation in 2017 reached 27.29%, and renewable energy consumption accounted for 11.7%, which is higher than the global average level of renewable energy development. Tibet is the province with the largest proportion of renewable energy, accounting for 94.25%. Hubei, Sichuan, Yunnan, and Qinghai also have comparatively large proportion of renewable energy, indicating that these provinces have obvious energy structure transformation and are able to rationally use regional resources. For example, there is the Three Gorges Dam water conservancy project in Hubei Province, the Xiluodu Hydropower Station in Yunnan Province, and the Longyangxia Hydro-Photovoltaic Complementary Photovoltaic Power Station in Qinghai Province. These provinces are mostly located in western China. The exploitation of fossil fuel energy in these regions is poor, yet the utilization rate of water power, wind power, and solar energy is relatively high.
Comprehensive Evaluation of Regional Energy Development Mode
The Impact of Non-renewable Energy Development on Regional Economic Growth
Based on the above indicator system and model assumptions, the authors standardize the original data and construct the structural equation model of the impact of non-renewable energy development on regional economic growth by using structural equation method and Amos 24 software. The results can be found in Figure 1.
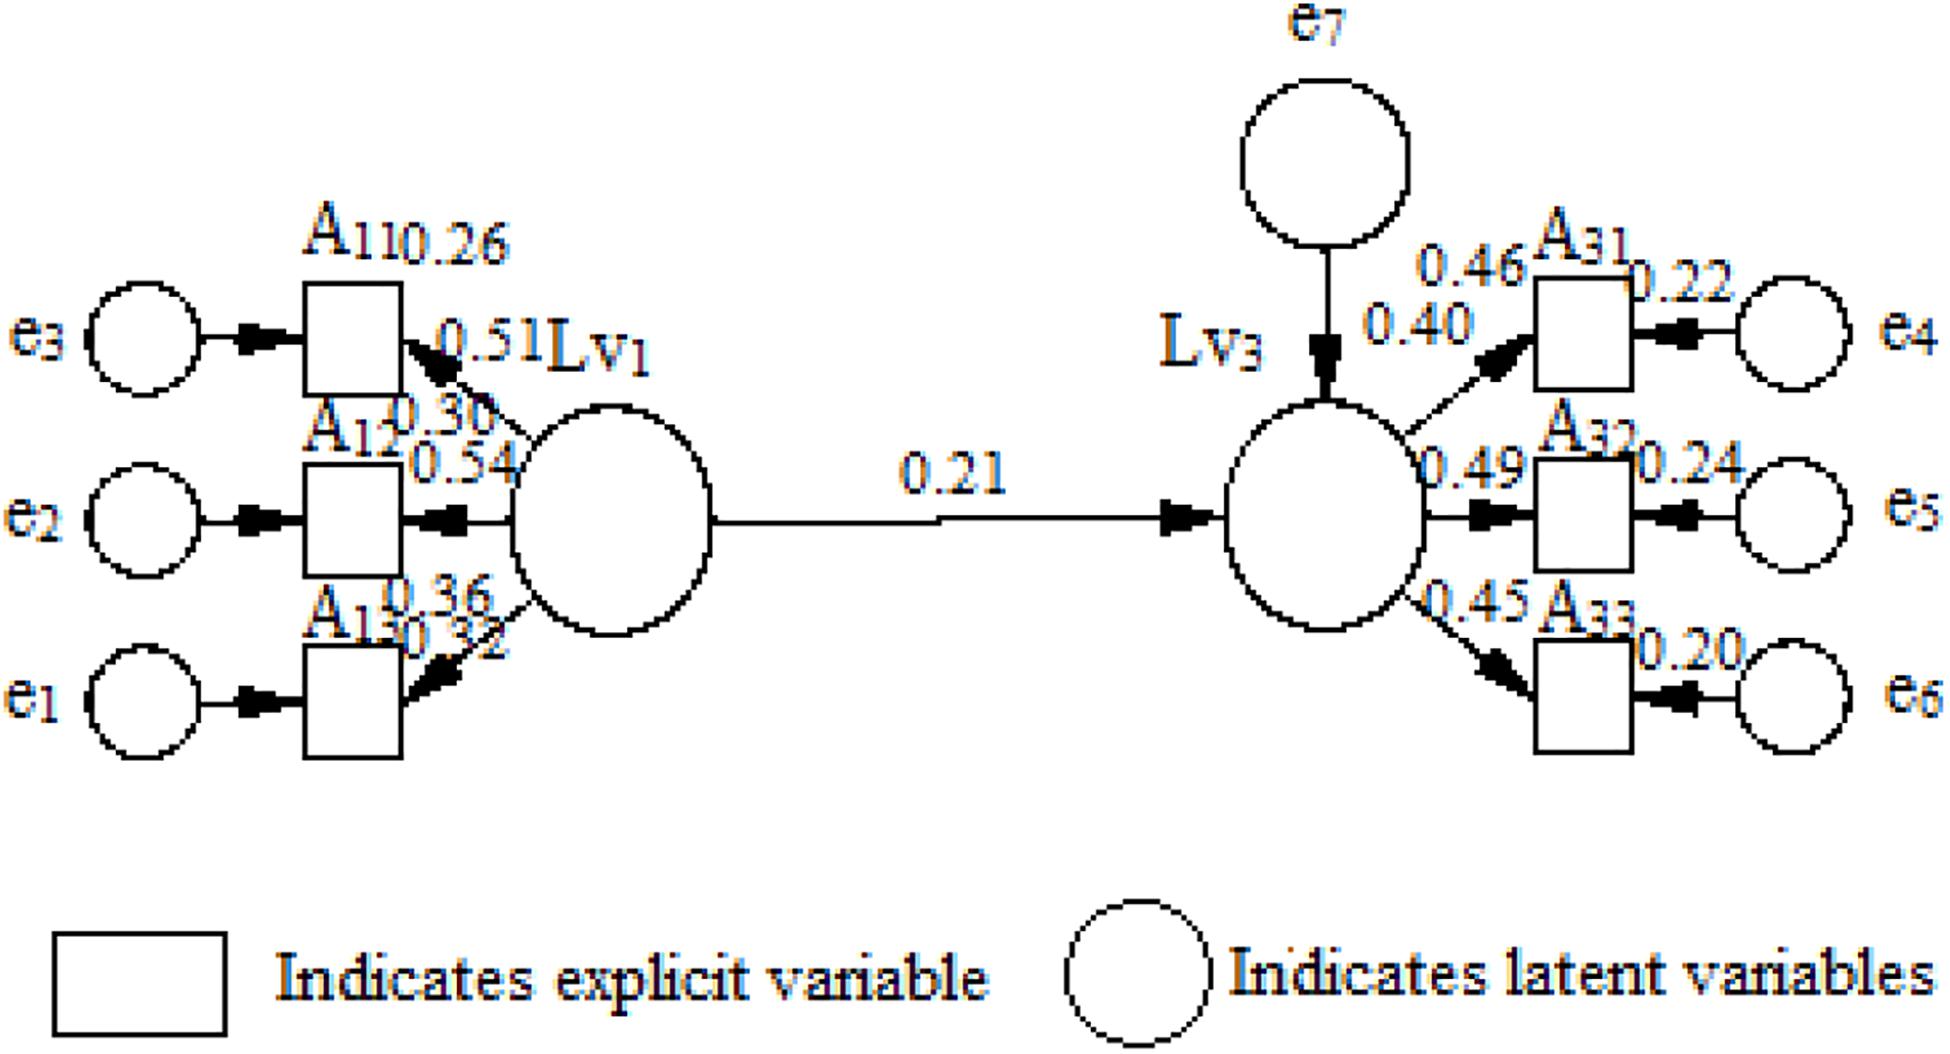
Figure 1. Structural equation model of the impact of non-renewable energy development on regional economic growth.
Figure 1 shows that the standardized path coefficient of non-renewable energy development affecting economic growth is 0.21, the impact is significant, and the direction is positive. This conforms to the assumption of structural equation model (1), which is to say that non-renewable energy development is one of the influencing factors of regional economic growth. The path coefficients of raw coal production, crude oil production, and natural gas production that affect the development of non-renewable energy are 0.51, 0.54, and 0.36, respectively, and the degree of impact is significant, which conforms to the assumption of the structural equation model (2). Table 4 shows the parameter estimation of the structural equation of the impact of non-renewable energy development on regional economic growth.
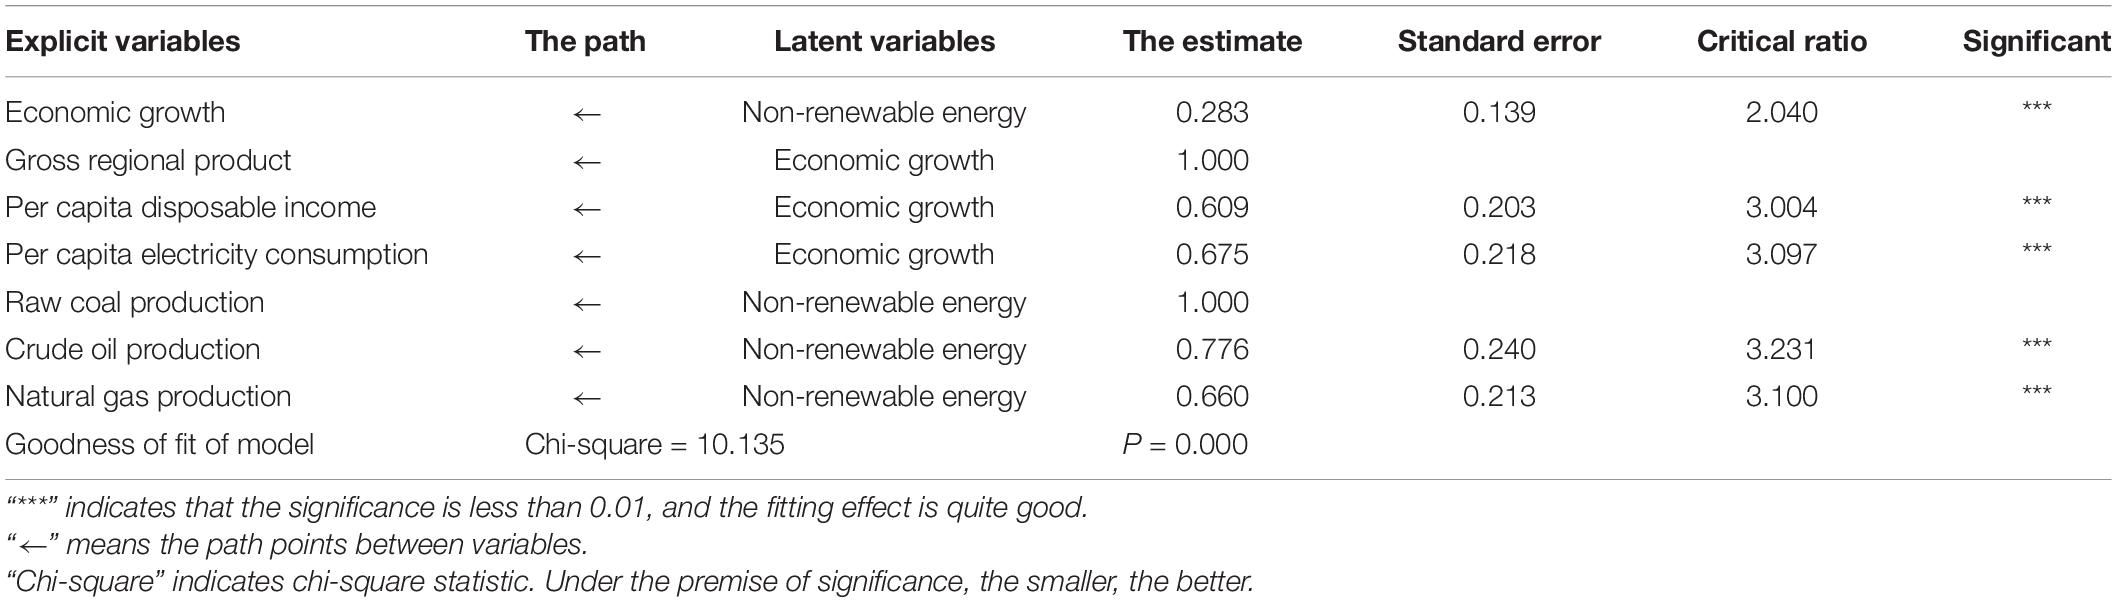
Table 4. Parameter estimation of the structural equation of the impact of non-renewable energy development on regional economic growth.
Table 4 shows that the model fits well, the variables and their correlations can be explained reasonably, and the settings of exogenous and endogenous variables are reasonable. The estimated value of the regression coefficient for non-renewable energy standardized development is 0.283, which indicates that the development and use of fossil fuel energy destroys the natural environment, but it is still a promoting factor of regional economic growth.
The Impact of Renewable Energy Development on Regional Economic Growth
Figure 2 is the structural equation model of the impact of renewable energy development on regional economic growth we construct.
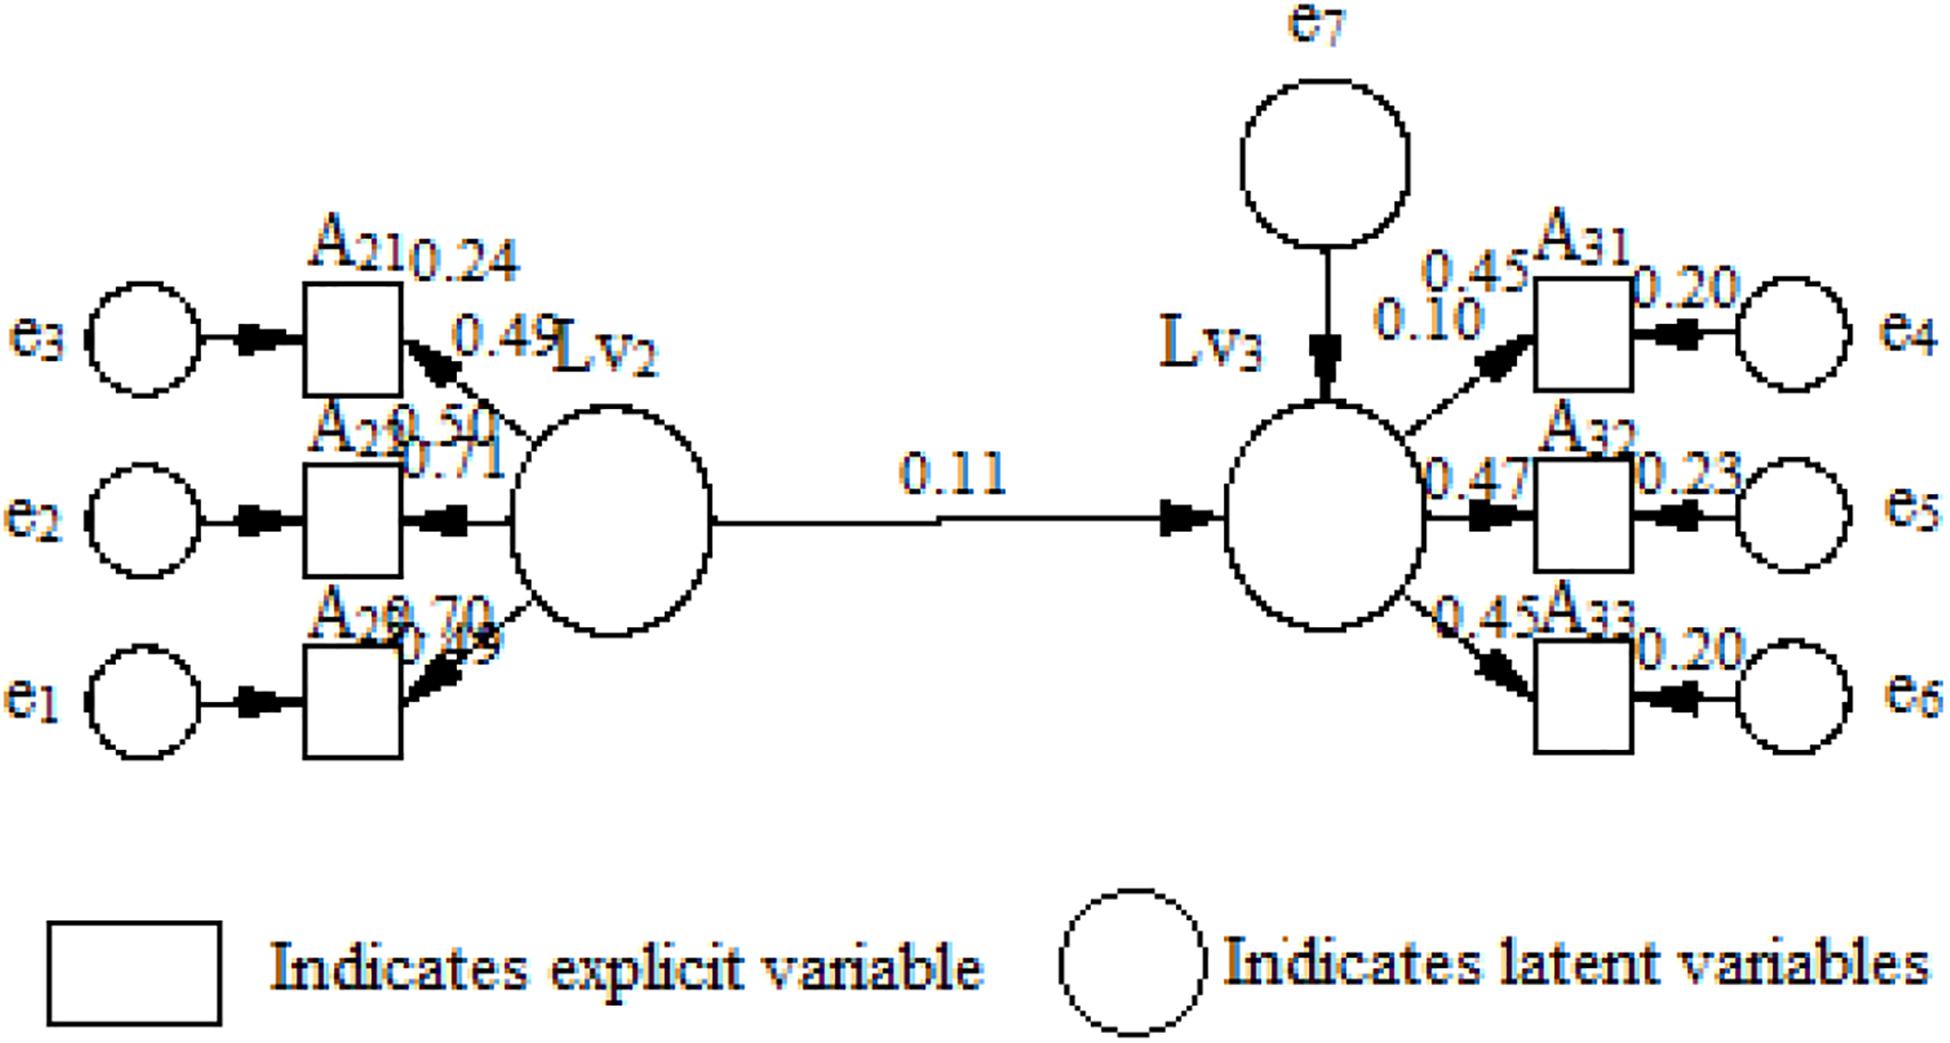
Figure 2. Structural equation model of the impact of renewable energy development on regional economic growth.
Figure 2 shows that the standardized path coefficient of renewable energy development affecting economic growth is 0.11, the impact is significant, and the direction is positive, which conforms to the assumption of structural equation model (1). It means that renewable energy development is one of the influencing factors of regional economic growth. The path coefficients of hydroelectric power generation, wind power generation, and solar power generation affecting the development of renewable energy are 0.49, 0.71, and 0.70, respectively, which are significant and conform to the assumption condition of structural equation model (2). Table 5 shows the parameter estimates of the structural equation of the impact of renewable energy development on regional economic growth.
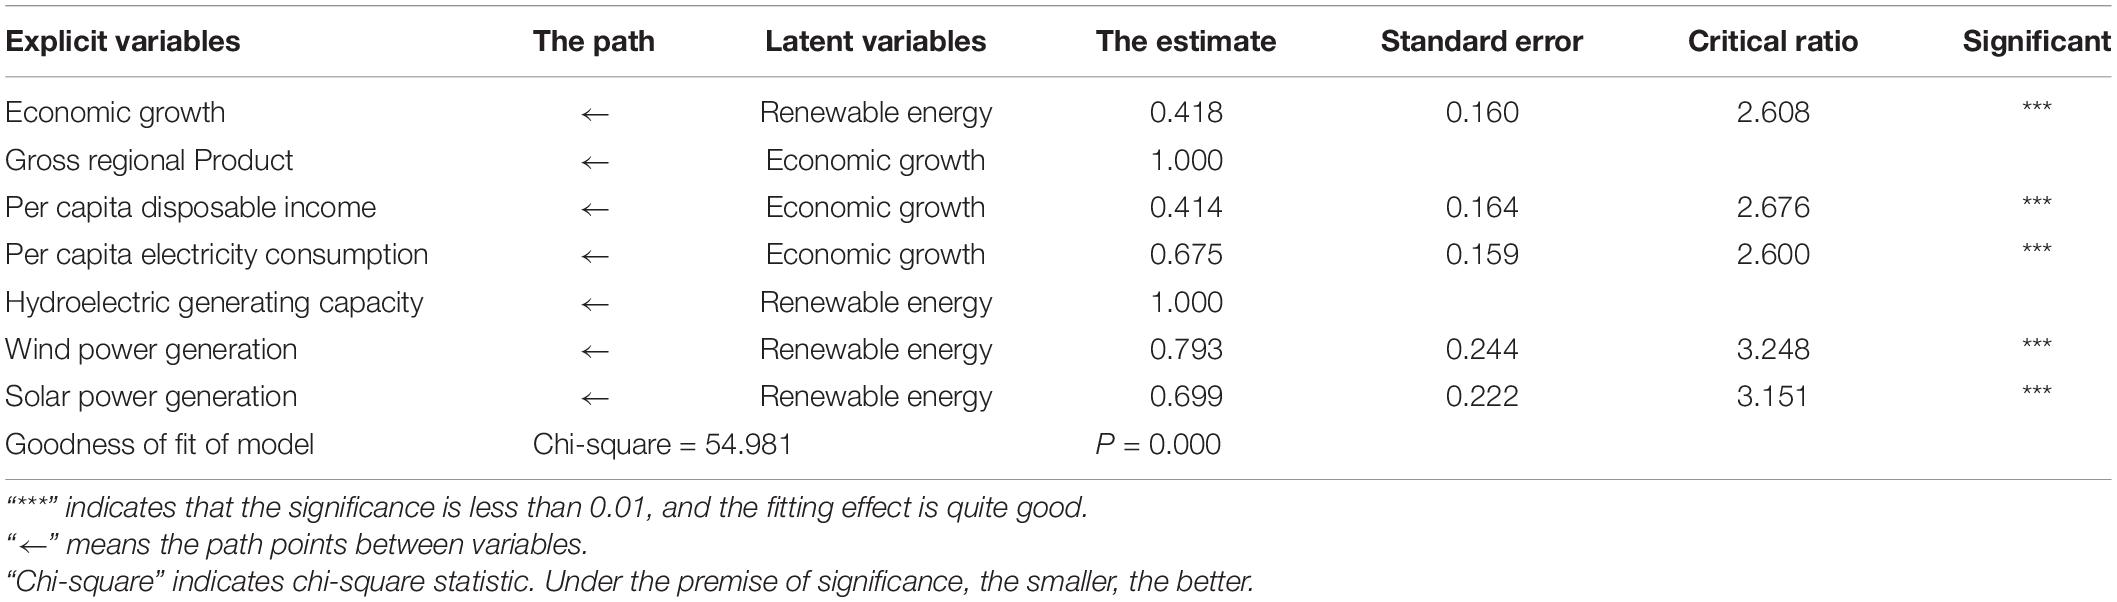
Table 5. Parameter estimation of structural equation of the impact of renewable energy development on regional economic growth.
Table 5 shows that the model fits well, all variables and their related relationships can be reasonably explained, and the settings of exogenous and endogenous variables are reasonable. The estimated value of standardized regression coefficient of renewable energy development is 0.418, which indicates that renewable energy can effectively replace fossil fuel energy and is a driving factor for regional economic growth.
The Impact of Comprehensive Energy Development on Regional Economic Growth
Figure 3 is the structural equation model of the impact of comprehensive energy development on regional economic growth.
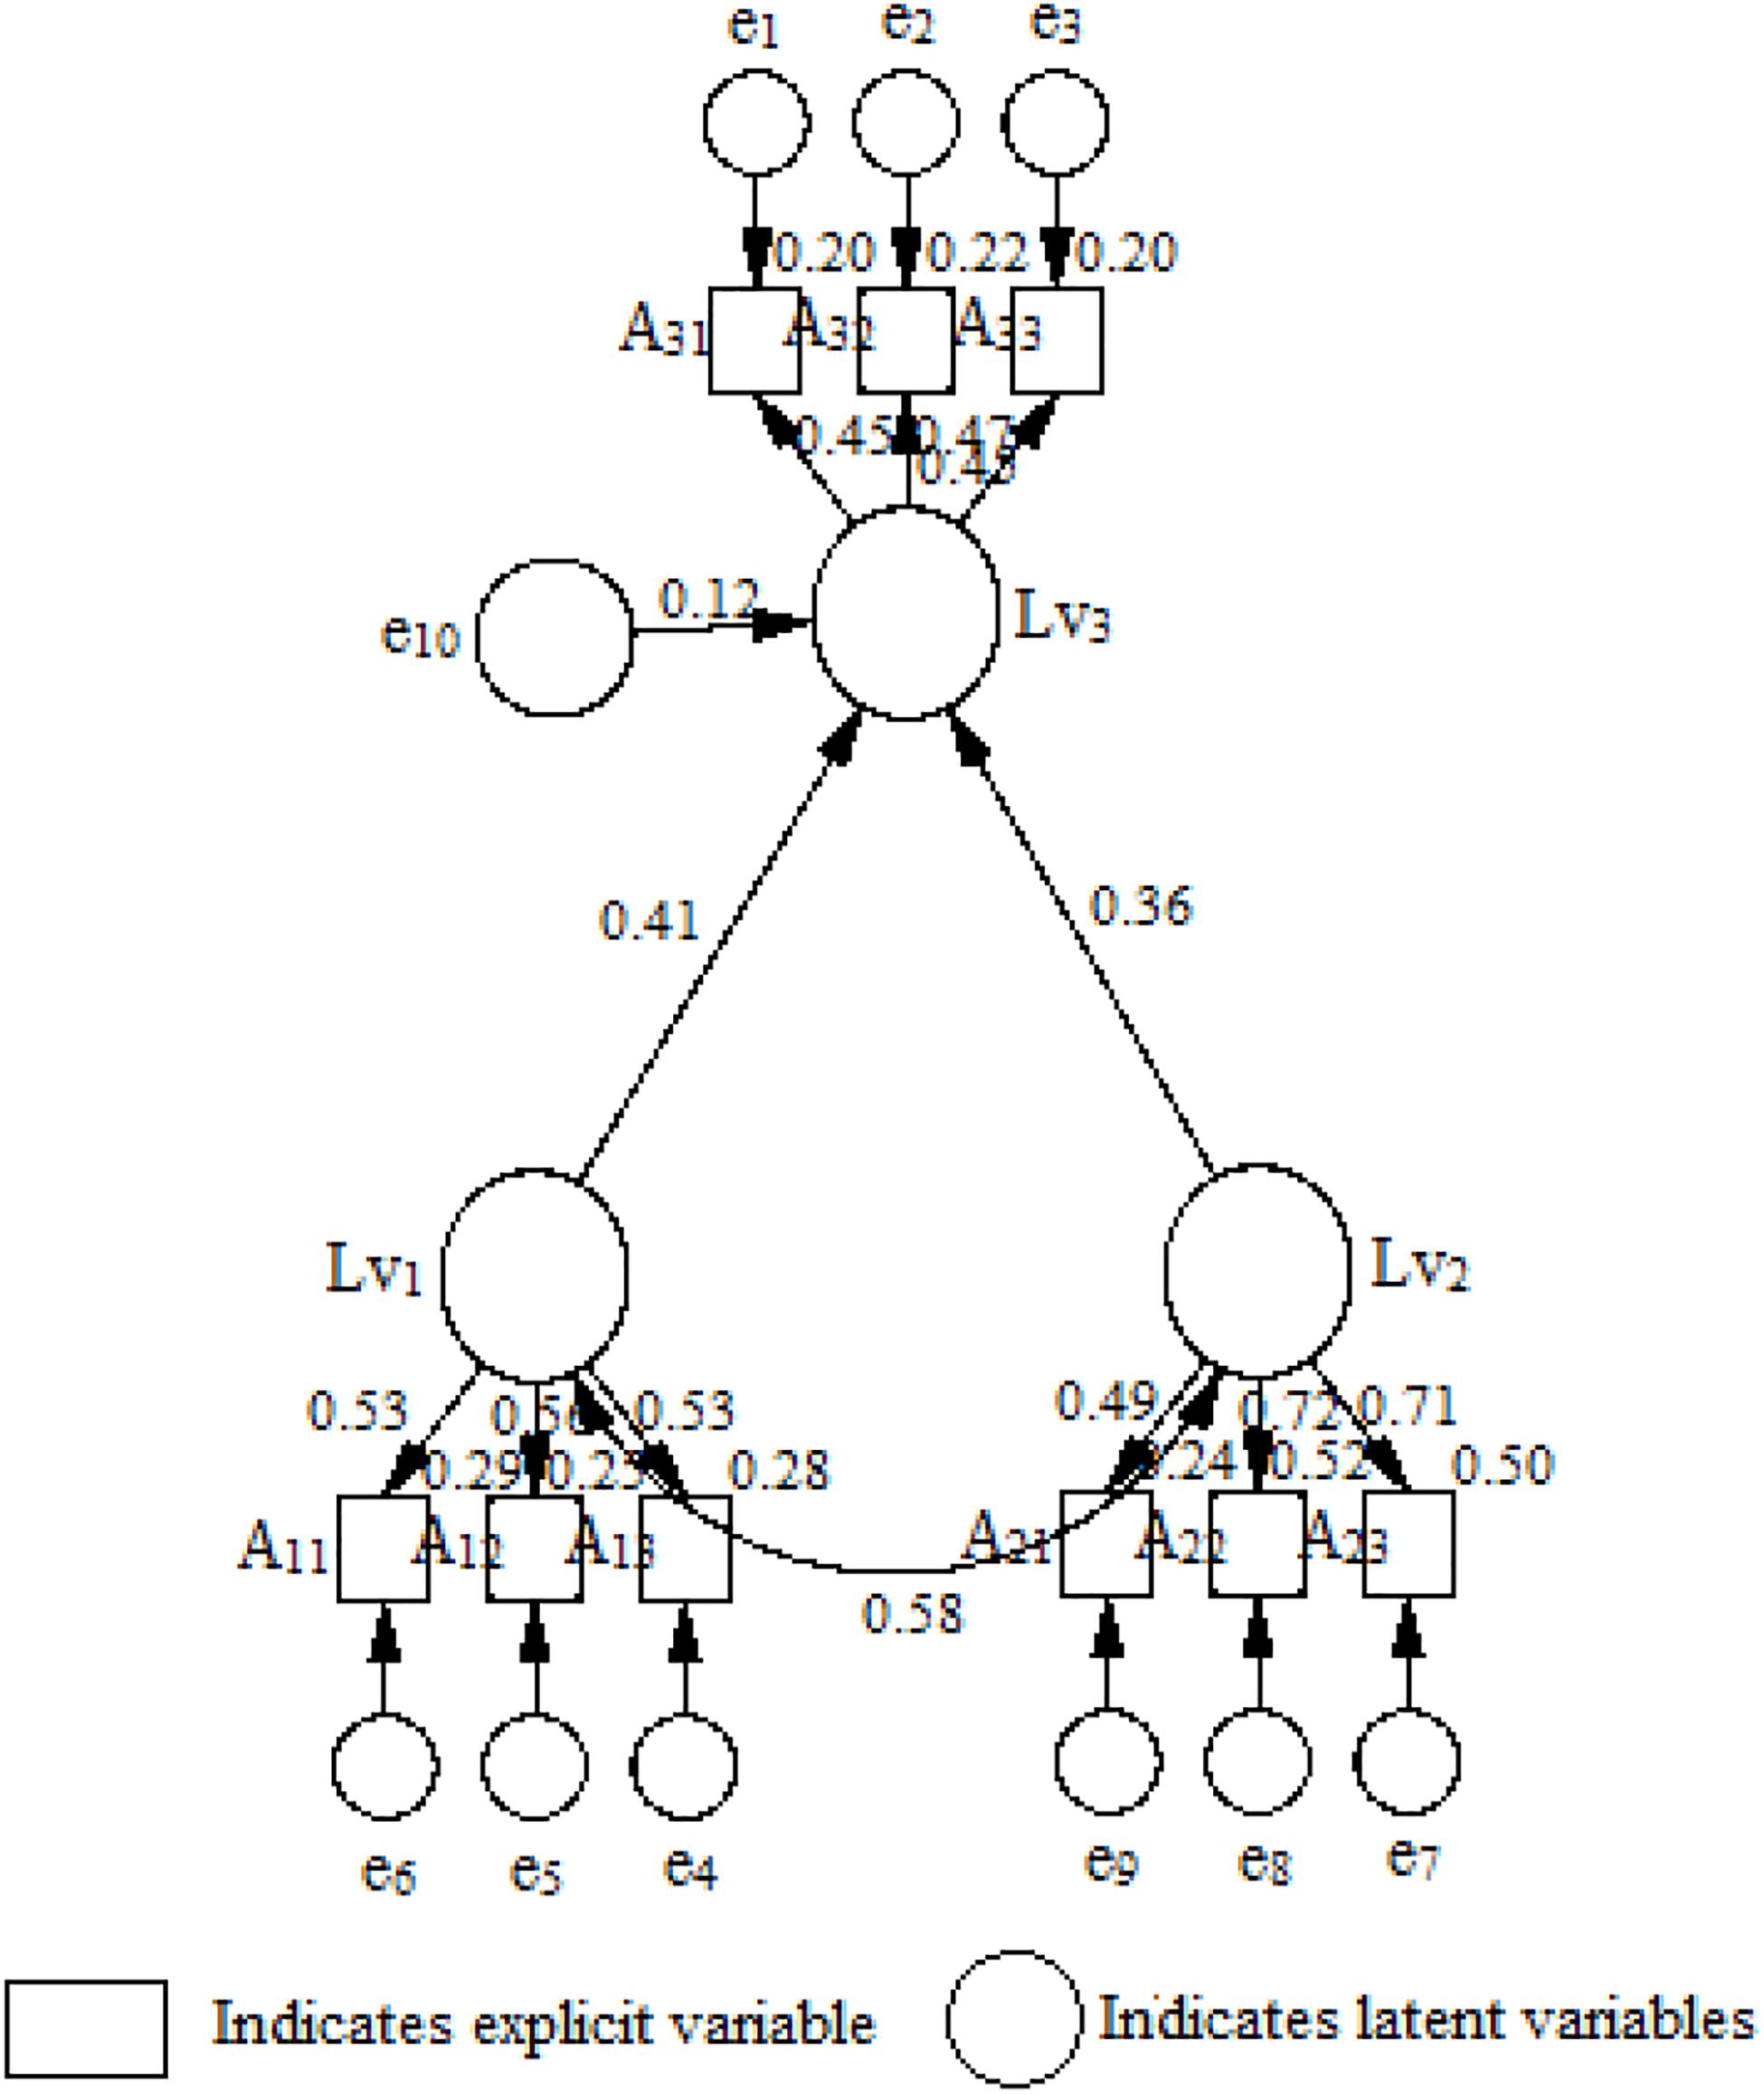
Figure 3. Structural equation model of the impact of comprehensive energy development on regional economic growth.
Figure 3 shows that the standardized path coefficient of non-renewable energy development affecting economic growth is 0.41, and the standardized path coefficient of renewable energy development affecting economic growth is 0.36. Both effects are significant and the direction is positive, which conforms to the assumption of structural equation model (1). This means that non-renewable energy and renewable energy development are both influencing factors of regional economic growth. The path coefficients of each explicit variable are relatively large, indicating that the influence of each component is significant, which conforms to the assumption condition of structural equation model (2). Table 6 shows the parameter estimates of the structural equation of the impact of comprehensive energy development on regional economic growth.
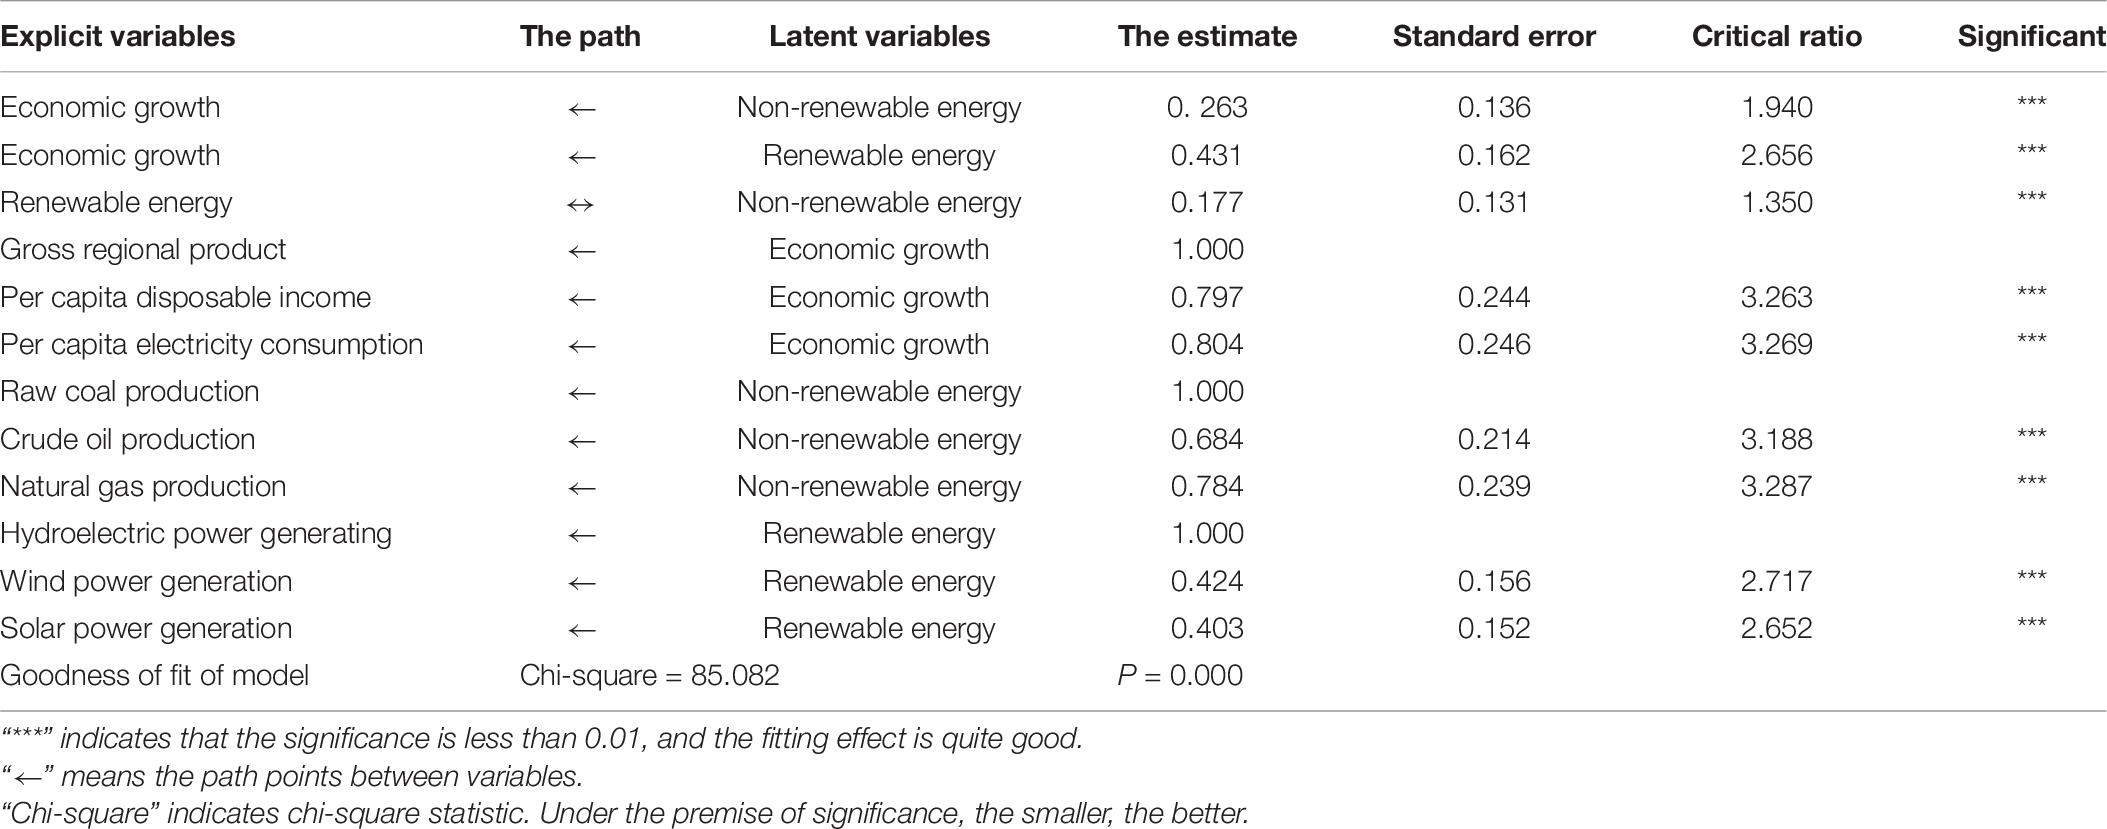
Table 6. The parameter estimates of the structural equation of the impact of comprehensive energy development on regional economic growth.
Table 6 shows that the model fits well, the variables and their correlations can be explained reasonably, and the settings of exogenous and endogenous variables are reasonable. The estimated value of the standardized regression coefficient for non-renewable energy development is 0.263, and the estimated value of the standardized regression coefficient for renewable energy development is 0.431, indicating that the development of renewable energy has a greater impact on economic growth. At the same time, the development of non-renewable energy and renewable energy influences each other, and the estimated value of the standardized regression coefficient is 0.177. This proves that renewable energy can effectively replace the fossil fuel energy. Although the initial cost of renewable energy development is relatively high, the research results show that the development of renewable energy is better for regional economic growth. From the perspective of long-term energy development, China should try to accelerate its regional energy structure transformation with renewable energy centered.
Comprehensive Score of Regional Energy Development Mode
According to the fitting results of the structural equation model, the mode of China’s regional energy development is modeled as follows:
The above equations are the regional energy development mode evaluation model corresponding to each group of evaluation purposes. fji(i = 1,2,3;j = 1,2,3) is the weight coefficient of each explicit variable, and wji(i = 1,2,3;j = 1,2,3) is the weight coefficient of each latent variable.
According to the fitting results of the structural equation model and the evaluation purpose of the energy development mode, we standardize the data. In order to have the evaluation standard of energy development level, nine components, i.e., “raw coal production,” “crude oil production,” “natural gas production,” “hydroelectric power generation,” “wind power generation,” “solar power generation,” “gross regional product,” “per capita disposable income,” and “per capita electricity consumption,” are adopted to represent high, medium, and low level of energy development:
High–Medium: (−0.3,−0.5,−0.4,−0.3,−0.3, −0.1, 0.0,−0.3, 0.0)
Medium–Low: (−0.5,−0.6,−0.4,−0.5,−0.7,−0.8, −0.7,−0.6,−0.8)
The score of 0.0 is the intermediate degree, the positive direction is the higher degree, and the negative direction is the lower degree.
According to the structural equation evaluation model and the normalized results of the weights of each group of variables, the scores of regional non-renewable energy development, renewable energy development, and comprehensive energy development on economic growth are calculated. The three scoring results are then averaged to obtain the final score results and the comprehensive ranking of China’s regional energy development level. According to the results of regional non-renewable energy impact score and renewable energy score, the proportion of regional renewable energy is calculated with the regional energy environment endowment index as the weight. Finally, according to the evaluation criteria of structural equation of energy development level and the weight coefficient of each group, the definition standard of higher energy development level to medium energy development level is 0.00, and the definition standard of medium energy development level to low energy development level is −0.10. The energy development level accordingly is further grouped, and the results are shown in Table 7.
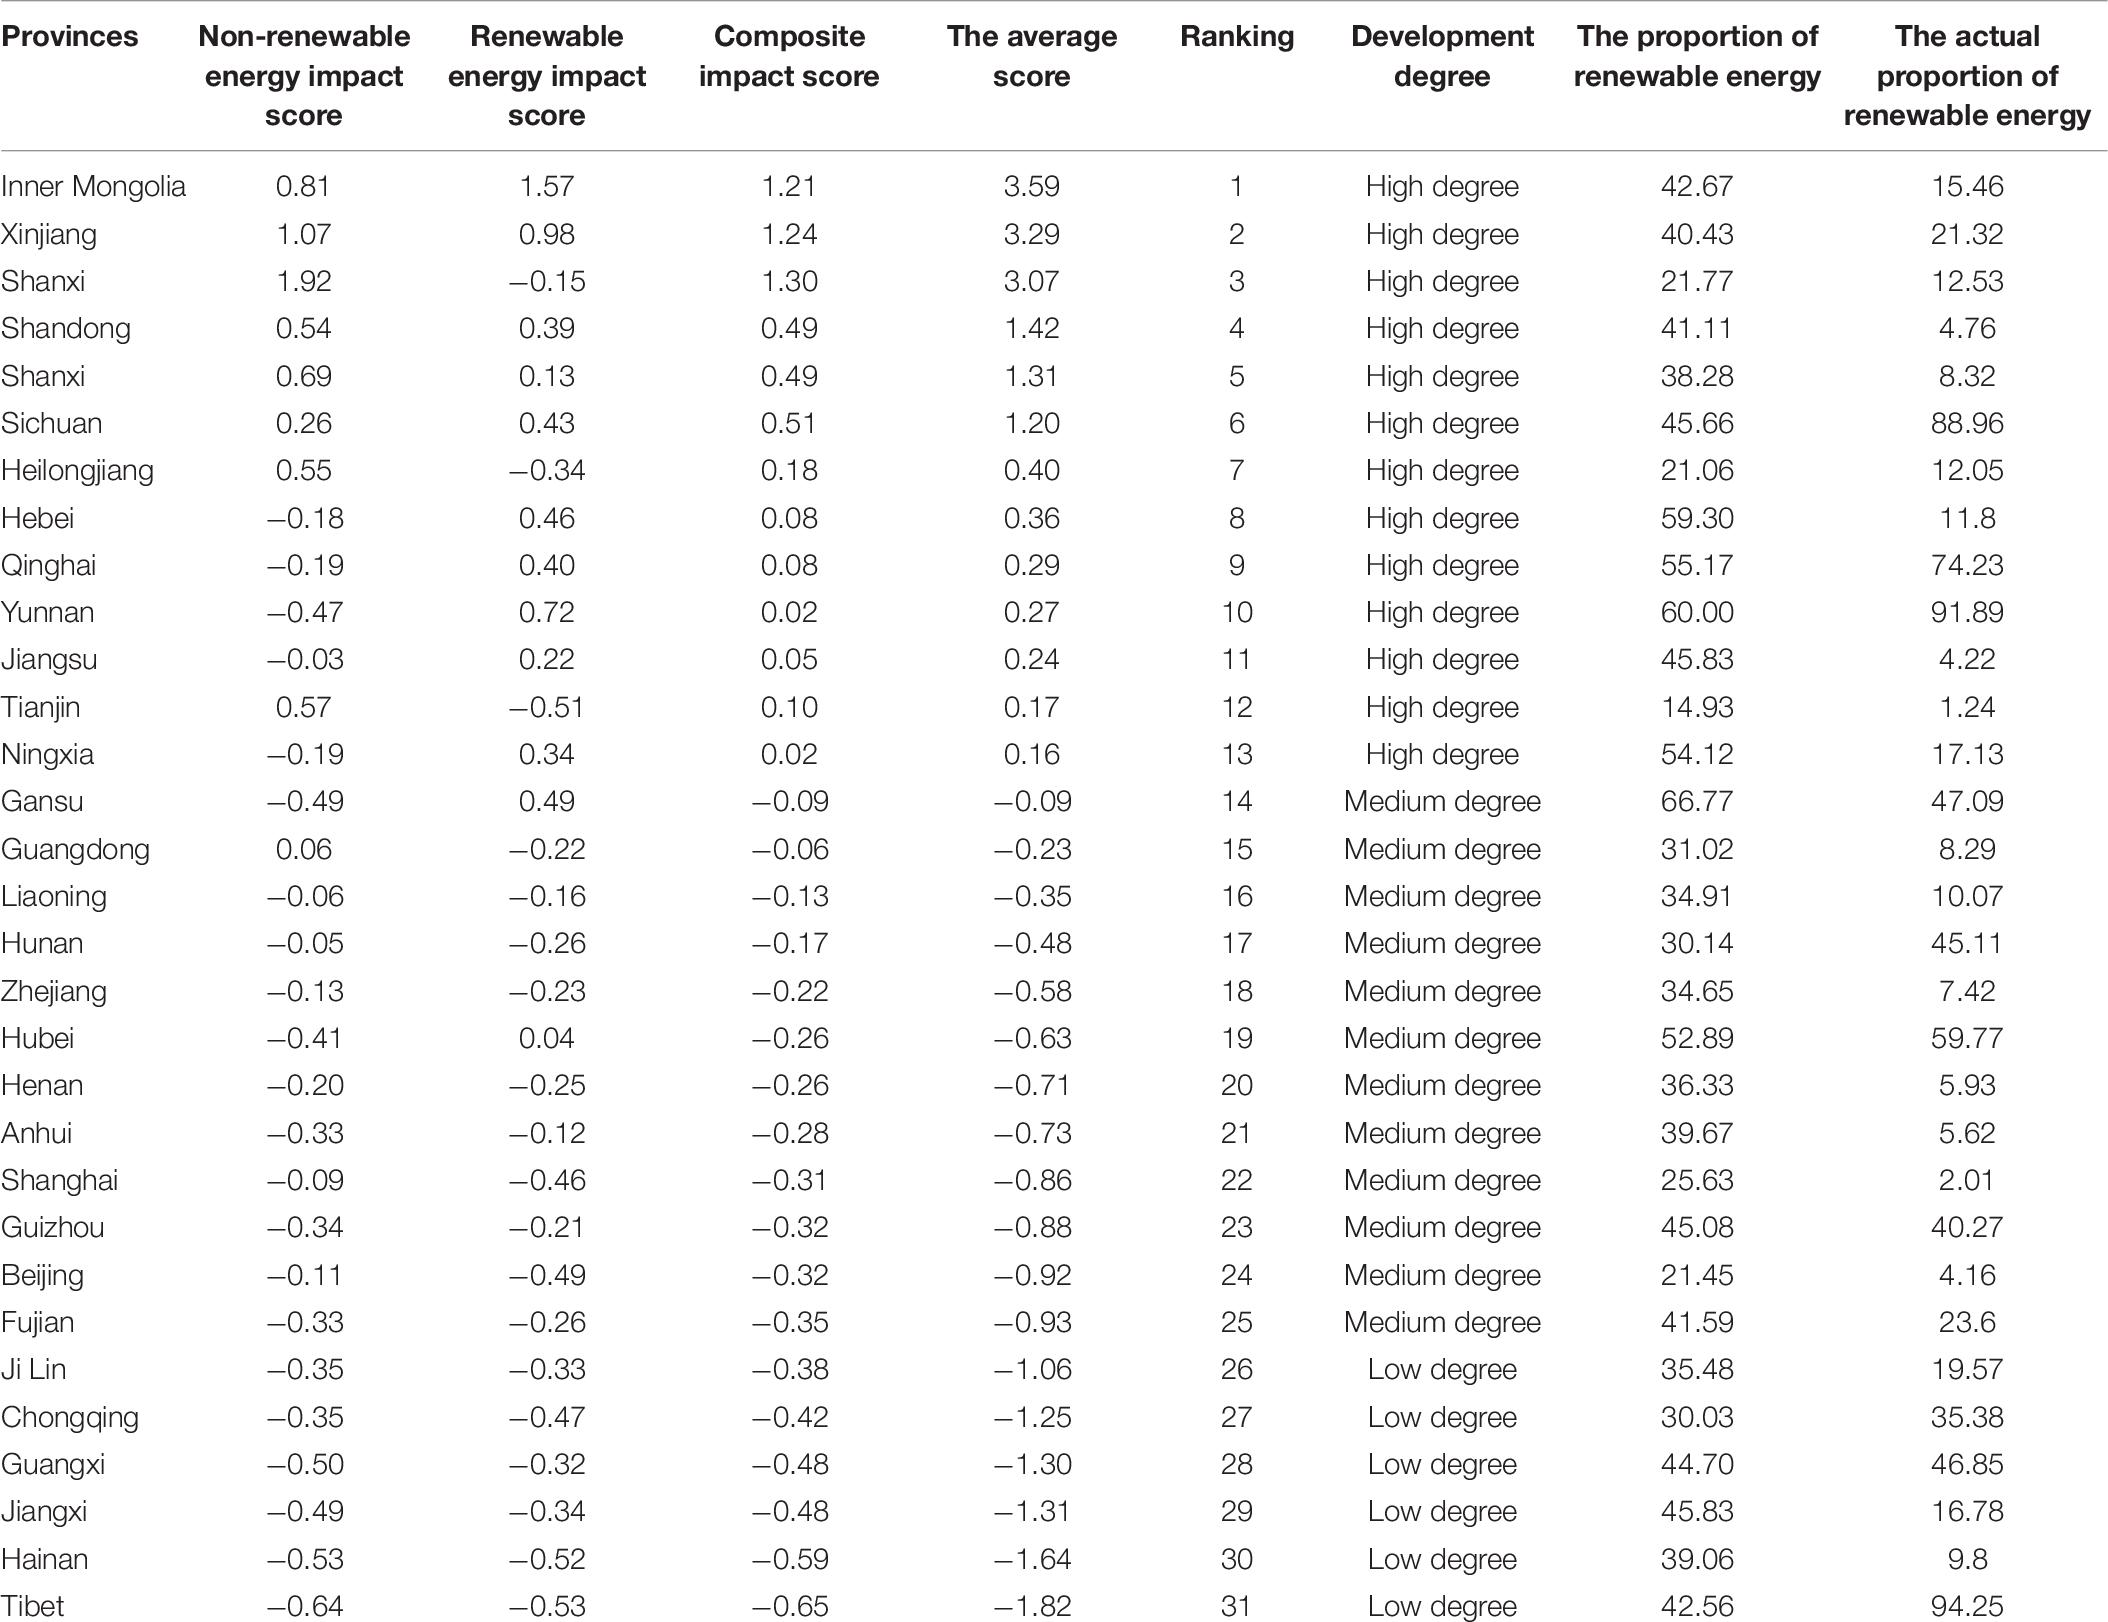
Table 7. Comprehensive score and development level of China’s energy development level.
Table 7 tells us that among the 13 provinces with high degree of regional energy development in China, only Sichuan, Qinghai, and Yunnan provinces have achieved the expected proportion of renewable energy development, indicating that the energy development mode of provinces such as Inner Mongolia, Xinjiang, Shanxi, and Shandong is still dominated by fossil fuel energy and their proportion of economic growth driven by renewable energy is relatively low. Among the six provinces with low energy development, Chongqing, Guangxi, and Tibet have higher utilization rate of renewable energy, indicating that there is redundancy in the technical elements of renewable energy development in some regions of China, and the development of renewable energy restricts the growth of regional economy. Therefore, local governments in these provinces should strengthen the import and use of fossil fuel energy.
Distribution Characteristics of China’s Regional Energy Development Level
According to the comprehensive score of China’s energy development level and the results of energy development degree, a vector diagram is made for the distribution of China’s regional energy development level. The results can be found in Figure 4.
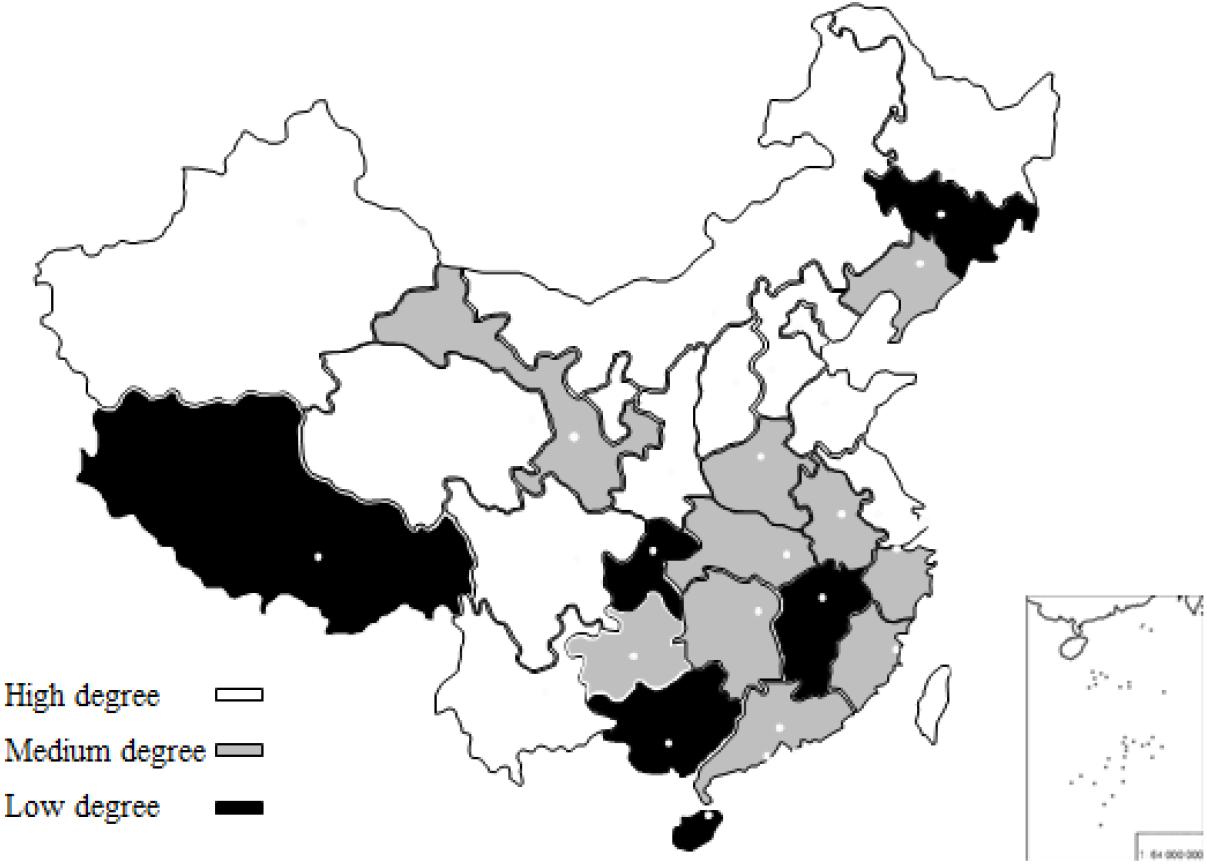
Figure 4. Distribution diagram of China’s regional energy development level.
Figure 4 shows that regions with a high degree of energy development are mostly located in western China. Firstly, northwestern China has a vast land area, low population density, sufficient sunshine, and photovoltaic conditions, which are more suitable for the development of large-scale wind and solar renewable energy industries. Also, the coal resources in these regions are relatively rich and are, therefore, the main source of China’s energy output. Secondly, southwestern China is located in the upper and middle reaches of the Yangtze river and Yellow river. It is rich in freshwater resources and has a big drop between different rivers, which is suitable for the development of large-scale hydropower projects. Regions with low energy development are mostly located in central China. On the one hand, the population of central China is comparatively dense, and its sunlight, wind energy, and river resources have no significant advantages. It is therefore difficult for central China to form a large-scale renewable energy industry. The energy-driven economic growth mode mainly relies on the fossil fuel energy. On the other hand, the economic foundation of the central region is relatively weak, the investment in renewable energy development technology is comparatively insufficient, the transformation of the energy structure is difficult, and the energy development does not play an important role in economic growth.
Conclusion and Suggestions
Conclusions
The problem of unbalanced energy development in China still exists. How to adjust the energy structure is the key to high-quality economic development in China. The main tasks of this study are as follows: one is to evaluate the level of China’s regional energy development, and the other is to explore how to adjust the energy structure to promote high-quality economic development. In this paper, the abovementioned two problems have been studied in depth. Taking China’s regional energy development level from 2016 to 2017 as the research object, the environmental endowment index of China’s regional energy development has been measured by using the global ML production function from the aspects of environmental and technological factors. Combined with the environmental endowment index of regional energy development, the gap between the proportion of regional renewable energy and the optimal energy structure is analyzed. Then, this paper explores the supporting effect of different energy development levels on high-quality economic development. It is concluded that the environmental endowment index of energy development varies among different regions in China, most of which are still underdeveloped, but a few of which have redundant technical elements of renewable energy development. China’s regional energy development model is still dominated by fossil fuel energy, and the proportion of renewable energy driving economic growth is relatively low. Renewable energy can effectively replace the use of fossil fuel energy and have a higher impact on high-quality economic development.
Suggestions
Based on the above study conclusions, the following policy suggestions are proposed:
(1) Reasonable determination of the renewable energy development goals. The government needs to have an overall consideration of the production costs of the energy system and reasonably determines the proportion of various renewable energy resources. It is suggested to consider the energy structure of renewable resources from the perspective of energy structure and regional environmental resources. For example, the consumption space of the regional energy system should be fully considered to improve the efficiency of renewable energy. The mixed energy supply mode is recommended for densely populated areas, and the self-supplied energy mode is recommended for areas with low population density. In addition, it is suggested that the national energy development goals should be implemented by relevant parties and various regions with specific responsibilities to achieve the best results.
(2) Appropriate Adjustment of the regional energy production factors structure. The result of the factor production research shows that the renewable energy production factors in western China are excessive, while the factors in the central area are insufficient. To solve the imbalance problem of the regional-production-factor allocation, it is necessary to reduce the proportion of renewable energy development in the western region, while increasing the proportion of fossil fuel energy, so as to enhance the efficiency of regional energy and to avoid unnecessary energy waste. At the same time, it is necessary for the government to give policy and technical support on renewable energy in the central region, so as to increase the efficiency of renewable energy and to promote the coordination between economy and ecology.
(3) The enhancement of the energy market circulation. Promoting the renewable energy development is primarily for solving the problems of regional cooperation and market mechanism. From the perspective of regional energy development, the imbalance of regional production capacity can be solved through various measures, such as tapping active resources of electricity load, improving the flexibility of interprovincial energy trade and energy transmission, reducing interprovincial trade barriers, and incorporating energy forecasting systems, so as to gradually establish a regional energy market mechanism.
(4) The importance of the integration of energy development. It is suggested that the government systematically deals with the structural imbalance issue, avoids fragmentation and contradiction in regional regulation, makes good use of the complementarily between different regions and different energy types, and further improves the efficiency of regional energy development.
Data Availability Statement
The original contributions presented in the study are included in the article/Supplementary Material, further inquiries can be directed to the corresponding author/s.
Author Contributions
All authors have significantly contributed to the manuscript. WL was the leader of the research group that conceived and designed the study. YH completed the model design and simulation analysis. WF and CC were responsible for data collection and the writing of part I and part II.
Funding
This manuscript is supported by the Humanity and Social Science Foundation of the Ministry of Education of China (No. 17YJA790057).
Conflict of Interest
The authors declare that the research was conducted in the absence of any commercial or financial relationships that could be construed as a potential conflict of interest.
Acknowledgments
The authors thank the Humanity and Social Science Foundation of the Ministry of Education of China for supporting this research (No. 17YJA790057).
Supplementary Material
The Supplementary Material for this article can be found online at: https://www.frontiersin.org/articles/10.3389/fenrg.2021.635570/full#supplementary-material
References
Abbasi, K., Jiao, Z., Shahbaz, M., and Khan, A. (2020). Asymmetric impact of renewable and non-renewable energy on economic growth in Pakistan: new evidence from a nonlinear analysis. J. Energy Explor. Exploit. 38, 1946–1967. doi: 10.1177/0144598720946496
Ahmed, A., Sutrisno, S. W., You, S., Lund, H., and Kaiser, M. J. (2020). A two-stage multi-criteria analysis method for planning renewable energy use and carbon saving. J. Energy 199:117475. doi: 10.1016/j.energy.2020.117475
Byrne, J., Zhou, A., Shen, B., and Hughes, K. (2007). Evaluating the potential of small-scale renewable energy options to meet rural livelihoods needs: a GIS- and lifecycle cost-based assessment of Western China’s options. J. Energy Policy 35, 4391–4401. doi: 10.1016/j.enpol.2007.02.022
Chen, Y., Zhao, J., Lai, Z., Wang, Z., and Xia, H. (2019). Exploring the effects of economic growth, and renewable and non-renewable energy consumption on China’s co 2 emissions: evidence from a regional panel analysis. J. Renew. Energy 140, 341–353. doi: 10.1016/j.renene.2019.03.058
Dong, K., Dong, X., and Jiang, Q. (2020). How renewable energy consumption lower global co2 emissions? Evidence from countries with different income levels. J. World Econ. 43, 1665–1698. doi: 10.1111/twec.12898
Dong, K., Sun, R., and Dong, X. (2018). Co2 emissions, natural gas and renewables, economic growth: assessing the evidence from china. J. Sci. Total Environ. 640–641, 293–302. doi: 10.1016/j.scitotenv.2018.05.322
Dranka, G. G., Ferreira, P., and Vaz, A. I. F. (2020). Cost-effectiveness of energy efficiency investments for high renewable electricity systems. J. Energy 198:117198. doi: 10.1016/j.energy.2020.117198
Hacıimamoǧlu, T., and Sandalcılar, A. R. (2020). The effect of renewable energy consumption on economic stability: panel data analysis on selected countries. EMAJ Emerg. Mark. J. 10, 10–20.
Heo, E., Kim, J., and Boob, K-J. (2010). Analysis of the assessment factors for renewable energy dissemination program evaluation using fuzzy AHP. J. Renew. Sustain. Energy Rev. 14, 2214–2220. doi: 10.1016/j.rser.2010.01.020
Hong, Y. (2019). Evaluation of regional haze level in China based on structural equation model. J. Stat. Decis. 35, 62–65. doi: 10.13546/j.cnki.tjyjc.2019.02.014
Ji, Q., and Zhang, D. (2019). How much does financial development contribute to renewable energy growth and upgrading of energy structure in China? J. Energy Policy 128, 114–124. doi: 10.1016/j.enpol.2018.12.047
Jin, D., and Li, Y. (2017). Empirical Study on energy consumption, economic growth and industrial development based on data analysis of China from 1953 to 2014. J. Mod. Manage. Sci. 55–57. doi: 10.3969/j.issn.1007-368X.2017.05.018
Khan, K. S., Ali, S. M., Ullah, Z., Sami, I., Khan, B., Mehmood, C. A., et al. (2020). Statistical energy information and analysis of Pakistan economic corridor based on strengths, availabilities, and future roadmap. IEEE Access 8, 169701–169739.
Kim, M. H., Kim, D., Heo, J., and Lee, D. W. (2019). Techno-economic analysis of hybrid renewable energy system with solar district heating for net zero energy community. J. Energy 187:115916. doi: 10.1016/j.energy.2019.115916
Li, H., Dong, L., and Duan, H. (2011). Research on comprehensive evaluation and structural optimization of China’s renewable energy development. J. Res. Sci. 33, 431–440.
Liu, J., Zhang, D., Cai, J., and Davenport, J. (2019). Legal systems, national governance and renewable energy investment: evidence from around the world. J. Br. J. Manage vol. 1–32. doi: 10.1111/1467-8551.12377
Lu, S. D., Wang, M. H., Kuo, M. T., Tsou, M. C., and Liao, R. M. (2019). Optimal unit commitment by considering high penetration of renewable energy and ramp rate of thermal units-a case study in Taiwan. J. Appl. Sci. 9:421. doi: 10.3390/app9030421
Ocal, O., and Aslan, A. (2013). Renewable energy consumption–economic growth nexus in Turkey. J. Renew. Sustain. Energy Rev. 28, 494–499. doi: 10.1016/j.rser.2013.08.036
Qi, S., and Li, Y. (2018). Threshold effect of renewable energy consumption on economic growth under the energy transition. J. China Popul. Resour. Environ. 28, 19–27. doi: 10.12062/cpre.20170905
Wang, Q., and Chen, X. (2012). China’s electricity market-oriented reform: from an absolute to a relative monopoly. J. Energy Policy 51, 143–148. doi: 10.1016/j.enpol.2012.08.039
Wang, Y. (2008). Time series analysis of China’s renewable energy consumption and economic growth–a case study of hydropower, nuclear power and wind power. J. Ind. Technol. Econ. 027, 96–99.
Wang, Y., Ji, Q., Shi, X., and Kazmerski, L. (2020). Regional renewable energy development in China: a multidimensional assessment. J. Renew. Sustain. Energy Rev. 124:109797. doi: 10.1016/j.rser.2020.109797
Yan, M., Li, H., and Tian, F. (2018). Are China’s energy-saving policies effective? – Measurement of ecological total factor energy efficiency based on SFA-Bayes analytical framework. J. Econ. Manage. Res. 039, 89–101. doi: 10.13502/j.cnki.issn1000-7636.2018.03.008
Zhang, H. (2014). Research on China’s New Energy Development. Changchun: Doctoral Dissertation, Jilin University.
Keywords: China’s energy development level, renewable energy, energy development environmental endowment index, high-quality economic development, GML production function, structural equation model
Citation: Liu W, Fan W, Hong Y and Chen C (2021) A Study on the Comprehensive Evaluation and Analysis of China’s Renewable Energy Development and Regional Energy Development. Front. Energy Res. 9:635570. doi: 10.3389/fenrg.2021.635570
Received: 30 November 2020; Accepted: 26 February 2021;
Published: 23 April 2021.
Edited by:
Hong-zhou Li, Dongbei University of Finance and Economics, ChinaReviewed by:
Xin Meng, Dongbei University of Finance and Economics, ChinaKangyin Dong, University of International Business and Economics, China
Copyright © 2021 Liu, Fan, Hong and Chen. This is an open-access article distributed under the terms of the Creative Commons Attribution License (CC BY). The use, distribution or reproduction in other forums is permitted, provided the original author(s) and the copyright owner(s) are credited and that the original publication in this journal is cited, in accordance with accepted academic practice. No use, distribution or reproduction is permitted which does not comply with these terms.
*Correspondence: Yu Hong, MzIwMTcwMzM2OUBhdWZlLmVkdS5jbg==