 Wenjun Chu
 Yang Liu
- Institute of Nuclear and New Energy Technology, Collaborative Innovation Center of Advanced Nuclear Energy Technology, Key Laboratory of Advanced Nuclear Reactor Engineering and Safety of Ministry of Education, Tsinghua University, Beijing, China
Void fraction is one of the key parameters for gas-liquid study and detection of nuclear power system state. Based on fully convolutional neural network (FCN) and high-speed photography, an indirect void fraction measure approach for flow boiling condition in narrow channels is developed in this paper. Deep learning technique is applied to extract image features and can better realize the identification of gas and liquid phase in channels of complicated flow pattern and high void fraction, and can obtain the instantaneous value of void fraction for analyzing and monitoring. This paper verified the FCN method with visual boiling experiment data. Compared with the time-averaged experimental results calculated by the energy conservation method and the empirical formula, the relative deviations are within 11%, which verifies the reliability of this method. Moreover, the recognition results show that the FCN method has promising improvement in the scope of application compared with the traditional morphological method, and meanwhile saves the design cost. In the future, it can be applied to void fraction measurement and flow state monitoring of narrow channels under complex working conditions.
Introduction
Gas-liquid two-phase flow reserves value for the research in fields of nuclear energy, petrochemical industry, erospace and various industrial applications (Triplett et al., 1999). In the two-phase flow study and engineering application, the cross sectional void fraction (or frequently abbreviated to void fraction) which functions as one of the key parameters, has important significance for determining the flow pattern, calculating the two-phase pressure drop and analyzing heat transfer characteristics (Winkler et al., 2012). For conventional pipeline conditions, some common methods in experiments include quick-closing valves (Srisomba et al., 2014), X-ray/γ-ray absorption (Zhao Y et al., 2016; Jahangir et al., 2019), differential pressure (Jia et al., 2015) and capacitive method (Jaworek et al., 2014). However, the data obtained by these common methods are mostly single-point values or time-averaged results, and the instantaneous void fraction distribution of the full flow region can hardly be obtained (Hong et al., 2011).
In recent years, an increasing number of mini-channel systems are applied for industrial systems such as nuclear power plant heat exchangers and refrigerators due to large surface area/volume ratio and high transfer efficiency of heat and mass (Kawahara et al., 2002). The narrow rectangular channel is an important structure of these systems. The flow boiling phenomenon tends to be more complicated in narrow channels than in normal pipelines, and direct measurement of void fraction is limited because of the geometry size of the flow channel. Therefore, non-contact measurement like high-speed photography can be applied and combined with digital technology. Compared with other methods, the high-speed photography method can observe the detailed behavior of bubbles without disturbing the flow, and also be able to process multiple images and extract the instantaneous void fraction information in a short time (Fu and Liu, 2016; Zahid et al., 2020).
Many image-processing algorithms for flow field photography have been proposed to figure out the characteristics of the gas-liquid interface and obtain the two-phase distribution. Some examples include edge detection, region filling and morphological operation. Bröder and Sommerfeld (2007) use an edge detecting Sobel filter and spline interpolation technique to determine the contour of in-focus bubbles in rectangular channels, and the bubble velocity is obtained by applying particle tracking velocimetry (PTV). Lau et al. (2013) handle the overlapping/clustering bubbles in bubbly flow with large void fractions by the watershedding algorithm, and segment the groups into individual bubble areas for analyzing. Karn et al. (2015) introduce a multi-level image analysis approach for highly turbulent bubbly flows, which uses H-Minima transform to binarize the image and successfully extract the bubble information by morphological operations. Pan et al. (2018) propose the two-step morphological method and the combined use of morphological opening and closing operations solves the problem of bubble boundary recognition, which improves the accuracy of void fraction measurement. However, these traditional algorithms depend on the extraction process and features designed by manual experience, which have certain influence on the recognition rate and accuracy of the void fraction. In addition, existing research mainly focuses on unheated test sections, while in actual boiling conditions bubbles grow and polymerize fiercely in the flow channel, therefore the gas-liquid interface tends to be hardly recognized. At the same time, in operating conditions with high heating power, the void fraction increases and the phase distribution changes drastically, which brings difficulties for the traditional image processing methods based on edge detection and mathematical morphology to achieve expected results.
The Convolutional Neural Network (CNN) algorithm is based on data extraction and supervised learning. Compared to traditional image recognition algorithms using artificially designed features, the multi-layer network structure of CNN can automatically extract different levels of features from massive training data, which avoiding errors caused by subjectivity and improving classification accuracy. In 2015, Jonathan Long et al. proposed a new structure of CNN—Fully Convolutional Network (FCN) (Long et al., 2015) applied for image segmentation. FCN model changes the last layer of the original CNN to a convolutional layer and adds upsampling layers to achieve any size of input images and classify the image pixel by pixel. In addition, FCN utilizes a variety of mature network structures which have been trained well in huge data set to initialize its network parameters, and reduces its design costs. For the last several years, fully convolutional networks have been widely used in various image segmentation tasks, such as autonomous driving (Wu et al., 2017), medical image (Ronneberger et al., 2015) and remote sensing (Maggiori et al., 2016). In this paper, based on the visualized experiment of two-phase boiling conditions in a narrow rectangular channel, a measurement approach of void fraction in narrow channels is proposed by setting up a fully convolutional neural network to process images of high-speed photography, and the measure results are verified with the experimental data calculated by the energy conservation method.
Experimental Devices and Procedures
In order to study the heat transfer characteristics of two-phase flow in narrow channels and the influence of different parameters on flow stability, the visualized flow boiling experiment system is designed and shown in Figure 1. The main part is composed of the test section, main pump, preheater, regulating valve, gas-water separator, flowmeter, etc. The experimental medium is purified deionized water. After preheating, the deionized water flows out of the main pump and is heated by the preheater to reach a preset degree of subcooling. Then it passes into the vertical test section and bypass to start boiling. The upwards two-phase mixture goes through the steam-water separator and returns to the main pump which forms a closed loop. ADMAG AXF electromagnetic flowmeters are adopted for flow measurement and the measuring error is ±0.4%. The temperature measuring applies T-type thermocouples with class I accuracy of ±0.5°C. The test data is collected by NI PXI equipment and the sampling frequency is 10 Hz. The range of critical parameters in the experiments is listed in Table 1.
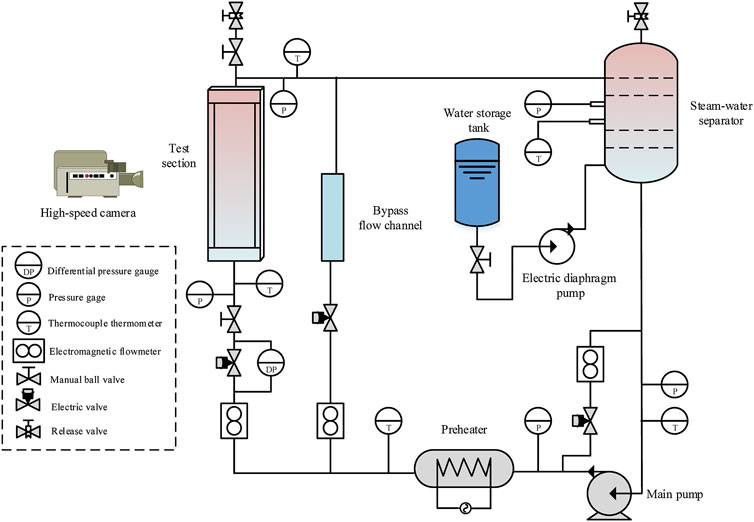
FIGURE 1. Schematic diagram of the test loop.
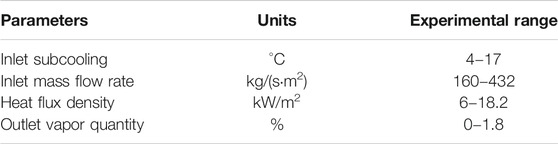
TABLE 1. The range of primary experimental parameters.
The schematic diagram of the test section is shown in Figure 2. The narrow channel with a rectangular cross-section is composed of two pieces of glass. The cross-sectional size is 30 × 1.5 mm, and the length of the rectangular flow channel is 650 mm. A transparent heating film is evenly coated on the outside of each glass and the heating length is 550 mm. The test section is insulated by a transparent plexiglass barrel arranged outside, and the low-pressure nitrogen is filled into the gap between the barrel and the test section before power on. The image acquisition system beside the transparent test section applies an AOS X-MOTION high-speed camera. The photo-frequency is set to 1,000 frames per second. The resolution of the captured image is 1,280 × 300.
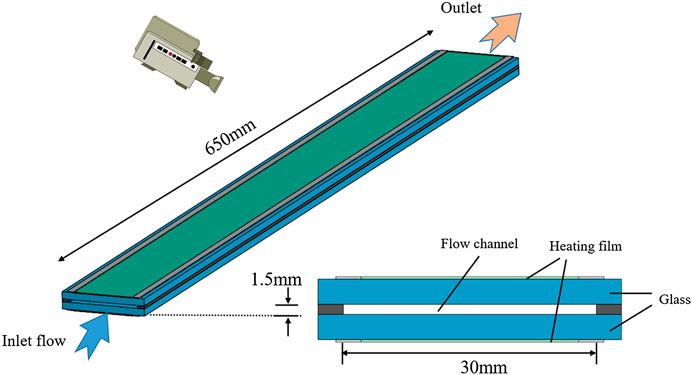
FIGURE 2. Schematic diagram of the test section.
Image Processing Method Based on Fully Convolutional Network
Summary of the Algorithm
Figure 3 presents original experiment image samples of the flow channel in boiling conditions. Its characteristics include: 1) The gas phase occupies a large proportion of the flow channel, and on occasion the bubbles can fill the cross section of the flow channel; 2) The flow pattern is mostly slug flow or churn flow, and the boundary between gas and liquid phase is blurred at high flow velocity; 3) The void fraction changes drastically and the sizes of bubbles/slugs in different working conditions and different time are quite different. The above characteristics, which mean the unevenness of the gas phase distribution in space and time, are mainly caused by the narrow channel structure and heating conditions. As a result, it is difficult for most traditional recognition methods based on single scales or features (such as edges, pixel thresholds and morphological structures) to obtain stable and efficient results. In order to solve these problems, this paper proposes a new image segmentation algorithm of FCN method based on deep learning technology. It can extract information from pixel level to abstract semantic concepts through multi-layer convolution operations. It also uses up-sampling layers and multi-scale fusion technology to further optimize the results and achieve higher segmentation accuracy. At the same time, we enhance the adaptability of the FCN algorithm by automatically learning various features from a large amount of data at different times, which makes it suitable for identifying complex gas-liquid images in narrow channels.
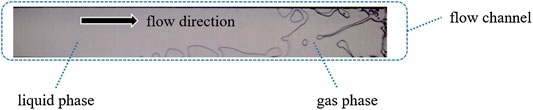
FIGURE 3. Samples of original high-speed photography images.
In this paper, FCN algorithm is utilized to extract the gas phase part in Figure 3, and realize the segmentation of gas and liquid. The flow channel part of the original captured image (the input of the FCN network) can be defined as
Where
The output of the FCN are binary images of the same size
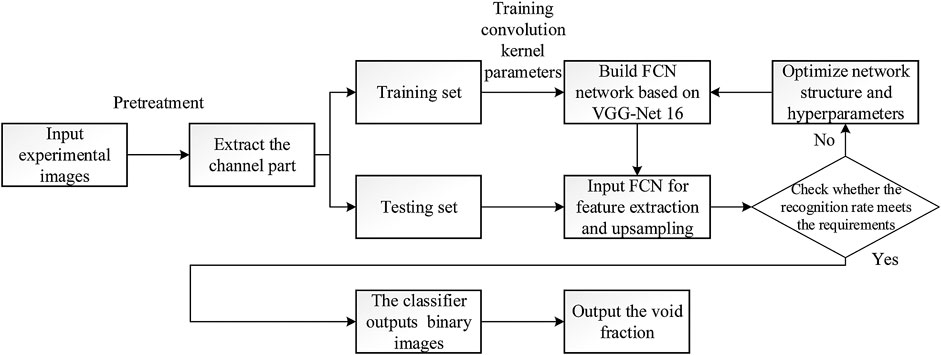
FIGURE 4. Flowchart of the image-processing algorithm.
Methods of the Fully Convolutional Network Model
Figure 5 is an overall schematic diagram of the structure of FCN model established in this paper. As shown in the figure, the FCN model is mainly composed of two parts. The left part in the box is called convolution (downsampling) part, which is mainly composed of convolutional layers and pooling layers to extract various features of the input image. The right box is called deconvolution (upsampling) part, which is mainly composed of deconvolution layers and a classification layer. It is used to restore the original image size from the high-dimensional feature map and identify each pixel. The methods used in these two parts are introduced below.
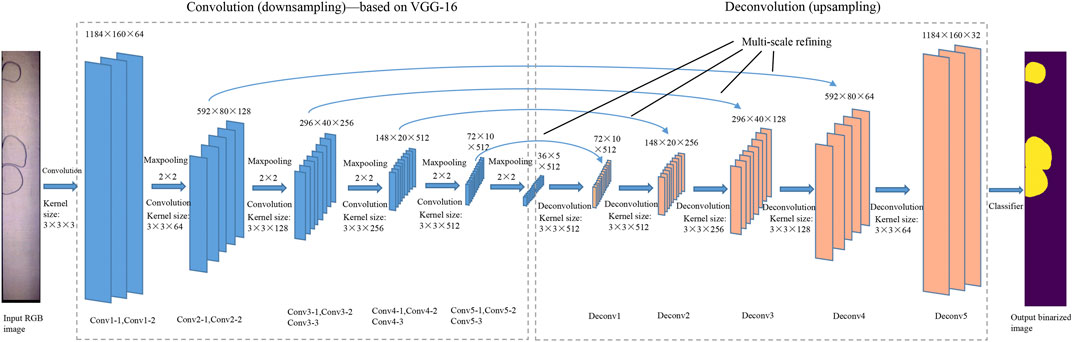
FIGURE 5. Schematic diagram of the network structure in this paper.
Convolution (Downsampling) Part
This paper applies VGG-Net 16 (Simonyan and Zisserman, 2014) as the basic neural network for extracting features, and sets up a new model on this basis to save training and calculation costs. The first half of the established FCN model retains the structure and initial parameters of the original VGG network before the fully connected (fc) layer. Five groups of 13 convolutional layers of increasing size is applied to extract different scales of the features by training 3 × 3 convolution kernels and performing convolution operations:
Among them,
VGG-Net 16 has a large number of convolutional kernels, and after the convolution operation the output data is large and the dimensionality is high. Therefore, a pooling layer (downsampling) is added after each group of convolution-activation layers to compress the image and reduce the difficulty of the subsequent calculation. Pooling layer can also extract the spatial details of the features to realize the spatial invariance (such as translation and rotation) and stability of image recognition. In this work, 2 × 2 maximum pooling layers are applied as:
Where
Deconvolution (Upsampling) Part
Due to pooling operations, the output image matrix (high-dimensional feature map) sampled by the convolution network is 1/32 of the original image size. To resize the classification results to the original, the three fully connected layers of VGG-Net are removed and five upsampling (deconvolution) layers are added after the convolution layers. Upsampling is the transpose of convolving and the specific process of upsampling in the model is shown in Figure 6 and compared with convolution and pooling. The output size can be calculated by the formula:
where
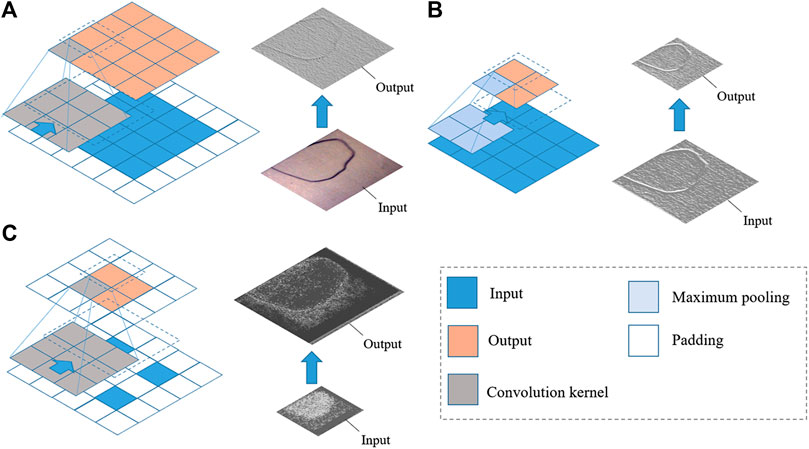
FIGURE 6. Schematic diagram and visualization samples of three basic operation in FCN network of this paper. (A) Convolution. (B) Maximum pooling. (C) Upsampling (deconvolution).
The result of upsampling directly from the high-dimensional feature map to the original image size only contains the overall information and reveals too rough. Therefore, this paper also utilizes a multi-scale refining structure (Cen and Jung, 2018) commonly used in existing research, which is to add the output of the first 4 pooling layers to the upsampling layers in sequence in order to integrate local information with the overall spatial architecture. Figure 7 shows that by adding the features at different scales from the downsampling layers, the output images tend to have more details and the recognition accuracy is improved.
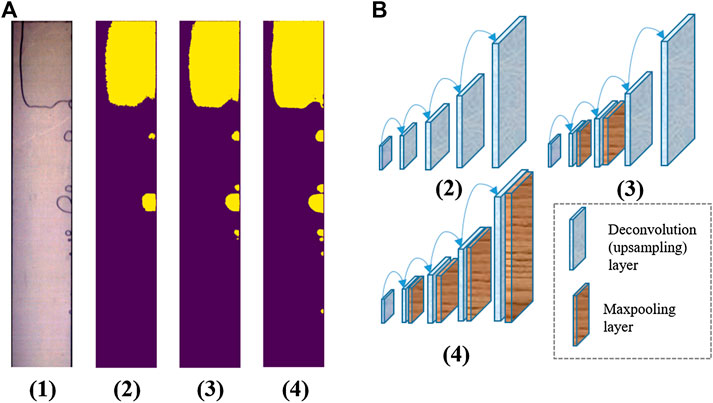
FIGURE 7. The visualization and comparison of upsampling layers’ results after refining of different scales. (A) Visualized results: (1)The original input image; (2) upsampling result directly from the high-dimensional feature map; (3) upsampling result adding features of pooling layers 3 and 4; (4) upsampling result adding features of pooling layers 1–4. (B) Schematic diagram of multi-scale refining structure. The yellow part in the image represents the recognition result of gas phase.
In practical training, odd-sized images are fairly common. The convolution and pooling operation of odd-sized images in program will round down and the upsampling process cannot guarantee that the final output size is strictly consistent with the original. Most existing research solve this problem by resizing the input image to constant even size or dividing into parts and importing by batches, which may affect the subsequent calculation accuracy of void fraction in this paper. To solve this problem, an additional judging operation for input size is added before each upsampling layer, and padding (edge expansion) operation is added for odd-sized pictures to ensure the invariance of the input size. After upsampling, the classification of the image is completed through the classifier layer.
Network Training Settings
In this paper, the neural network training adopts the traditional back propagation algorithm, and its core idea is to obtain the partial derivative of the loss function of the samples, so as to adjust the weight and bias of the network operation layers (convolutional and upsampling layers in FCN model) along the gradient descent direction to minimize the loss function.
Loss function. Since it is a binary classification problem (gas and water), the cross entropy formula is used for the loss function:
where
Training optimizer. In training process, the FCN model applies the VGG-16 network pre-training value as the initial value, and optimizing the network by the Stochastic Gradient Descent (SGD) optimizer with momentum. SGD optimizer can quickly find the direction of gradient descent and converge to the global minimum through multiple iterations. Momentum can make convergence faster to avoid staying in the local extreme value area for a long time, and suppress the oscillation to increase the calculation stability. Calculation formula can be written as:
where
Performance evaluation. In performance evaluation of the FCN model, we use pixel accuracy (PA) and mean intersection of union (MIoU) of foreground to measure segmentation accuracy. PA means the proportion of correctly marked pixels to total pixels. MIoU calculates the mean ratio of intersection between segmentation result and ground truth mask to the union of them. In the binary classification problem in this article, PA and MIoU can be calculated with the following formula:
where
Training environment and configuration. This paper employs the deep learning framework Pytorch for network construction and training. The experimental hardware environment is AMD 4800H CPU, 16 GB memory, NVIDIA RTX2060 graphics card for GPU acceleration.
Calculation Results and Verification
Experimental Data Set
The data set used in the experiment in this paper comes from the images collected by the visual narrow channel flow boiling experiment system of Tsinghua University. Each working condition point records 13,800 pictures (1,000 frames per second and the acquisition time is 13.8 s). Three typical conditions are chosen and the operating parameters are shown in Table 2.
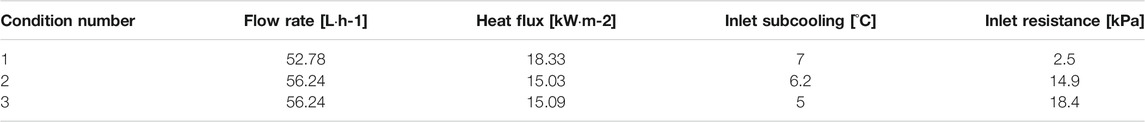
TABLE 2. Typical experiment conditions.
Results and Analysis
Figure 8 shows the train loss of the network and MIoU of the test set under different learning rates and momentum factors. From the picture, we can see the learning rate less affects the training process, while higher momentum can effectively improve computing stability. By comparing the results, we choose learning rate = 0.01 and momentum factor = 0.9. After 33,500 iterations, the train loss basically converges, and the average PA and MIoU of the test set reach 0.991 (99.1%) and 0.982 (98.2%) respectively, which can meet the requirements for convergence speed and training accuracy, and reduce computational oscillation. Then the FCN model established in this paper is applied for the experimental data set and part of the processing results are shown in Figure 9, achieving recognition of the gas phase in the image under the conditions of different void fraction and different flow patterns. It can be seen that the method has basically identified the gas phase’s morphology, especially in the slug flow (Figure 9 a1 and a2) and churn flow (Figure 9 a3 and a4) of high void fraction. This verifies the portability and reliability of this method for different working conditions and flow patterns in boiling experiments.

FIGURE 8. The influence of training parameters on the training process and test set accuracy. (A) Different learning rate (momentum factor = 0.9). (B) Different momentum factor (learning rate = 0.01): (1) Changes of the train loss. (2) Changes of the mean iou of the test set.
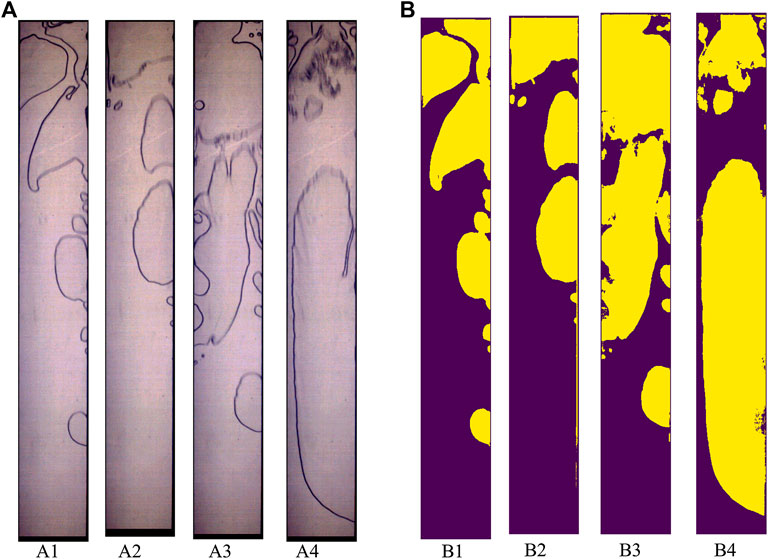
FIGURE 9. Image processing results of different flow patterns. (A) Input images. (B) Output binarized images (A1, A2: slug flow with bubbles; A3, A4: churn flow).
As shown in Figure 10, the method in this paper is compared the traditional edge detection/filling algorithm and the two-step morphological method of Pan et al. (2018). It can be seen that in working condition A of low void fraction, the results of FCN method and the traditional algorithm are not much different, and both can identify bubbles with clear boundaries and regular shapes. The FCN method has a relatively better recognition effect on small bubbles. In working condition B and C where the void fraction is high, the traditional algorithm will overfill the gap between the bubble and the vapor slug, resulting in the unrecognizable gas phase areas and may detect an excessively high void fraction value. The designed morphological method can better extract the characteristics of local irregular bubbles, but it requires manual setting of parameters. When the pixel value of the picture changes greatly and the threshold parameters cannot be matched, a large block of recognition defects may occur like Figure 10C. The method in this paper also has some local recognition defects inside and between the bubbles, but it basically realizes the recognition of bubble shape. It also has better applicability for different flow patterns to improve the overall recognition accuracy, and does not require manual adjustment of parameters, which saves design costs.
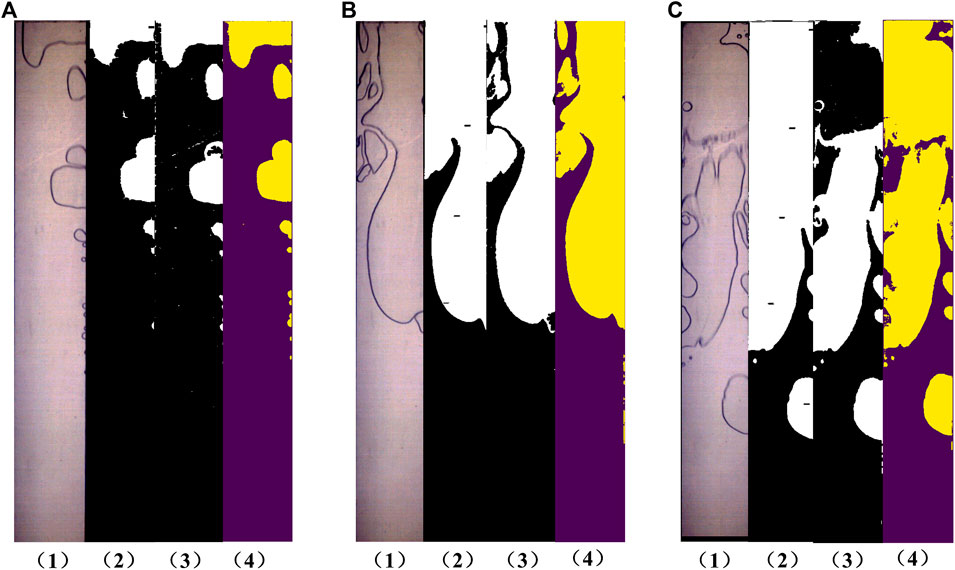
FIGURE 10. Comparison of FCN model results in this paper with traditional algorithms (A) Condition A of low void fraction (B,C) Condition B and C of high void fraction. (1) Input experimental pictures; (2) Traditional edge detection/filling algorithm; (3) Two-step morphological method; (4) FCN method.
The void fraction at the outlet of the flow channel is of significance to the calculation of the two-phase model and determining the flow pattern. After the gas-liquid recognition results are obtained by the method in this paper, the numerical matrix
The time-dependent change of the void fraction (0–2.5 s) obtained by the method in this paper is shown in Figure 11. It can be seen that due to the small size of the narrow channel, the bubble develops more rapidly after its generation, which cause the outlet void fraction extremely fluctuates with time. In condition 1, the flow channel is mainly dominated by annular flow, a large section of gas column is accompanied by intermittent liquid film oscillation, and the proportion of outlet void fraction alternately changes with a period of about 0.2s. Operating condition two and three have lower heat flux density than condition 1, and are dominated mainly by slug flow and churn flow. So we can observe from Figure 11 that intermittent steam generation phenomenon occurs, resulting in a rapid and regular decrease and rise of the void fraction., which is consistent with the high speed photography images at the corresponding time.
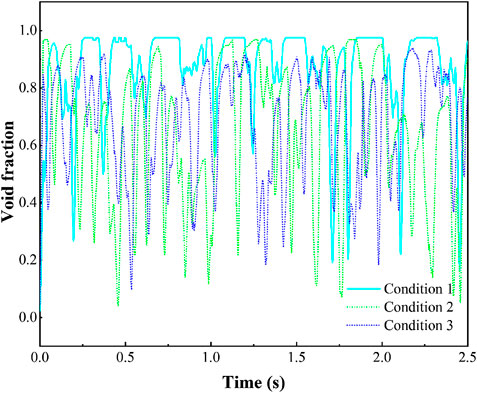
FIGURE 11. Change of the outlet void fraction with time of different working conditions (0∼4 s).
For further verifying the accuracy of the neural network recognition results, we use the theoretical method to calculate the time-averaged void fraction under experimental conditions and compare it with the average value obtained by the method in this paper. The formula of energy conservation method for calculating the mass quality of the gas at the outlet of the narrow channel is shown in the following:
where
In this formula,
So far, numerous of empirical, semiempirical and analytical two-phase flow void fraction correlations have been developed, and according to many review literatures these formulas can be mainly divided into slip ratio model, Lockhart-Martinelli parameter based model, drift flux model,
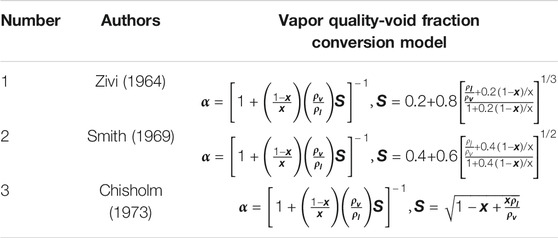
TABLE 3. The vapor quality-void fraction conversion model selected in this paper.
The void fraction calculated by our FCN method is instantaneous and the data is time-averaged for comparing with the theoretical results:
Where
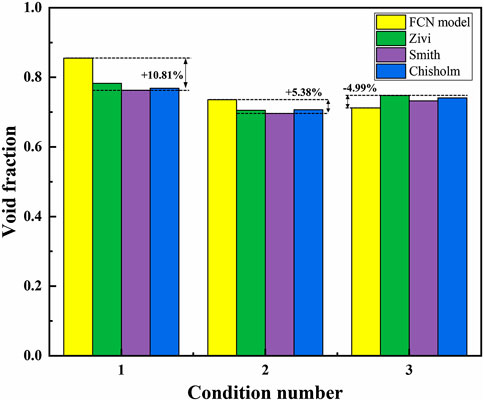
FIGURE 12. Comparison results of the void fraction calculated by the method in this paper and the empirical formulas.
Conclusion
(1) In this paper, a void fraction measurement method based on fully convolutional neural network (FCN) is proposed for the visualization system of the narrow channel two-phase flow boiling experiment. It can identify and extract gas phase from the flow images captured by a high-speed camera, and calculate the void fraction at different locations of the channel. The conclusion is summarized as follow:
(2) Introducing the FCN method based on deep supervised learning and data extraction into the gas-liquid two-phase recognition. FCN can extract information automatically from pixel level to abstract semantic concepts through multi-layer convolution operations. It also uses up-sampling layers and multi-scale fusion technology to further optimize the results. The method reduces the cost of manual design algorithm, and has extensive value for the gas-liquid identification of two-phase flow.
(3) Aiming at problems such as blurring of the gas-liquid interface and dramatic changes in the instantaneous void fraction when in high vapor quality of the narrow channel, the network structure has been adjusted to adapt specific problems. In the working conditions of different void fraction and flow patterns, FCN method realizes better recognition of the gas phase in images, and also realizes the measurement of the transient void fraction in the entire flow channel, which improves the generality of the gas-liquid recognition algorithm.
The void fraction at the outlet of the flow channel is extracted and compared with the numerical results obtained by the energy conservation method and empirical formulas. The deviation between two methods is within ±11%, which verified the reliability of the FCN method. In the future, this method can be applied to real-time void fraction measurement and flow channel monitoring in complex conditions of narrow channels.
Data Availability Statement
The raw data supporting the conclusions of this article will be made available by the authors, without undue reservation.
Author Contributions
WC, YL, LP, and XY designed the experiment and the work in paper. WC designed the main algorithm, while YL and LP helped with the processing of experiment data, WC wrote the manuscript with support from HZ and XY and all other authors.
Funding
The Analyses and Tests for the key Safety Technology of Nuclear Heating Reactor NHR200-II supported this study.
Conflict of Interest
The authors declare that the research was conducted in the absence of any commercial or financial relationships that could be construed as a potential conflict of interest.
Acknowledgments
We gratefully wish to acknowledge the assistance of Yefei Liu to the experiment, and thank to other teachers and students in the laboratory.
Supplementary Material
The Supplementary Material for this article can be found online at: https://www.frontiersin.org/articles/10.3389/fenrg.2021.636813/full#supplementary-material.
References
Bröder, D., and Sommerfeld, M. (2007). Planar shadow image velocimetry for the analysis of the hydrodynamics in bubbly flows. Meas. Sci. Technol. 18 (8), 2513. doi:10.1088/0957-0233/18/8/028
Cen, M., and Jung, C. (2018). “Fully convolutional siamese fusion networks for object tracking,” in Proceedings of the Int. Conf. on Image Processing, Athens, Greece, October 7-October 10, 2018.
Chisholm, D. (1973). Pressure gradients due to friction during the flow of evaporating two-phase mixtures in smooth tubes and channels. Int. J. Heat Mass Tran. 16 (2), 347–358. doi:10.1016/0017-9310(73)90063-X
Dalkilic, A. S., Laohalertdecha, S., and Wongwises, S. (2009). Effect of void fraction models on the film thickness of R134a during downward condensation in a vertical smooth tube. Int. Commun. Heat Mass Tran. 36 (2), 172–179. doi:10.1016/j.icheatmasstransfer.2008.10.015
Fu, Y., and Liu, Y. (2016). Development of a robust image processing technique for bubbly flow measurement in a narrow rectangular channel. Int. J. Multiphas. Flow 84, 217–228. doi:10.1016/j.ijmultiphaseflow.2016.04.011
Hong, W., Liu, Y., and Zhou, Y. (2011). Investigation on gas-liquid two-phase flow void fraction across tube bundles based on images processing method. Proc. CSEE 31 (11), 74–78. doi:10.13334/j.0258-8013.pcsee.2011.11.001 [in Chinese]
Huang, D., Gao, P., Chen, C., and Lan, S. (2013). Effect of void fraction correlations on two-phase pressure drop during flow boiling in narrow rectangular channel. Nucl. Eng. Des. 265, 383–392. doi:10.1016/j.nucengdes.2013.09.011
Jahangir, S., Wagner, E. C., Mudde, R. F., and Poelma, C. (2019). Void fraction measurements in partial cavitation regimes by X-ray computed tomography. Int. J. Multiphas. Flow 120, 103085. doi:10.1016/j.ijmultiphaseflow.2019.103085
Jaworek, A., Krupa, A., and Trela, M. (2004). Capacitance sensor for void fraction measurement in water/steam flows. Flow Meas. Instrum. 15 (5-6), 317–324. doi:10.1016/j.flowmeasinst.2004.04.002
Jia, J., Babatunde, A., and Wang, M. (2015). Void fraction measurement of gas–liquid two-phase flow from differential pressure. Flow Meas. Instrum. 41, 75–80. doi:10.1016/j.flowmeasinst.2014.10.010
Karn, A., Ellis, C., Arndt, R., and Hong, J. (2015). An integrative image measurement technique for dense bubbly flows with a wide size distribution. Chem. Eng. Sci. 122, 240–249. doi:10.1016/j.ces.2014.09.036
Kawahara, A., Chung, P. Y., and Kawaji, M. (2002). Investigation of two-phase flow pattern, void fraction and pressure drop in a microchannel. Int. J. Multiphas. Flow 28 (9), 1411–1435. doi:10.1016/S0301-9322(02)00037-X
Lau, Y. M., Deen, N. G., and Kuipers, J. A. M. (2013). Development of an image measurement technique for size distribution in dense bubbly flows. Chem. Eng. Sci. 94, 20–29. doi:10.1016/j.ces.2013.02.043
Long, J., Shelhamer, E., and Darrell, T. (2015). “Fully convolutional networks for semantic segmentation,” in Proceedings of the IEEE conference on computer vision and pattern recognition, Boston, MA, June 7–June 12 2015.
Maggiori, E., Tarabalka, Y., Charpiat, G., and Alliez, P. “Fully convolutional neural networks for remote sensing image classification,” in Proceedings of the 2016 IEEE International Geoscience and Remote Sensing Symposium, Beijing, China, July 10-July 15 2016.
Pan, L., Liu, Y., and Li, W. (2018). Measurement method of void fraction in narrow channel based on two-step morphological image method. Yuanzineng Kexue Jishu Atomic Energy Sci. Technol. 52, 2256–2262. doi:10.7538/yzk.2018.youxian.0204
Ronneberger, O., Fischer, P., and Brox, T. (2015). “U-net: convolutional networks for biomedical image segmentation,” in proceedings of the international conference on medical image computing and computer-assisted intervention, Munich, Germany, October 5–October 9, 2015 (Cham: Springer), 234–241.
Simonyan, K., and Zisserman, A. (2014). Very deep convolutional networks for large-scale image recognition. Available at: https://arxiv.org/abs/1409.1556 (Accessed September 4, 2014).
Smith, S. L. (1969). Void fractions in two-phase flow: a correlation based upon an equal velocity head model. Proc. Inst. Mech. Eng. 184 (1), 647–664. doi:10.1243/pime_proc_1969_184_051_02
Srisomba, R., Mahian, O., Dalkilic, A. S., and Wongwises, S. (2014). Measurement of the void fraction of R-134a flowing through a horizontal tube. Int. Commun. Heat Mass Tran. 56, 8–14. doi:10.1016/j.icheatmasstransfer.2014.04.004
Triplett, K. A., Ghiaasiaan, S. M., Abdel-Khalik, S. I., and Sadowski, D. L. (1999). Gas–liquid two-phase flow in microchannels Part I: two-phase flow patterns. Int. J. Multiphas. Flow 25 (3), 377–394. doi:10.1016/S0301-9322(98)00054-8
Vigayan, P. K., Patil, A. P., and Pilkhwal, D. S. (2000). An assessment of pressure drop and void fraction correlations with data from two-phase natural circulation loops. Heat Mass Tran. 36 (6), 541–548. doi:10.1007/s002310000108
Winkler, J., Killion, J., and Garimella, S. (2012). Void fractions for condensing refrigerant flow in small channels. Part II: void fraction measurement and modeling. Int. J. Refrig. 35 (2), 246–262. doi:10.1016/j.ijrefrig.2011.08.012
Wu, B., Iandola, F., Jin, P. H., and Keutzer, K. (2017). “Unified, small, low power fully convolutional neural networks for real-time object detection for autonomous driving,” in Proceedings of the IEEE Conference on Computer Vision and Pattern Recognition Workshops, Honolulu, HI, July 21–July 26, 2017.
Zahid, A. A., ur Rehman, S. R., Rushd, S., Hasan, A., and Rahman, M. A. (2020). Experimental investigation of multiphase flow behavior in drilling annuli using high speed visualization technique. Front. Energy 14, 635–643. doi:10.1007/s11708-018-0582-y
Zhao, Y., Bi, Q., Yuan, Y., and Lv, H. (2016). Void fraction measurement in steam–water two-phase flow using the gamma ray attenuation under high pressure and high temperature evaporating conditions. Flow Meas. Instrum. 49, 18–30. doi:10.1016/j.flowmeasinst.2016.03.002
Keywords: boiling two-phase flow, narrow channel, void fraction measurement, deep learning, convolutional neural network
Citation: Chu W, Liu Y, Pan L, Zhu H and Yang X (2021) Study on Measure Approach of Void Fraction in Narrow Channel Based on Fully Convolutional Neural Network. Front. Energy Res. 9:636813. doi: 10.3389/fenrg.2021.636813
Received: 02 December 2020; Accepted: 04 January 2021;
Published: 29 January 2021.
Edited by:
Xingang Zhao, Massachusetts Institute of Technology, United StatesReviewed by:
Guanyi Wang, Argonne National Laboratory (DOE), United StatesSichao Tan, Harbin Engineering University, China
Copyright © 2021 Chu, Liu, Pan, Zhu and Yang. This is an open-access article distributed under the terms of the Creative Commons Attribution License (CC BY). The use, distribution or reproduction in other forums is permitted, provided the original author(s) and the copyright owner(s) are credited and that the original publication in this journal is cited, in accordance with accepted academic practice. No use, distribution or reproduction is permitted which does not comply with these terms.
*Correspondence: Xingtuan Yang, eWFuZ3h0QHRzaW5naHVhLmVkdS5jbg==