 Andrea Monforti Ferrario1,2
 Francesca Santoni1
 Massimiliano Della Pietra1*
 Mosè Rossi2Nicola Piacente2Gabriele Comodi2
 Luca Simonetti1
- 1Laboratory of Energy Storage, Battery and Hydrogen Technologies, Department of Energy Technologies and Renewable Sources, ENEA C.R. Casaccia, Rome, Italy
- 2Department of Industrial Engineering and Mathematical Sciences, Marche Polytechnic University, Ancona, Italy
Technologies capable of efficiently exploiting unavoidable CO2 streams, have to be deeply investigated and deployed during the transition phase to achieve long-term climate neutrality targets. Among the technologies, Molten Carbonate Cells (MCC) Operating in Electrolysis Mode (MCEC) represents a promising facility to valorize CO2-rich waste streams, which are typically available in industrial plants, by their conversion into a high-value H2/CO syngas. These gaseous products can be reintegrated in a plant or reused in different applications. This study analyzes the integration of a system of the MCEC unit under different operating conditions in terms of composition, current density, and the utilization of fuels in a steam-reforming process of an Italian oil refinery via a mixed experimental-simulative approach. The aim of the current study is to assess the improvement in the overall product yield and further impacts of the MCEC unit on the plant efficiency. The results have shown that it is possible to obtain an electrochemical Specific Energy Consumption for the production of H2 of 3.24 kWh/ using the MCEC, whereby the possible integration of a 1-MWe module with a reformer of the proposed plant not only increases the hydrogen yield but also decreases the amount of fuel needed to assist the reforming reaction and separates a CO2 stream after additional purification via an oxy-fuel combustor, consequently determining lower greenhouse gases emissions.
Introduction
To achieve long-term climate neutrality targets by 2050 as imposed by the EU (European Commission, 2018), transition technologies, which have the capability of efficiently exploiting unavoidable CO2 streams in synergy with renewable energy sources (RES), must be further investigated and deployed in the global energy sector. In such a context, hydrogen is an energy vector that can effectively contribute to the energy transition due to its wide applicability, both in terms of sector and scale (Noussan et al., 2020). Electrochemical systems can connect gas and electricity networks, which provide an opportunity to integrate clean technologies into industrial processes and to reduce their environmental impacts. Sector coupling of key hard-to-abate, non-electrified sectors such as the oil refining industry is a crucial step to carry on the transition toward fully zero-emission technologies (International Energy Agency, 2019), as identified by the main hydrogen strategies and roadmaps (FCH-JU FC HJU, 2019).
Chemical industries, in particular refineries and petrochemical plants, are nowadays among the biggest consumers of hydrogen and account for 38 MtonH2/year (International Energy Agency, 2019). Hydrogen is used in several refining processes, such as hydrotreating and hydrocracking of heavy products (Baharudin and Watson, 2017), with the aim of obtaining higher quality fuels and lower emission potential. The current hydrogen demand for use in refinery has already exceeded the platformer production capacity (KLM Technology Group, 2017), and, therefore, most refineries present an integrated steam-reforming section in the plant scheme. In future, the demand of hydrogen is expected to increase further due to a combined effect of (1) EU Emission Trading System-related penalties, (2) stricter fuel quality regulations, and/or (3) lower crude oil quality (Lukach et al., 2015). Such additional hydrogen must be provided by other sources, for example, from the gasification of oil refining residues and the recovery from refinery off-gases, by improving the efficiency/yield of a steam-reforming process and/or by electrolysis (Fahim et al., 2010). Due to the limited fossil fuel sources and environmental considerations, there is a growing interest for in situ electrolysis technology. Moreover, electrolysis systems produce oxygen (OE) as a by-product, which can be useful to the plant as well.
Electrolyzers can be classified according to the operating temperature, among other operating parameters (Wang et al., 2019). Low-temperature electrolyzers, named as “water electrolyzers,” are based on Polymer Electrolyte Membrane (PEM) and alkaline technologies, being the most widespread electrolysis system (Schalenbach et al., 2018). Whereas, high-temperature electrolyzers, named as “steam electrolyzers,” are represented by Solid Oxide Electrolysis Cells (SOECs) and Molten Carbonate Electrolysis Cells (MCECs) (Mcphail et al., 2010). An increment in the electrolysis temperature is of great interest due to the two main reasons. Firstly, high-temperature technologies are usually less energy intensive than the low-temperature ones (Tao et al., 2009; Hu, 2016). Indeed, with a rise in temperature, a part of the electrical energy needed to decompose the water molecule can be replaced by the heat. Secondly, they are able to process hydrocarbon fuels without significant degradation issues due to their internal fuel processing capability, enhanced by higher operating temperatures and catalyst presence (Cigolotti et al., 2008; Di Giulio et al., 2012). High-efficiency upgrading of hydrocarbon streams can lead to the production of hydrogen at very electrical low specific consumption [around 3–4 kWh/Nm3 (International Energy Agency, 2019; Barelli et al., 2020)], especially if waste heat is available as it may occur in industrial plants (although high-grade waste heat is seldom available) (Laurencin and Mougin, 2015). The MCEC, as well as other high-temperature electrolyzers, can operate in the reverse mode [Molten Carbonate Fuel Cell (MCFC) mode] to generate electricity (Hu et al., 2014; Mcphail et al., 2015). Unlike other electrochemical technologies, Molten Carbonate Cells (MCC) have a unique operating capability like an integrated CO2 concentrator: in fact, the electrochemical reactions that take place within the MCFC (but also in the MCEC) involve the migration of ions and the concentration of the CO2 from one electrode to the other electrode. All in all, the MCEC represents a promising option to enrich CO2-rich waste streams typically available in industrial environments, by efficiently converting them at the Fuel Electrode (FE) into higher value syngas products, which can be reintegrated in the plant environment or reused elsewhere for different end-use applications. Simultaneously, the MCEC separates the CO2 from the off-gas and concentrates it at the OE where it is easy to capture.
So far, the MCEC literature is not extensive even though the number of papers concerning this technology has increased in the last few years, which are mostly focused on lab-scale experiments using button cells (Hu et al., 2014, 2016), planar single cells (Perez-Trujillo et al., 2018), and numerical models (Perez-Trujillo et al., 2018; Pérez-Trujillo et al., 2020; Barelli et al., 2020). Several studies analyze the integration of the MCC in the FC mode (MCFC) at the system level, especially as bottoming systems for biomass and gas turbine plants (Spinelli et al., 2014; Rinaldi et al., 2015; Roshandel et al., 2015) and as CO2 removers where flue gas is fed to the OE, and then separated at the FE outlet under different operating conditions (Desideri et al., 2011, 2012), but also coupled with other technologies such as calcium looping (Della Pietra et al., 2018; De Silvestri et al., 2021). A limited number of studies (Barelli et al., 2020) have been carried out in terms of system integration analyses of MCC in the electrolysis mode (MCEC).
This study analyzes the system integration of an MCEC system in an existing Italian oil refinery plant as a novel concept for the recovery of an off-gas and the capture of CO2 in a steam-reforming process via a mixed experimental-simulative approach, focusing on the upgrading of CO2-rich off-gas streams within the plant layout. An integrated system including the MCEC unit is compared with respect to the existing one in terms of performance indicators, such as the hydrogen yield, thermal and electrical energy balance of the plant, and capture potential of CO2.
The paper is organized as follows. Section Introduction provides a brief overview of the analyzed processes, namely Steam Methane Reforming (SMR) and Molten Carbonate Electrolysis (MCE). Section Materials and methods discusses about the case study and presents a proposed mixed experimental-simulative approach. In section Results and Discussion, the results are presented and discussed (sections Experimental Campaign Results and System Integration Analysis Results). In section Conclusions, the conclusions are drawn.
SMR—Process Overview
Steam reforming is based on the catalytic reaction between steam and hydrocarbons, mainly methane (CH4), which leads to the formation of hydrogen (H2) (Angeli et al., 2014), as described in Equation (1):
The chemical reaction described in Equation (1) is strongly endothermic (ΔHr = 206 kJ/mol), thus requiring significant amount of heat at high temperature (800–850°C) for the reaction to take place. Although the conversion would be favored by lower pressures, steam reformers are normally designed to operate at medium pressure (15–30 bars) due to various constraints related to the size of plant equipment, pressure drops, etc. Under such operating conditions, the CH4 conversion rate is almost complete and the percentage of unconverted CH4 in the process output stream is low (Simpson and Lutz, 2007).
In addition to H2, carbon monoxide (CO) is also produced in a steam-reforming reaction and it subsequently reacts with the water vapor (H2O) in a water shift converter for further increasing the production of H2, as reported in Equation (2). Compared to the reaction in Equation (1), this last one is slightly exothermic (ΔHr = −41 kJ/mol) and releases heat: for this reason, it is carried out at lower temperature (200–300°C) in a different reactor with different catalysts.
MCEC—Process Overview
MCECs are based on the proven and already commercially introduced MCFC technology, where units of up to 3.7 MW are currently sold in the market and several power plants of 10–60 MW are already installed worldwide (McPhail et al., 2008). The difference between the MCEC and MCFC is the direction of the redox reaction, since the operating principle of the electrolyzer is the inverse of the fuel cell one (Hu, 2016). Figure 1 schematizes the reactions occurring inside an MCEC (A) and an MCFC (B), respectively.
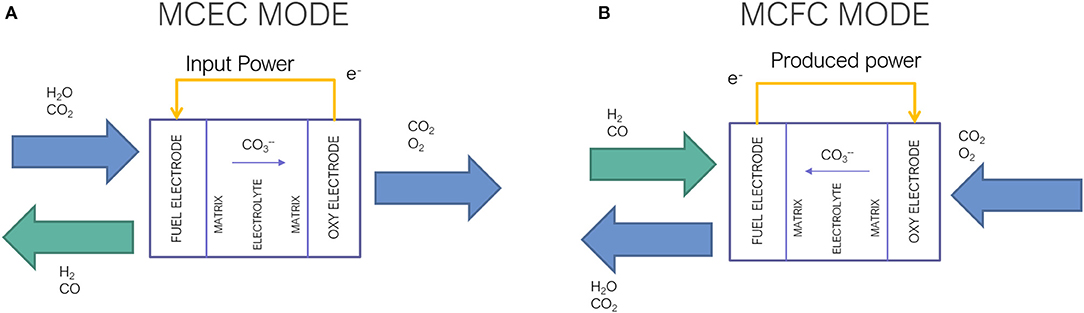
Figure 1. Scheme of the two operation modes of a Molten Carbonate Cells (MCC): (A) MCC in the electrolysis (MCEC) mode and (B) MCC in the FC (MCFC) mode.
Regarding the MCEC, its components are assembled with the materials same as those used for the MCFC, where the FE is made of porous nickel and alloyed with Cr and/or Al, the OE is made of porous lithiated nickel oxide (NiO). The electrolyte consists of a eutectic mixture of lithium, potassium, and/or sodium carbonate (Li2CO3, K2CO3, and Na2CO3), which remains liquid at the operating temperature (650°C). A porous matrix, commonly made of γ-LiAlO2, is used to retain the electrolyte, besides conducting the carbonate ions between the electrodes as well as separating the fuel and oxidant gases (Küngas, 2020).
Water, carbon dioxide, and electricity are required to perform the reduction reaction in the FE, which produces H2 and carbonate ions (), as expressed in Equation (3):
Carbonate ions are conducted through the electrolyte to be oxidized at the OE, producing carbon dioxide and OE, as reported in Equation (4). No flow is strictly required at the OE inlet; nevertheless, at laboratory scale, some flowing gas generally air mixed with a little amount of carbon dioxide is supplied to sweep out the formed gases in addition to avoiding the degradation of the electrode.
Thus, the global reaction is expressed in Equation (5):
The remaining two reactions can occur at the FE, both leading to the production of carbon monoxide: the electrochemical reduction of CO2 into CO and the reverse water-gas shift (RWGS) reaction as reported in Equations (6) and (7), respectively.
The chemical production of CO through the RWGS is expected due to both the operating temperature and availability of the Ni catalyst in the FE, while the electroreduction of CO2 is not expected to take place (Pérez-Trujillo et al., 2020). The ratio between the electrochemical and chemical production of CO has been analyzed under different experimental conditions by Meskine et al. (2020). They coupled thermodynamic calculations and gas chromatography online detection of the gases. Their results proved that the electrochemical production of CO depends on the operating current density, but it is generally low with respect to the chemical production.
High operating temperature and the presence of Ni catalyst at the side of the FE allow to use a variety of fuels, such as methane or other higher hydrocarbons derived from natural gas and biomass (Cigolotti et al., 2008). When these compounds are present in the fuel mixture, CH4 can be converted to hydrogen via steam reforming (Equation 1). Through the Water–Gas Shift (WGS) reaction (Equation 2), additional hydrogen can be obtained by treating the steam-reforming-generated carbon monoxide with water.
Materials and Methods
Case Study: Oil Refinery in Italy
The integration of a MCC system in an existing oil refinery plant located in Italy already described in the previous studies (Comodi et al., 2016; Rossi et al., 2020) is assessed. The refinery capacity is about 3.9 Mt of crude oil per year (85,000 barrels per day) for the production of propane, gasoline, kerosene, and diesel. The refinery makes use of hydrogen and integrates the two SMR units. The analyzed unit presents a rated capacity of around 10,000 Nm3/h of H2, obtained through the SMR by using nearly 2,500 Nm3/h of natural gas. A detailed description of the SMR plant and the integration of the MCEC unit is presented. All the reported operational data, in terms of temperature, flow rate, and composition, have been obtained by on field measurements and batch ex situ gas sampling according to DIN-51666/UNI EN15984 norms.
Off-Gas Recovery with an MCEC System: Ex Ante and Integrated Scenario
Figure 2 shows a simplified Process Flow Diagram (PFD) of the ex ante steam-reforming process described here. In particular, both flow rates and temperatures of the streams at different sections of the overall chemical process are listed in the table included in the PFD.
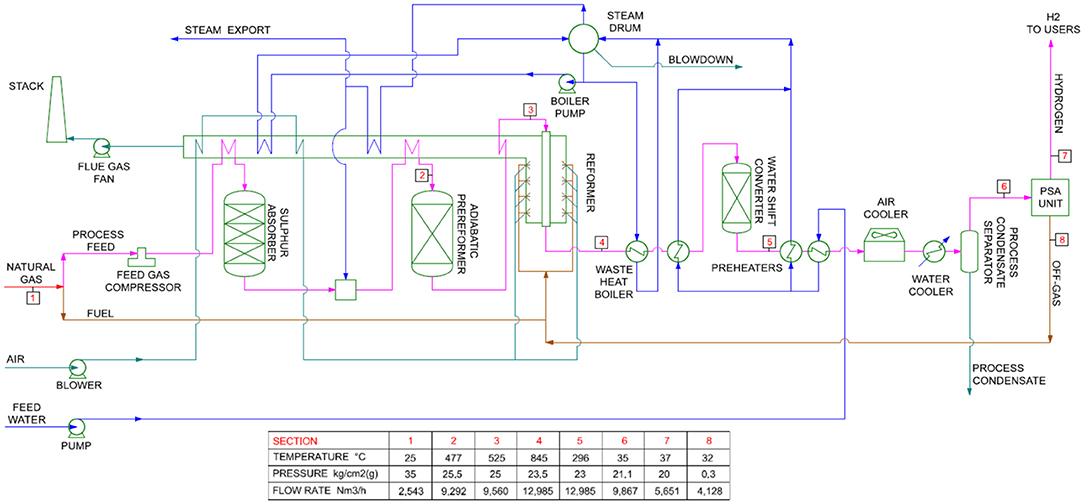
Figure 2. Process flow diagram (PFD) of a steam-reforming process—ex ante—within the oil refinery plant.
Before processing the natural gas feed [stream 1, national natural gas network quality, i.e., >99.5 mol% CH4, low heating value (LHV) of around 10–11 kWh/Nm3 (SNAM RETE GAS, 2016)] in a main steam reformer (stream 3), a pre-treatment is required to transform any sulfur compounds into hydrogen sulfide (H2S), then hydrogen sulfide needs to be removed in a sulfur absorber reactor since it pollutes the reforming catalysts. The treated stream, after being desulfurized and mixed with steam, undergoes a steam-reforming process, which is carried out in two phases. The first one (stream 2) is performed in an adiabatic pre-reformer (500–550°C) up to a H2 content of around 20 mol%, which has the aim to further protect the catalysts of a main reformer and activate the preliminary reactions of hydrocracking and hydrogenation of hydrocarbons heavier than methane. The second one (stream 3), up to a H2 content of around 70 mol%, occurs in a main reformer, which is composed of tubular reactors inside a furnace allowing the process gas to achieve the high temperature required by a steam-reforming process (800–850°C). The gas exiting the main reformer (stream 4) is cooled down to around 300°C via a heat recovery steam generator and sent to the WGS converter to further convert the remaining CO into CO2 and increase the H2 yield in the gas (up to 75 mol%), as described in Equation (2). As previously discussed in section Introduction, the output flow rate (stream 6, 9,841 Nm3/h) is approximately four times the inlet natural gas flow rate (stream 1, 2,537 Nm3/h) as a consequence of the stoichiometry of the reforming and shift reactions. Table 1 reports the ex ante process stream characteristics in terms of temperature, flow rate, and characteristics, following the evolution of the process flow in the plant according to the PFD displayed in Figure 2 (composition and volumetric flow rate trend plots of the evolving process flow can be found in Appendix 1).
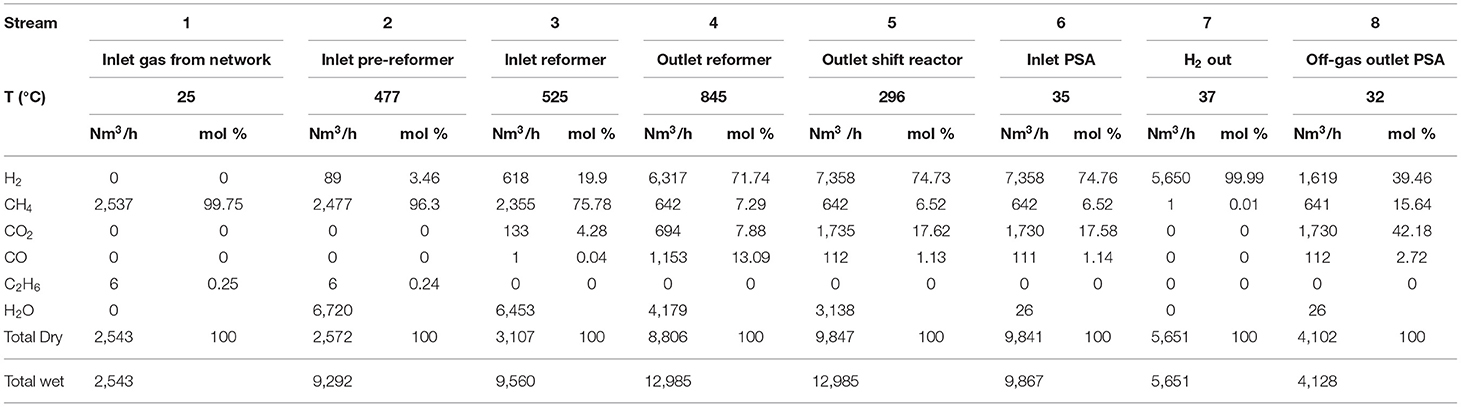
Table 1. Ex ante stream characteristics: in terms of temperature (°C), flow rate (Nm3/h), and composition (mol%).
The final product (stream 6) is mainly composed of H2, ~17.5 mol% of CO2, and, to a lesser extent, 6.5 mol% of CH4 and 1 mol% of CO that have to be removed. For this reason, a physical Pressure Swing Absorber (PSA) separation system is used. The stream is cooled, by heat recovery steam generators and air/liquid cooling systems in series, down to the operating temperature of the PSA around 35°C. In such a system where molecular sieves are used, the “impurities” in the stream gas are firstly adsorbed at high pressure and then desorbed at low pressure. Alternate cycles of adsorption and desorption in multiple PSA units, which operate in parallel, allow the system to obtain a volumetric separation efficiency of 77% for 99.99 mol% grade H2 as defined in Equation (8).
In the PSA outlet (stream 7), 5,651 Nm3/h of pure H2 with negligible amount of CH4 (<0.01 mol%) is obtained. The H2 stream is sent to the distribution pipelines and subsequently to the hydrodesulphurization unit. The off-gas (4,102 Nm3/h) exiting the PSA (stream 8, 39.46 mol% H2; 15.64 mol% CH4; 42.18 mol% CO2; and 2.72 mol% CO) is sent to the main reformer combustion chamber to provide the required heat to sustain the reforming process. Considering the LHV (≈14.3 MJ/kg obtained with ex situ gas sampling, i.e., ≈3.22 kWh/Nm3) and flow rate (4,102 Nm3/h) of the off-gas, the thermal power supplied to the reformer furnace is around 13.2 MWth, which is enough to meet the thermal requirement of the reforming reaction in relationship to the reformed CH4 amount. It is worth noticing that no auxiliary fuel coming from the national natural gas pipeline is required in steady state operating conditions, although the piping connection is available for start-up procedures. The combustion is performed with preheated air, under a 10% excess ratio with respect to stoichiometry, obtaining a typical combustion flue gas composed of CO2 (2,547 Nm3/h) and H2O (3,210 Nm3/h) diluted in air, which is treated and vented to the atmosphere. Saturated steam at liquid/gas equilibrium is available in the steam drum at 258°C and 45 bars obtained by internal heat recovery. Steam for process and export (as indicated in Figures 2, 3) is superheated up to the required temperature by heat exchange with the reformer flue gases with negligible pressure drops. Around 6,720 Nm3/h of superheated steam is mixed with stream 2 at an inlet of the pre-reformer to obtain suitable conditions for the reforming and shift reaction processes. Water (in the form of condensate and liquid fraction) streams in the plant are circulated to a heat exchanger inside the main reactor furnace to reach saturated conditions and to be reintegrated in the steam drum without significant temperature drops.
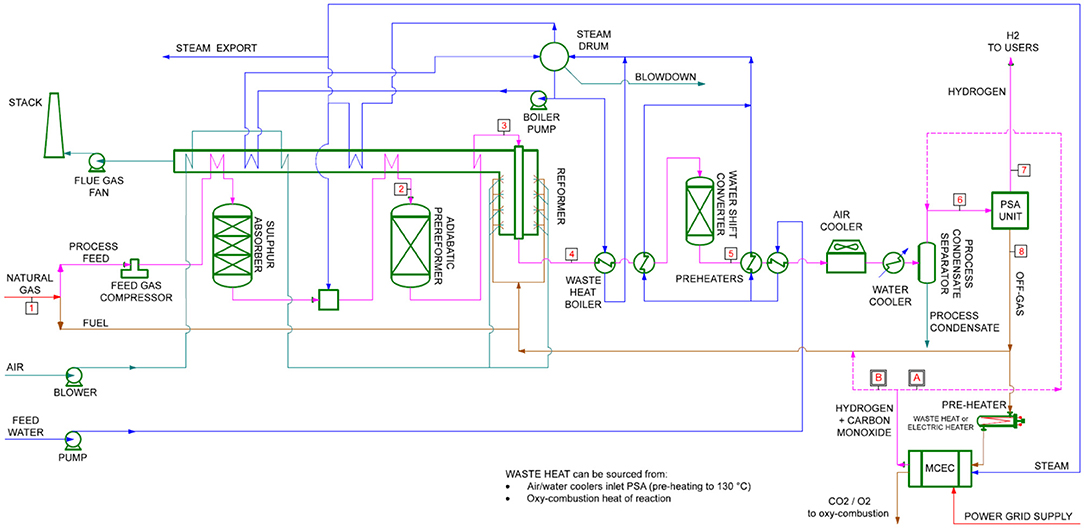
Figure 3. PFD of a steam-reforming process—integrated with the MCEC—within an oil refinery plant.
The MCEC operates on the PSA off-gas (stream 8), which is rich in CO2. A portion r of said off-gas is sent to the FE, integrated with additional steam with an equimolar H2O:CO2 ratio, according to the global electrolysis cell reaction (Equation 5). The additional steam is sourced internally from the excess available steam export stream, while the reheating of the off-gas to the operating temperature of the MCEC (650°C) is obtained either by exploiting available heat sources or through a dedicated electric heater. The off-gas ex situ detailed sampling shows that, other than the main gases (H2, CH4, CO2, and CO), the off-gas is composed of <2 mol% of light hydrocarbons (ethane, propane, butane, and pentane) and <0.002 mol% of hydrocarbons heavier than hexane, all of them compatible with the MCEC technology thanks to its internal reforming capacity. As described in section Introduction, there is no strict requirement for the gas feed at the OE. Theoretically, a CO2-concentrated gas mixture (66/34% CO2/O2) is obtained at the electrode outlet according to Equation (5) and subsequently evolved through a stoichiometric oxy-combustion reactor with a slipstream of natural gas from the gas grid in order to further increase the CO2 concentration and eventually obtain 100% CO2 content after water knockout via condensation from the flue gas. In fact, oxy-fuel combustion is a typical thermal CO2-capture technology used in industrial environments, which does not imply substantial changes in the plant scheme (Plaza et al., 2020).
The role of the MCEC can be two-fold: (A) increasing the H2 yield of the whole system by producing an additional quantity of H2 obtained by recirculation to the PSA; (B) reducing the off-gas flow rate to the combustor by improving the LHV since H2 and CO replace CO2. As a side effect, the integration of the MCEC unit can also provide further benefits such as: (C) concentrating CO2 at the outlet of the OE after further separation via oxy-fuel combustion; (D) improving the plant thermal management. On the downside, the MCEC increases the electricity demand that, in this case, is considered to be supplied by the national power grid.
In order to have a better overview of the two previous operating modes, Figure 3 shows the same steam-reforming process displayed in Figure 2 with the addition of the MCEC. Stream properties successive to stream 6 will be analyzed and discussed in detail in section Results and Discussion, being function of the MCEC size and operating conditions.
Experimental Setup and Campaign
A set of experiments described in this paper were carried out at the High-Temperature Fuel Cell Operating and Testing Laboratory of the Italian National Agency for New Technologies, Energy and Sustainable Economic Development (ENEA) in Rome, Italy, by using a single repeating unit button cell test bench (3 cm2) with an open configuration as shown in Figure 4 (Della Pietra et al., 2016; De Silvestri et al., 2021).
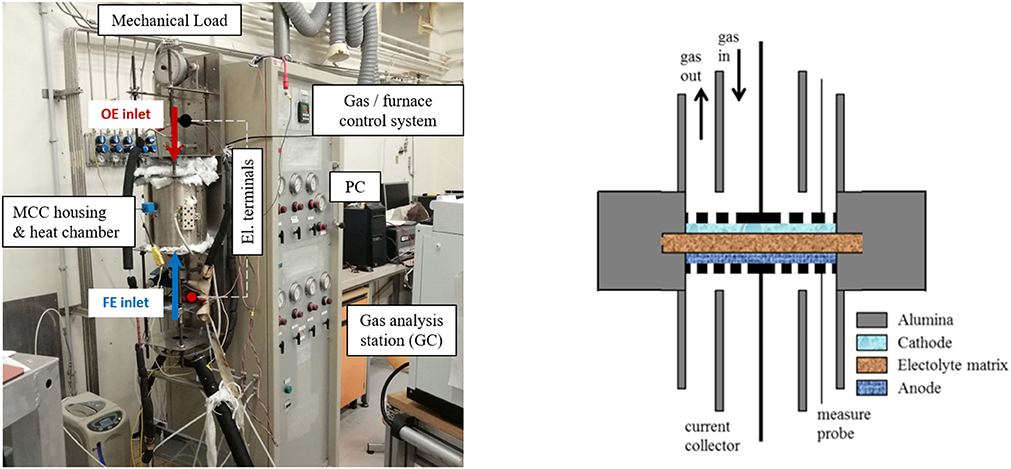
Figure 4. Open configuration test bench for button cells (Della Pietra et al., 2016).
After performing the start-up, reduction, and stabilization in the fuel cell mode (De Silvestri et al., 2021), a total of six cases in the MCEC mode were tested with three OE electrode compositions for two FE flow rates at 650°C. For each tested composition, IV curves (for both the MCFC and MCEC modes) and gas analysis were performed. The compositional analysis was carried out in the open circuit voltage (OCV) condition and under the two different values of current density in the MCEC mode: 100 and 200 mA/cm2.
The test bench is equipped with gas flow meters (EL-FLOW Series-Model: F-201CV) to regulate all the inlet gases except water supplied to the mixture by using a liquid flow (Model: L23) controller and a controlled evaporator mixer (CEM) produced by Bronkhorst. The hydrogen is fed by an on-site DBS NMH2 1,000 electrolyzer. The temperature of the anodic inlet pipeline is controlled through line heaters from the water injection point up to the furnace entry, in order to prevent water condensation inside the inlet pipes and preheat the gas mixture. The cell temperature was maintained at 650°C during the overall experimental campaign and monitored by using a thermocouple located inside the housing. The LabView custom-made software was used to control and monitor all the signals. To characterize the electrochemical performance, a BK precision 9200 DC power supply and a BK precision 8100 DC electronic load were used in the galvanostatic mode, allowing to obtain polarization curve both in the fuel cell and electrolysis mode. Voltage from separate terminals was measured by using a Hewlett-Packard 3478A high precision Multimeter. A Gas Chromatographer (Clarus 680 GC-Perkin Elmer) was used for gas analysis, picking up the gas through a 1/16″ sampling line located inside the FE outlet. The GC was equipped with a specific column for the compounds studied (Hayesep Q and Molecular Sieve5A) and a thermal conductivity detector for their detection.
Materials for the assembly of 3 cm2 button cells were provided by KIST Fuel Cell Research Centre Laboratories in Seoul (South Korea) and are summarized in Table 2. The electrodes of the cell consist of Ni alloy electrode and lithiated NiO electrode corresponding to FE and OE electrode, respectively. The electrolyte was a eutectic mixture of 62/38 mol% Li2CO3/K2CO3. A porous LiAlO2 matrix is used to contain the electrolyte and support the cell. Electrolyte and matrix layers were assembled between the two electrodes and sandwiched between the two current collectors as shown in Figure 4.
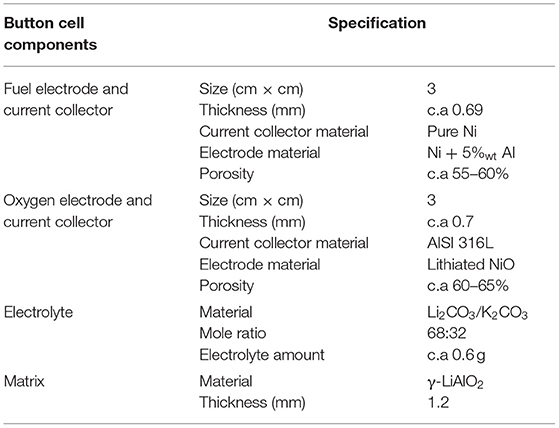
Table 2. Button cell specification.
The experimental campaign is shown in Tables 3, 4. The used composition is based on the composition of the off-gas (Table 1) at the outlet of the PSA obtained from the on-field data, integrated with the additional steam to achieve an equimolar H2O:CO2 ratio as described in section Case Study: Oil Refinery in Italy. Two different FE total flow rates (150 and 100 ml/min) are used and indicated as Test Cases 1 and 2, which represent typical operating conditions for button cell testing (Rexed, 2014). The total specific flow rates for the selected FE correspond to 3 and 2 NL/(h cm2). For each case, three different OE compositions were investigated for a fixed total flow rate of 200 ml/min denominated as follows: (1) standard (CO2/O2/N2 30/15/55%), (2) enriched (CO2/O2/N2 66/34/0%), and (3) diluted (CO2/O2/N2 15/7.5/55%). The standard condition is a N2 swept version of the theoretical produced gas at the OE typically used in laboratory tests for the previously mentioned reasons. An enrichment of CO2 at the OE is typically beneficial in the MCFC mode since it increases the reagent CO2 to be dissociated into ions at the OE interface (Discepoli et al., 2012). In this work, the effects of an enriched/diluted cathode composition are investigated in both the MCFC and MCEC mode.
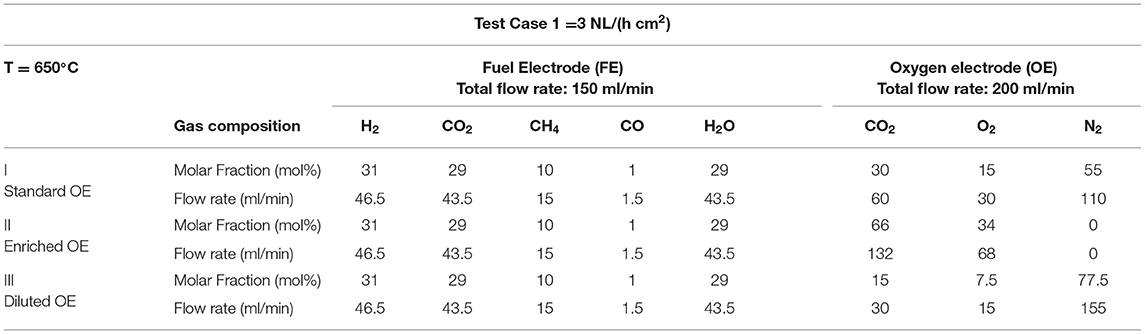
Table 3. Test Case 1 input compositions [fuel electrode (FE) flow rate: 150 ml/min; 3 NL/(h cm2)].
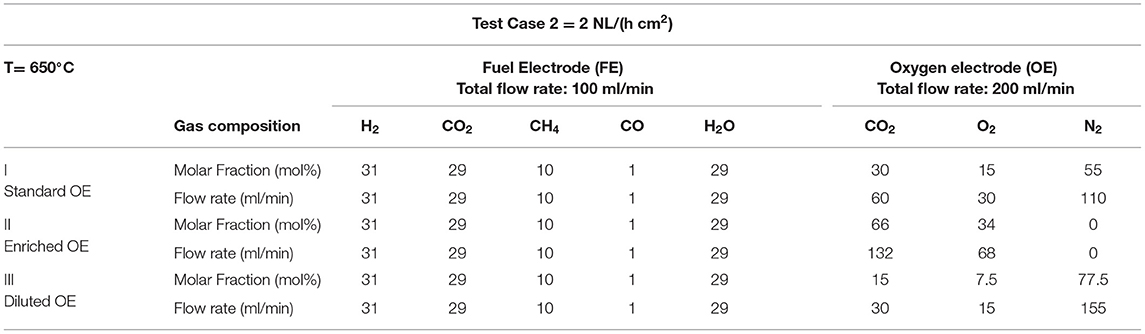
Table 4. Test Case 2 input compositions [FE flow rate: 100 ml/min; 2 NL/(h cm2)].
The theoretical electrochemical fuel Utilization Factor (UFf,e) is given by the ratio between the reactant reaction rate, solely the function of the current load (A) as defined by the Faraday Law, and the reactants in the inlet fuel, as shown in Equation (9). However, due to the concurrent reactions other than the electrochemical ones, the MCEC total fuel conversion is also affected by the chemical conversion (SMR, WGS, and RWGS reactions). The total fuel Utilization Factor (UFf,tot, calculated upon both CO2 and H2O) is obtained from the gas chromatography analysis, as shown in Equation (10), and accounts for both the electrochemical and chemical conversion. Therefore, the chemical Fuel Utilization (UFf,ch) will be equal to the difference between the total UFf,tot and the electrochemical reaction rate UFf,e, Equation (11).
Integrated System Modeling
Integrated system modeling is based on concatenated blocks based on each component, defining the input/output stream properties according to internal process operating conditions (steady state or off-design). By introducing a new component in a process, changing the operating scheme, or by changing the operating conditions of certain components, some stream properties are modified, which affect all downstream components. Ultimately, the overall system performance is affected (Barelli et al., 2020; Moradi et al., 2020).
In the present case, the effects of the integration of the MCEC unit in the previously described plant are illustrated in Figure 5. The MCEC unit processes a portion r of the off-gas stream (stream 8), which is preheated to 650°C by waste heat recovery (from a part of the air/water cooler heat duty or from the oxy-combustion reactor) or by an electric heater. Such an off-gas flow is integrated with an equimolar superheated steam quantity with respect to the inlet CO2 flow rate. The MCEC enriches the processed gas mixture in H2 and CO obtaining a higher LHV value. In this way, considering an equal heat duty to the main reformer furnace (13.2 MWth), a lesser amount of off-gas is required in the combustion process. Consequently, some H2-enriched off-gases can be recirculated according to the PSA inlet (according to the recirculation ratio k) to increase the yield of H2.
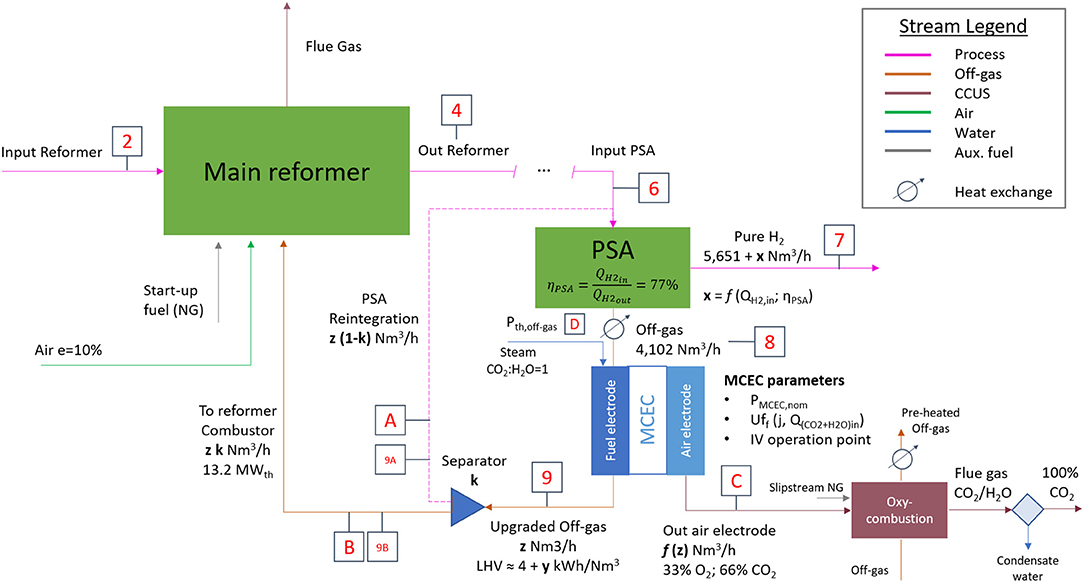
Figure 5. Integrated system scheme and effects of the MCEC unit on the plant scheme.
A preliminary sizing of the nominal MCEC power (kW) and stack size (m2) can be done as a function of the processed off-gas portion r at different total fuel Utilization Factor (UFf,tot) rates, considering the nominal design conditions in terms of the IV operating condition point (mA/cm2; V/cell; and W/cm2) and FE reactant-specific inlet flow rate [NL/(h cm2)] obtained from a literature study (Barelli et al., 2020). Considering that a single cell typical surface is equal to around 1 m2, the number of repeating unit cells can be calculated. The design specification parameters of the MCEC system are reported in Table 5.
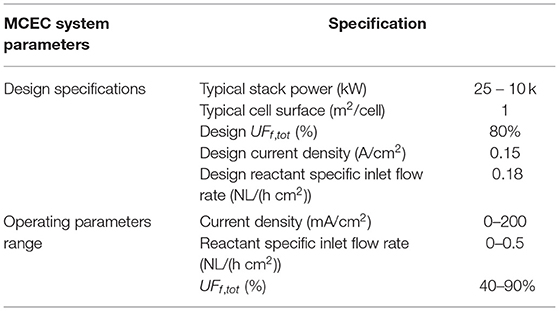
Table 5. Sizing Molten Carbonate Electrolysis Cell (MCEC) system parameters (Barelli et al., 2020).
Once the MCEC sizing has been fixed, the MCEC performances (reactant reaction rate, H2 production) in design and off-design operating conditions as a function of current density (A/cm2) and reactants specific inlet flow rate [NL/(h cm2)] have been assessed considering both the electrochemical and chemical conversion pathways. The operating envelope of the MCEC system parameters are reported in Table 5. The electrochemical conversion is obtained by applying the Faraday Law as a function of the operating current (Equation 9), which is obtained from the IV performance curves scaled to a stack level. According to the stoichiometry of the electrochemical MCEC reactions, also the flow rate and composition at the outlet of the OE can be defined, considering a null inlet flow rate at the OE. The chemical conversion is assessed by an interpolation of the experimental data as a function of the UFf,tot and reactants specific inlet flow rate [NL/(h cm2)] in order to calibrate the reaction rate, output gas flow, and composition.
The CO2 separation efficiency at the OE is assessed via the Specific Primary Energy Consumption per unit of CO2 Avoided (SPECCA) index (MJLHV/kgCO2, avoided), as defined in Equation (12) (Gatti et al., 2020), where η is the energy efficiency of the SMR plant—in the ex ante and with the MCEC scenarios—defined as energy output (chemical energy obtained in the form of pure hydrogen) by energy input (chemical energy in the form of natural gas plus all additional external energy streams involved in the process); E (kgCO2/MJuseful) corresponds to the specific emissions per unit of useful energy output (chemical energy obtained in the form of pure hydrogen) in the ex ante and with the MCEC scenarios. The term Ew/MCEC considers only emission avoidance related to the CO2 amount separated downstream the oxy-fuel combustion reactions, without considering effects on the reformer flue gas for improved combustion. All electrical contributions are affected (1) in terms of energy by an average Primary Energy Factor (PEF—kWhPE/kWhe), which for the Italian national electricity mix is in the average around 1.9–2 (Noussan et al., 2018) and (2) in terms of emission by the average grid electricity Emission Factor (EF—kgCO2,eq/kWhe), which is currently around 0.25 kgCO2,eq/kWhe for the EU-zone (ISPRA, 2018). Further details regarding the calculation of the SPECCA index can be found in Appendix 2, including a sensitivity analysis on the SPECCA index considering the forecasted values for the PEF and EF up to 2040 (International Energy Agency, 2015; Terna-Snam, 2019).
The upgraded off-gas recirculation ratio k is defined in Equation (13). Said ratio k is calibrated in order to provide a suitable off-gas flow to always satisfy the thermal load of the reformer combustor as a function of the variation of the LHV of the off-gas (which is constant since the inlet CH4 flow rate is constant). The complement k − 1 ratio of the upgraded off-gas is reintegrated at the inlet of the PSA (stream 6) assuming an ideal gas mixing, which modifies the hydrogen yield assuming a fixed PSA separation efficiency (Equation 8).
The thermal and electrical energy consumption for off-gas preheating is assessed under two scenarios: (1) a best-case scenario where a full heat integration is foreseen at the plant level and (2) a worse-case scenario where the off-gas is fully heated via an electrical heater. The composition of the off-gas is assumed to remain constant in the preheating phase in both the scenarios.
In the integrated heat management scenario, the amount of heat required to increase the temperature of the off-gas stream fed to the FE is partially sourced from the heat duty of the air/liquid cooling systems of the process gas upstream the PSA (heat duty from 32°C to around 130°C, according to the plant data). The avoided electrical energy consumption is calculated from the required thermal power of the gas mixture whose thermodynamic properties are calculated at the average heat exchange temperature considering the typical Energy Efficiency Ratio (EER—BTU/We) values for the air/liquid cooling units of similar scale equal to 10 BTU/We and 21 BTU/We, respectively (U.S. Department of Energy, 2016), as expressed in Equation (14).
The remaining preheating energy is obtained with an indirect heat exchange with the flue gas of the oxy-combustion unit for CO2 purification. Oxy-combustion flue gas heat potential is assessed by considering a combustion efficiency of 90% with respect to the LHVNG and assuming a fully developed combustion. The actual heat provided to the off-gas is calculated by assuming a precautionary heat transfer efficiency for an indirect heat exchanger of 70% (Moradi et al., 2020; Heat Exchanger World, 2021).
As an alternative, the off-gas preheating is obtained in consideration of electrical heating: after calculating the heat duty required to increase the temperature of the off-gas mixture—whose thermodynamic properties are calculated at the average heat exchange temperature—from 32 to 650°C, the electrical power is calculated by assuming a precautionary heat transfer efficiency of 70% (Moradi et al., 2020; Heat Exchanger World, 2021).
Results and Discussion
Experimental Campaign Results
The polarization and power curves obtained in the experimental work are shown in Figure 6. For all the plotted polarization curves, the positive current density refers to the fuel cell (MCFC) mode, while the negative current density refers to the electrolysis (MCEC) mode. In particular Figure 6A shows a comparison between the IV curves obtained for the Test Case 1 and the Test Case 2, while in Figure 6B the power density (mW/cm2) as a function of the current density is shown.
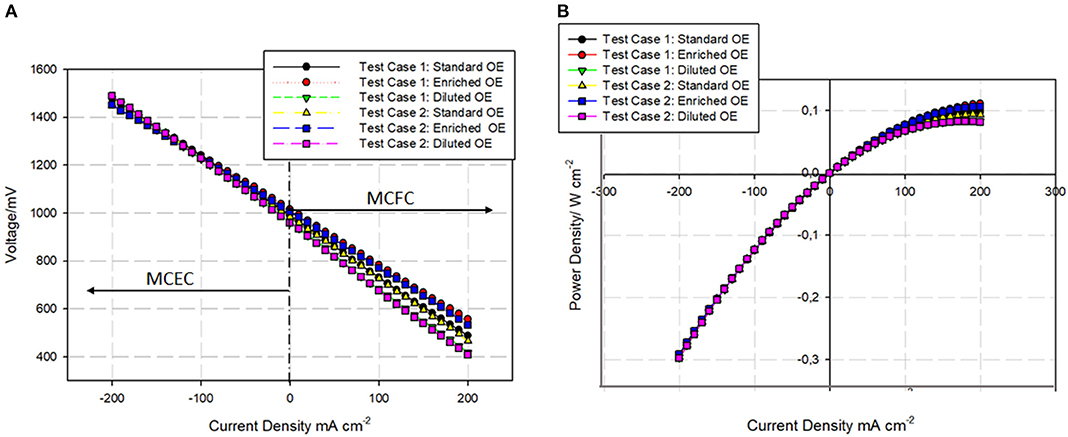
Figure 6. Polarization (A) and power curves (B) for the cell in the MCFC and MCEC modes, operating at 650°C.
As shown in Figure 6A, no relevant effects in the IV curve were observed by reducing the total inlet flow rate of the FE in the MCEC mode, while in the fuel cell mode the curves obtained with higher fuel FE flow rate (Test Case 1) showed slightly better performances. This is due to a greater quantity of reactants (H2) available for the electrochemical reaction contained in a higher FE inlet flow rate, decreasing the concentration losses occurring at high current density values. The same behavior can be observed in the power trend where the curves obtained for Test Case1 and Test Case 2 in the MCEC mode overlap, while in the MCFC mode there is a slight improvement in the curves obtained with a higher FE flow rate for the aforementioned reasons. In particular, voltage curves show an almost linear relationship with respect to current density, with low activation losses, which is a common aspect for MCC (U.S. Department of Energy, 2004). Consequently, the trend of power density is almost quadratic with respect to current density.
Figure 7 focuses on the performance obtained using different OE compositions in Test Case 1. The IV trends obtained in the Test Case 2 were almost identical to those obtained in Test Case 1, for this reason the IV curve at different OE compositions is shown only for one test case for the sake of brevity. In Figure 7, it is possible to notice that the performance in the MCEC mode remains almost the same, confirming that the OE gases do not participate in the electrochemical reaction in the cell, but are supplied only to sweep out the formed gases in addition to avoiding the degradation of the electrode. In the fuel cell mode, the situation is different, in fact the electroreduction reaction occurs at the OE where the carbon dioxide and OE are reduced and the formation of the carbonate ions is possible. For this reason, the cell performance in the MCFC mode improves with the increase of O2 and CO2 percentage in the OE electrode. In both cases, the mean voltage increase between the Standard OE and the Enriched OE is around 7% (ca. 50 mV), while the mean voltage between the Diluted OE and Enriched OE is around 15% (ca. 110 mV).
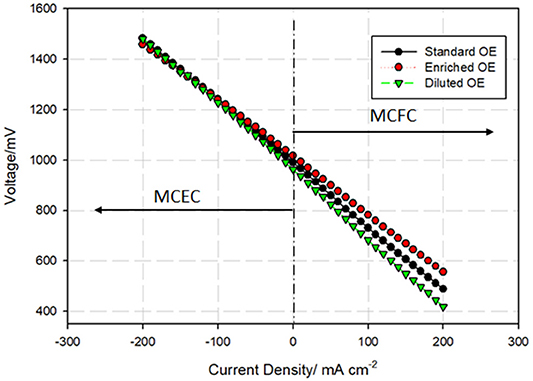
Figure 7. Polarization curves obtained for oxygen (OE) composition variation.
The compositional results obtained from the gas chromatograph for the two Test Cases are presented in Figure 8. In Figures 8A,C, the flow rate measured in ml/min is reported for each compound under the different conditions studied. In Figures 8B,D, the percentage trend for each compound is shown as the variation in the test conditions. It is important to underline that the results obtained for each condition tested using OE Standard, OE Diluted, and OE Enriched compositions are almost identical, and for this reason only a single set of data are presented, further confirming that the MCEC mode is not affected by variations in the composition of the OE, as already seen for the IV curves in Figure 7.
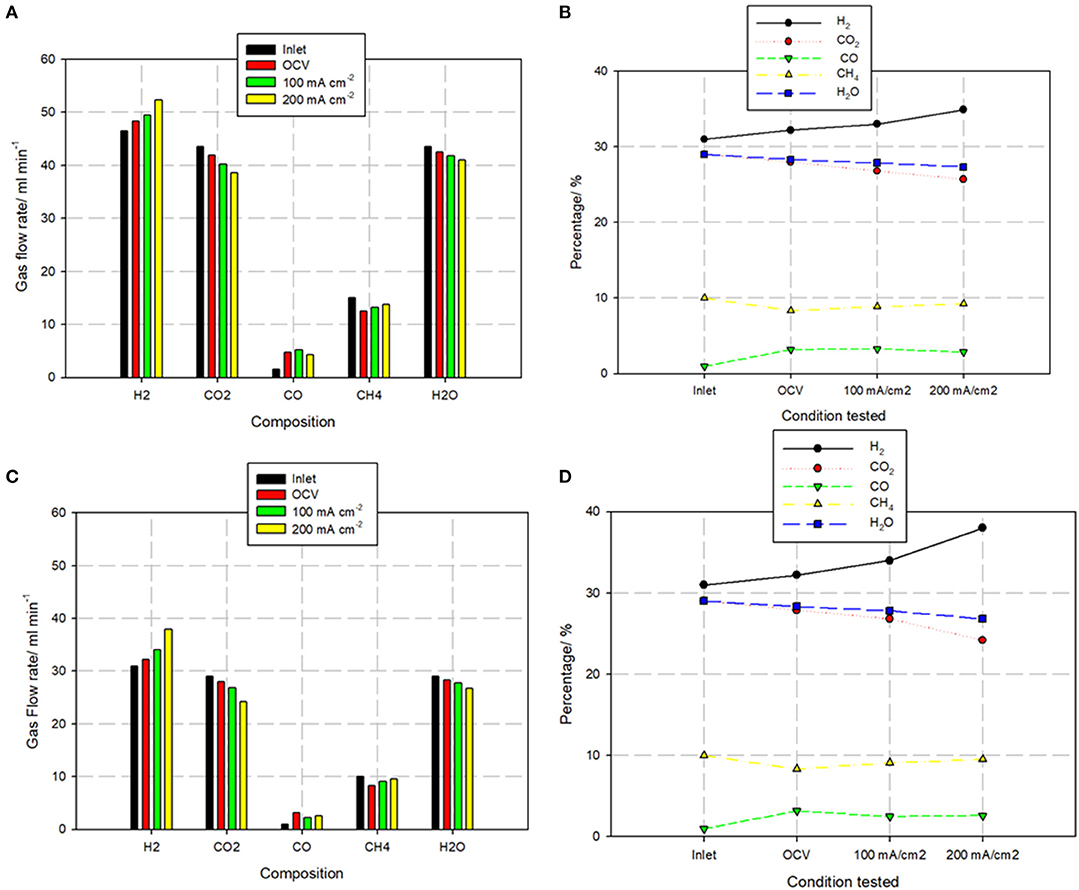
Figure 8. Gas analysis results obtained for the Test Case 1 (A,B) and Test Case 2 (C,D).
Figures 8A,C show similar changes in the gas concentration between the gas inlet (black bar) and the gas measured in the FE outlet in the OCV condition (red bar), which is purely due to the chemical conversion of the species at the MCEC operating temperature (650°C). In particular, there is an increment of H2 and CO while CO2, H2O, and CH4 slightly decrease. A marked increment of CO in the OCV condition is possible due to the concomitant action of two reactions: the RWGS reaction and the SMR reaction. The first reaction (Equation 7) leads to the chemical production of CO and H2O by consuming CO2 and H2. In the second one (Equation 1), CH4 reacts with water to produce H2 and CO. Also, it is not possible to exclude the presence of the WGS reaction (Equation 2) that generally follows the SMR reaction leading to the formation of H2 and CO2. These reactions are expected in the FE due to the operating temperature and the availability of Ni catalyst.
With the increase of current density, the trend of H2 increases and, at the same time, there is a linear decrement of H2O and CO2, as shown in Figures 8B,D. This is the result of the electrochemical reduction at the FE (Equation 3). It is evident that the increment of H2 (as also the decrement of CO2 and H2O) in the Test Case 1 is less marked with respect to the one measured in the Test Case 2 due to the fact that the Fuel Utilization (UFf, tot) is inversely proportional to the reactant flow rate, as described in Equation (9). The total UFf, tot obtained experimentally in the Test Case 1, where the FE total flow rate corresponds to 150 ml/min, is between 5–8% (100 mA/cm2), and is equal to 10.29% (200 mA/cm2) while in Test Case 2, where the FE total flow rate is 100 ml/min, the total UFf, tot is between 9–12% (100 mA/cm2) and 16.5% (200 mA/cm2). The total UFf, tot obtained experimentally result around 20–30% higher than the theoretical UFf, e (Equation 9) due to the concomitant chemical conversion reactions. The slight concentration variations of CO and CH4 (in the order of <5 ml/min) between the two tests can be attributable to inevitable measurement errors due to an instrument and to the open-electrode configuration of the cell setup, which does not guarantee a perfectly gastight outlet stream. For both compounds, the gas analysis results are quite unaffected by the operating current density, obtaining similar values with respect to what measured in OCV, confirming that the chemical conversion (RWGS and SMR reactions) is unaffected by the current load. In particular, the near-constant trend of CO confirms that the electroreduction of CO2 in CO does not occur.
In Figure 9, the H2 production (a) and the CO2-H2O consumption (b) as a function of the fuel utilization are shown. The H2 concentration trend (blue line) in Figure 9A shows that the H2 production increases linearly with increasing UFf, tot factor as expected. Likewise, the trend of CO2 and H2O (respectively black and green lines) in Figure 9B decreases as the utilization factor increases. For both H2 production, (a) and reactant reaction rates (b) the experimental measurements (red points) show higher values with respect to the theoretical reaction rate (black points) due to the concurrent chemical conversion reactions.
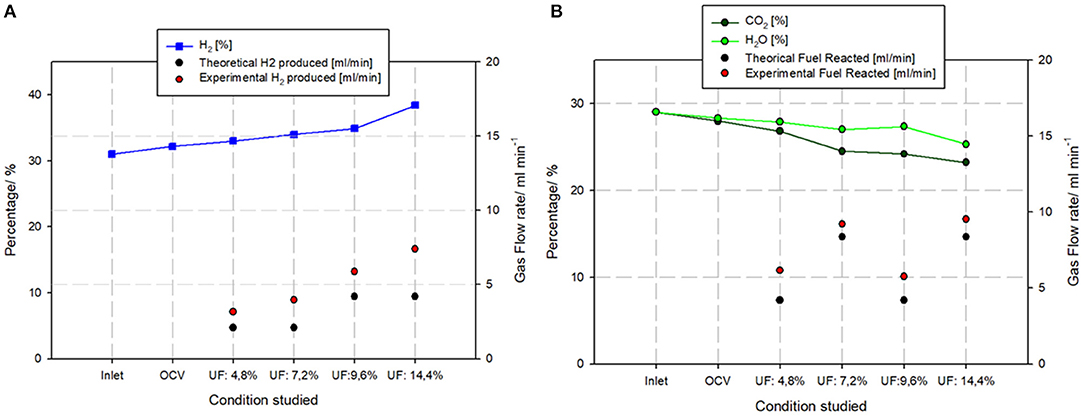
Figure 9. H2 production (A) and fuel reacted (B) according to tested condition.
System Integration Analysis Results
Figure 10A reports a parametric analysis for the sizing of the MCEC unit in design conditions (Table 5), for a r range of 0.25–1. The operation of the stack at lower nominal UFf,tot entails the reduction of the stack nominal power at an equal inlet reactant flow rate since the required reactant reaction rate to obtain lower UFf,tot is decreased. Considering that typically the design UFf,tot of an MCEC is equal to 80% to obtain significant values of the production of H2, for each one-fourth of the PSA off-gas (r = 0.25), the MCEC unit with a nominal electrical power of around 1 MW is required. With the increase of the processed off-gas, the MCEC nominal power increases accordingly up to a maximum of around 4 MW for r = 1. For this study, the MCEC nominal power equal to 1 MW has been considered both to assess the per-MW effect on the final performance parameters and since this scale is compatible with a commercial Fuel Cell Energy Solutions DFC®400 EU stack with a nominal electric power of 400 kW. A power ratio of around 2.5 between the electrolyzer and fuel cell nominal power for an equivalent stack has been considered (Buffo et al., 2020). The active surface of the stack, considering that at the design current density (jn = 0.15 mA/cm2), the power density is equal to 0.2039 W/cm2, equates to around 490 m2 (around 490 cells). Table 6 summarizes the design specifications of the installed MCEC unit. Larger nominal power values can be achieved in a way by increasing the number of modular stack units.
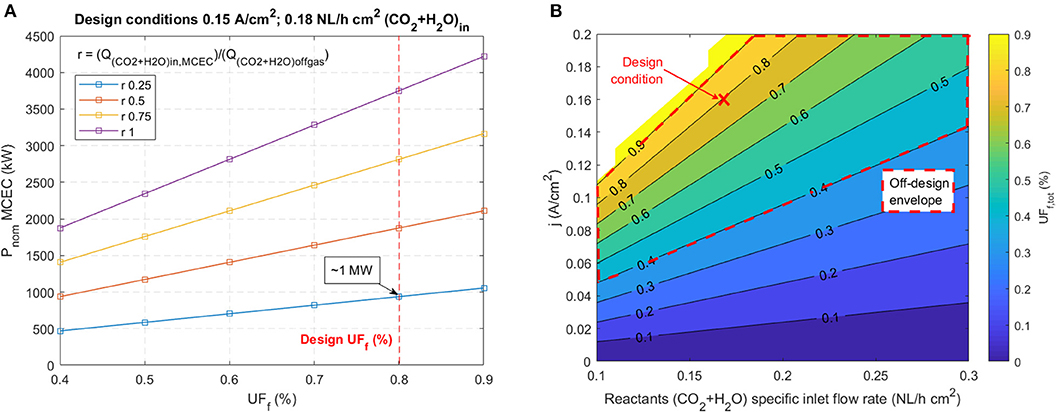
Figure 10. (A) MCEC sizing at design conditions [0.15 A/cm2; (CO2 + H2O)in 0.18 NL/(h cm2)] and (B) MCEC off-design operating envelope (UFf,tot 40–90%).
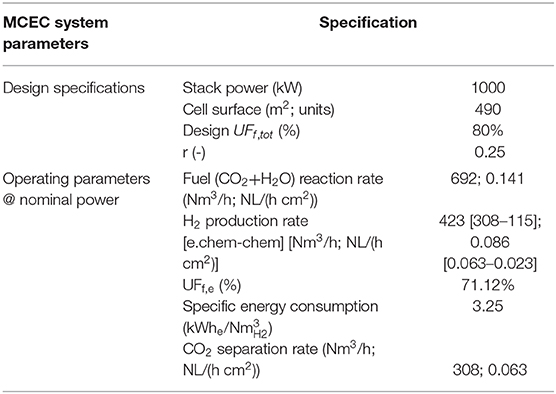
Table 6. Installed MCEC system parameters.
Figure 10B shows the operation envelope in off-design conditions. The allowed off-design UFf, tot range (40–90%) can be obtained either by varying current density j (A/cm2) or by varying the specific inlet reactant flow rate [NL/(h cm2)], thus modifying the parameter r. For each combination of such parameters, a different UFf, tot is obtained according to Equations (9) and (10), but it can be observed that current density has a greater impact on the UFf, tot in respect to the specific inlet reactant flow rate.
In design conditions [1 MWe, 0.15 A/cm2; inlet reactants flow 0.18 NL/(h cm2)], the gas composition at the outlet of the FE is given by an interpolation of the experimental gas analysis data (thus comprising both the electrochemical and chemical conversion pathways), adapting the reactant-specific inlet flow rate [NL/(h cm2)] as a function of r and desired UFf, tot (80%). As reported in Table 6, the fuel (CO2 + H2O) reaction rate of 692 Nm3/h [0.141 NL/(h cm2)] and a H2 production rate of 423 Nm3/h [0.086 NL/(h cm2)] are obtained. The electrochemical conversion pathway leads to a lesser amount of H2 produced/fuel reaction, equating to an UFf,e equal to 71.12%, and the differential is due to the concurrent chemical reactions. The breakdown of the two production pathways is given in Table 6. The FE outlet flow rate is slightly increased due to the chemical reactions (SMR, WGS), which increase in volume. A Specific Energy Consumption (from the electrochemical pathway) for the hydrogen production equal to 3.24 kWhe/ is achieved, which is in line with what expected for high-temperature electrolyzers (3–4 kWh/), relevantly lower than low-temperature systems (5–6 kWh/) (International Energy Agency, 2019). The results are aligned to what obtained by Barelli et al. (2020), which report a hydrogen yield of 0.074 NL/(h cm2) and a specific energy consumption of 3.4 kWhe/.
The CO2 separation rate at the OE is equal to 308 Nm3/h [0.063 NL/(h cm2)], mixed with O2 (154 Nm3/h) in a 66/33% ratio and is given only by the electrochemical reaction at the OE. In order to achieve a CO2 pure stream for separation, a said stream is sent to the oxy-combustion reactor where it acts as a comburent agent for an additional stream of natural gas from the national grid (77 Nm3/h, a minimal incremental respect to the ex ante scenario). The SPECCA index is equal to 8.23 MJLHV/kgCO2 for the heat-integrated scenario and increases up to 15 MJLHVkgCO2 for the electrical heating scenario. Such values are quite high respect to conventional CO2-capture technologies [between 3 and 6 MJLHVkgCO2 (Voldsund et al., 2018; Gatti et al., 2020; Plaza et al., 2020)] or CO2 capture in the MCFC mode [even <1 MJLHV/kgCO2 (Spinelli et al., 2014), since electrical power is generated in the MCFC mode and not consumed as in the MCEC mode]. Also, the SPECCA index is generally used to assess the CO2 separation from streams with initial CO2 concentration as low as 4–12%, for which a direct comparison is not exactly accurate. However, a SPECCA index as high as 8 MJLHV/kgCO2 (thermal integrated scenario) is acceptable since the CO2 separation is only a side effect of the MCEC operation whose main objective is the upgrading of the off-gas to increase the H2 yield. If the off-gas is preheated with an electric heater, the SPECCA index increases dramatically due to the additional energy and emissions related to the additional electricity for electrical heating. Also, high PEF and EF of the Italian electricity mix contributes to an increase in the obtained SPECCA index, which could be strongly reduced with locally produced renewable energy: a scenario-based sensitivity analysis based on the forecasted values of PEF and EF up to 2040 and in local RES is presented in Appendix 2. The results show a decreasing trend for the SPECCA index with increasing grid quality toward 2040, although locally producing RES scenario obtains the best results with a SPECCA index as low as 3.05–5.50 MJLHV/kgCO2.
Table 7 reports the variation of the streams characteristics (flow rate and composition), as affected by the MCEC unit. The outlet gas from the FE is ideally mixed with the unprocessed (r−1) off-gas portion, obtaining a new off-gas composition (stream 9-upgrade) enriched in H2 (around +26%) at the expense of CO2 (around −20%). Following the substitution of energy carrying gases with respect to CO2, the LHV of the upgraded off-gas is increased up to around 3.5 kWh/Nm3 (+8.7%). Maintaining a constant thermal power to the main reformer combustor, the k ratio equates to 0.899, achieving the recirculation of 424.3 Nm3/h of upgraded off-gas to the PSA (stream 6-upgrade), increasing the available inlet H2 content and, subsequently, the separated H2 from the PSA (stream 7-upgrade) up to 5,824 Nm3/h (+173 Nm3/h; +3.06%). Also, the amount of off-gas sent to the combustor is reduced by 325 Nm3/h (−7.93%) with respect to the ex ante case thanks to the improved off-gas quality and LHV; this aspect contributes to an additional reduction of CO2 content and other emissions (thermal NOx) in the flue gas of the plant due to an improved combustion process whose impact is not quantified in the present work.
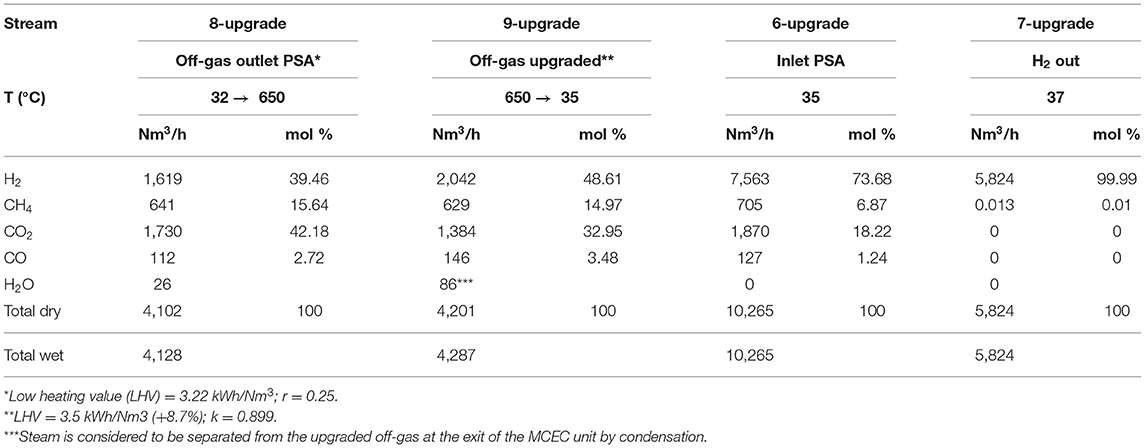
Table 7. Upgraded stream characteristics: in terms of temperature (°C), flow rate (Nm3/h), and composition (mol%).
For the sake of simplicity, only one recirculation iteration cycle has been considered. This is not entirely true because the reintegrated stream affects not only the hydrogen yield but also the off-gas flow rate and composition iteratively affecting all the downstream cycle. However, as a first approximation, only one recirculation iteration is acceptable since the resulting off-gas presents a variation of <3% in flow rate and an average variation of <7% in composition with respect to the ex ante off-gas. The impact for each iteration is less without substantially modifying the results obtained by analyzing a single iteration.
The results in terms of plant H2 yield, off-gas flow to the reformer combustor, CO2 separated at the OE electrode, and overall energy balance have been summarized in Figures 11A–D in specific terms with respect to the inlet natural gas of the SMR plant, which remains constant and equal to 2,500 Nm3/h, in order to assess the effects of the MCEC unit. The results refer to the 1-MWe module but can also be interpreted as per-MW results since the modular capability of electrochemical cells allow to increase the installed power linearly by adding other modules.
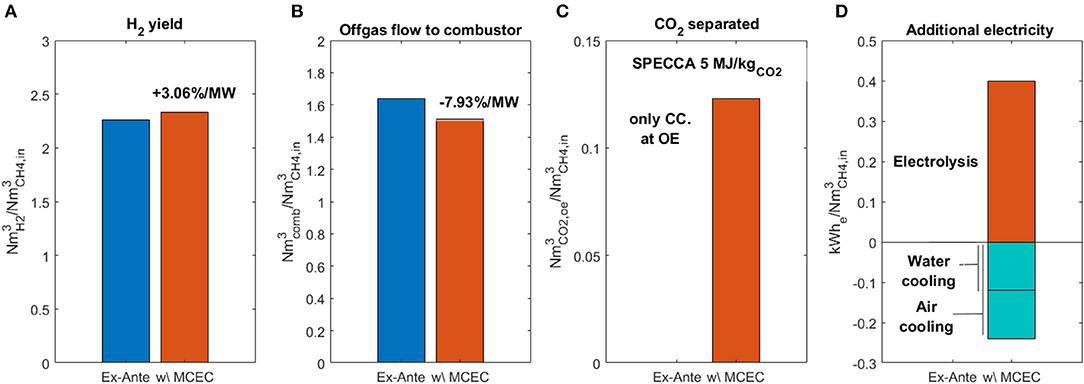
Figure 11. System integration analysis results for 1 MW MCEC installed: (A) H2 yield; (B) off-gas flow to combustor; (C) CO2 separated; (D) additional electricity.
In particular, the installation of a 1-MWe MCEC unit of leads to several beneficial effects in the system level. The H2 yield (Figure 11A) is increased by 3.06%, from 2.26 to 2.33 / with the recirculation of around 10% of the upgraded off-gas. The off-gas flow to the combustor (Figure 11B) is reduced by 7.93% at constant heat duty at the reformer combustor thanks to the increased LHV of the upgraded off-gas. The separation and concentration of 0.12 / are achieved (Figure 11C) with a SPECCA index of around 8–15 MJLHV/kgCO2, including the energy and environmental penalty of additional energy required for further CO2 purification and off-gas preheating. Although the SPECCA index is quite high, there is a large margin for improvement in terms of PEF and EF trends in future years or for locally producing RES. Additional amount of CO2 and hazardous emissions are avoided at the reformer flue gas thanks to the reduction of off-gas sent to combustion and thanks to the improved combustion process due to increased fuel gas quality. In addition, CO2 capture is not a main objective of the integration of the MCEC unit for which such a value of the SPECCA index can be acceptable. Such beneficial effects are obtained at the expense of an additional 0.4 kWhe/ used to power the electrolysis process, a small portion of which (up to 6%) could be potentially recovered by improving the thermal management of the plant (Figure 11D) by using a part of the heat duty of the air/water electric cooler (around 40 kWth from 32 to 130°C). In the thermal integrated scenario, the remaining thermal energy for off-gas preheating is sourced via an indirect heat exchange from an oxy-combustion reactor, which represents a valuable source of high-grade heat (762 kWth at the combustion temperature with 90% combustion energy efficiency), consuming a minimal amount of additional natural gas. In fact, the net heat exchange efficiency (70%) an available heat of around 533 kWth is available which is by all means sufficient to preheat the off-gas (243 kWth required from 130 to 650°C). Otherwise, by considering a full off-gas preheating by an electric heater, the thermal energy consumption increases to 277 kWth, equating to additional electrical demand of 395 kWe (around 0.16 kWhe/ accounting for almost 40% additional energy with respect to the MCEC energy for electrolysis). Actually, real operating conditions would most probably be somewhat intermediate between these two scenarios where the off-gas can be preheated up to an intermediate temperature by using a part of the air/water cooler heat duty and the oxy-combustion heat duty and the remaining temperature rise (up to 650°C) would be provided by an electrical heater.
Finally, it is worth highlighting that the described results refer to a 1-MWe MCEC unit, which processes 25% of the off-gas stream. Thanks to the modularity of the MCEC technology, multiple stacks can be installed up to around 4 MW, and thus achieving more significant results at the system level (+12% in the H2 yield; −31.6% in off-gas flow to combustor; CO2-capture potential of 0.48 /). Obviously, as a downside, the energy consumption (both electrical and thermal) is increased with the MCEC nominal power.
Conclusions
A full system integration analysis of an MCEC unit in a SMR plant inside an oil refinery is performed via a mixed experimental/simulative approach, by using the chemical and electrochemical data coming from an MCEC single repeating unit (3 cm2 active area) to fine-tune an ad hoc performance model aiming to assess the overall performance of the integrated system. The results showed that for the integration of a 1-MWe MCEC unit operating in steady state on ~25% of the total off-gas, several beneficial effects can be obtained. Particularly, the H2 yield is increased by 3.06% from 2.26 to 2.33 / with the recirculation of around 10% of the upgraded off-gas. An increase in the hydrogen yield up to 12% can be potentially achieved by increasing the installed power of the MCEC unit to process the totality of the off-gas, taking into account the modularity of the proposed electrolyzer. Moreover, the results demonstrated that the off-gas flow to the combustor is reduced by 7.93% at constant heat duty at the reformer combustor thanks to the increased LHV of the upgraded off-gas, representing a big impact not only from an environmental point of view but potentially also from an economical point of view by taking into account the European Emission Trading System and the revenues coming from it. Without considering the emission reduction at the reformer flue gases, CO2 is separated electrochemically at the OE electrode of the MCEC with a SPECCA index of around 8 MJLHV/kgCO2 in the thermally integrated scenario, after further purification in an oxy-fuel combustion reactor. Although great respect to competing CO2-capture technologies (between 3–6 MJLHV/kgCO2 and even below 1 MJLHV/kgCO2 for MCC operated in MCFC mode), such a value is acceptable since the CO2 capture is not the main objective of the MCEC integration. The CO2-capture capability can be further improved by decarbonizing the electricity supplied to the MCEC. Such beneficial effects are obtained at the expense of additional 0.4 kWhe/ used to power the electrolysis process, portion of which (6%) could potentially be recovered by improving the thermal management of the plant. Experimental data showed an electrochemical Specific Energy Consumption for the H2 production of 3.24 kWh/, which is a promising value in comparison with the competing low-temperature electrolysis technologies (between 5 and 6 kWh/) and a significant improvement of the MCFC performance when the OE outlet gas composition obtained in the electrolysis mode is stored and subsequently fed in the same electrode but operating in the fuel cell mode. These results demonstrate not only the high energy conversion efficiency of the MCEC but also provides the possibility of opening up of the investigation to use MCC systems in a reversible operation.
Data Availability Statement
The original contributions presented in the study are included in the article/Supplementary Material, further inquiries can be directed to the corresponding author/s.
Author Contributions
AMF, MDP, MR, and GC contributed to the conception and design of the study. MR and NP provided and organized the data resources. FS, MDP, and AMF performed the experiments and validation. LS provided technical support for the experimental setup. AMF and FS performed the analysis, simulation, and visualization. AMF wrote the first draft of the manuscript. FS and MR wrote sections of the manuscript. MDP, GC, and NP provided supervision. All authors contributed to manuscript revision, read, and approved the submitted version.
Conflict of Interest
The authors declare that the research was conducted in the absence of any commercial or financial relationships that could be construed as a potential conflict of interest.
Supplementary Material
The Supplementary Material for this article can be found online at: https://www.frontiersin.org/articles/10.3389/fenrg.2021.655915/full#supplementary-material
References
Angeli, S. D., Monteleone, G., Giaconia, A., and Lemonidou, A. A. (2014). State-of-the-art catalysts for CH4 steam reforming at low temperature. Int. J. Hydrog. Energy 39, 1979–1997. doi: 10.1016/j.ijhydene.2013.12.001
Baharudin, L., and Watson, M. J. (2017). Hydrogen applications and research activities in its production routes through catalytic hydrocarbon conversion. Rev. Chem. Eng. 34, 43–72. doi: 10.1515/revce-2016-0040
Barelli, L., Bidini, G., Cinti, G., and Milewski, J. (2020). High temperature electrolysis using molten carbonate electrolyzer. Int. J. Hydrog. Energy. doi: 10.1016/j.ijhydene.2020.07.220. [Epub ahead of print].
Buffo, G., Ferrero, D., Santarelli, M., and Lanzini, A. (2020). Energy and environmental analysis of a flexible Power-to-X plant based on Reversible Solid Oxide Cells (rSOCs) for an urban district. J. Energy Storage 29:101314. doi: 10.1016/j.est.2020.101314
Cigolotti, V., Massi, E., Moreno, A., Polettini, A., and Reale, F. (2008). Biofuels as opportunity for MCFC niche market application. Int. J. Hydrog. Energy 33, 2999–3003. doi: 10.1016/j.ijhydene.2008.03.038
Comodi, G., Renzi, M., and Rossi, M. (2016). Energy efficiency improvement in oil refineries through flare gas recovery technique to meet the emission trading targets. Energy 109, 1–12. doi: 10.1016/j.energy.2016.04.080
De Silvestri, A., Stendardo, S., Della Pietra, M., and Borello, D. (2021). Decarbonizing cement plants via a fully integrated calcium looping-molten carbonate fuel cell process: assessment of a model for fuel cell performance predictions under different operating conditions. Int. J. Hydrog. Energy doi: 10.1016/j.ijhydene.2020.12.024. [Epub ahead of print].
Della Pietra, M., McPhail, S. J., Prabhakar, S., Desideri, U., Nam, S. W., and Cigolotti, V. (2016). Accelerated test for MCFC button cells: First findings. Int. J. Hydrog. Energy 41, 18807–18814. doi: 10.1016/j.ijhydene.2016.07.021
Della Pietra, M., Santarelli, M., Stendardo, S., McPhail, S., Perez-Trujillo, J. P., and Elizalde-Blancas, F. (2018). Integration of a calcium looping process (CaL) to molten carbonate fuel cells (MCFCs), as carbon concentration system: first findings. J. CO2 Util. 25, 14–21. doi: 10.1016/j.jcou.2018.03.002
Desideri, U., Proietti, S., Cinti, G., Sdringola, P., and Rossi, C. (2011). Analysis of pollutant emissions from cogeneration and district heating systems aimed to a feasibility study of MCFC technology for carbon dioxide separation as retrofitting of existing plants. Int. J. Greenh. Gas Control 5, 1663–1673. doi: 10.1016/j.ijggc.2011.10.001
Desideri, U., Proietti, S., Sdringola, P., Cinti, G., and Curbis, F. (2012). MCFC-based CO2 capture system for small scale CHP plants. Int. J. Hydrog. Energy 37, 19295–19303. doi: 10.1016/j.ijhydene.2012.05.048
Di Giulio, N., Bosio, B., Cigolotti, V., and Nam, S. W. (2012). Experimental and theoretical analysis of H2S effects on MCFCs. Int. J. Hydrog. Energy 37, 19329–19336. doi: 10.1016/j.ijhydene.2012.03.086
Discepoli, G., Cinti, G., Desideri, U., Penchini, D., and Proietti, S. (2012). Carbon capture with molten carbonate fuel cells: experimental tests and fuel cell performance assessment. Int. J. Greenh. Gas Control 9, 372–384. doi: 10.1016/j.ijggc.2012.05.002
European Commission (2018). A Clean Planet for All. A European strategic long-term vision for a prosperous, modern, competitive and climate neutral economy - Communication from the Commission to the European Parliament, the Council, the European and Social Committee and the Committee, 25.
Fahim, M. A., Alsahhaf, T. A., and Elkilani, A. (2010). Book Fundamentals of Petroleum Refining, Chapter 11 - Hydrogen production. 1st Edn. Hardcover: 285-302. Available online at: https://www.elsevier.com/books/fundamentals-of-petroleum-refining/fahim/978-0-444-52785-1
Gatti, M., Martelli, E., Di Bona, D., Gabba, M., Scaccabarozzi, R., Spinelli, M., et al. (2020). Preliminary performance and cost evaluation of four alternative technologies for post-combustion CO2 capture in natural gas-fired power plants. Energies 13:543. doi: 10.3390/en13030552
Heat Exchanger World (2021). Electric Heaters Compared to Heat Exchangers: Competitors or Supplements. Available online at: https://www.heat-exchanger-world.com/webarticles/2019/12/03/electric-heaters-compared-to-heat-exchangers-competitors-or-supplements.html (accessed February 18, 2021).
Hu, L. (2016). Molten carbonate fuel cells for electrolysis (Doctoral thesis), KTH Royal Institute of Technology School of Chemical Science and Engineering, Department of Chemical Engineering and Technology, Applied Electrochemistry, Stockholm.
Hu, L., Lindbergh, G., and Lagergren, C. (2016). Performance and durability of the molten carbonate electrolysis cell and the reversible molten carbonate fuel cell. J. Phys. Chem. C 120, 13427–13433. doi: 10.1021/acs.jpcc.6b04417
Hu, L., Rexed, I., Lindbergh, G., and Lagergren, C. (2014). Electrochemical performance of reversible molten carbonate fuel cells. Int. J. Hydrog. Energy 39, 12323–12329. doi: 10.1016/j.ijhydene.2014.02.144
International Energy Agency (2015). Data and Statistics: Carbon intensity of electricity generation in selected regions in the Sustainable Development Scenario, 2000-2040. Paris. doi: 10.1007/978-1-4939-2122-5_2
International Energy Agency (2019). The Future of Fuel: The Future of Hydrogen. Report. doi: 10.1016/S1464-2859(12)70027-5
Istituto Superiore per la Protezione e la Ricerca Ambientale (2018). Fattori di emissione atmosferica di gas a effetto serra nel settore elettrico nazionale e nei principali Paesi Europei. Rome: ISPRA- Istituto Superiore per la Protezione e la Ricerca Ambientale Dipartimento Stato dell'Ambiente e Metrologia Ambientale Monitoraggio e prevenzione degli impatti sull'atmosfera.
KLM Technology Group (2017). Handbook of Process Equipment Design. Johor Bahru: KLM Technology Group.
Küngas, R. (2020). Review—electrochemical CO2 reduction for CO production: comparison of low- and high-temperature electrolysis technologies. J. Electrochem. Soc. 167:044508. doi: 10.1149/1945-7111/ab7099
Laurencin, J., and Mougin, J. (2015). “High-temperature steam electrolysis,” in Hydrogen Production, Vol. 1, ed A. Godula-Jopek. 10.1002/9783527676507.ch6. Available online at: https://onlinelibrary.wiley.com/doi/abs/10.1002/9783527676507.ch6
Lukach, R., Marschinski, R., Bakhtieva, D., Mraz, M., Temurshoev, U., Eder, P., et al. (2015). Petroleum Refining Fitness Check: Impact of EU Legislation on Sectoral Economic Performance; EUR 27262 EN. Available online at: https://publications.jrc.ec.europa.eu/repository/handle/JRC96206. doi: 10.2791/822372
McPhail, S. J., Leto, L., Della Pietra, M., Cigolotti, V., and Moreno, A. International Status Of Molten Carbonate Fuel Cells Technology, Advanced Fuel Cells Implementing Agreement Annex 23 - MCFC, 2015 ENEA National Agency for New Technologies. Rome: Energy Sustainable Economic Development Lungotevere Thaon di Revel.
McPhail, S., Moreno, A., and Bove, R. (2008). International Status of Molten Carbonate Fuel Cell (MCFC) Technology. Report RSE/2009/181. Rome: ENEA Ente per le Nuove Tecnologie, l'Energia e l'Ambiente. Available online at: https://www.enea.it/it/Ricerca_sviluppo/documenti/ricerca-di-sistema-elettrico/celle-a-combustibile/rse181.pdf
Mcphail, S. J., Aarva, A., Devianto, H., Bove, R., and Moreno, A. (2010). SOFC and MCFC : commonalities and opportunities for integrated research. Int. J. Hydrog. Energy 36, 10337–10345. doi: 10.1016/j.ijhydene.2010.09.071
Meskine, H., Gürbüz, E., Albin, V., Meléndez-Ceballos, A., Cassir, M., Ringuedé, A., et al. (2020). CO2 electrolysis in a reversible molten carbonate fuel cell: Online chromatographic detection of CO. Int. J. Hydrog. Energy doi: 10.1016/j.ijhydene.2020.08.028
Moradi, R., Marcantonio, V., Cioccolanti, L., and Bocci, E. (2020). Integrating biomass gasification with a steam-injected micro gas turbine and an Organic Rankine Cycle unit for combined heat and power production. Energy Convers. Manag. 205:112464. doi: 10.1016/j.enconman.2019.112464
Noussan, M., Raimondi, P. P., Scita, R., and Hafner, M. (2020). The role of green and blue hydrogen in the energy transition—a technological and geopolitical perspective. Sustainability 13:298. doi: 10.3390/su13010298
Noussan, M., Roberto, R., and Nastasi, B. (2018). Performance indicators of electricity generation at country level - the case of Italy. Energies 11:650. doi: 10.3390/en11030650
Perez-Trujillo, J. P., Elizalde-Blancas, F., Della Pietra, M., and McPhail, S. J. (2018). A numerical and experimental comparison of a single reversible molten carbonate cell operating in fuel cell mode and electrolysis mode. Appl. Energy 226, 1037–1055. doi: 10.1016/j.apenergy.2018.05.121
Pérez-Trujillo, J. P., Elizalde-Blancas, F., McPhail, S. J., Della Pietra, M., and Bosio, B. (2020). Preliminary theoretical and experimental analysis of a Molten Carbonate Fuel Cell operating in reversible mode. Appl. Energy 263:114630. doi: 10.1016/j.apenergy.2020.114630
Plaza, M. G., Martínez, S., and Rubiera, F. (2020). CO2 capture, use, and storage in the cement industry: state of the art and expectations. Energies 13:5692. doi: 10.3390/en13215692
Rexed, I. (2014). Applications for molten carbonate fuel cells (Doctoral thesis), Stockholm: KTH Royal Institute of Technology, School of Chemical Science and Engineering, Department of Chemical Engineering and Technology, Applied Electrochemistry.
Rinaldi, G., McLarty, D., Brouwer, J., Lanzini, A., and Santarelli, M. (2015). Study of CO2 recovery in a carbonate fuel cell tri-generation plant. J. Power Sour. 284, 16–26. doi: 10.1016/j.jpowsour.2015.02.147
Roshandel, R., Astaneh, M., and Golzar, F. (2015). Multi-objective optimization of molten carbonate fuel cell system for reducing CO2 emission from exhaust gases. Front. Energy 9, 106–114. doi: 10.1007/s11708-014-0341-7
Rossi, M., Comodi, G., Piacente, N., and Renzi, M. (2020). Energy recovery in oil refineries by means of a Hydraulic Power Recovery Turbine (HPRT) handling viscous liquids. Appl Energy 270:115097. doi: 10.1016/j.apenergy.2020.115097
Schalenbach, M., Zeradjanin, A. R., Kasian, O., Cherevko, S., and Mayrhofer, K. J. J. A perspective on low-temperature water electrolysis - challenges in alkaline acidic technology. Int. J. Electrochem. Sci. (2018). 13, 1173–1226. doi: 10.20964/2018.02.26
Simpson, A. P., and Lutz, A. E. (2007). Exergy analysis of hydrogen production via steam methane reforming. Int. J. Hydrog. Energy 32, 4811–4820. doi: 10.1016/j.ijhydene.2007.08.025
Spinelli, M., Romano, M. C., Consonni, S., Campanari, S., Marchi, M., and Cinti, G. (2014). Application of molten carbonate fuel cells in cement plants for CO2 capture and clean power generation. Energy Proc. 63, 6517–6526. doi: 10.1016/j.egypro.2014.11.687
Tao, Y., Nishino, H., Ashidate, S., Kokubo, H., Watanabe, M., and Uchida, H. (2009). Polarization properties of La0.6Sr0.4Co0.2Fe0.8O3-based double layer-type oxygen electrodes for reversible SOFCs. Electrochim. Acta 54, 3309–3315. doi: 10.1016/j.electacta.2008.12.048
U.S. Department of Energy (2004). Fuel Cell Handbook, 7th Edn. Morgantown, WV: U.S. Department of Energy Office of Fossil Energy, National Energy Technology Laboratory.
U.S. Department of Energy (2016). U.S. Department of Energy(ASHRAE) 90.1-2016 - Incorporate Minimum Efficiency Requirements for Heating and Cooling Products into Federal Acquisition Documents. Available online at: https://www.energy.gov/eere/femp/incorporate-minimum-efficiency-requirements-heating-and-cooling-products-federal (accessed January 10, 2021).
Voldsund, M., Anantharaman, R., Berstad, D., De Lena, E., Fu, C., Gardarsdottir, S., et al. (2018). CEMCAP Comparative Techno-Economic Analysis of CO2 Capture in Cement Plants (D4.6). Available online at: https://www.sintef.no/globalassets/project/cemcap/2018-11-14-deliverables/d4.6-cemcap-comparative-techno-economic-analysis-of-co2-capture-in-cement-plants.pdf
Wang, M., Wang, G., Sun, Z., Zhang, Y., and Xu, D. (2019). Review of renewable energy-based hydrogen production processes for sustainable energy innovation. Glob. Energy Interconnect. 2, 436–443. doi: 10.1016/j.gloei.2019.11.019
Nomenclature
Keywords: Molten Carbonate Electrolysis, MCEC, system integration, hydrogen production, electrochemical systems, oil refinery industry, waste recovery, carbon capture
Citation: Monforti Ferrario A, Santoni F, Della Pietra M, Rossi M, Piacente N, Comodi G and Simonetti L (2021) A System Integration Analysis of a Molten Carbonate Electrolysis Cell as an Off-Gas Recovery System in a Steam-Reforming Process of an Oil Refinery. Front. Energy Res. 9:655915. doi: 10.3389/fenrg.2021.655915
Received: 19 January 2021; Accepted: 16 March 2021;
Published: 21 April 2021.
Edited by:
Barbara Bosio, University of Genoa, ItalyReviewed by:
Timothy A. Barckholtz, ExxonMobil, United StatesUmberto Desideri, University of Pisa, Italy
Chakib Bouallou, Université de Sciences Lettres de Paris, France
Copyright © 2021 Monforti Ferrario, Santoni, Della Pietra, Rossi, Piacente, Comodi and Simonetti. This is an open-access article distributed under the terms of the Creative Commons Attribution License (CC BY). The use, distribution or reproduction in other forums is permitted, provided the original author(s) and the copyright owner(s) are credited and that the original publication in this journal is cited, in accordance with accepted academic practice. No use, distribution or reproduction is permitted which does not comply with these terms.
*Correspondence: Massimiliano Della Pietra, bWFzc2ltaWxpYW5vLmRlbGxhcGlldHJhQGVuZWEuaXQg