 Ahmad Sedaghat1
 Seyed Amir Abbas Oloomi2
 Mahdi Ashtian Malayer3Fadi Alkhatib1Farhad Sabri1
 Mohammad Sabati4Hayder Salem1Waqar Jan Zafar4
 Ali Mostafaeipour5,6,7Alibek Issakhov8,9
 Mehdi Jahangiri10
 Kuaanan Techato6,7*Shahariar Chowdhury6,7
- 1Department of Mechanical Engineering, Australian College of Kuwait, Kuwait City, Kuwait
- 2Department of Mechanical Engineering, Yazd Branch, Islamic Azad University, Yazd, Iran
- 3Young Researchers and Elite Club, Yazd Branch, Islamic Azad University, Yazd, Iran
- 4Department of Electrical Engineering, Australian College of Kuwait, Kuwait City, Kuwait
- 5Department of Industrial Engineering, Yazd University, Yazd, Iran
- 6Faculty Environmental Management, Prince of Songkla University, Songkhla, Thailand
- 7Environmental Assessment and Technology for Hazardous Waste Management Research Center, Faculty of Environmental Management, Prince of Songkla University, Songkhla, Thailand
- 8Department of Mathematical and Computer Modeling, Faculty of Mechanics and Mathematics, Al-Farabi Kazakh National University, Almaty, Kazakhstan
- 9Department of Mathematical and Computer Modeling, Kazakh-British Technical University, Almaty, Kazakhstan
- 10Department of Mechanical Engineering, Shahrekord Branch, Islamic Azad University, Shahrekord, Iran
The electricity consumption in residential/office buildings corresponded to 45% of the total annual electricity demand in hot-arid climates. This accounted for 27.2 TWh of electricity consumption with 14.2 MWh/capita/year in Kuwait. In this research, four offices in an educational building were equipped with a meteorological data logging system using temperature, humidity, and illuminance sensors. All four offices had double-glazed windows. Moreover, two offices were equipped with two types of commercially available window films. Two million data were stored in iCloud using Wi-Fi and an Internet of Things (IoT) system for the 3 months of June, July, and August 2019. In our previous published paper in Solar Energy, the results for June 2019 were analyzed using an explicit less accurate rational PDF function. Here, histograms and temperature/humidity are analyzed more accurately by numerical kernel density estimation (KDE) functions and compared for the two offices with/without 3M Neutral 20 window films for 3 months of June, July, and August 2019. Two floors of the same building consisting of 31 offices were also modeled and simulated in Design Builder to study energy saving and CO2 footprint reduction using various window films. Two floors of the same building consisting of 31 offices were also modeled and simulated to study energy saving and CO2 footprint reduction using various window films. The results of simulations for the month of July 2019 using SOL 101 and SOL 102 window films, respectively, showed that about 250 kg and 255 kg of production of CO2 could be reduced and energy saving counted for 416 and 422 kWh. Measurements from offices with 3M Neutral 20% and 3M Neutral 70% window films for the month of July 2019 indicated that the carbon footprint could be reduced by about 82 kg and 0.43 kg and energy saving counted for 147.11 and 0.71 kWh, respectively. It was observed that an annual energy saving and CO2 footprint reduction of 2.76% could be achieved using window films in a hot-arid climate.
Introduction
There are different sources of renewables that can be harnessed, but solar is the most popular since it is available in most areas (Ahmadi et al., 2020). The energy consumption of buildings is almost 40% of the demand in the world and also contributes 43% of the global greenhouse gas emission (Al Doury et al., 2020). Due to the increasing population, demand for electricity will grow in the near future (Ahmadi et al., 2018). Energy consumption optimization is an important goal to achieve sustainable development for buildings all over the world (Esbati et al., 2019). With increasing temperature of our planet due to greenhouse effects of using fossil fuels, tremendous efforts were devoted to decrease CO2 footprints, increase energy efficiency, use renewable and other resources, replace carbon fuels with hydrogen, and more (Peel et al., 2007; King et al., 2015). It seems we are arriving in an era where energy security and oil prices are being brought down from the top, and environment protection and electricity production from renewable resources are becoming of prime importance (Lund, 2009). According to Kuwait energy outlook 2019, the electricity demand for AC systems was about 70% and the annual electricity use was over 45% in residential buildings in Kuwait (KISR, 2019).
In Europe, nearly the same amount of energy is consumed for heating buildings (Bordass, 2004) which has led European countries to set legislation to reduce energy use of buildings by 20% before 2020 and 50% by 2050 (Recast, 2010). Windows are responsible for a large portion of the energy loss/gain of buildings. There are both passive and active methods to reduce energy loss. KGBC (Kuwait Green Building Council) has implemented the use of insulation materials and improved air-conditioning ducts (Sayegh, 2012; AlSanad, 2015; Alsulaili et al., 2020). Building efficiency is directly correlated to windows size and aspect ratio on architecture of buildings (Huang et al., 2014; Cuce and Riffat, 2015; Hee et al., 2015; Wang and Greenberg, 2015). Windows allow entry of sunlight into buildings and provide visual and escape access to the outside in the case of fire, and also allow air entry and temperature moderation using outside air (Huang et al., 2014; Hee et al., 2015). Modern cities utilize windows as the main architecture of high-rise buildings due to visual access to surroundings and for the artistic look of buildings in the urban environment (Hee et al., 2015). However, above 60% of energy loss from buildings are correlated to windows and window frames in hot-arid climates (Jelle et al., 2012; Ürge-Vorsatz et al., 2015) and about 40% of cooling load is due to solar radiation and heat absorption through windows (Lee et al., 2013). Window films are cost-effective methods that prevent passive heat gain from radiation through windows and are commercially available. Window films can easily be installed to the inside/outside surface of windows using liquid glues. These films are made from many layers of metallic-polyester nanofilm materials with thermo-radiation properties to reflect and reject heating waves from the solar radiation spectrum (Plummer, 2015). Other useful aspects of window films are to prevent UV waves from entering the building and considerably reduce solar light intensity and illuminance. Window films are also featured in securing indoor privacy and increasing the life cycle of interior fabrics and furniture from deterioration (Plummer, 2015; Wang and Greenberg, 2015).
Nanolayers in window films are usually made from metals/polymers where the metallic layer conducts and reflects solar heat, and the polymers are transparent oxides. Metallic nanolayers of about 10 nm are made from copper, silver, and gold and their job is to absorb very short wavelengths of the order of 0.5 μm or lower (Granqvist, 2007); but polymer nanolayers are made from dielectric materials which are optical oxides such as tin, titanium, zinc, and other similar materials with a 40-nm or lower thickness to allow visible light to pass through (Mohelnikova, 2009; Meszaros et al., 2012). Window films that are used for the outside surface of the window should withstand harsh outdoor environments, whereas the windows films for the inside surface of the window are cheaper due to less resistant materials.
The application of window films was investigated in a humid and warm climate by Li et al. (2015) where they found that clear glazing performed better than tinted windows for energy saving. In another study, it was found that exterior window films saved energy by 44% whilst interior window films merely saved 22% (Yousif, 2012). Window films reported energy saving in summer but increased energy use in winter in a hot climate (Yin et al., 2012).
The use of smart window blinds was found to be an effective yet expensive exercise (Dussault et al., 2012). Five completely different climate conditions were investigated in China by Chen et al. (2012) who found that flexible blinds of an opaque type were the most successful in energy saving.
Size, aspect ratio, and position of windows were studied in several studies on heat loss of buildings through windows (Vanhoutteghem et al., 2015; Yang et al., 2015). Yang et al. (2015) showed that low aspect ratio windows with low-emissivity could enhance building efficiency. Effects of orientation and size were investigated in a zero-energy building for cold climates (Vanhoutteghem et al., 2015). Some studies reported an energy increase using double-glazed windows combined with window films (Hee et al., 2015), whilst other studies through simulation proved the opposite (Yang et al., 2015). Their simulations also reported 17% to 47% cooling load reduction in a hot climate and other climate conditions. Human habits play an important role in the energy loss of buildings and some studies suggested that an automatic ventilation system had better energy savings (Cuce and Riffat, 2015). Window films can last between 10 to 20 years; therefore, they are economical (Glass and Glazing Federation, 1978).
The main aim of this study was to evaluate the effects of window films in thermo-solar properties of office buildings in hot-arid climates. In order to assess the effects of solar window films in thermo-solar properties and investigate the energy usage and CO2 emissions performance of office buildings, a model for an Australian College of Kuwait (ACK) building was developed using Design Builder and Energy Plus software, then calibrated with experimental data. In this study, analysis of data was done using the kernel density estimation (KDE), also histograms/KDE probability distribution function (PDF) of the thermo-solar properties was presented. The results of this study are used as the benchmark for assessing energy saving and CO2 footprints reduction of solar window films in hot-arid climates.
The novelties of this research are summarized as follows:
✓ Providing an easy solution to reduce energy consumption in hot-arid climate buildings.
✓ Thermal modeling and analysis of the ACK building, calibrating with an experimental work.
✓ Analysis of data by using the kernel density estimation (KDE).
✓ Providing histograms/KDE probability distribution function (PDF) of the thermo-solar properties.
✓ Investigating the performance of four types of commercial solar control window films in energy usage and CO2 emissions reduction in hot-arid climates.
The Case Study
The case study considered here was Kuwait located at the northern edge of Eastern Arabia at the top corner of the Persian Gulf (see Figure 1). Kuwait’s population was reported to be 4,270,571 on November 8, 2020 (worldometer, 2020). Kuwait has one of the most hostile, extremely hot, and arid climate conditions with major desert-type weather conditions and a maximum average temperature exceeding 50°C in summer time (see Figure 2). Kuwait’s precipitation is annually between 25 and 200 mm on an approximately 17,818 km2 land area.
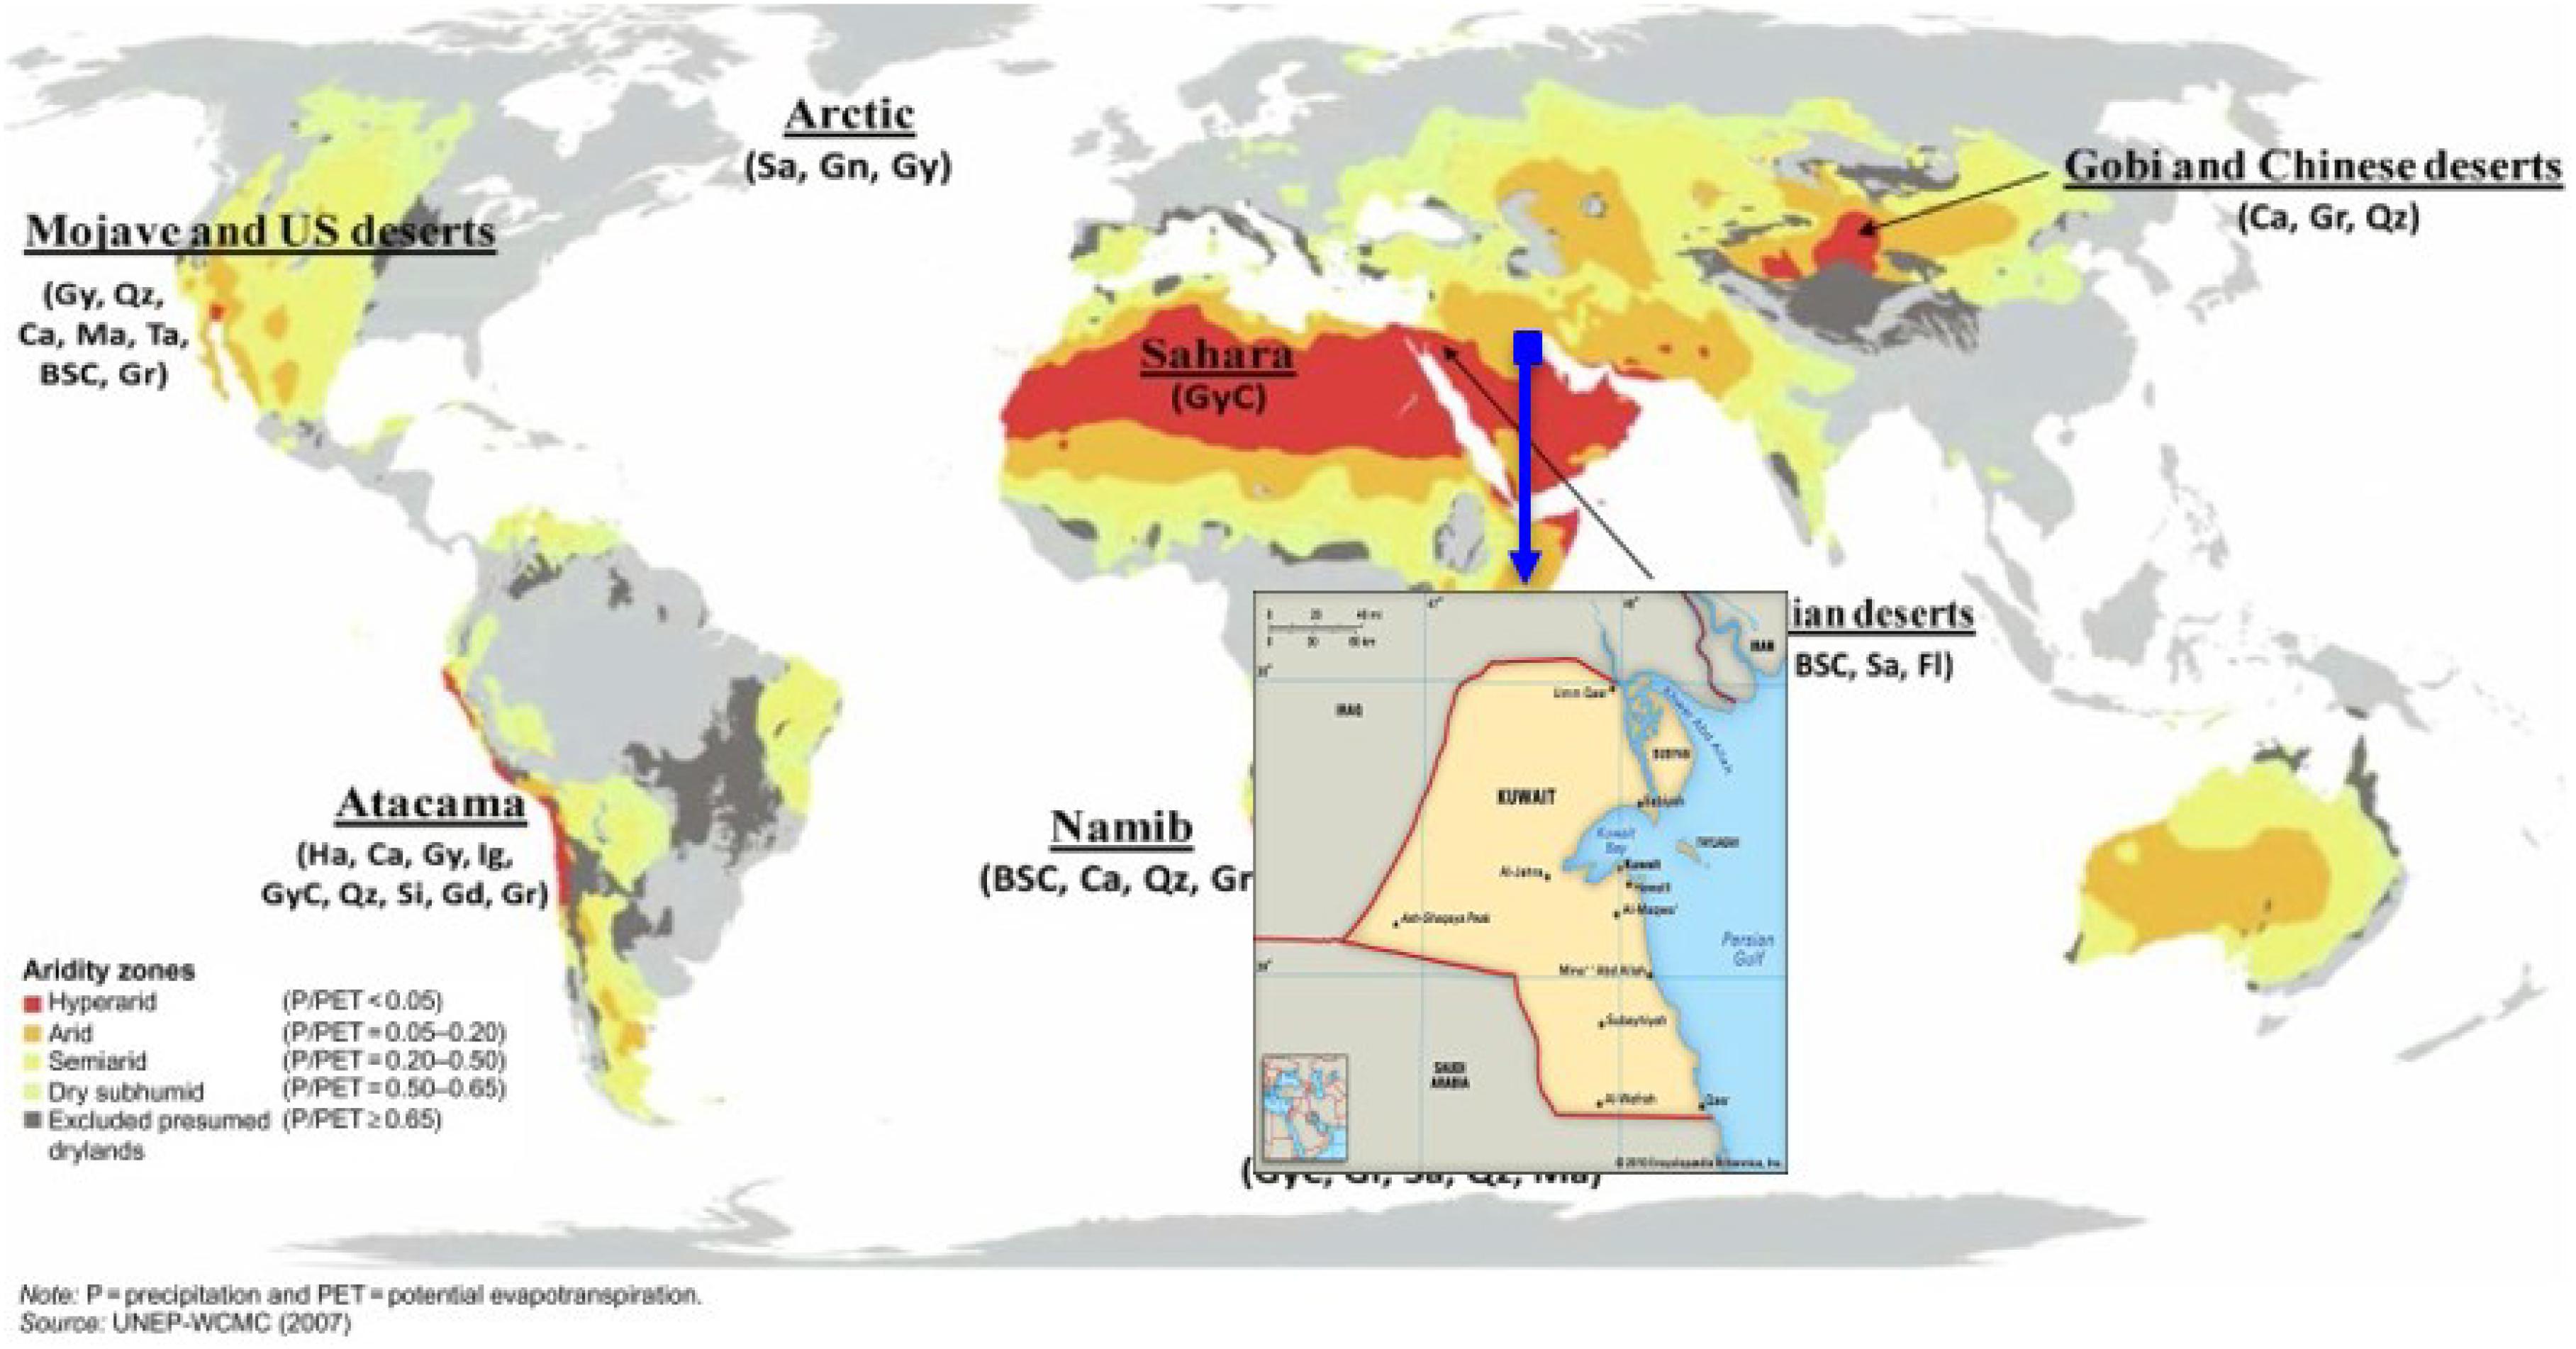
Figure 1. Global arid and desert weather conditions (Meslier and DiRuggiero, 2019).

Figure 2. Annual climate condition of Kuwait (ClimaTempts.com, 2020).
Figure 2 shows the annual climate condition of Kuwait at a 47 m elevation from sea level. The temperature in Kuwait exceeds 50°C at ground level in June, July, and August, with long average sunlight hours of 10–11 h. Relative humidity levels at ground level hardly reach 30% in the summer months and precipitation is absolutely zero. Summer in Kuwait is one the hottest places on our planet. A maximum temperature of 54°C (129 °F) was reported on July 21, 2016 in Kuwait (Alahmad et al., 2020); although we measured 55.2°C on June 11, 2019.
Materials and Methods
Building Windows
The size and type of windows in the ACK building which are double glazed with an approximate 1 cm air gap was defined in the software tools. The heat transfer coefficient for double-glazed windows is 2.785 W/m2.K and the UV light rejection is 0.497 W.h/m2. All window frames are considered as aluminum metals. Figure 3 shows the type of glazing system with/without window films.

Figure 3. Double-glazed windows with/without window films (Sedaghat et al., 2021).
Window Films
In the first part of this project, a number of markets with readily available window films designed for buildings were investigated. Three major companies were identified and their products are listed in Tables 1–3 for the Reflective, the 3M, and the LLumar companies, respectively.
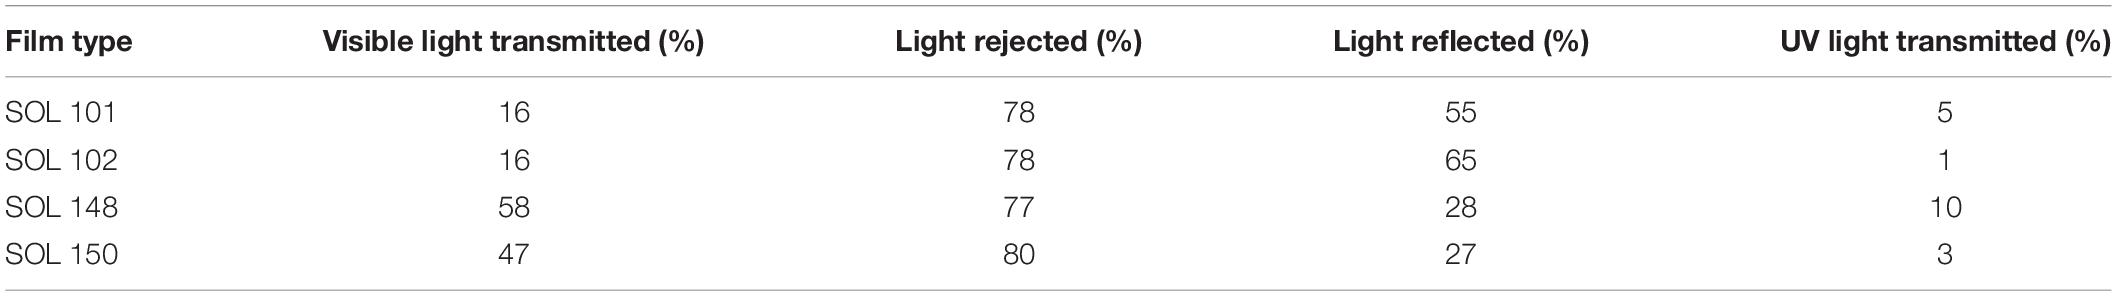
Table 1. Window film products of the Reflective company (Reflectiv, 2019).
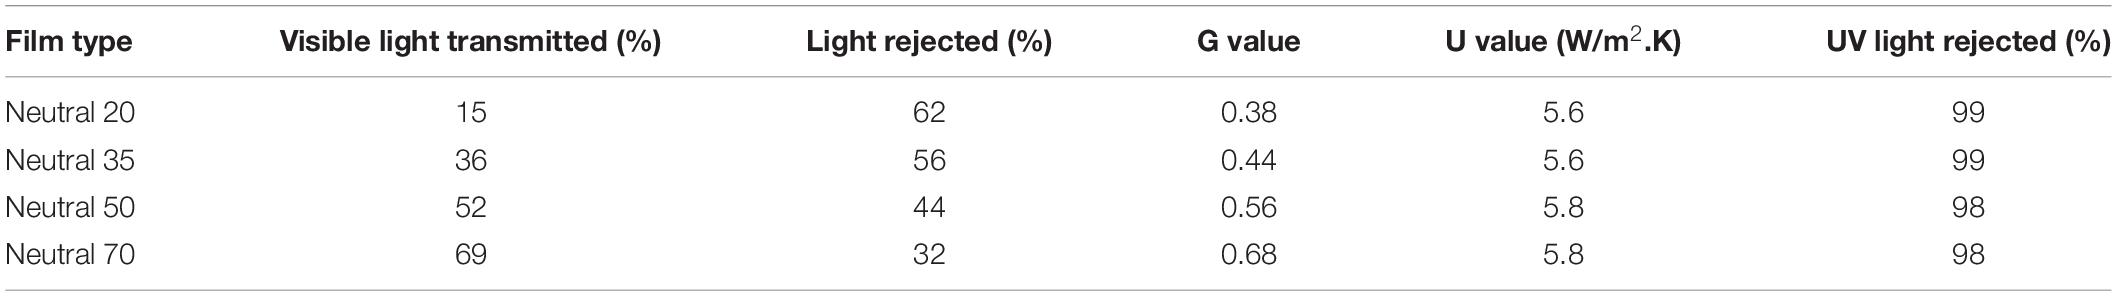
Table 2. Window film products of the 3M company (Sedaghat et al., 2021).
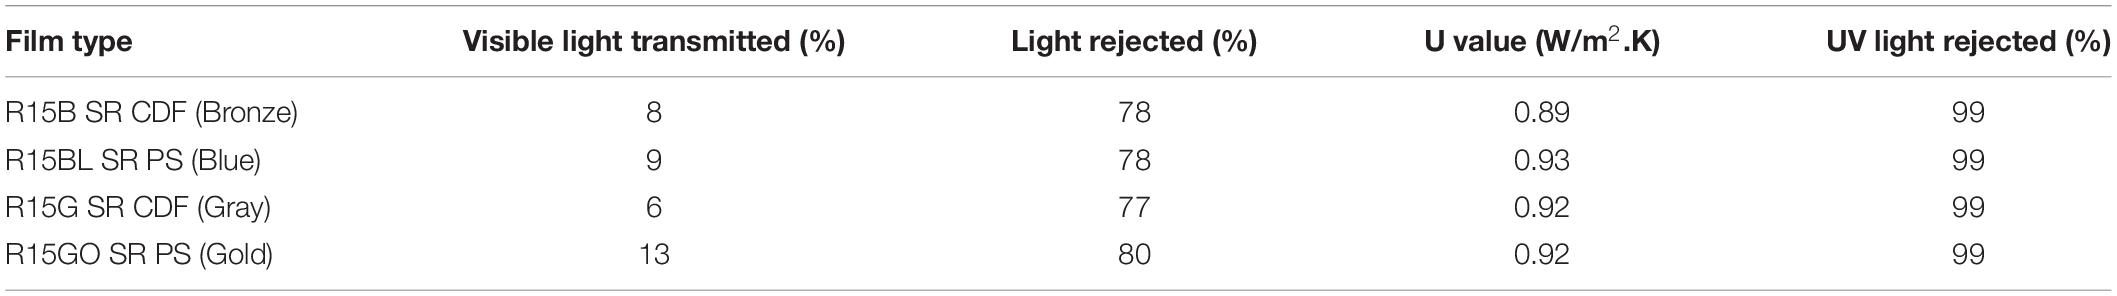
Table 3. Window film products of the LLumar company (LLumar, 2019).
The 3M company has a branch in Kuwait; therefore, we decided to select two types of 3M window films; i.e., Neutral 20 and Neutral 70. The window films that were purchased from the 3M company were installed by the company’s skilled workers in two offices on the second floor of the ACK building (see Figure 3). The process included cleaning the windows to remove any dust or particles, applying the glue to the films, sticking to the windows, and cutting edges. The window films were allowed to dry for 72 h untouched and the installation was quality checked after this time. The installation of sensors was conducted after 2 weeks to ensure the window films were firmly dried and stuck to the windows.
Building Materials
Detailed specifications of building components such as type of materials used in the external walls, inner walls, roof, and floor of a building are needed. The following common materials used in the building are discussed.
External Wall Properties
An example of external wall materials is shown in Figure 4. From the inner surface toward the outer surface of the wall may be composed of a 30 mm thick inner decoration layer, 220 mm compressed bricks, 30 mm concrete, and 70 mm of outside decorating bricks or stones. The density, heat capacity, heat conductivity, and thickness of each layer is provided in Table 4.
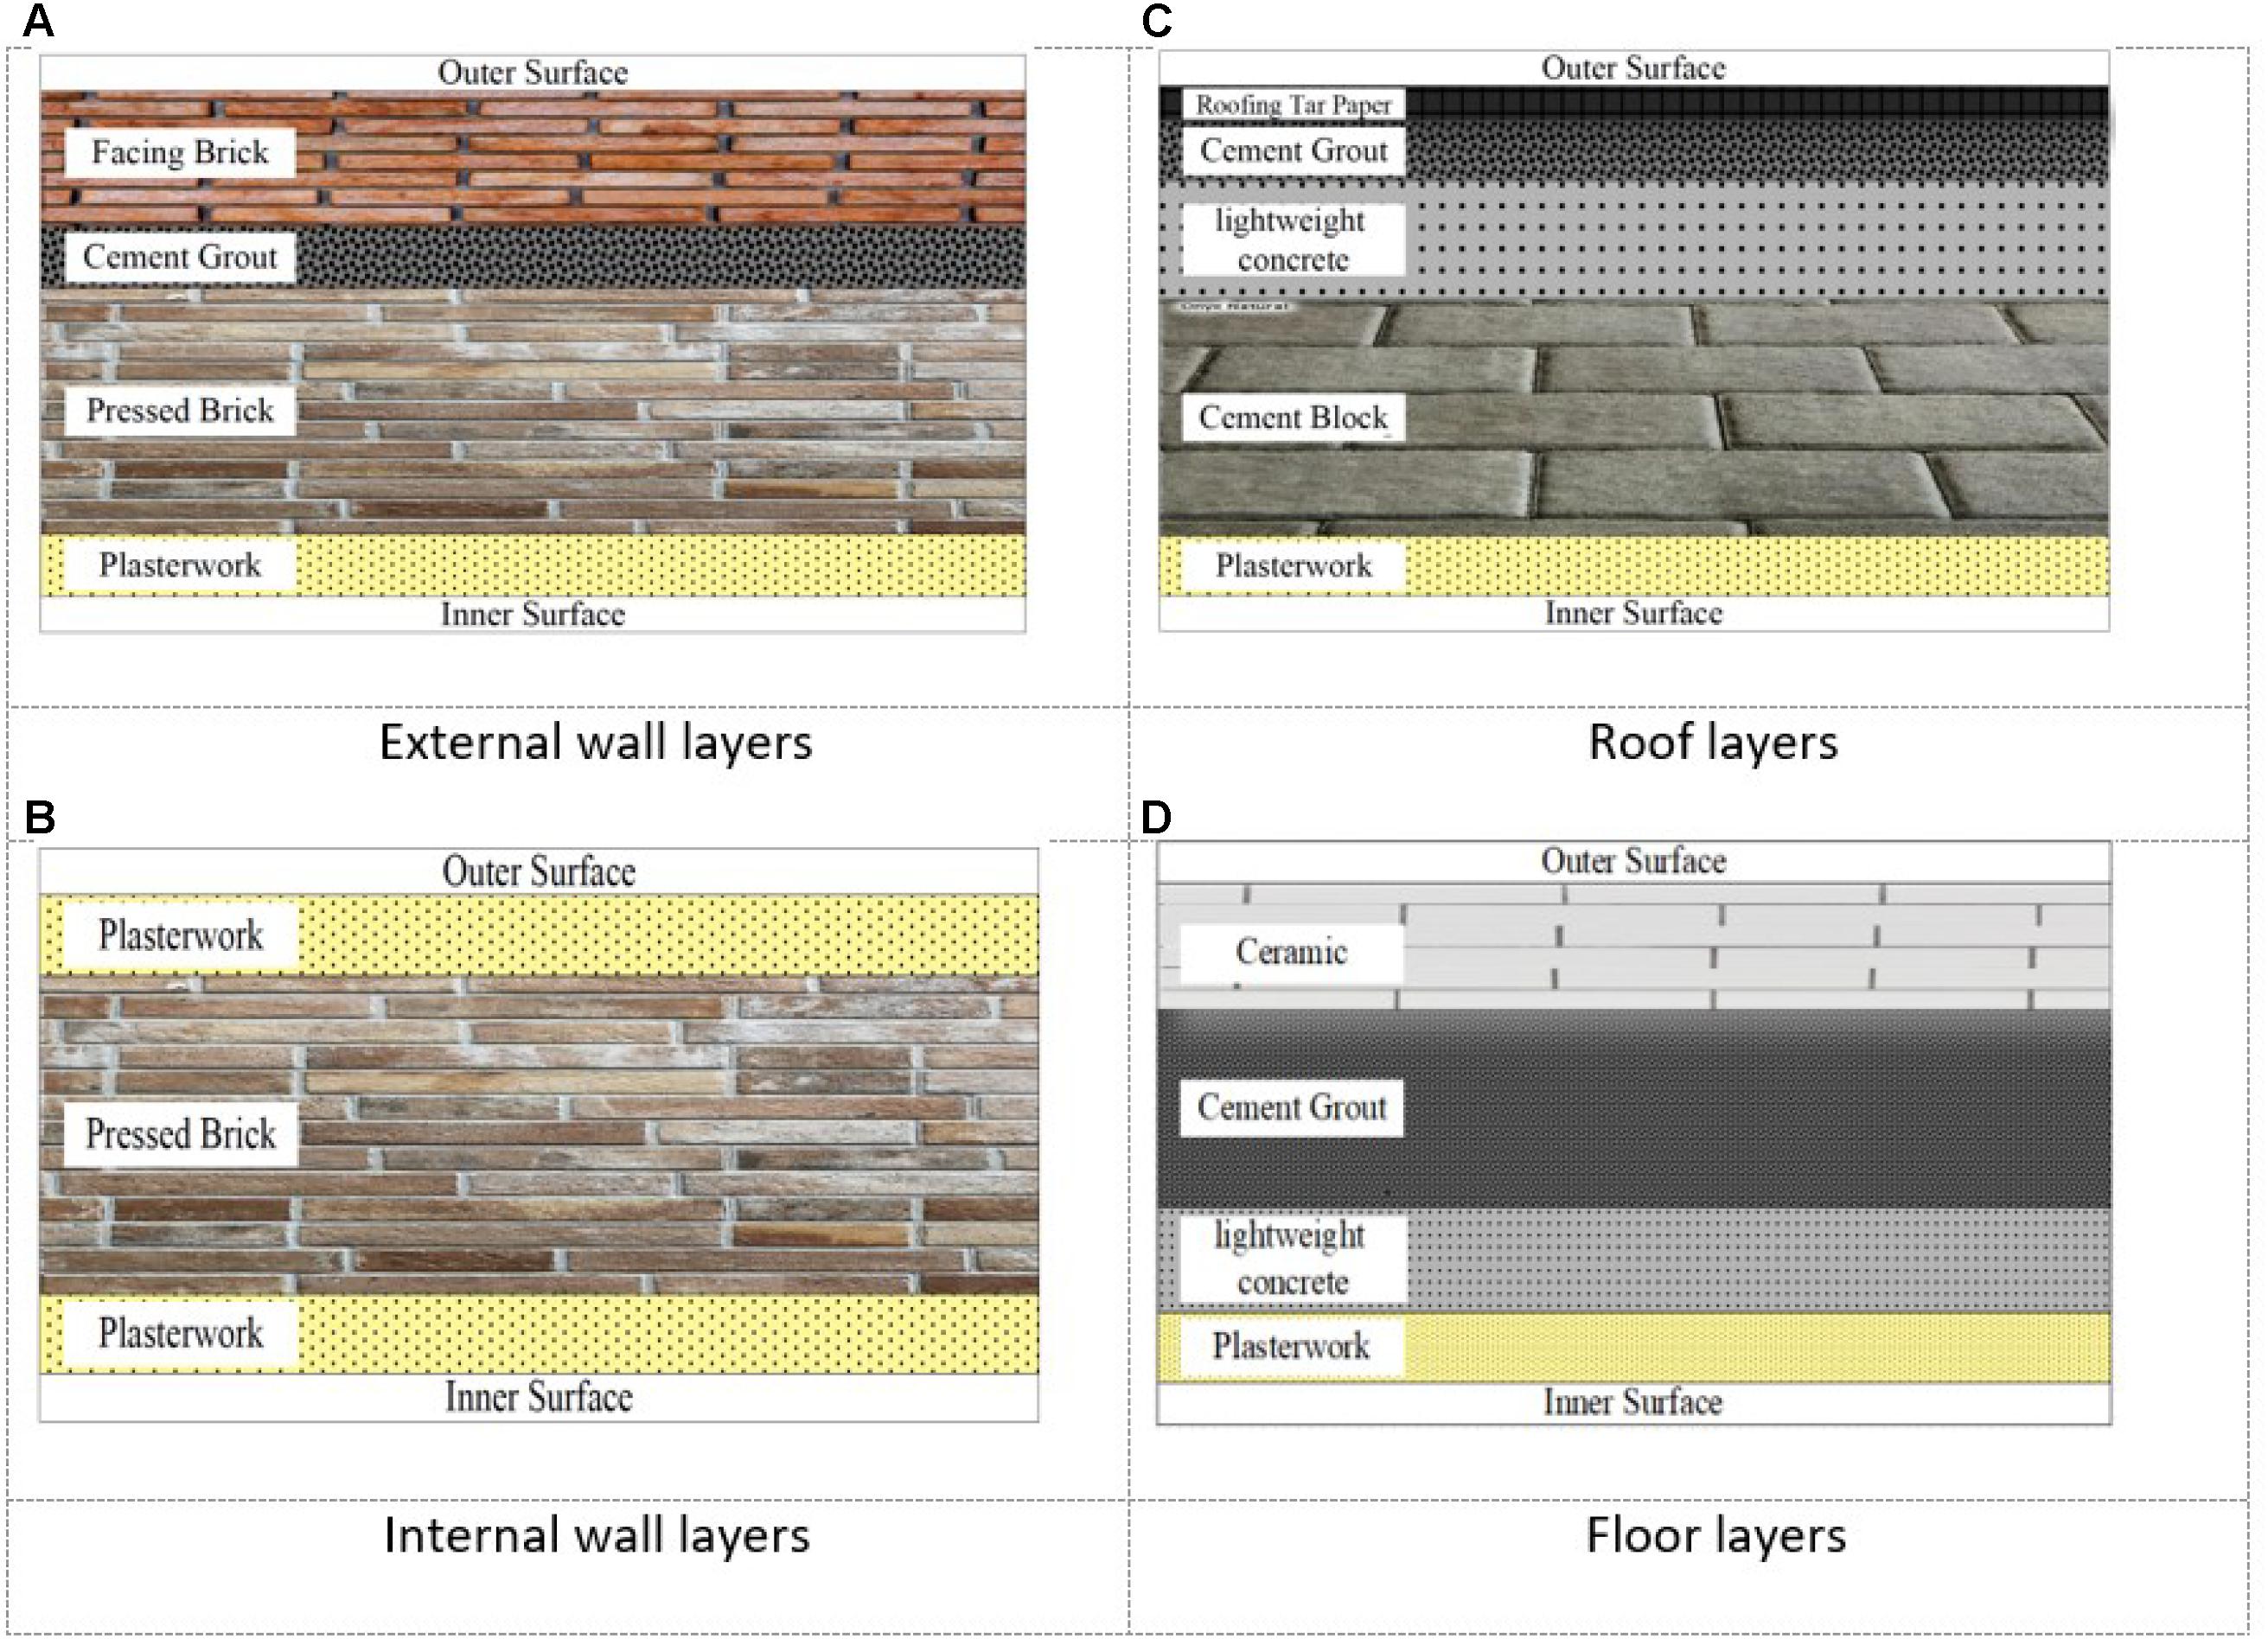
Figure 4. Building wall layers and materials. (A) External wall layers. (B) Internal wall layers. (C) Roof layers. (D) Floor layers (Sedaghat et al., 2021).
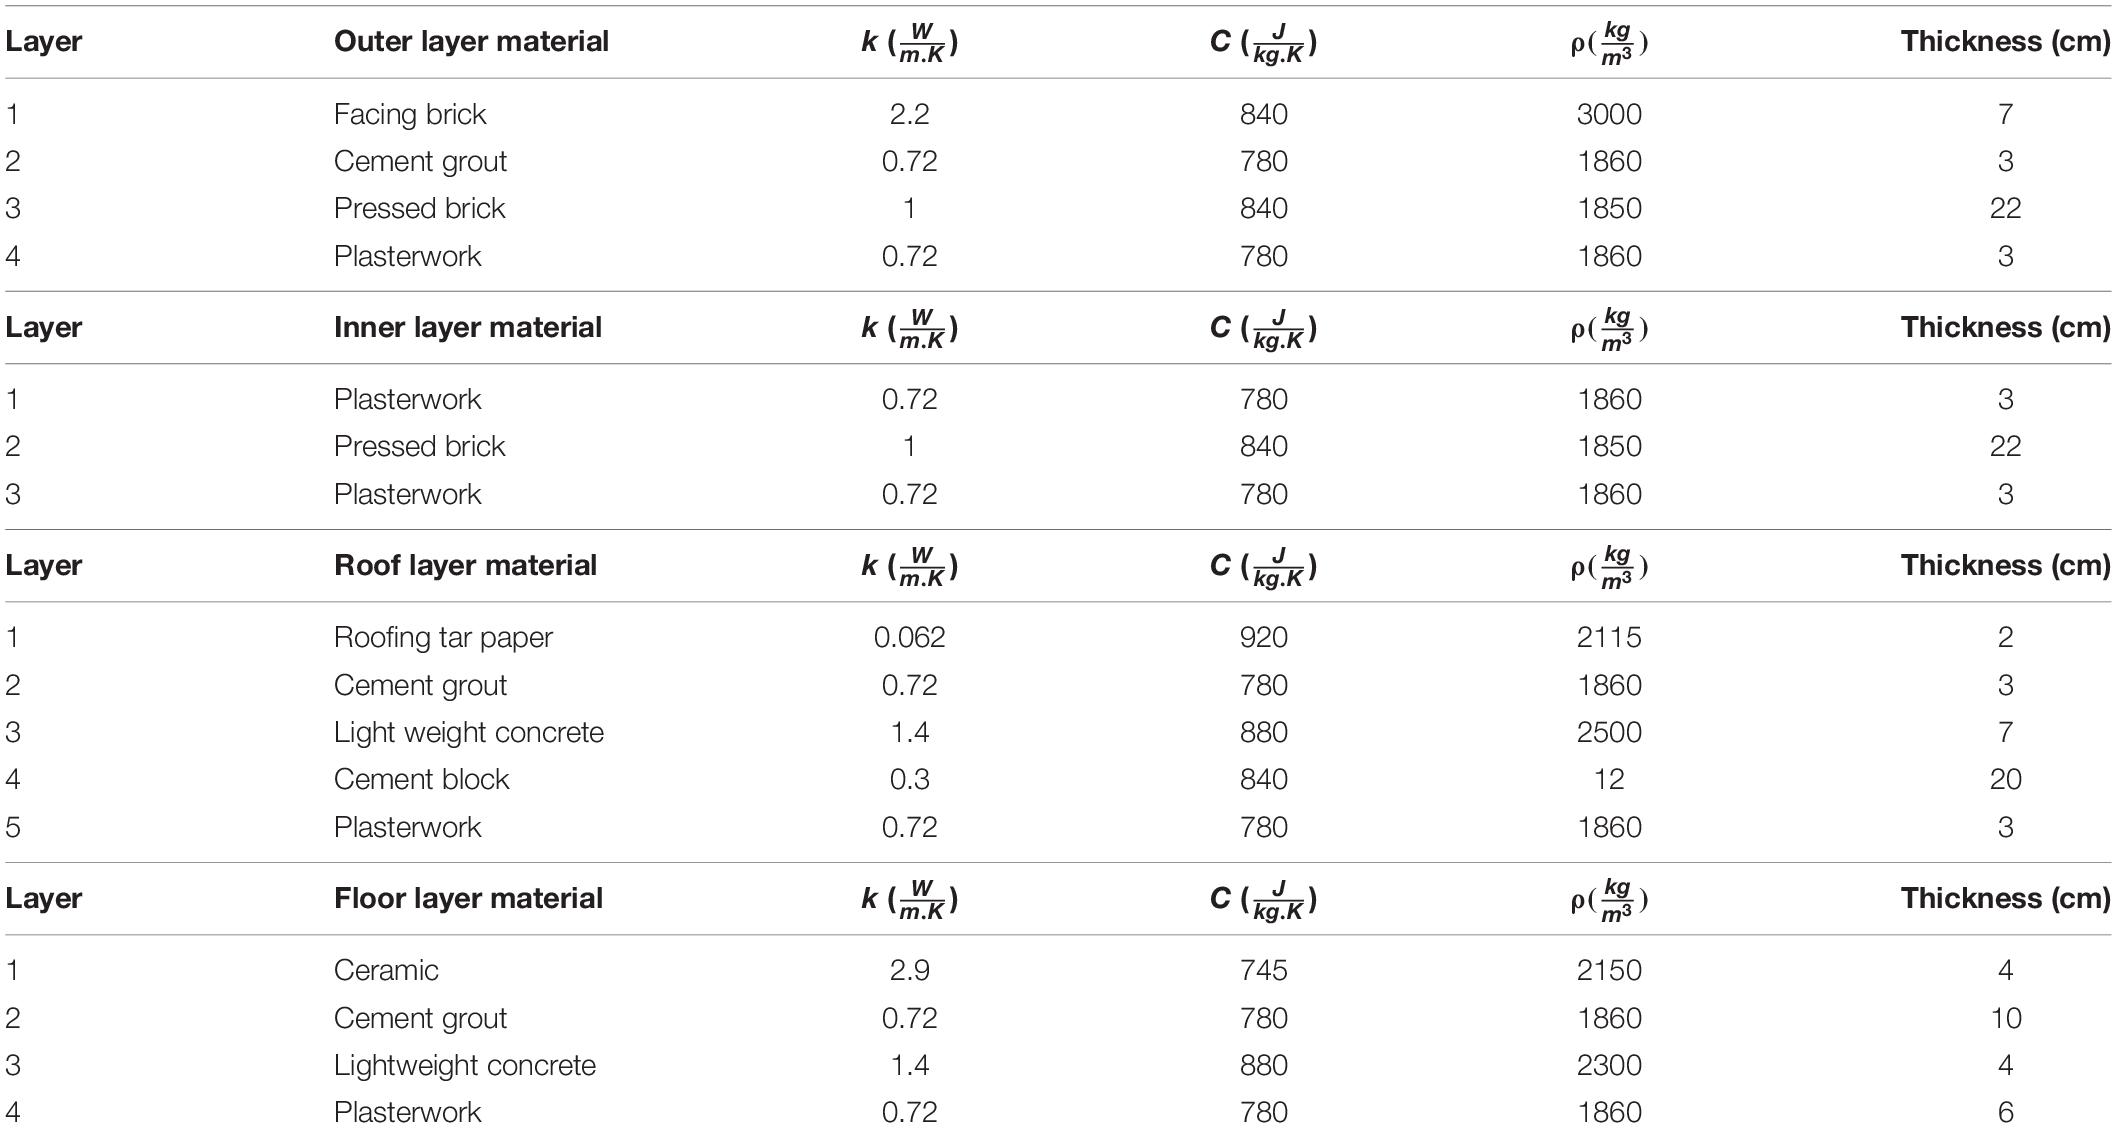
Table 4. Thermal and physical properties of outer wall materials (Sedaghat et al., 2021).
Internal Wall Properties
An example of the inner building walls is shown in Figure 4. This may be composed of a 30 mm thick inner decoration layer, 220 mm compressed bricks, and another 30 mm thick outer decoration layer. The thermal and physical properties (thermal conductivity (k), specific heat coefficient (C), and density (ρ) of the inner wall materials are given in Table 4.
The Roof Properties
The roof of the building may utilize the layers shown in Figure 4. It may be composed of a 30 mm inner decoration layer, 200 mm concrete blocks, 70 mm light concrete, 30 mm of fine cement and sand, and a 20 mm roof-sealing layer. The 300 mm ceiling was attached to the rooms so that the lighting system and AC channels could be connected. The thermal and physical properties (thermal conductivity (k), specific heat coefficient (C), and density (ρ) of each layer are shown in Table 4.
The Floor Properties
The floor of the building may utilize the layers shown in Figure 4. It may be composed of a 60 mm inner decoration layer, 40 mm light concrete, 100 mm of fine cement and sand, and a 40 mm layer of ceramic or similar flooring. The thermal and physical properties of each layer [thermal conductivity (k), specific heat coefficient (C), and density (ρ)] are shown in Table 4.
Sensors
In this work, we used DHT22 sensors to measure temperature and humidity, LDR and BH1750 sensors to measure light intensity and illuminance lux, respectively, and a UVM 30A sensor to measure UV radiation. The specification of sensors used are listed in Table 5. As shown in Figure 5, the sensors were programmed in the Arduino environment using the microprocessors ESP8266 and D1-WEMOS with capability to connect through a Wi-Fi system into an Internet of Things (IoT) iCloud. With the small yet fast microprocessors selected, we found these worked efficiently for connecting and storing data from six to eight sensors. The sensors and the microprocessors were installed with a breadboard in a controller box as shown in Figure 5.
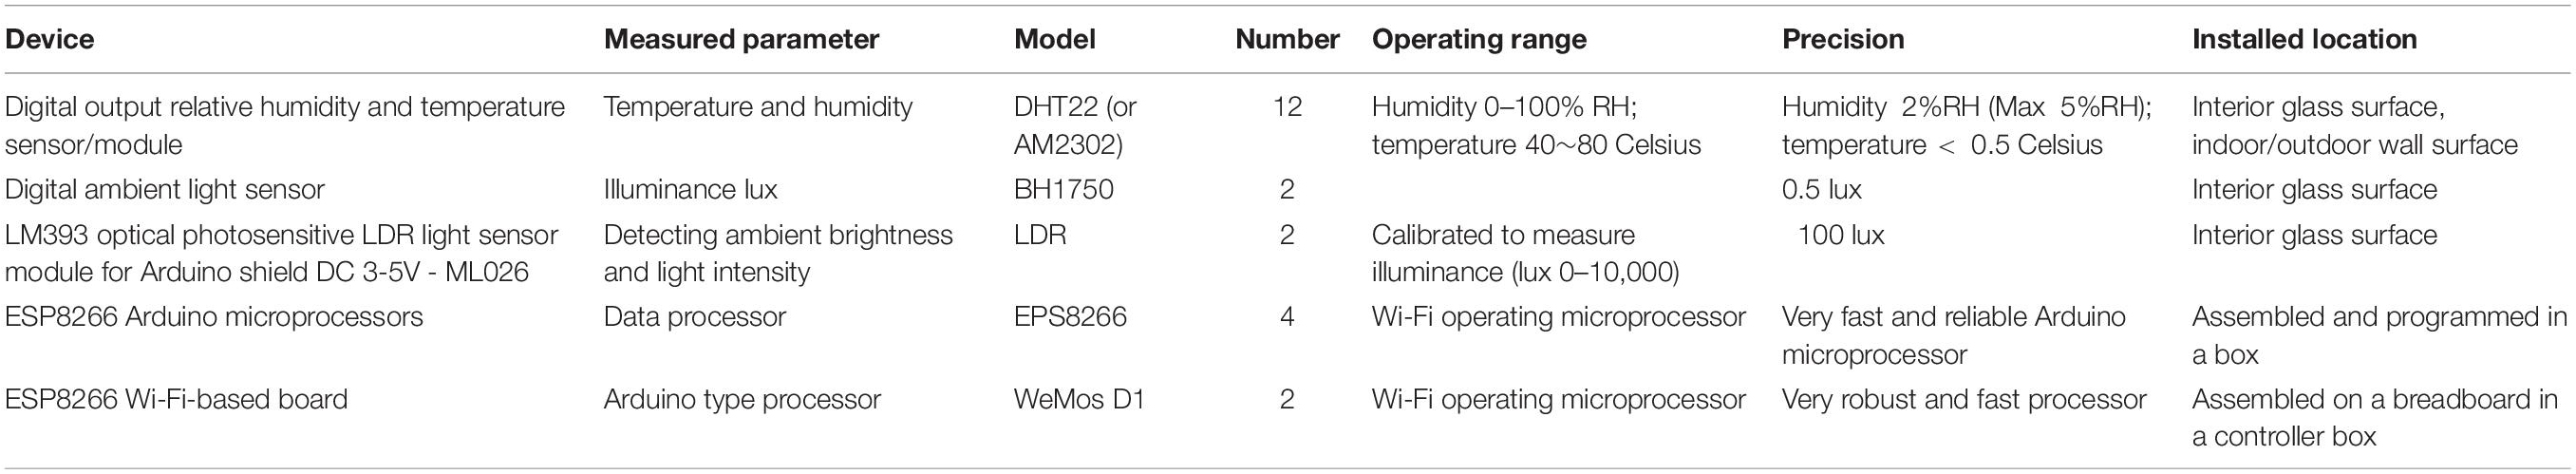
Table 5. Specifications of the sensors and microprocessors.
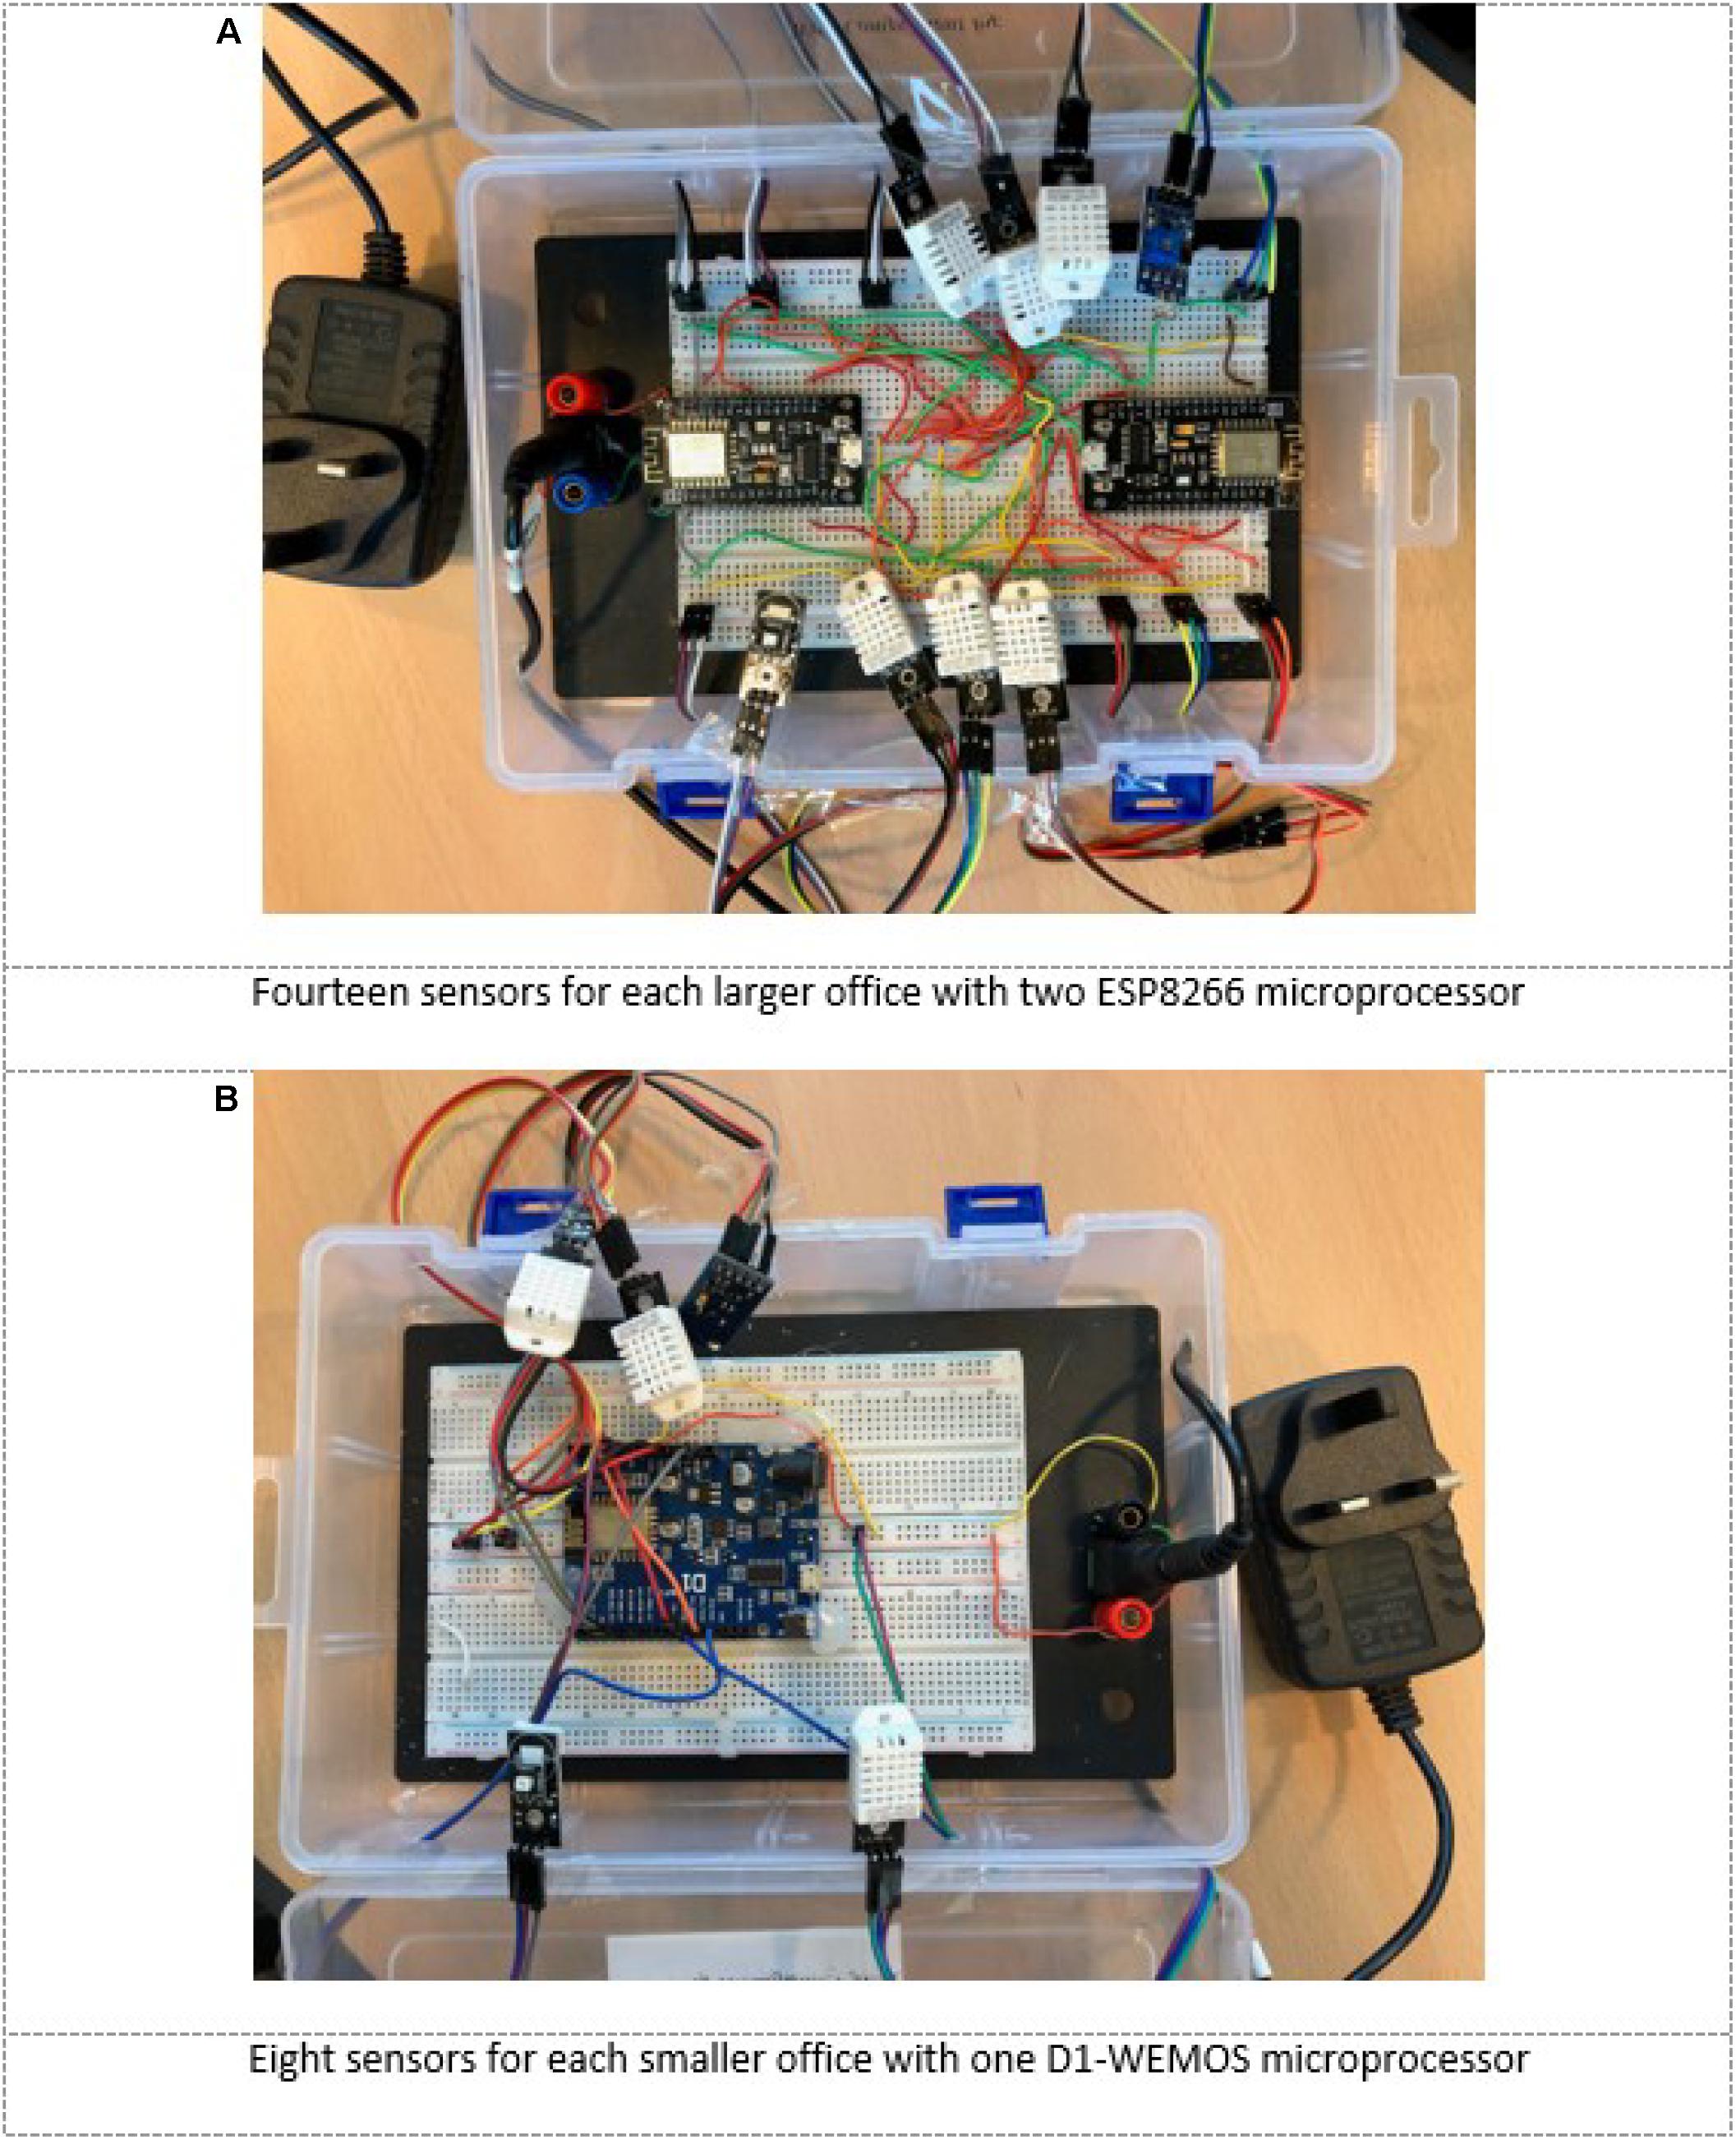
Figure 5. Assembled boards with ESP8266 and D1-WEMOS Arduino microprocessors and DHT22, LUX, and UV sensors. (A) Data logger in large offices. (B) Data logger in small offices (Sedaghat et al., 2021).
The sensors were taped to the surfaces of windows or walls inside and outside of the offices we studied in ACK Kuwait. The building offices use double-glazed windows therefore window films were installed in the interior side of windows.
For offices with/without 3M Neutral 20 window films, we used 14 sensor readings using two ESP8266 microprocessors in each room. For smaller offices with/without 3M Neutral 70 window films, we used D1-WEMOS with eight sensor readings for each room (see Figure 5). Every 3 min sensor readings were stored through the Wi-Fi 33 systems into iCloud using an IoT website called Thing Speak. The IoT Thing Speak iCloud system allows four links per user and can store 10 readings simultaneously. This continued over 3 months in summer 2019 in Kuwait. Each sensor nearly reported 50,000 readings and in total a data bank of 2 million were recorded and stored using 40 sensors readings.
Kernel Density Estimation (KDE)
Kernel density estimation is a non-parametric probability density function (PDF) method to fit with any experimental data introduced in (Parzen, 1962; Davis et al., 2011)] as a univariate method which was later extended as a reliable and strong statistical tool for multivariate density estimation (Scott, 2015). For a sample of data, the KDE is estimated by Benseddik et al. (2018):
In which K is usually a symmetric and positive kernel function with bandwidth h and is centered around the origin as follows (Benseddik et al., 2018):
In this work, we used the MATLAB (version R2020b release, The MathWorks, United States) “KS density” function to obtain KDE based on a normal kernel function at equally spaced points for temperature, humidity, and illuminance. The MATLAB’s KDE estimates the density at 100 points for the univariate data and 900 points for bivariate data. For the combined PDFs, we assumed that the variables of temperature and humidity are independent and the combined PDFs are obtained as follows:
The histograms of experimental data and KDE distributions functions of the experimental data PDFs are shown and discussed in the next section.
Results and Discussion
Illuminance Results
Two offices were installed with 3M Neutral 20 and 3M Neutral 70 window films during summer 2019. The illuminance measurements for the 15th day of the months of June, July, and August 2019 are demonstrated in Figure 6. As observed in Figure 6, it was evident that 3M Neutral 70 window films had little effect and only reduced light intensity at peak high temperatures in the day. Temperature and humidity results also only marginally changed using this window film. Therefore, the results of this window film are not presented here.
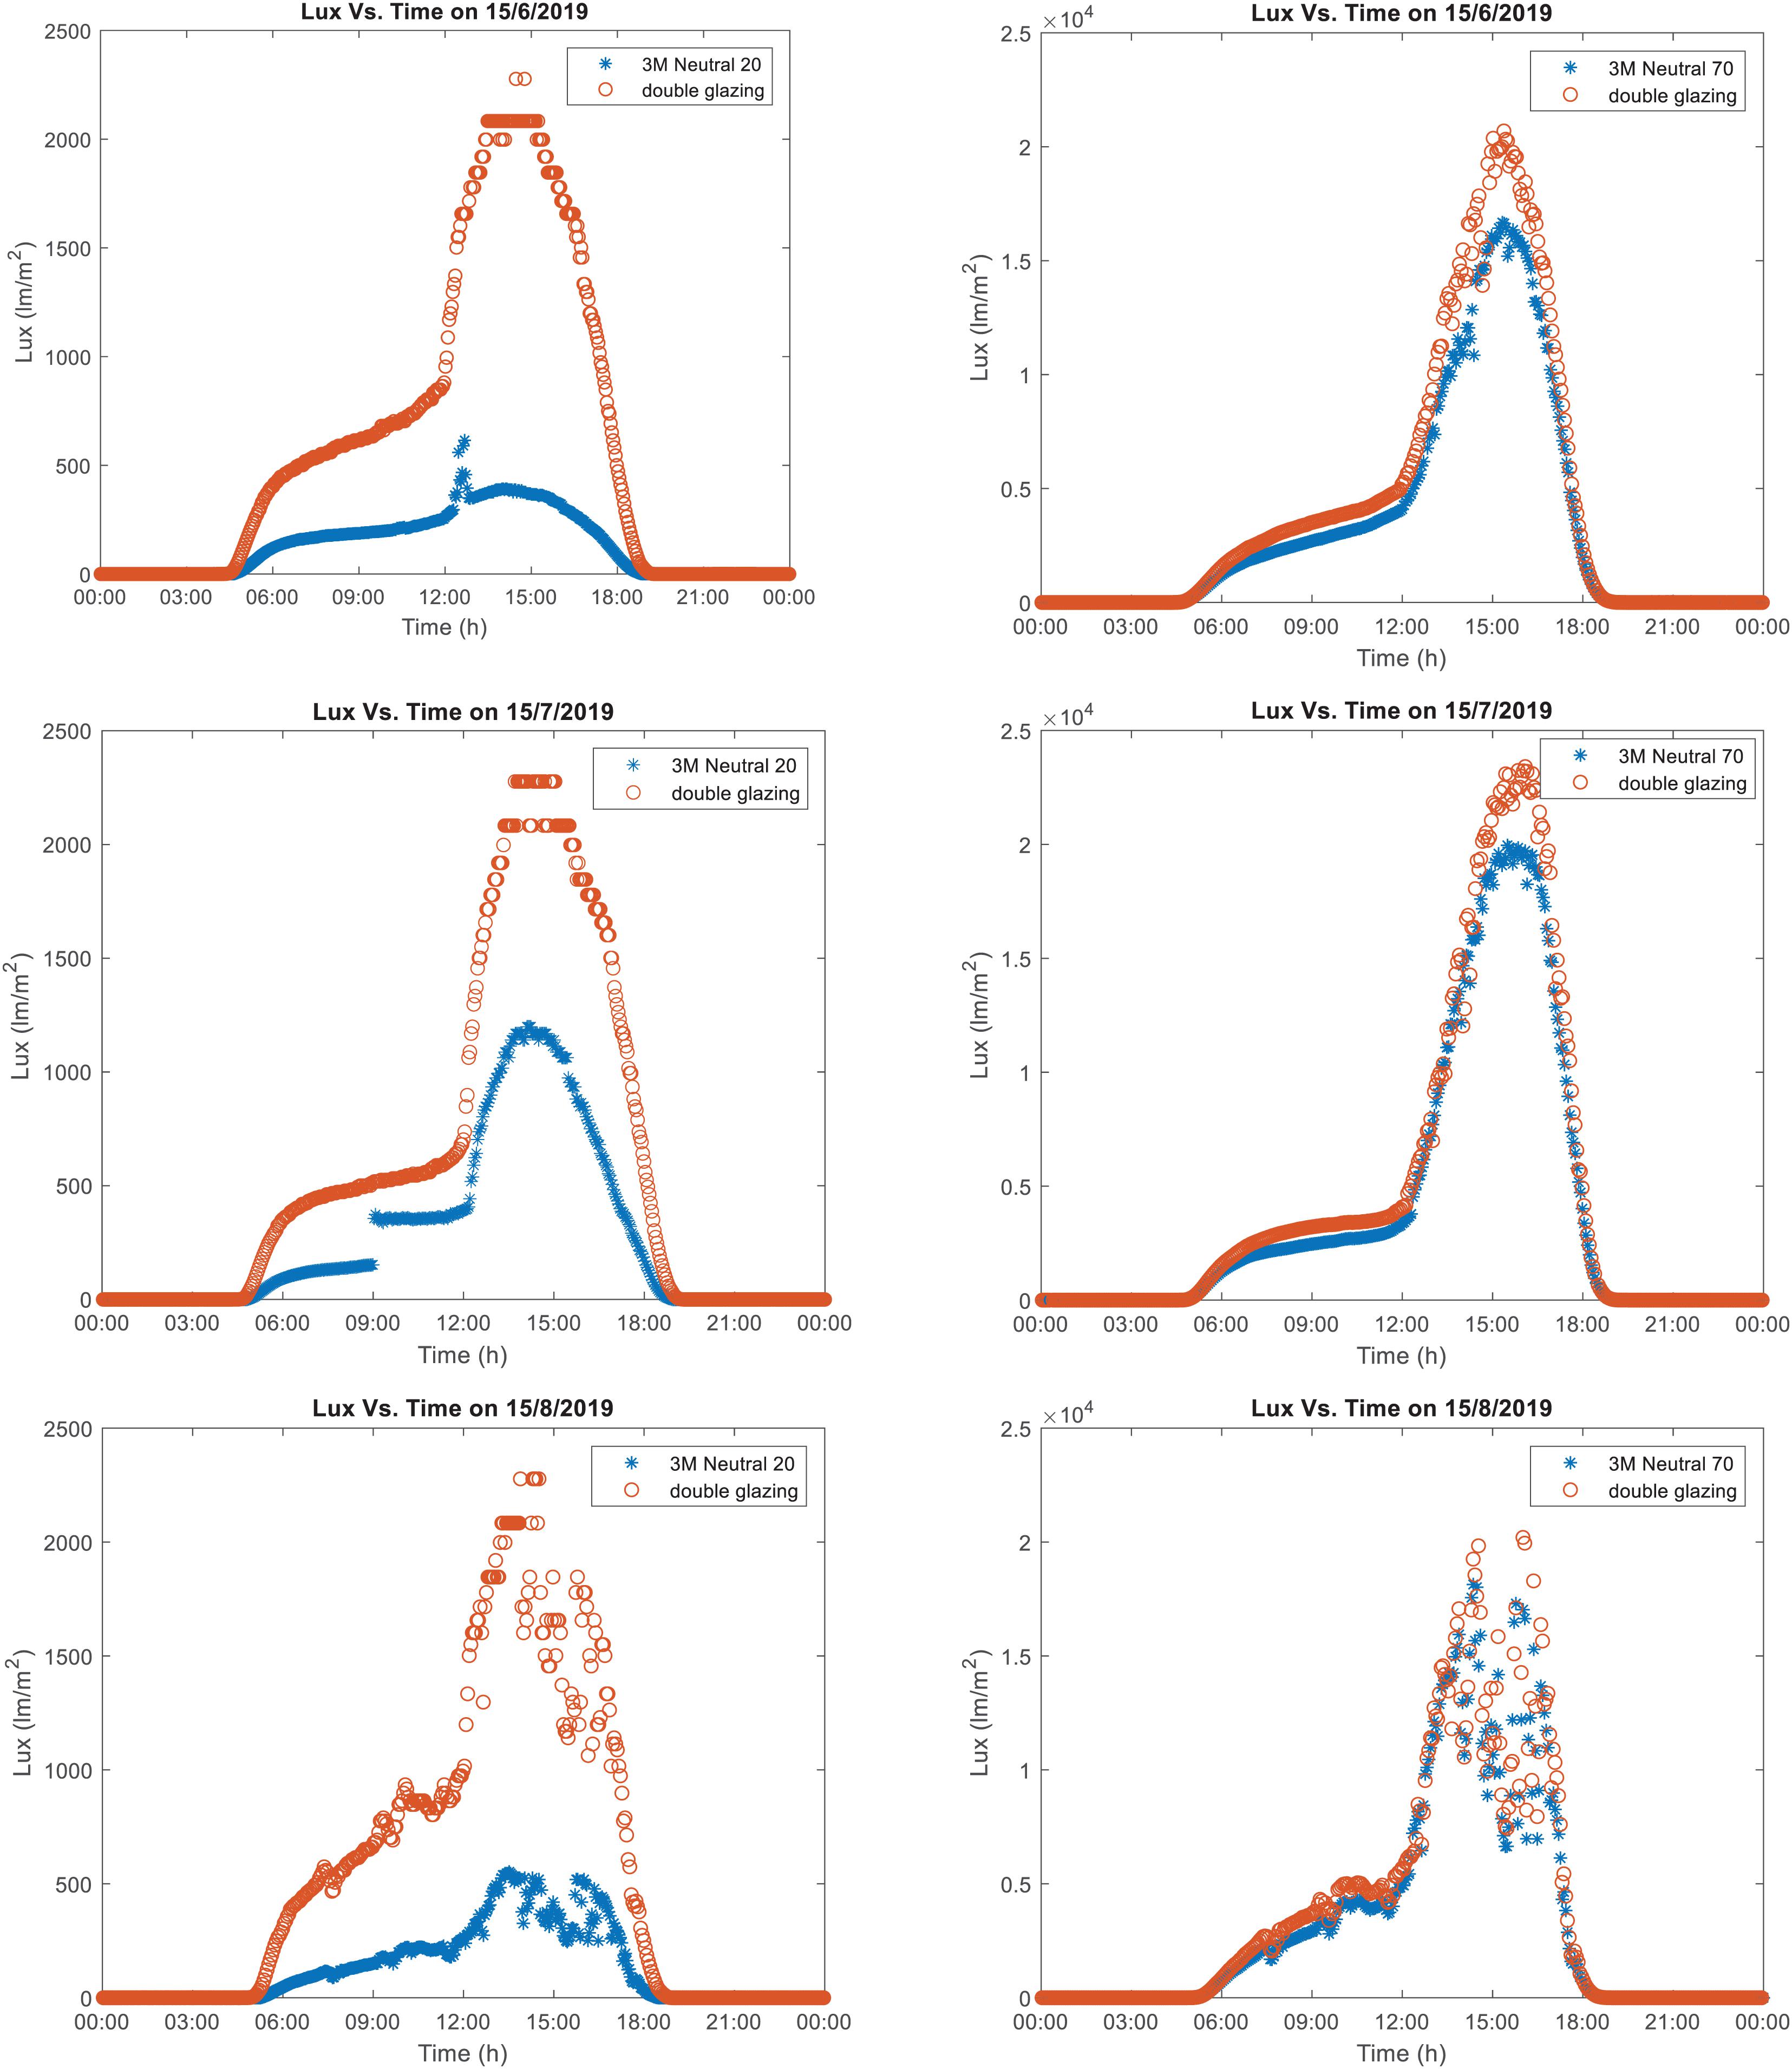
Figure 6. Illuminance of two offices with 3M Neutral 20 and 3M Neutral 70 window films on the 15th day of the months June, July, and August 2019.
Experimental Results
Daily experimental results for the month of June 2019 was reported by Sedaghat et al. (2020). In this paper, experimental data are only presented for two similar offices with/without 3M Neutral 20 window films. Figure 7 compares histograms and KDE distributions for these two offices for window glass temperature and relative humidity in the month of June 2019 which exhibited nearly double peak curves. A more obvious effect of the 3M Neutral 20 window film was on changing the double peaks structure of the relative humidity and increasing the upper band of temperature (except sensor 1).
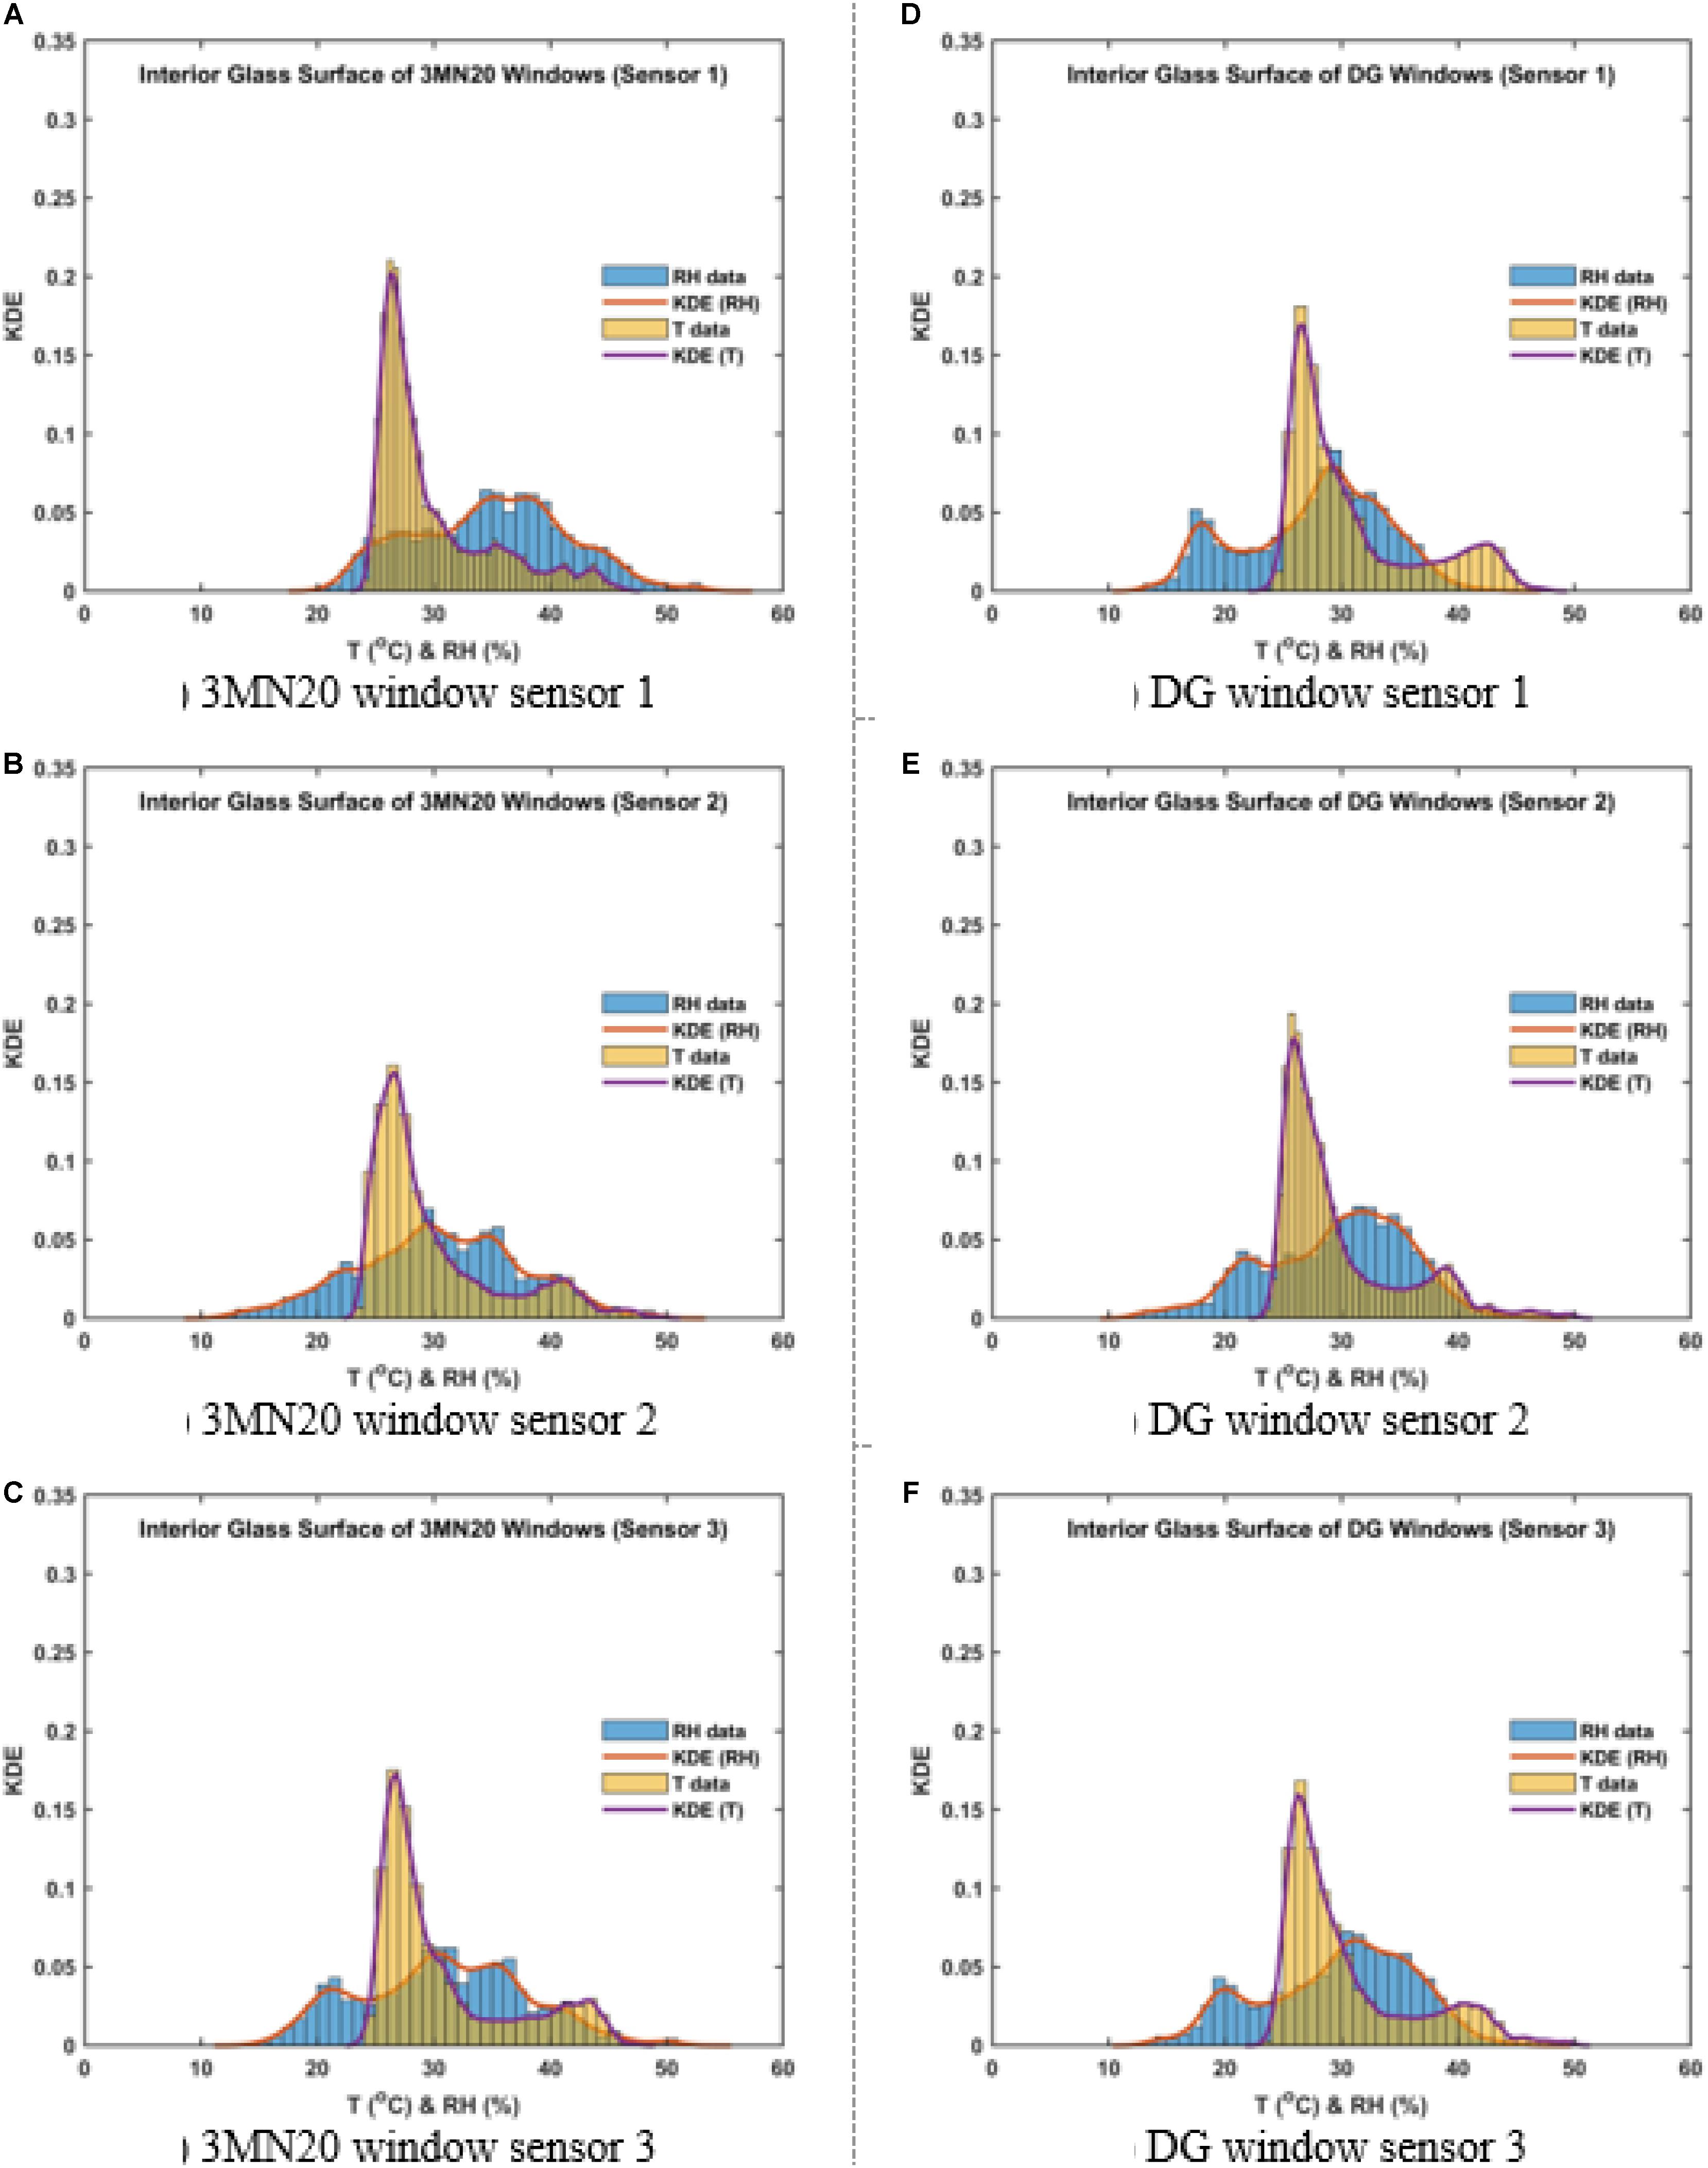
Figure 7. Histograms and kernel density estimation (KDE) of temperature (T) and relative humidity (RH) for three DHT22 sensors on the interior glass surface of windows during the month of July 2019; (A–C) 3MN20 windows, and (D–F) DG windows.
Figure 8 compares the combined KDE distribution for the two offices. More peaks appeared in the results for 3M Neutral 20 windows which obviously indicate the effects of the window films. These changes can be engineered by altering the architecture of window film layers for a desirable effect.
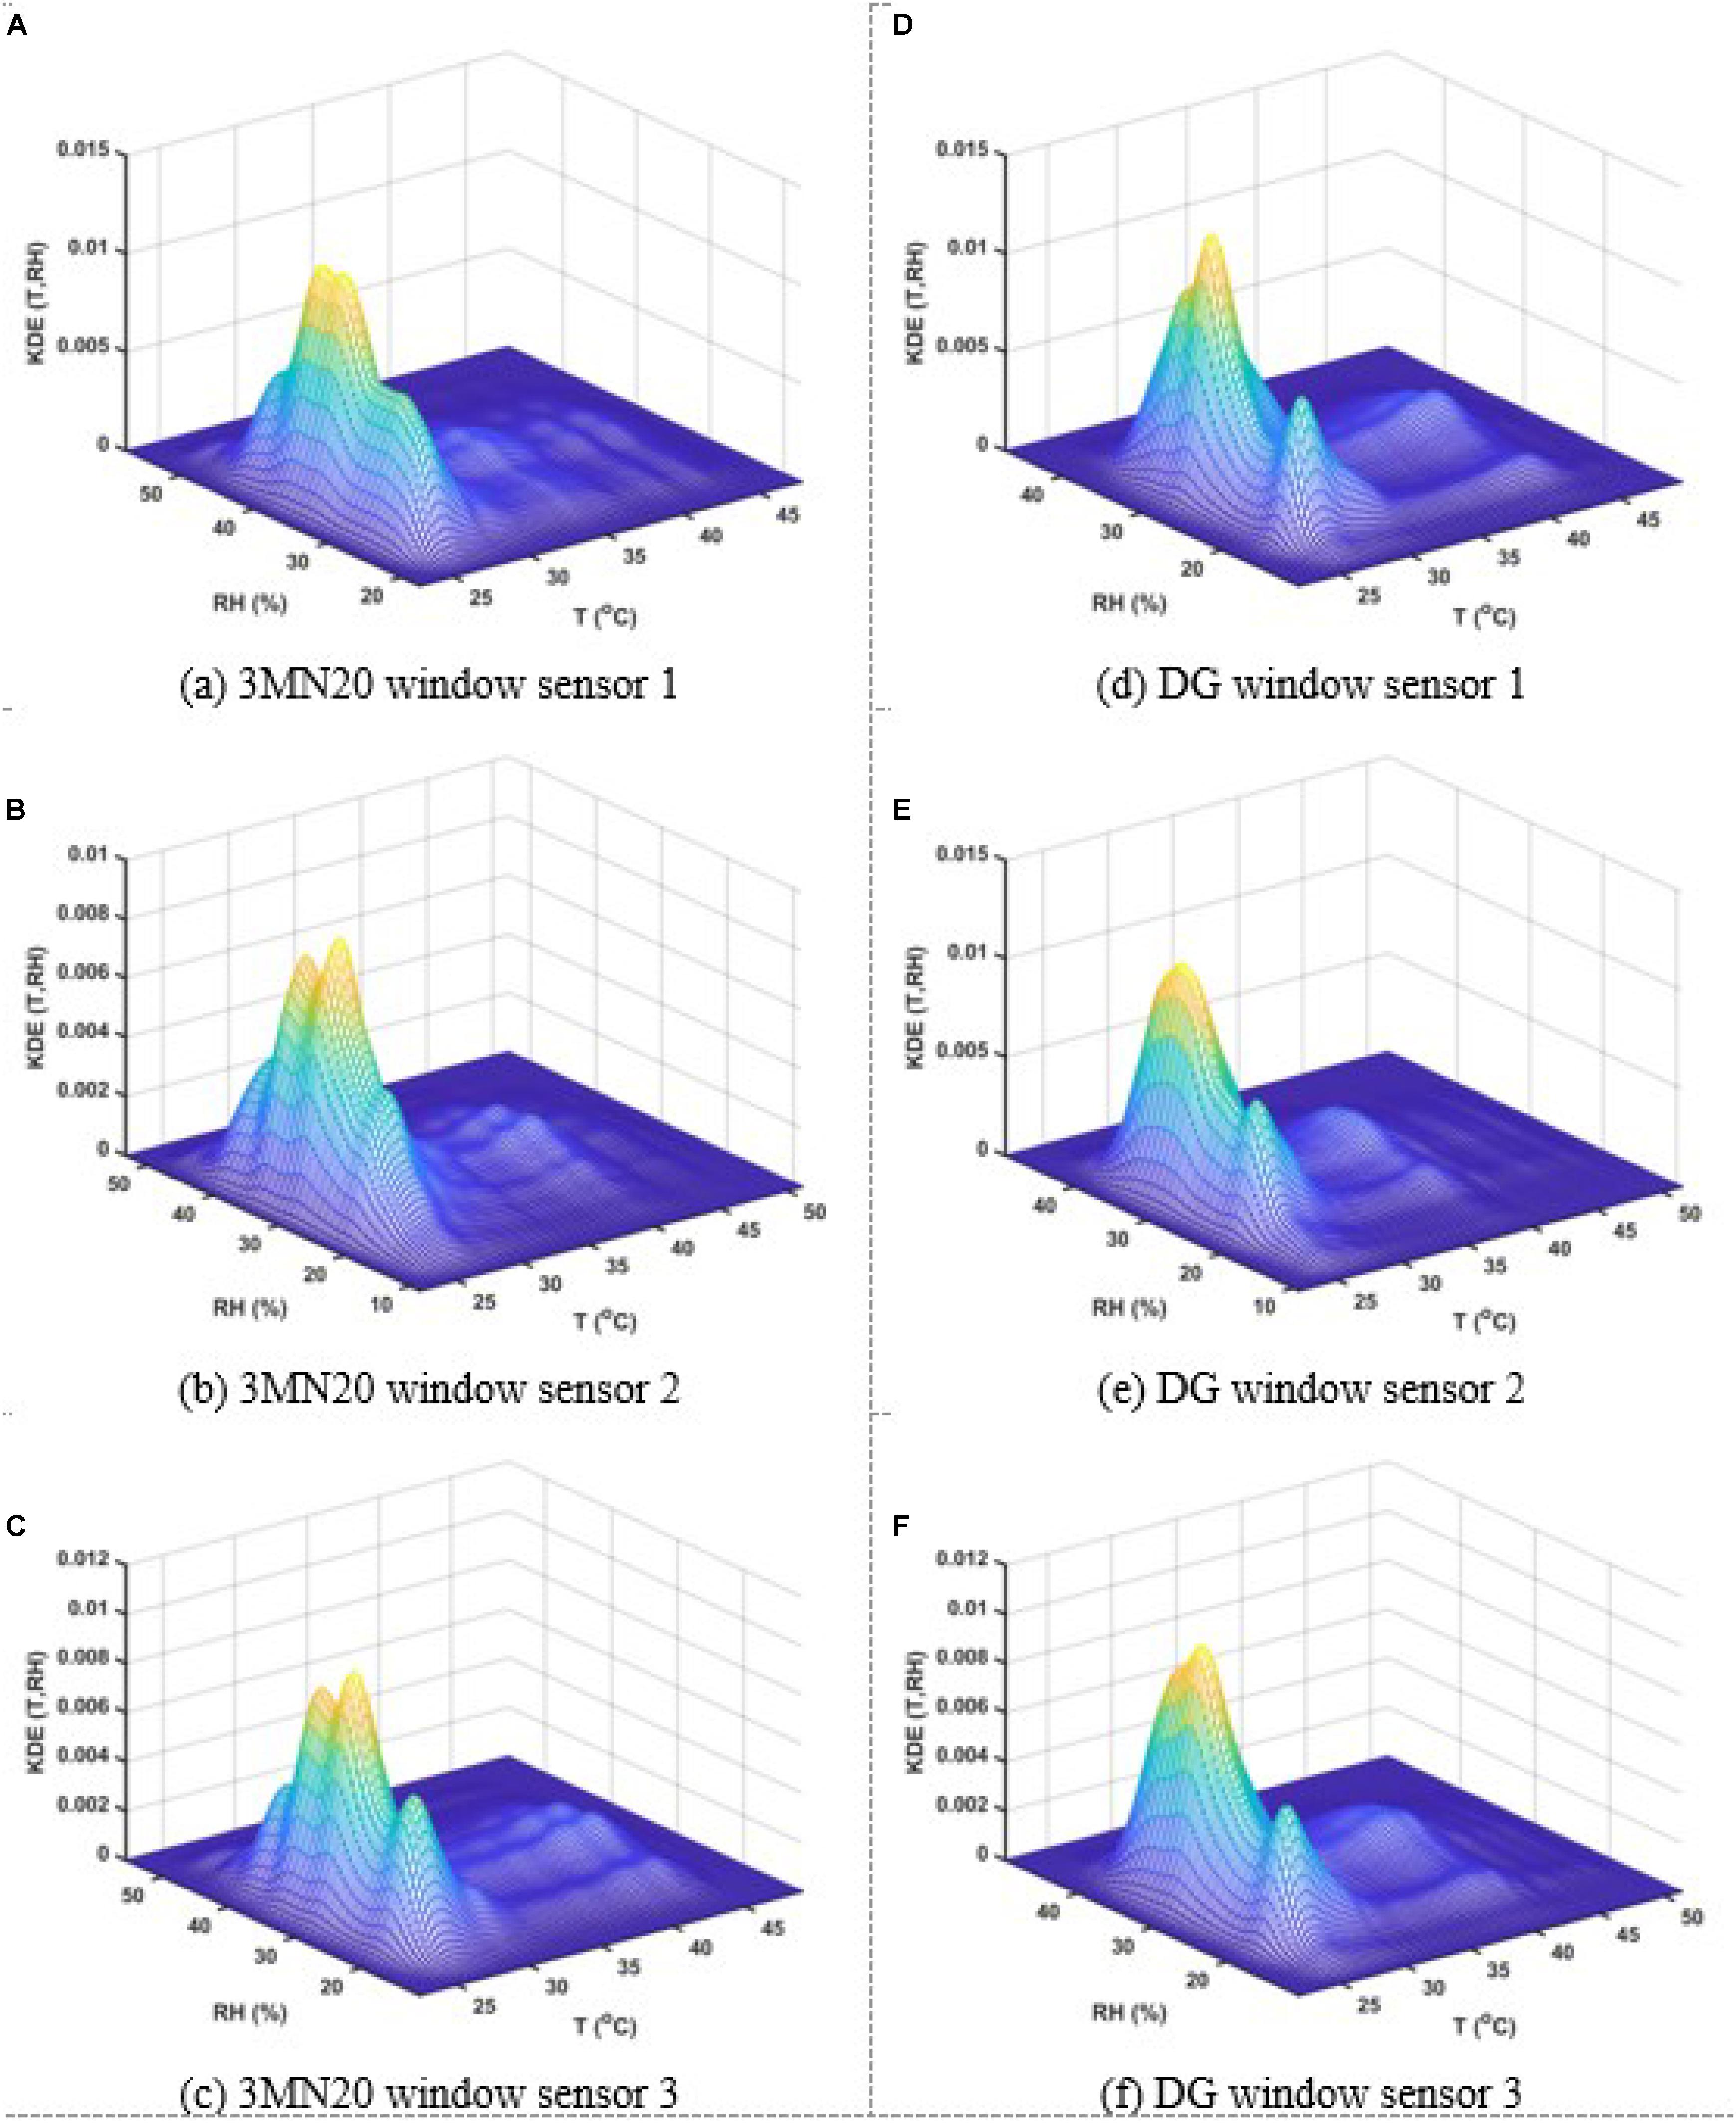
Figure 8. Combined kernel density estimation (KDE) of temperature (T) and relative humidity (RH) for three DHT22 sensors on the interior glass surface of windows during the month of July 2019; (A–C) 3MN20 windows, and (D–F) DG windows.
Figure 9 compares indoor/outdoor temperature/humidity of the two offices. The outdoor façade sensor predicted the same pattern for the two offices; but the indoor sensors clearly showed that relative humidity flattened and increased while interior temperature reduced in the office with 3M Neutral 20 window films.
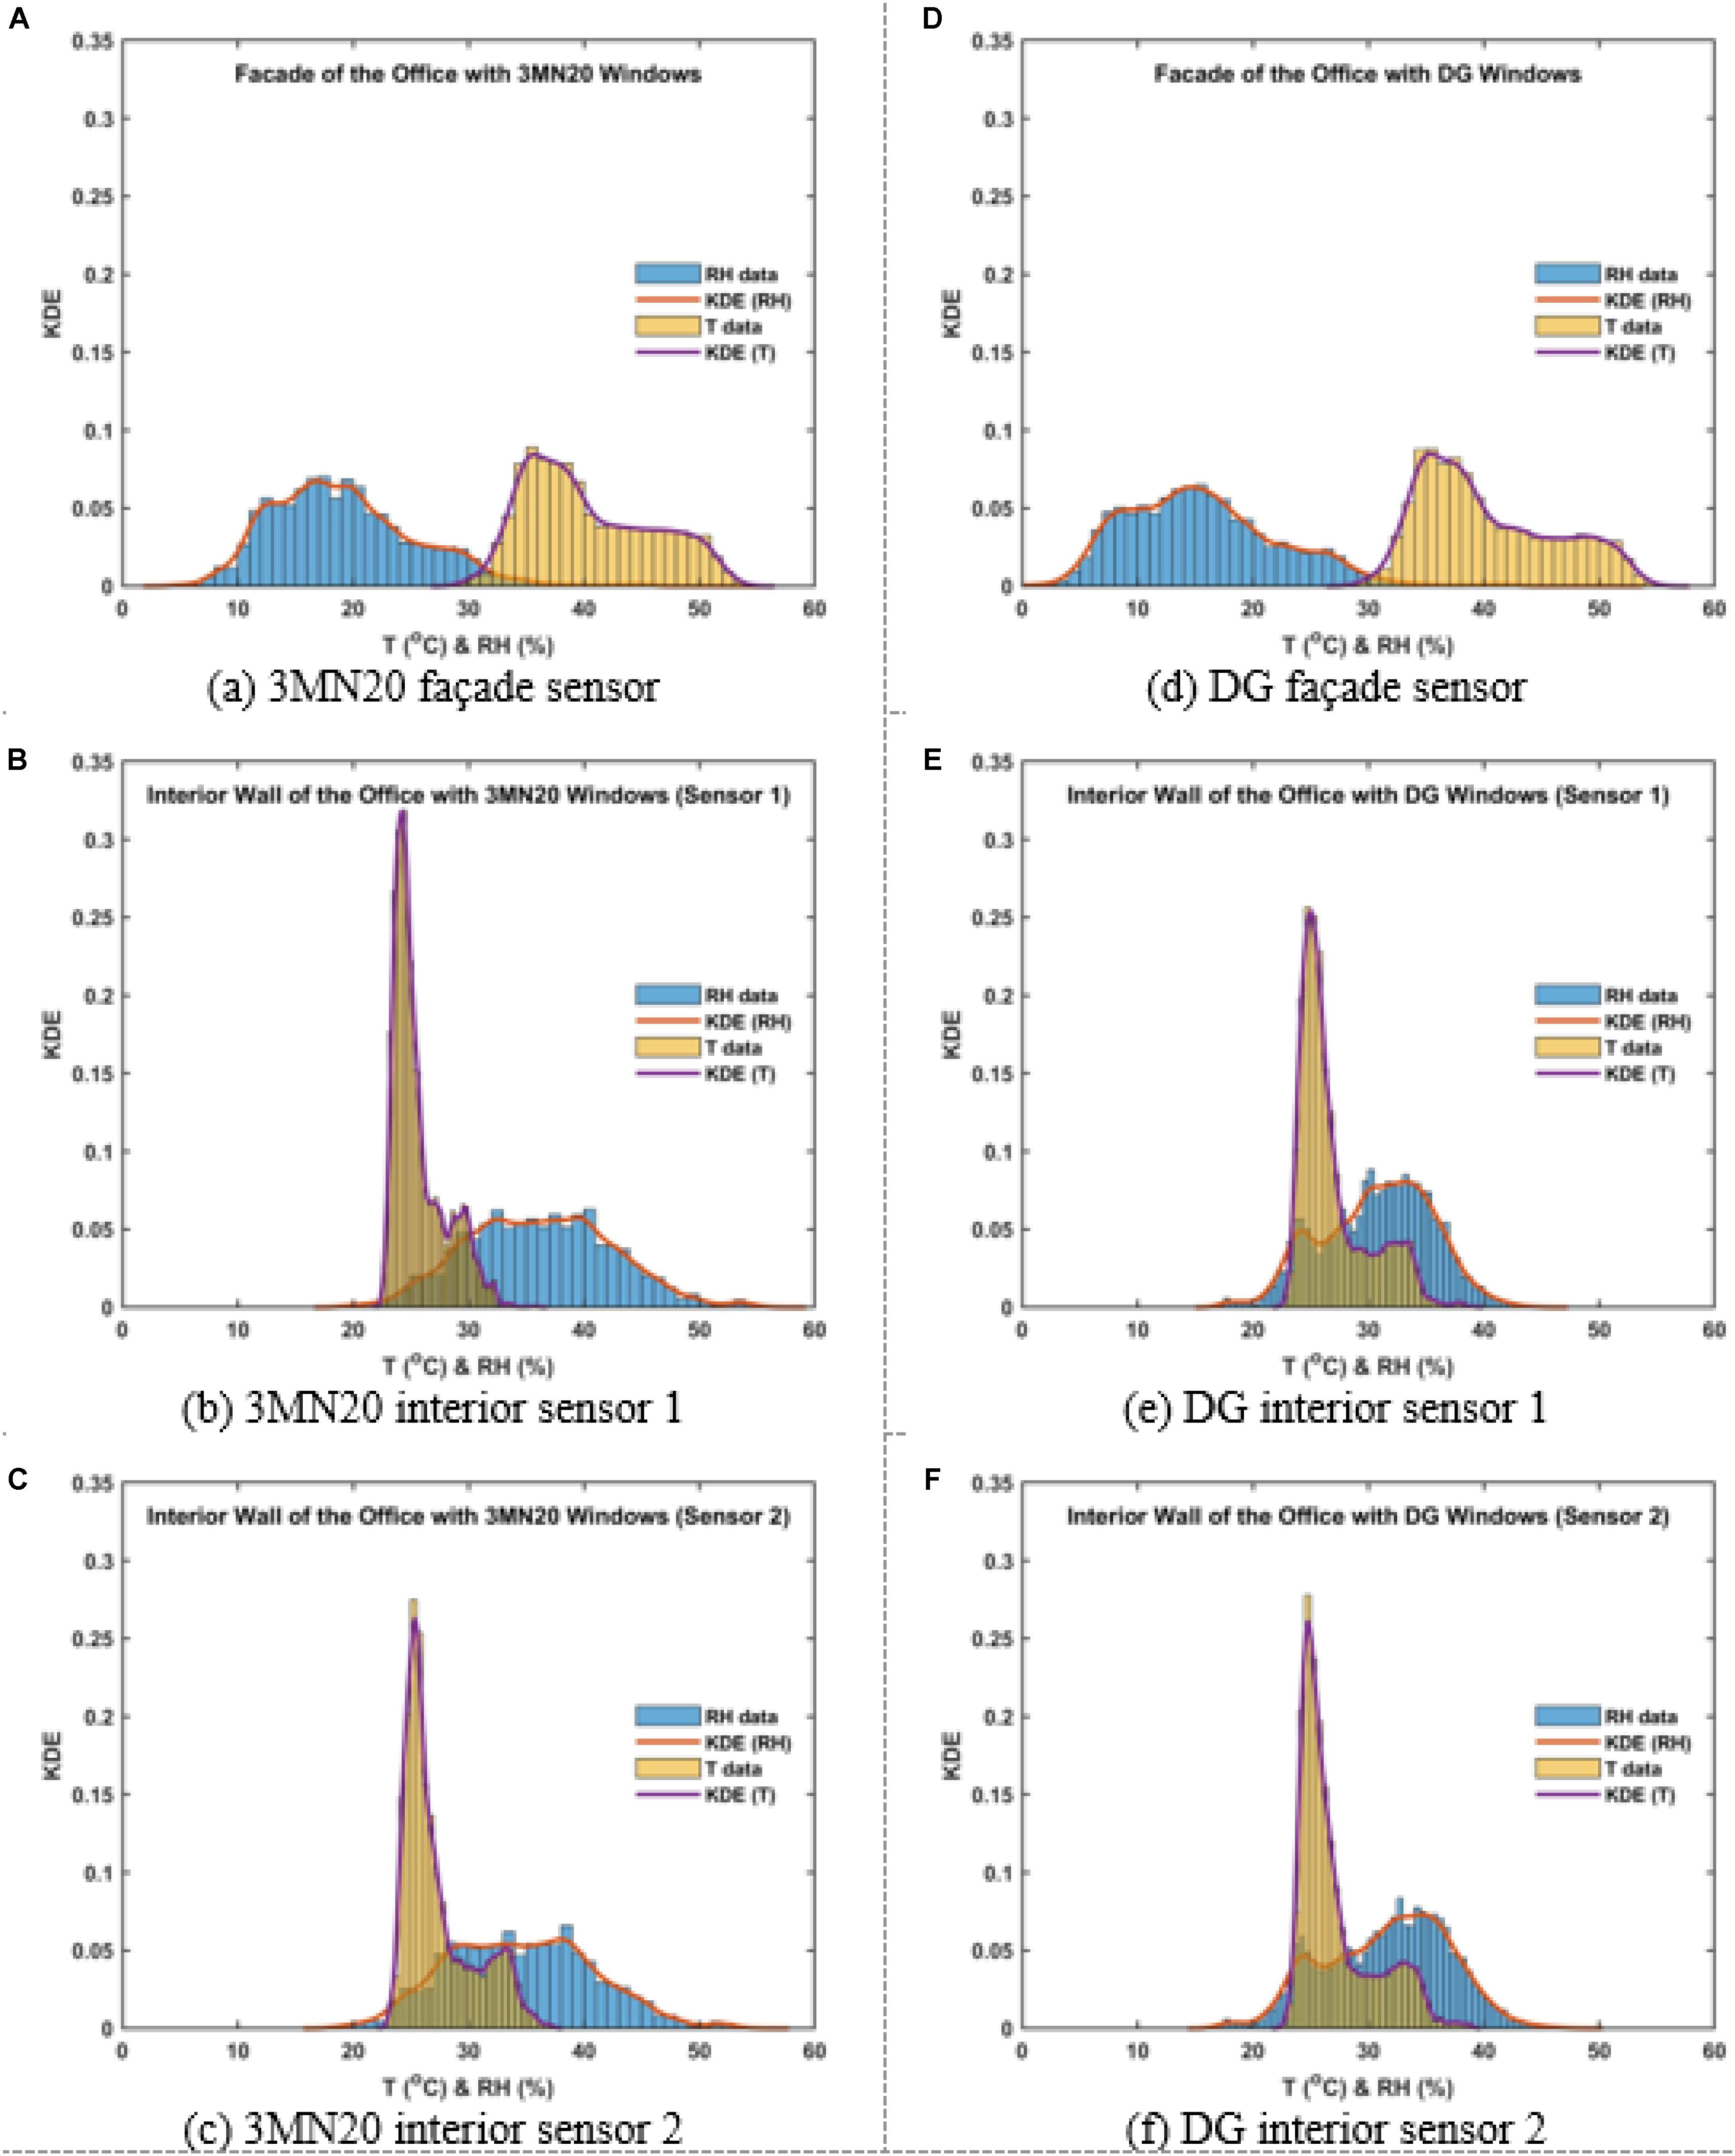
Figure 9. Histograms and kernel density estimation (KDE) of temperature (T) and relative humidity (RH) for three DHT22 sensors on the façade and interior wall surface of offices during the month of July 2019; (A–C) 3MN20 windows, and (D–F) DG windows.
Figure 10 compares the structure of indoor/outdoor combined KDE with a more flattened structure for the offices with the window films.
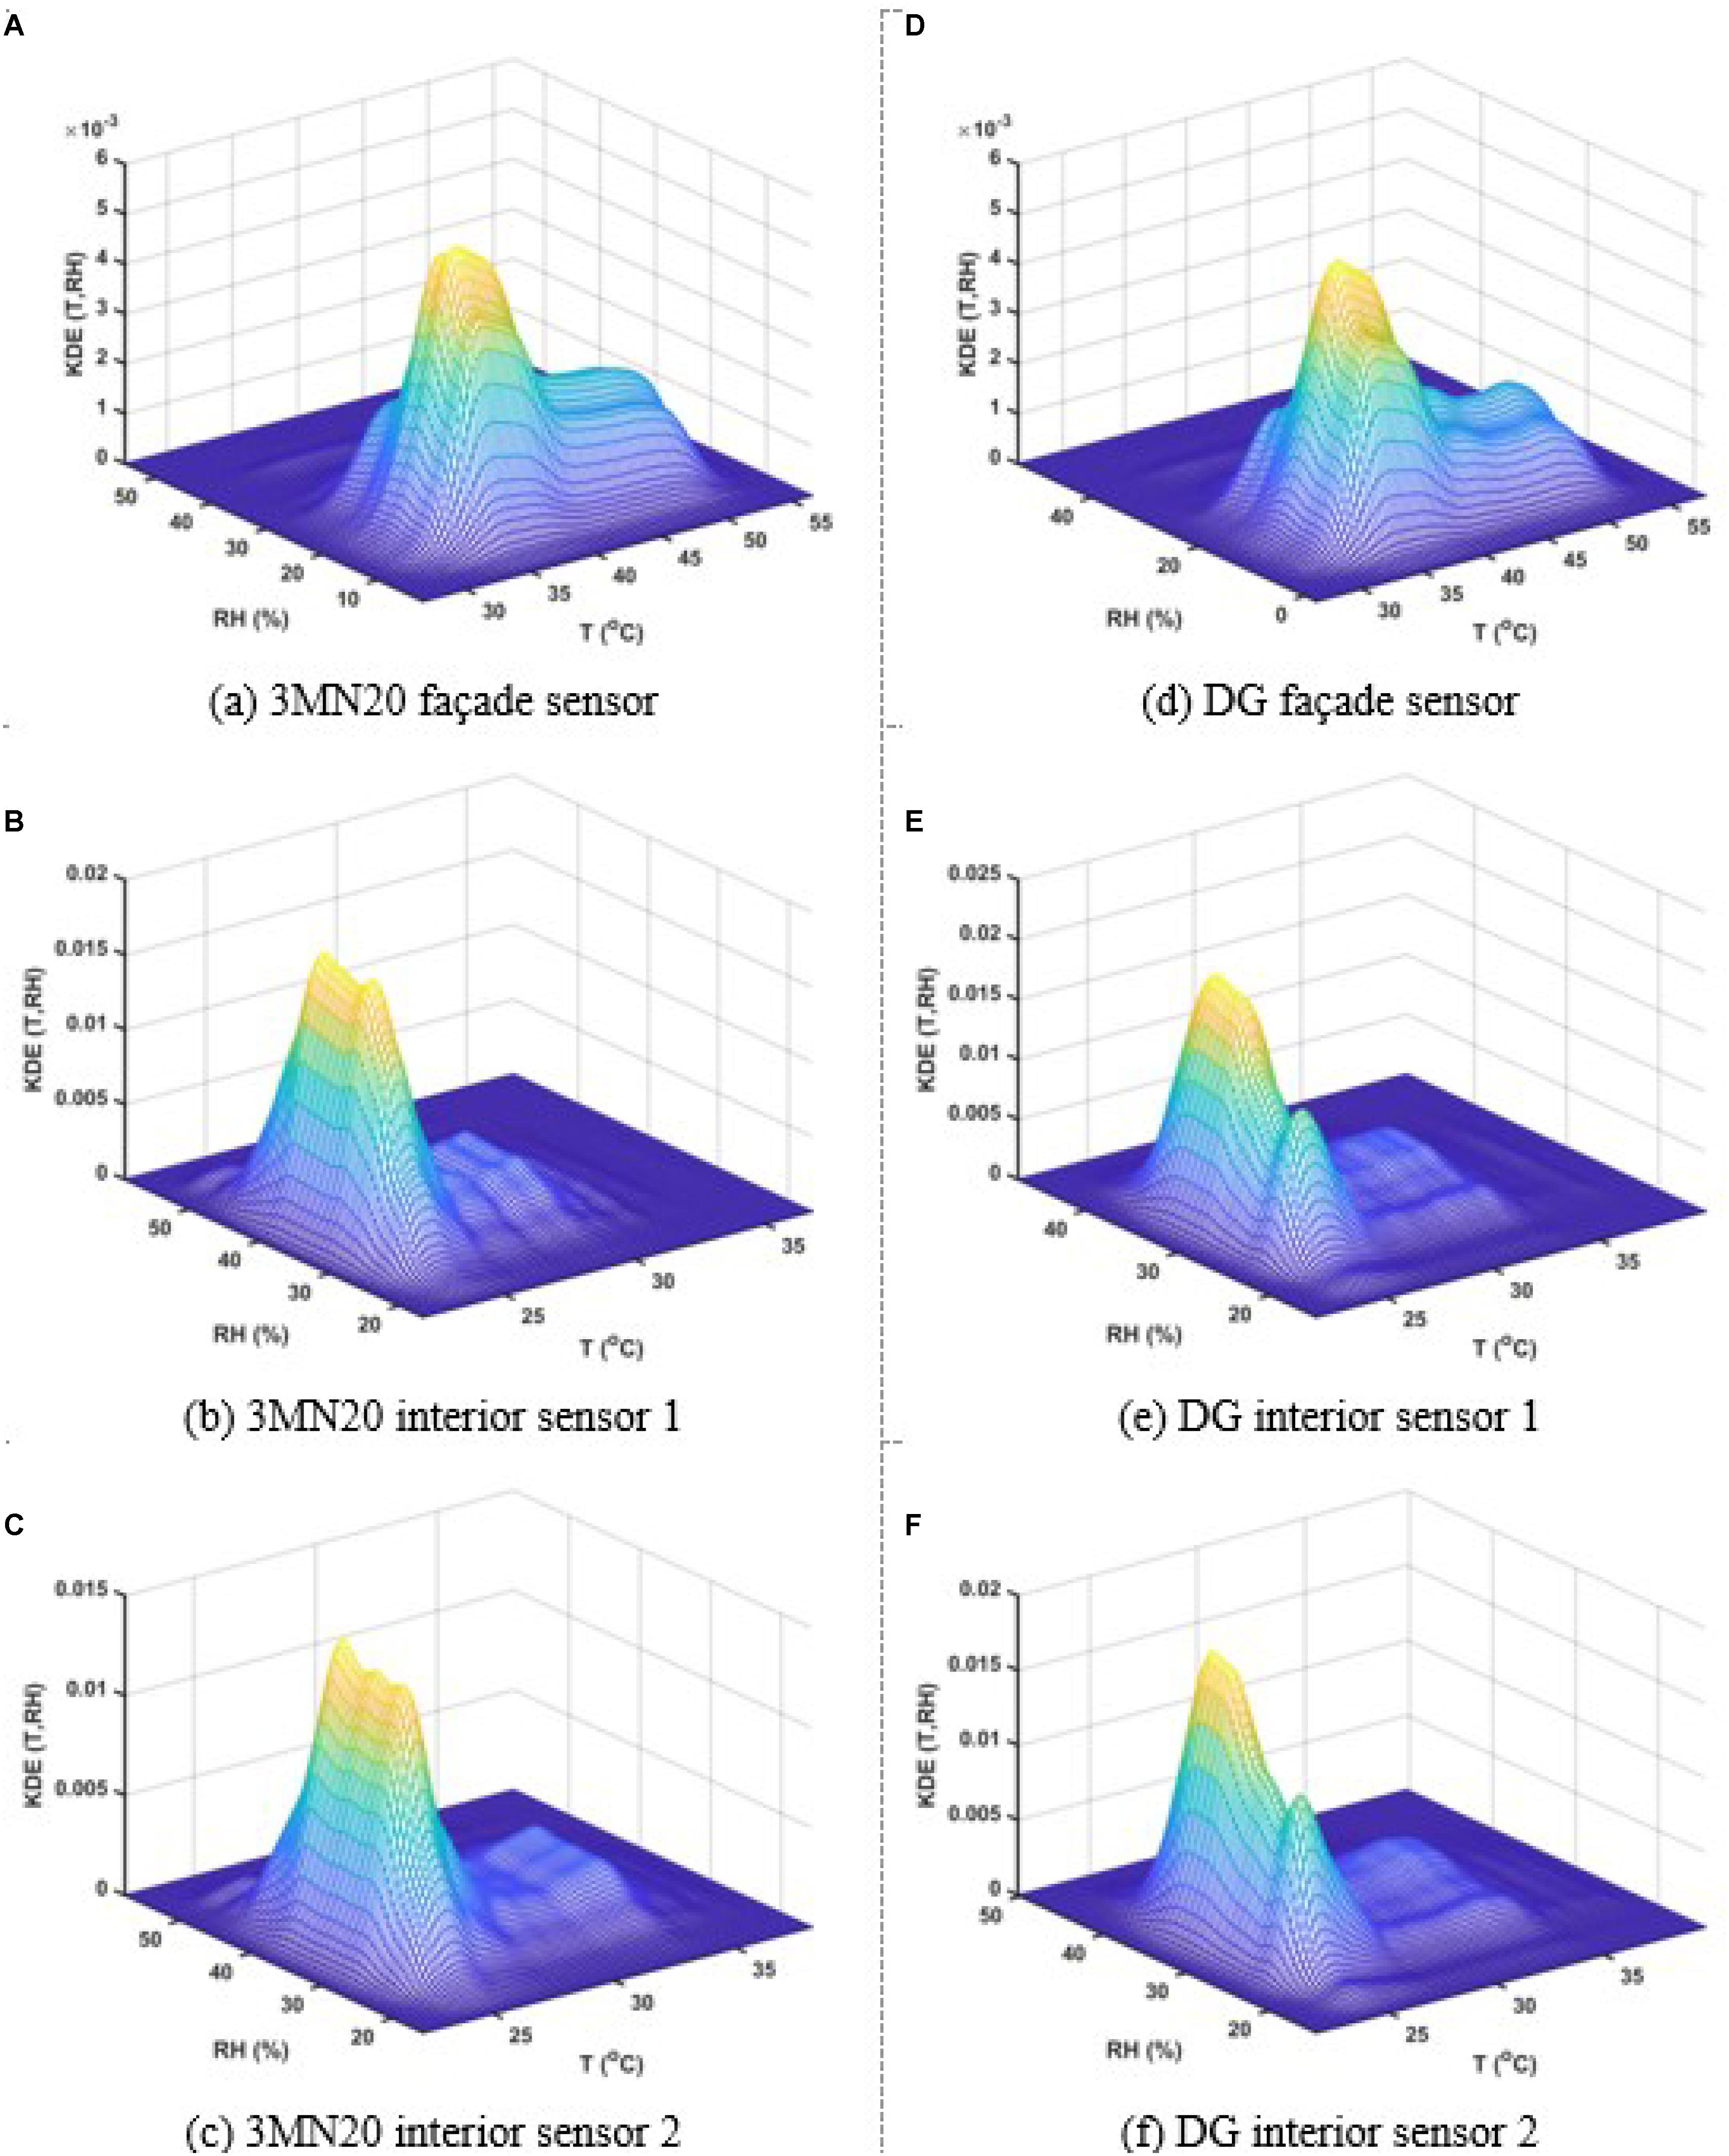
Figure 10. Combined kernel density estimation (KDE) of temperature (T) and relative humidity (RH) for three DHT22 sensors on the façade and interior wall surface of offices during the month of July 2019; (A–C) 3MN20 windows, and (D–F) DG windows.
Figure 11 compares minimum-mean-maximum temperature and relative humidity of the two offices. No considerable changes were observed between measurements on the interior side of the glass for the two offices (except sensor 1) which indicated the safe operation of the window films.
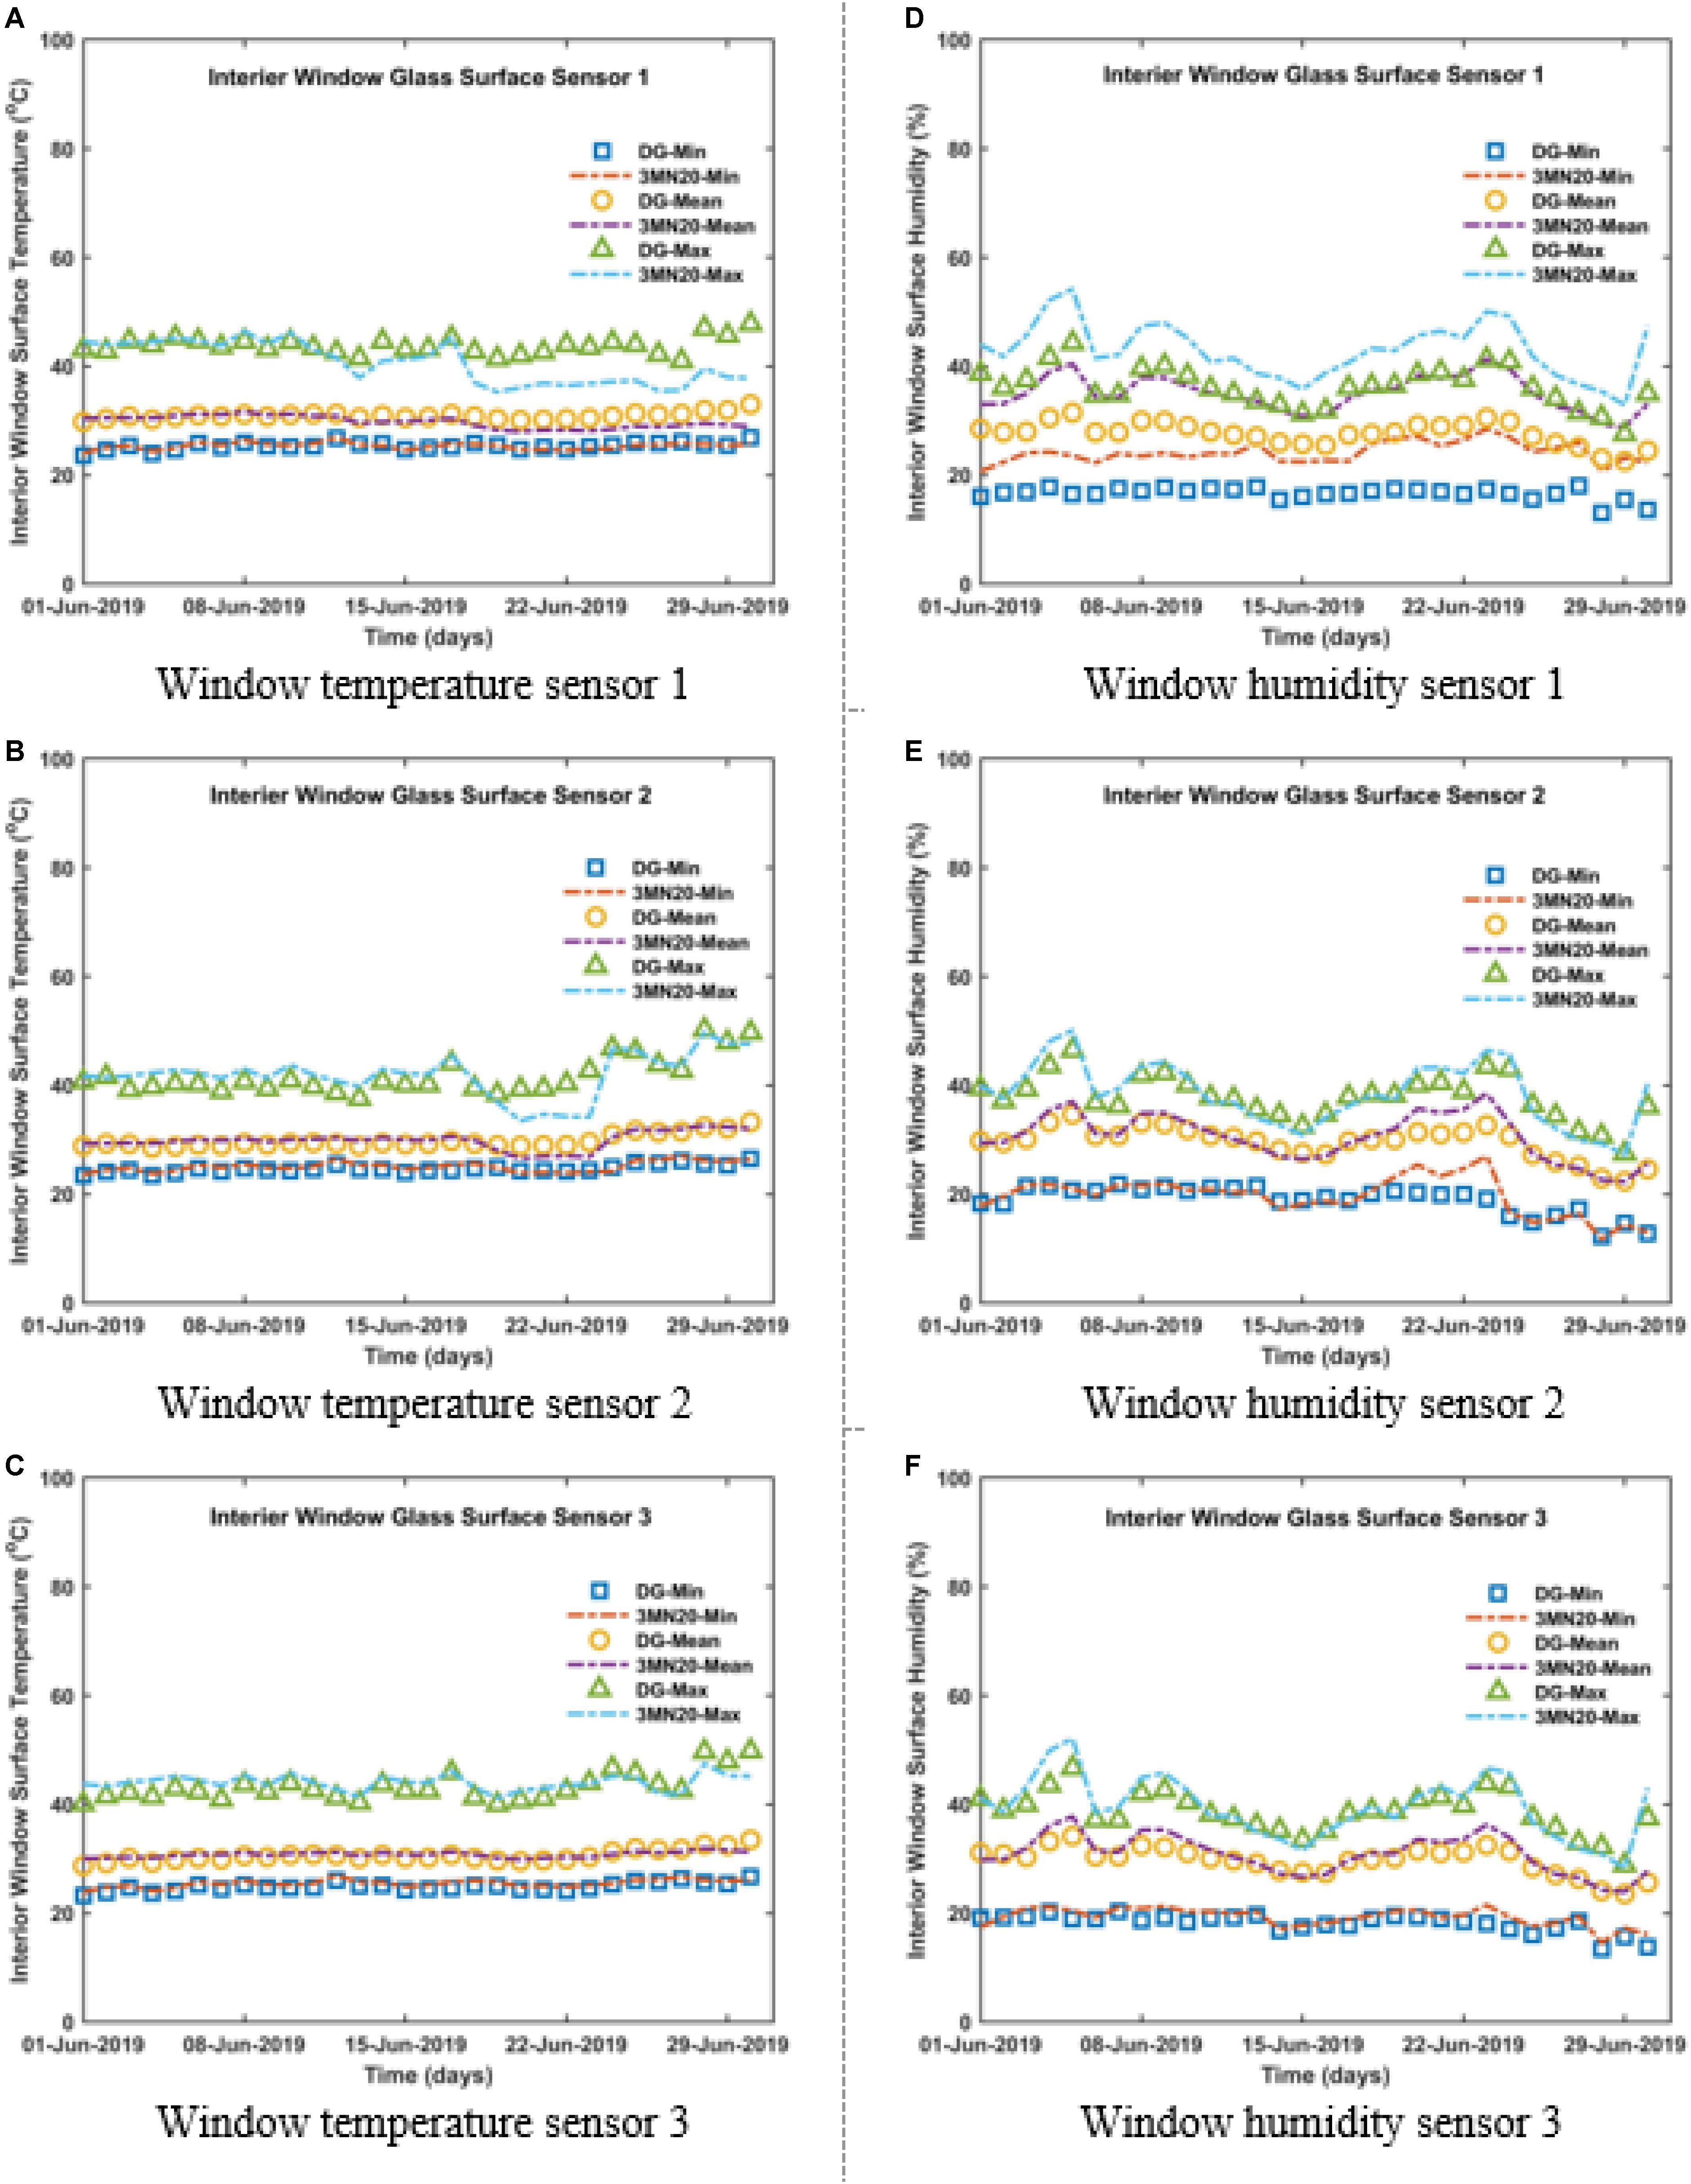
Figure 11. Temperature and humidity (max-mean-min) for three DHT22 sensors on the interior glass surface of the offices with double glazing (DG) and 3M Neutral 20 (3MN20) windows during the month of July 2019; (A–C) temperatures, and (D–F) humidity variations.
Figure 12 compares the façade and interior air temperature and humidity of the two offices. Slightly higher humidity in the façade of the office with double glazing was mainly due to higher elevation (third floor). Interior temperature of the office with window films was 2°C to 5°C colder and humidity was usually 5% higher which indicated a positive effect of the window films.
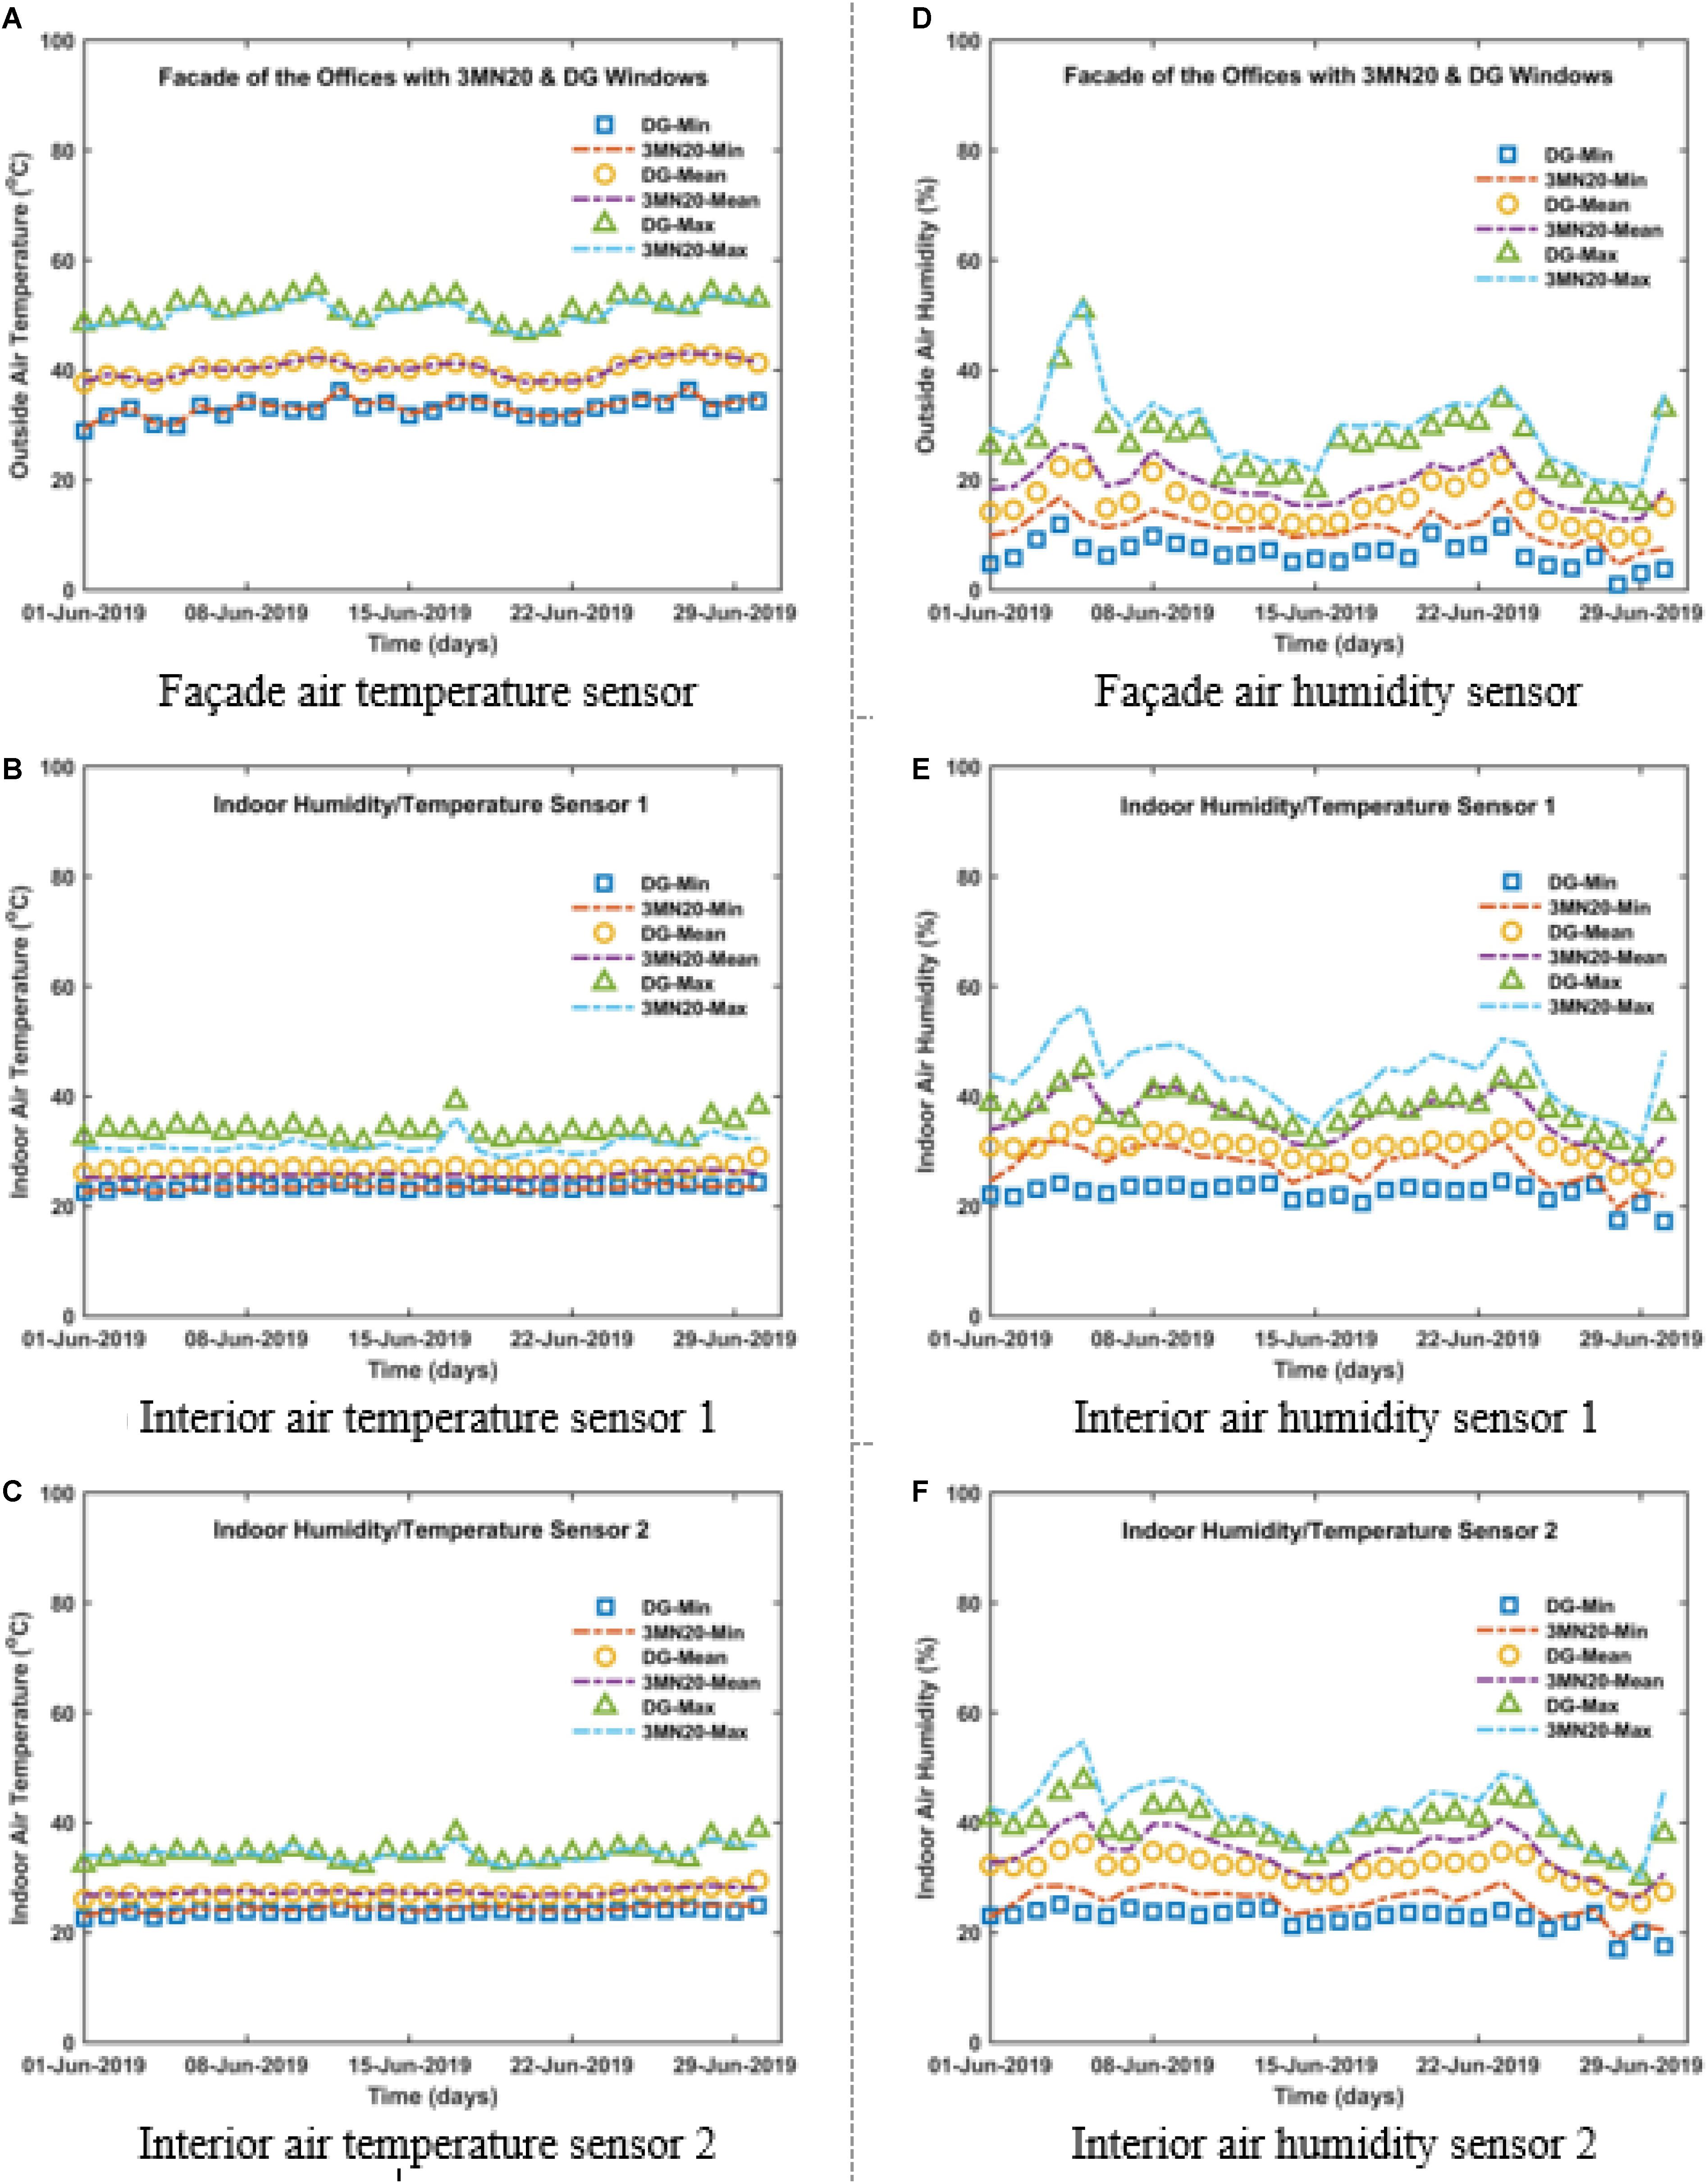
Figure 12. Façade and interior air temperature and humidity for three DHT22 sensors for the offices with double glazing (DG) and 3M Neutral 20 (3MN20) windows during the month of July 2019; (A–C) temperatures, and (D–F) humidity variations.
The same results discussed here from Figures 7 to 12 are presented for the month of June 2019 in Supplementary Appendix A (Supplementary Appendix Figures A1–A6) and for the month of August 2019 in Supplementary Appendix B (Supplementary Appendix Figures B1–B6).
Simulation Results
Two floors of the ACK building were fully modeled in the Design Builder software. Figure 13 shows the image of the building and the modeled planform for the third floor.
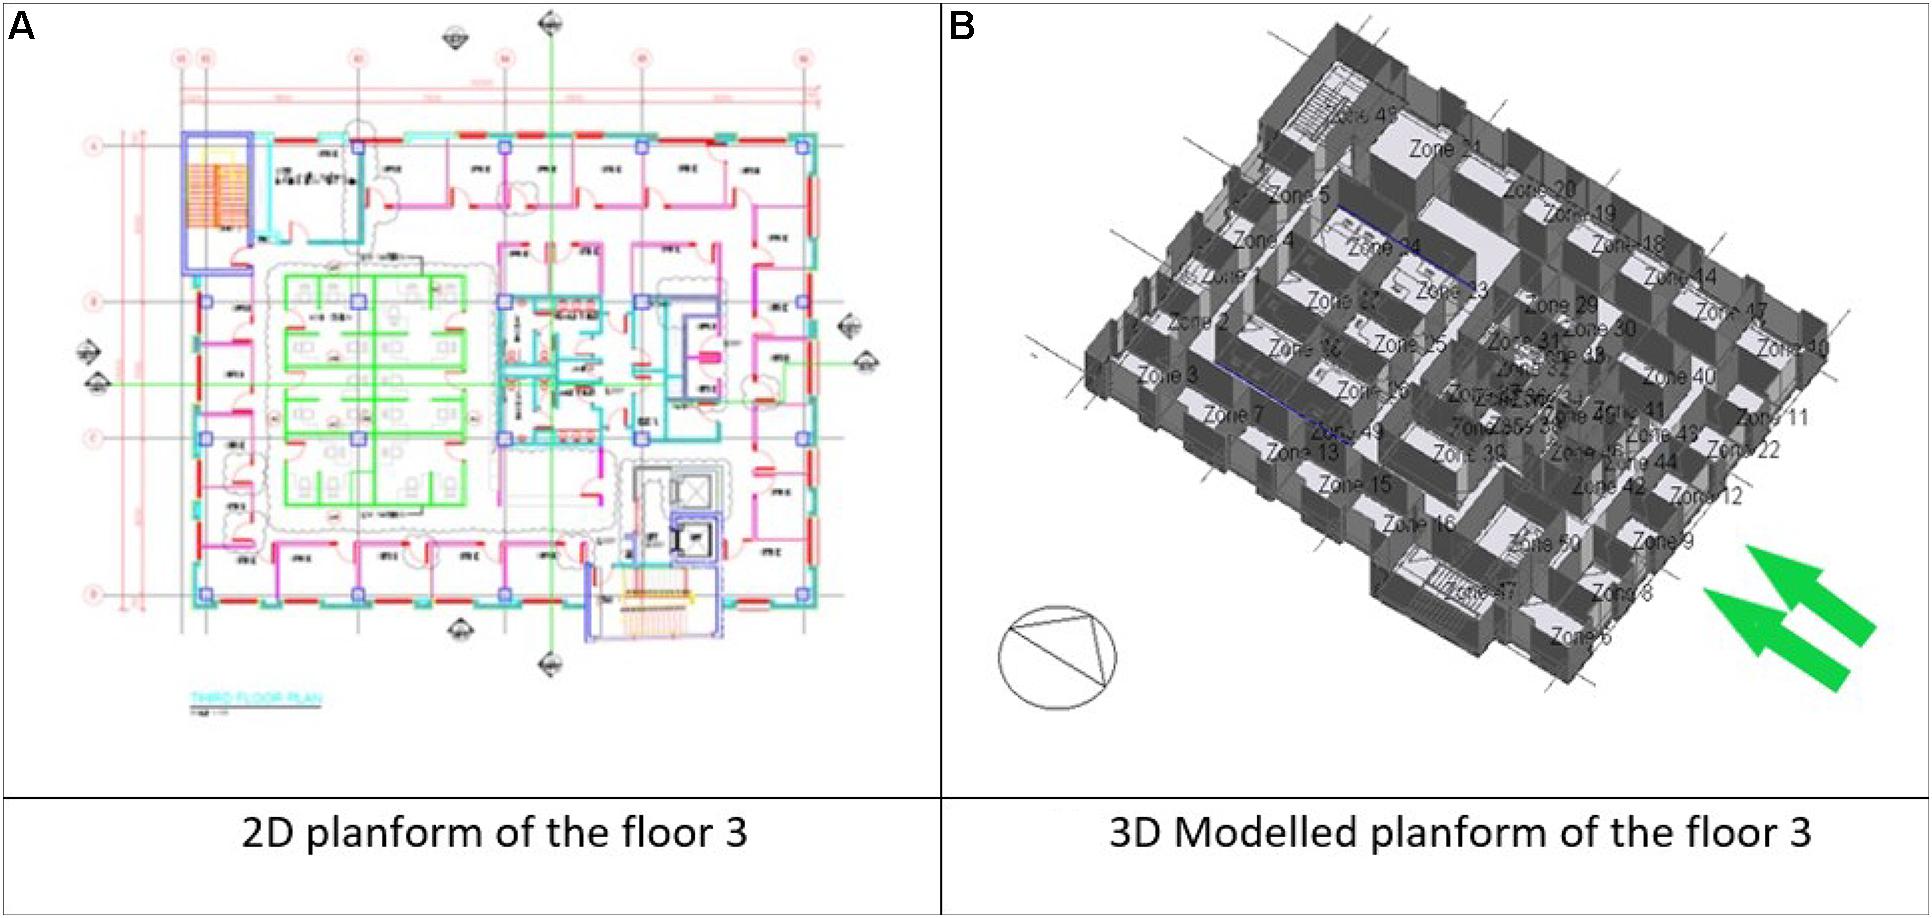
Figure 13. 2D and 3D planforms of the floor 3 in the ACK building. (A) 2D planform. (B) 3D modelled planform (Sedaghat et al., 2021).
Then, the selected floors were simulated using Energy Plus software. The location and operation times with human encounters should be included in the software. The materials of the walls, partitions, windows, window films, floors, and roofs have been specified in the Design Builder software. To communicate with Energy Plus software, the interior design, thermal properties, heating/cooling system, and lighting system must be specified.
Four cases were selected for validating the Design Builder software with experimental data for a 24 h period on the day of June 10, 2019. Case 1 corresponds to the office on the second floor where the 3M Neutral 20 window films were installed. Case 2 refers to the office on the second floor where the 3M Neutral 70 window films were installed. Case 3 refers to a similar office to Case 1 located on the third floor without window films (only double-glazed). Case 4 refers to a similar office to Case 2 located on the third floor without window films with only double glazing. Experimental results presented in this article only correspond to the Cases 1 and 3 due to the large amount of data; however, simulation results are compared here.
Table 6 compares the maximum error between window temperatures of the four offices obtained from the simulation and experiment on June 10, 2019. It was observed that the maximum error was below 5% which is acceptable in engineering practices.
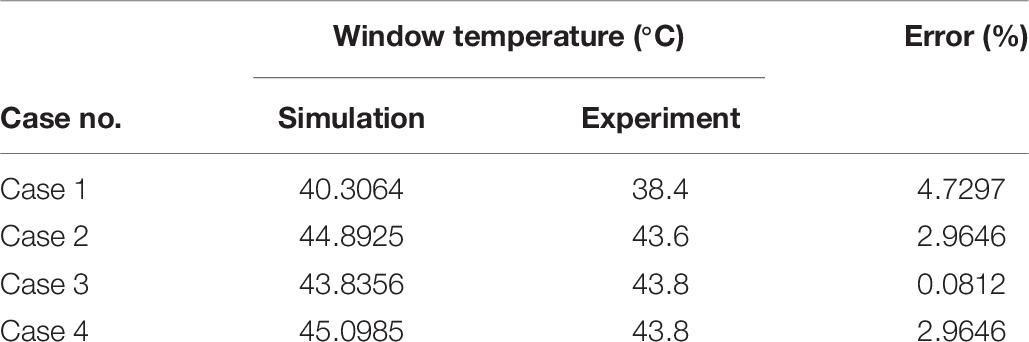
Table 6. Compression of maximum error between experiment and simulation of window temperatures for the four cases on June 10, 2019 (Sedaghat et al., 2021).
Once the Design Builder was calibrated and fine-tuned with experimental data then Energy Plus software was used to simulate floor 2 and floor 3 of the ACK building for electrical energy consumption and carbon dioxide production. Simulation results on electrical energy consumption and carbon dioxide production for the 3 months of June, July, and August 2019 are shown in Figure 14. For one floor of the ACK building in June 2019, detailed simulations on CO2 footprint reduction and energy saving are listed in Tables 7, 8, respectively, using double glazing with/without 3M Neutral 20, 3M Neutral 70, SOL 101, and SOL 102 window films for the summer months in Kuwait. As observed in Tables 7, 8, the highest CO2 footprint reduction and energy saving corresponded to the value of 2.76% for SOL 101.
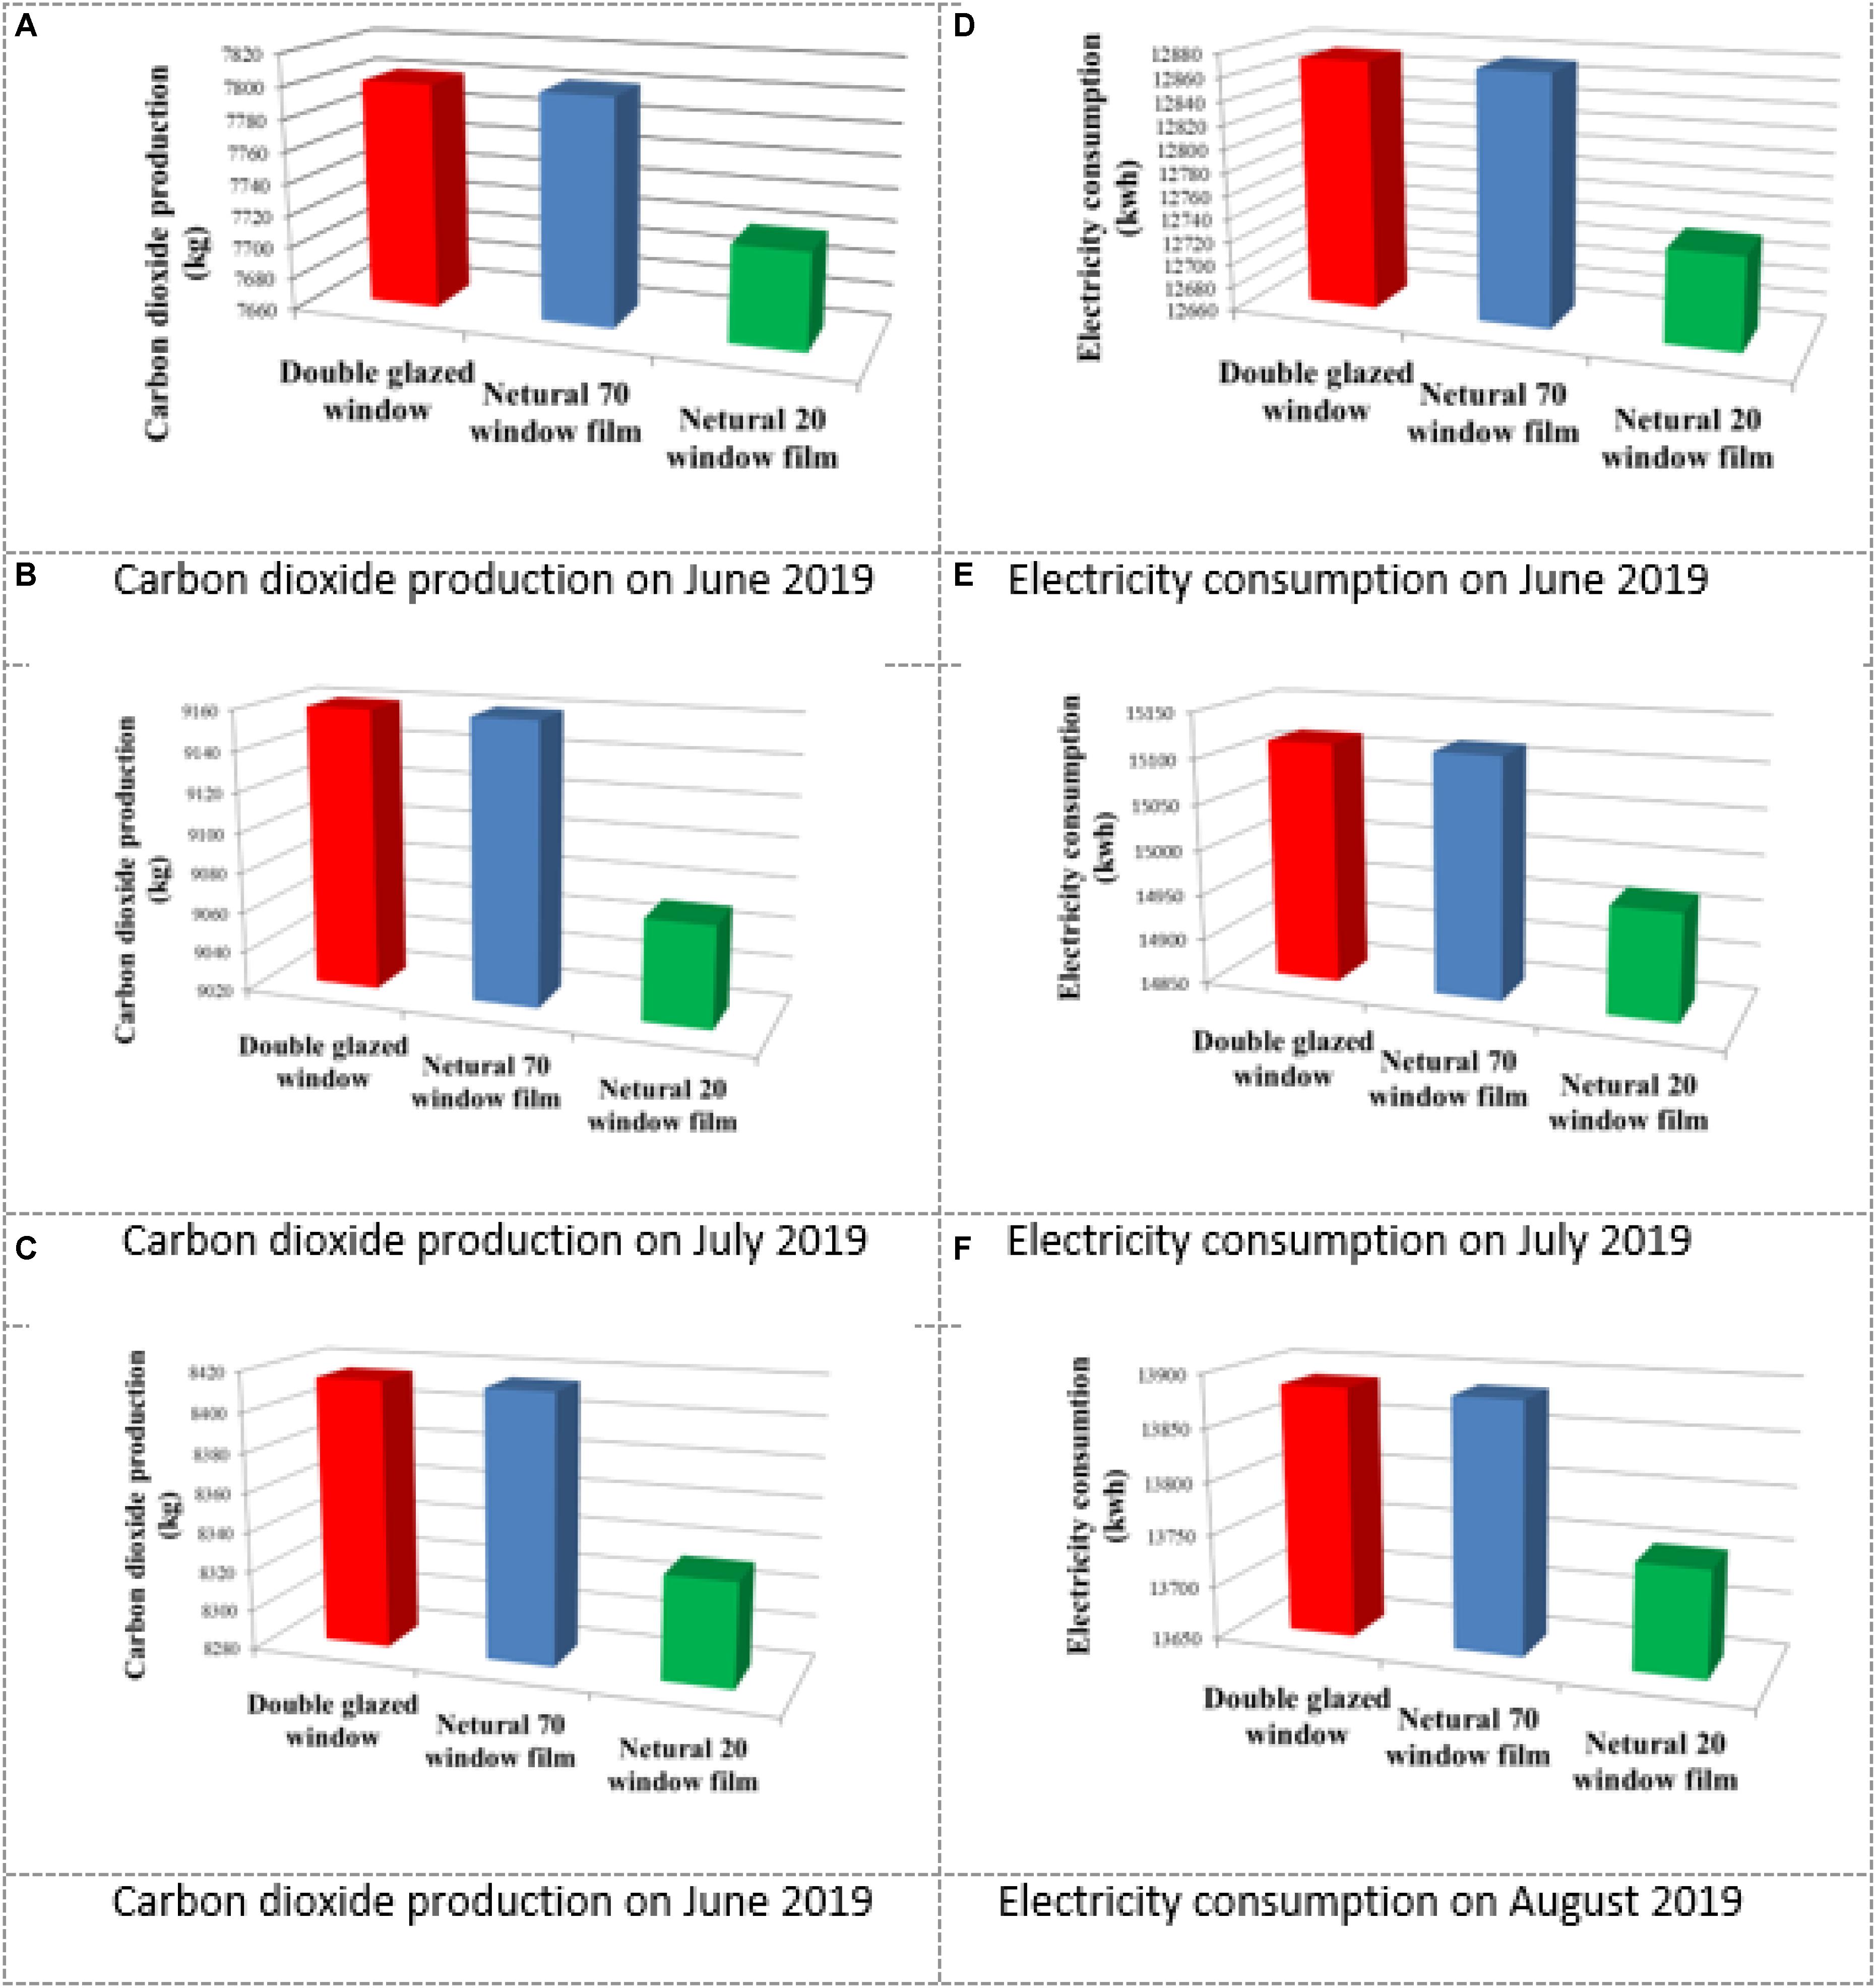
Figure 14. Comparison of carbon dioxide production and electricity consumption of four offices in the ACK building using double-glazed windows with/without 3M Neutral 70 and 3M Neutral 20 window films in summer 2019 in Kuwait. (A) CO2 production on June 2019. (B) CO2 production on July 2019. (C) CO2 production on August 2019. (D) Electricity consumption on June 2019. (E) Electricity consumption on July 2019. (F) Electricity consumption on August 2019.
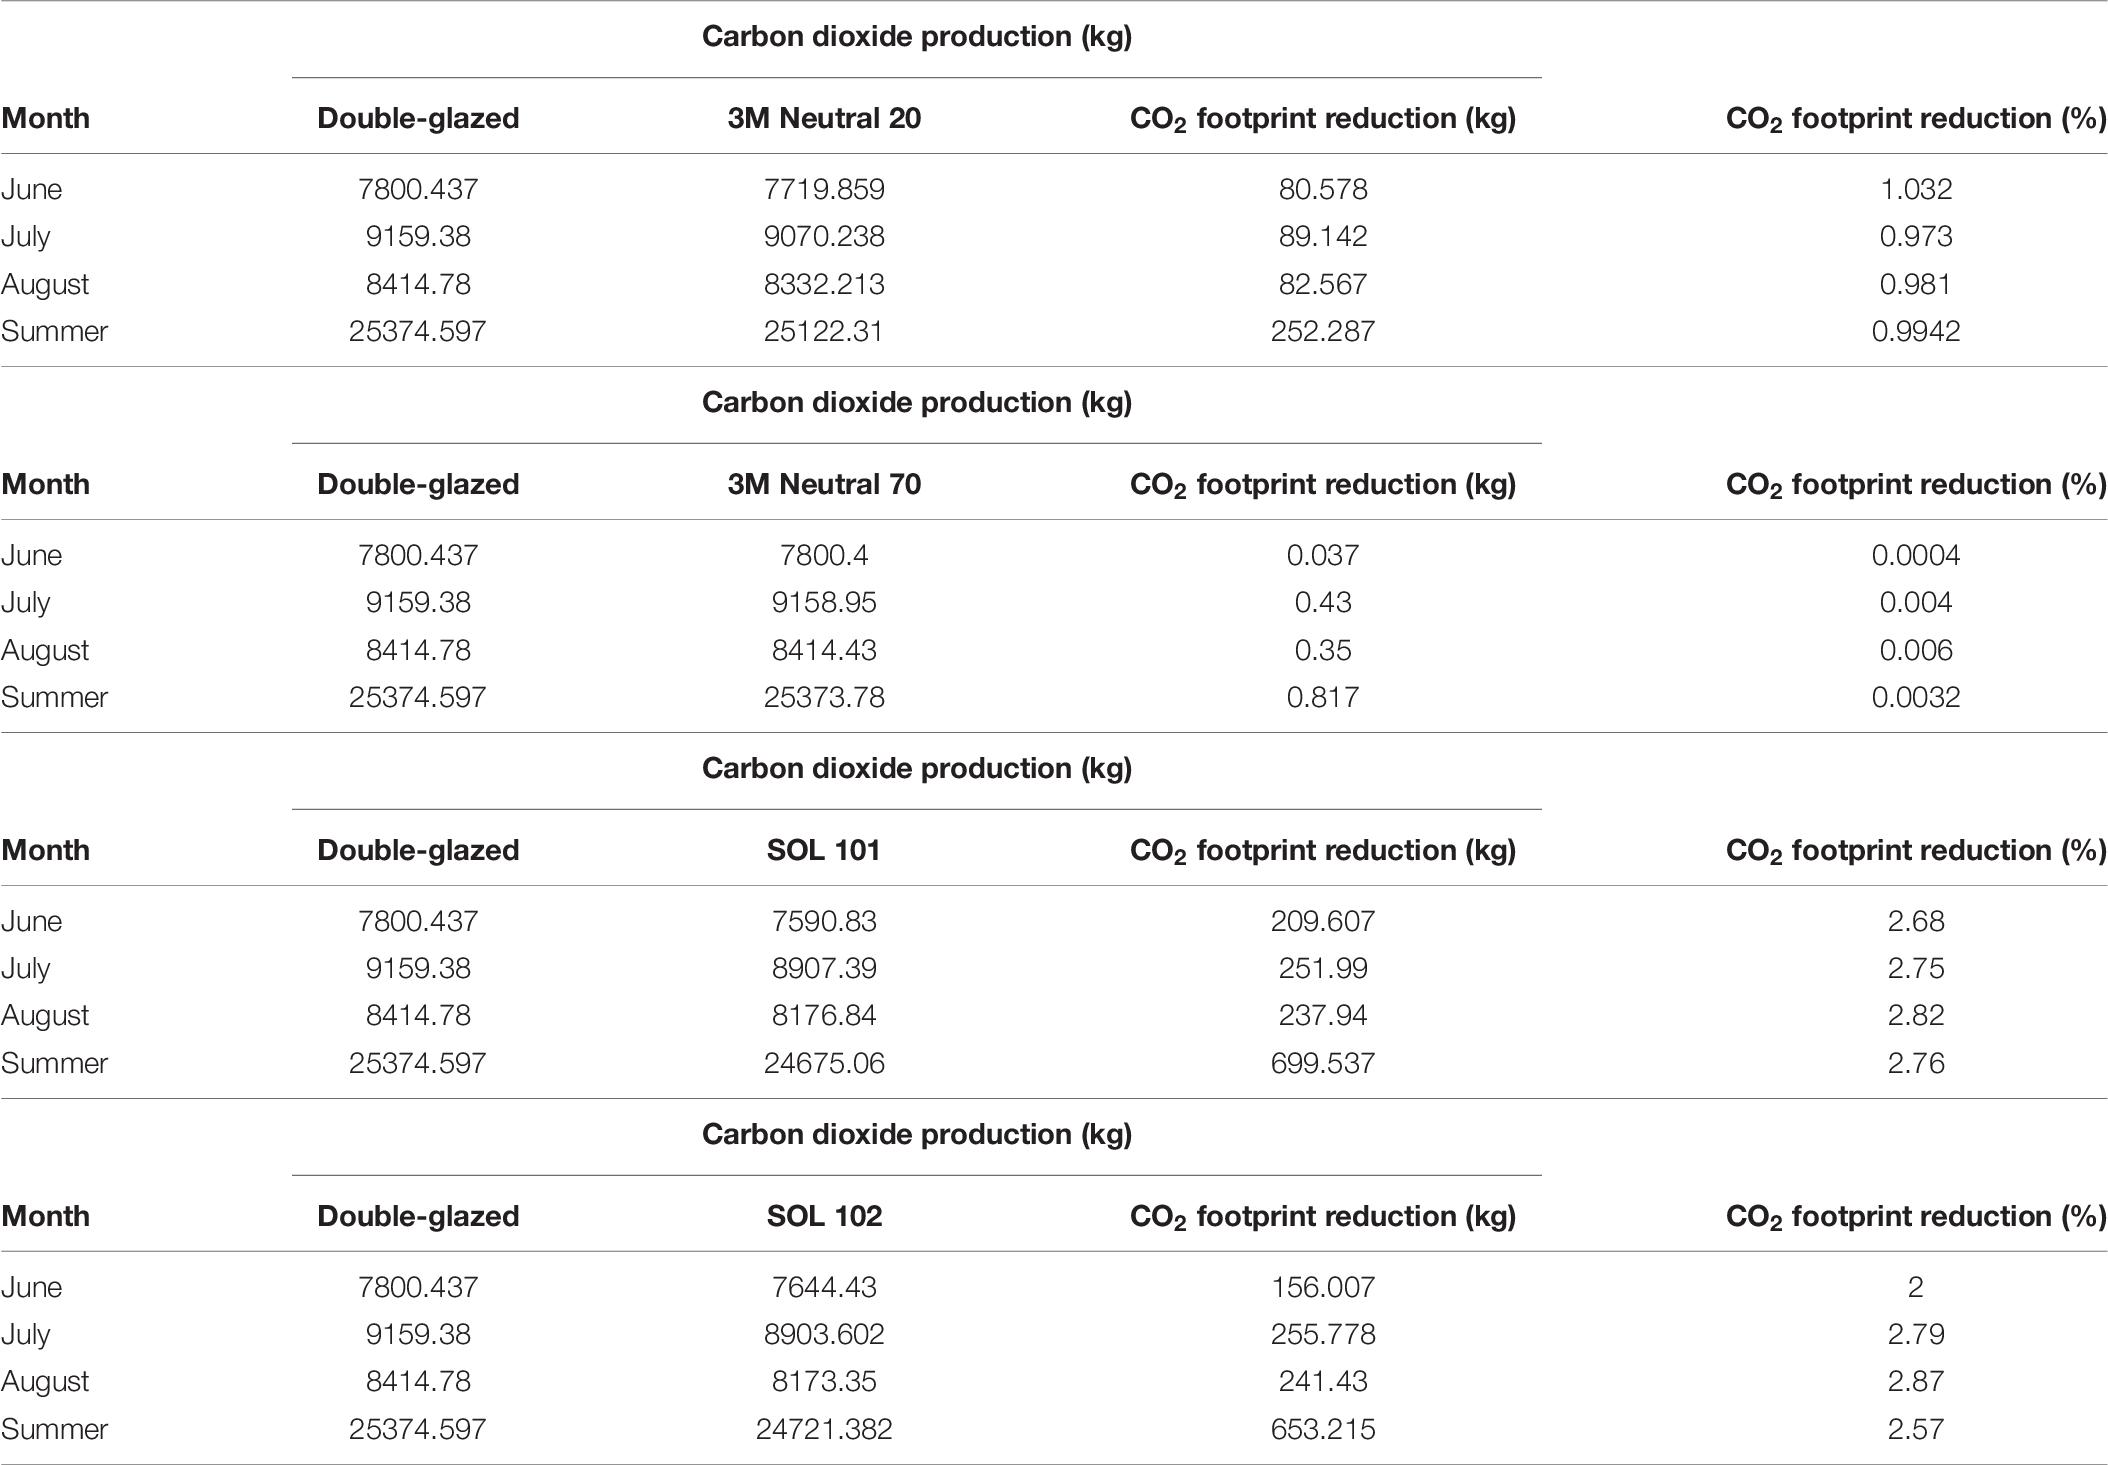
Table 7. Carbon dioxide (CO2) footprints reduction using window films in summer 2019 in Kuwait (Sedaghat et al., 2021).
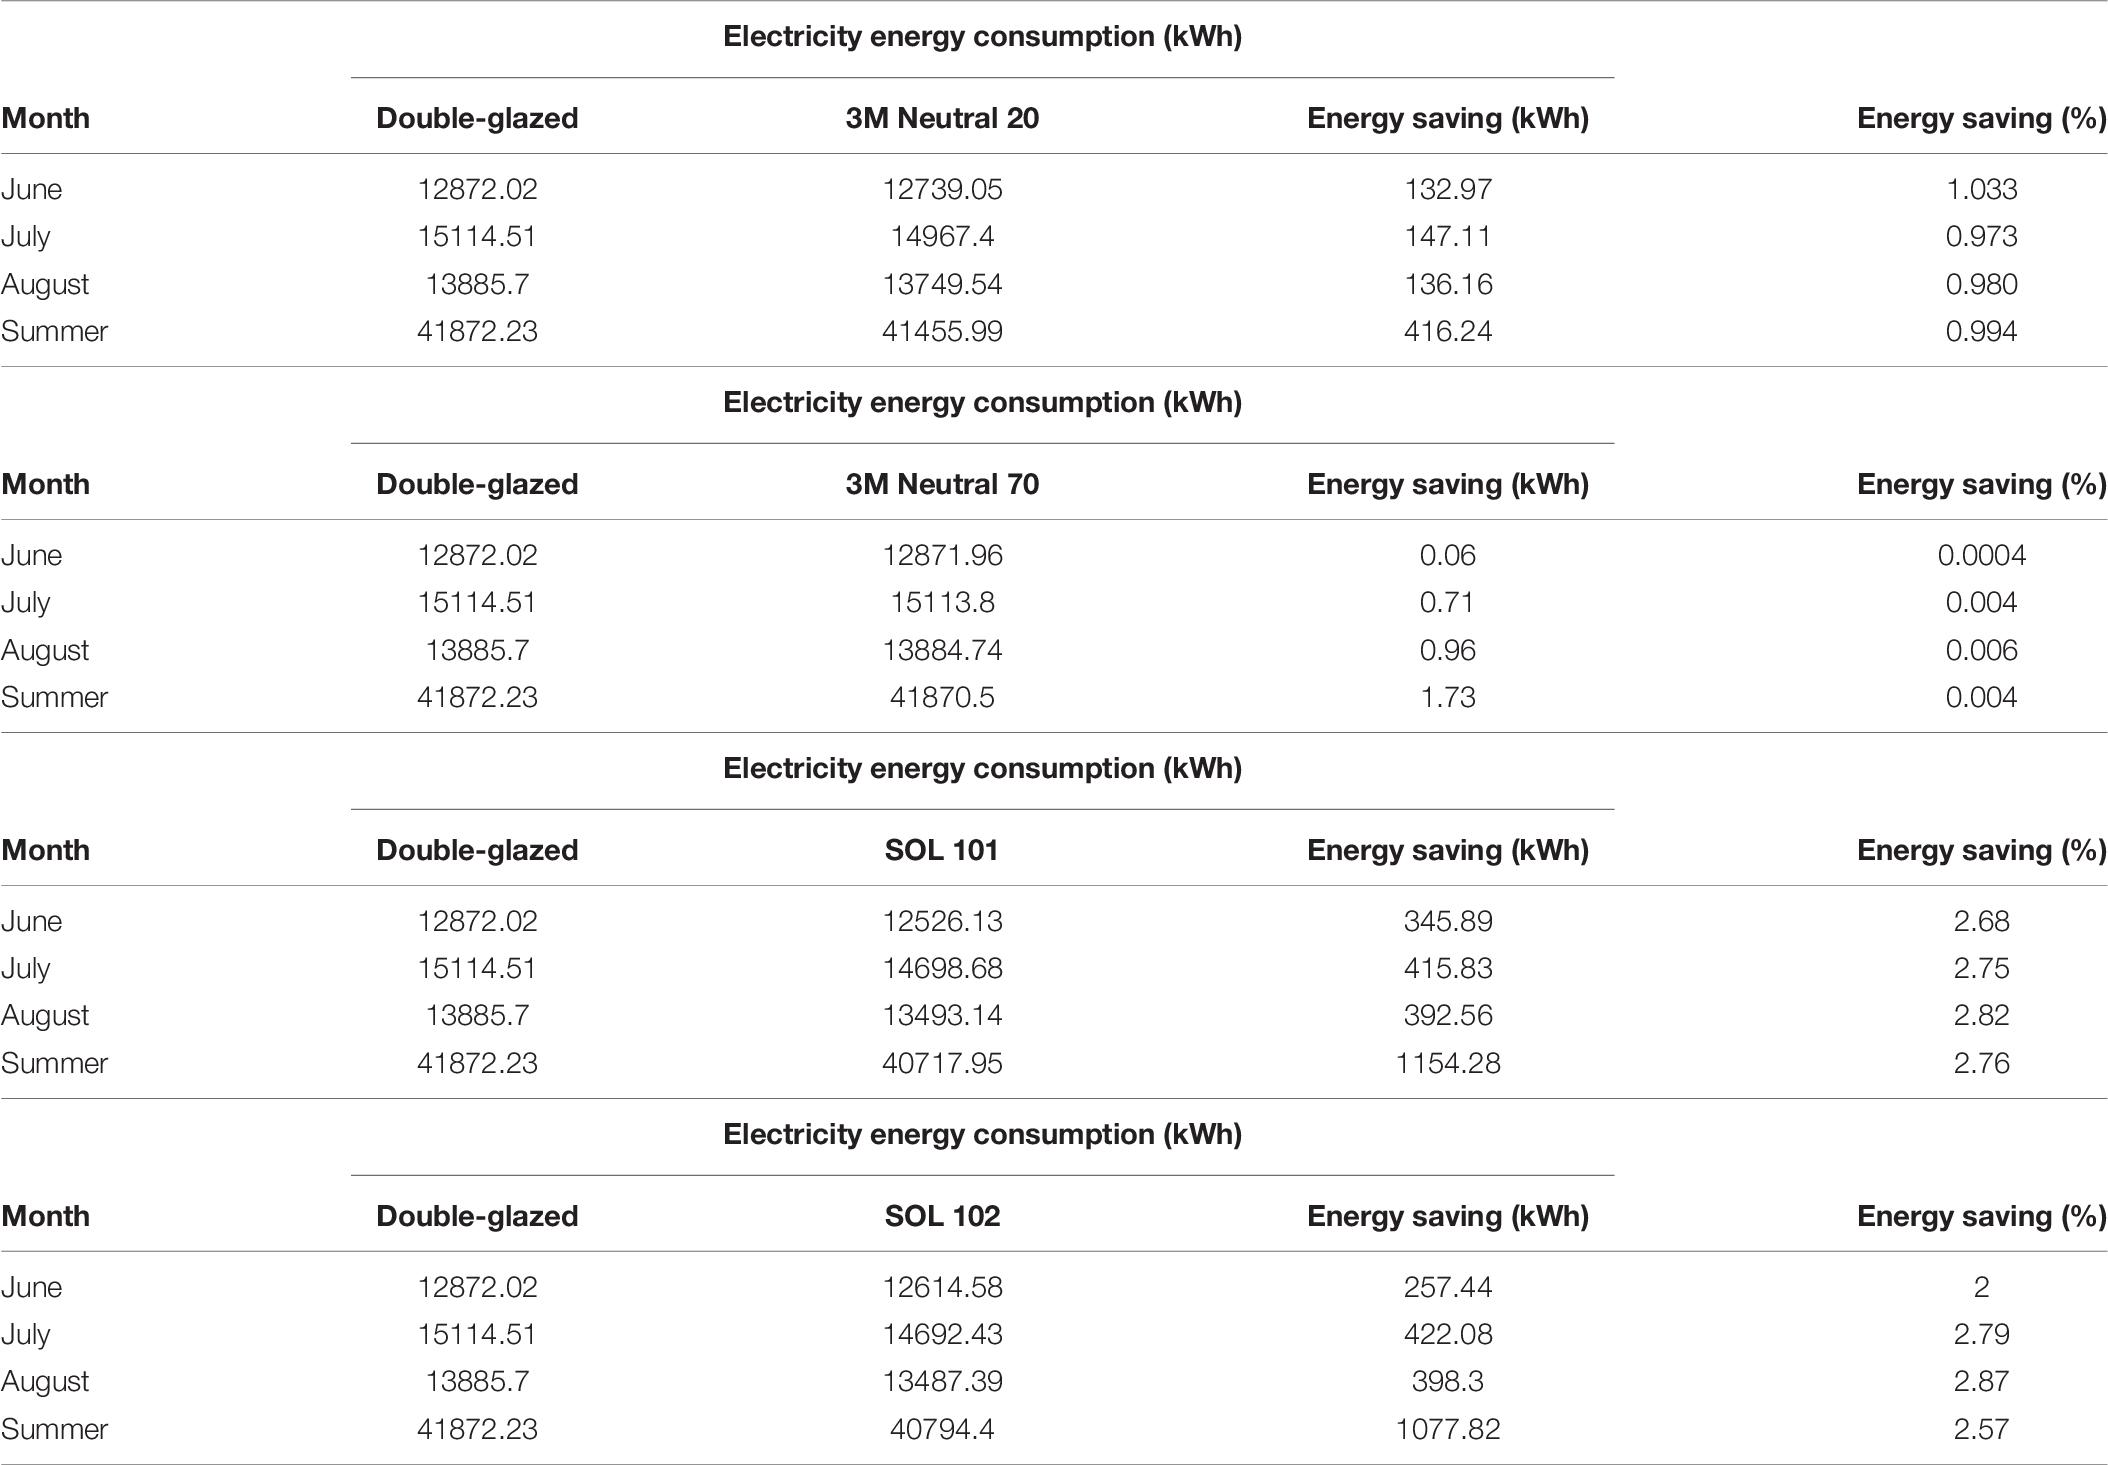
Table 8. Electrical energy saving (kWh) using window films in summer 2019 in Kuwait (Sedaghat et al., 2021).
Simulation results on minimum-mean-maximum temperature and humidity are compared with measured values in Figure 15 for the office with double-glazing in the month of July 2019. Simulation results for sensor 1 provide the closest match with experiments. Simulation results on minimum-mean-maximum temperature and humidity are also compared with measured values in Figure 16 for the office with 3M Neutral window films in the month of July 2019. Simulation results for sensor 2 provide the closest match with experiments. Simulation results for the months of June and August 2019 are presented in Supplementary Appendix C (Supplementary Appendix Figures C1–C4).
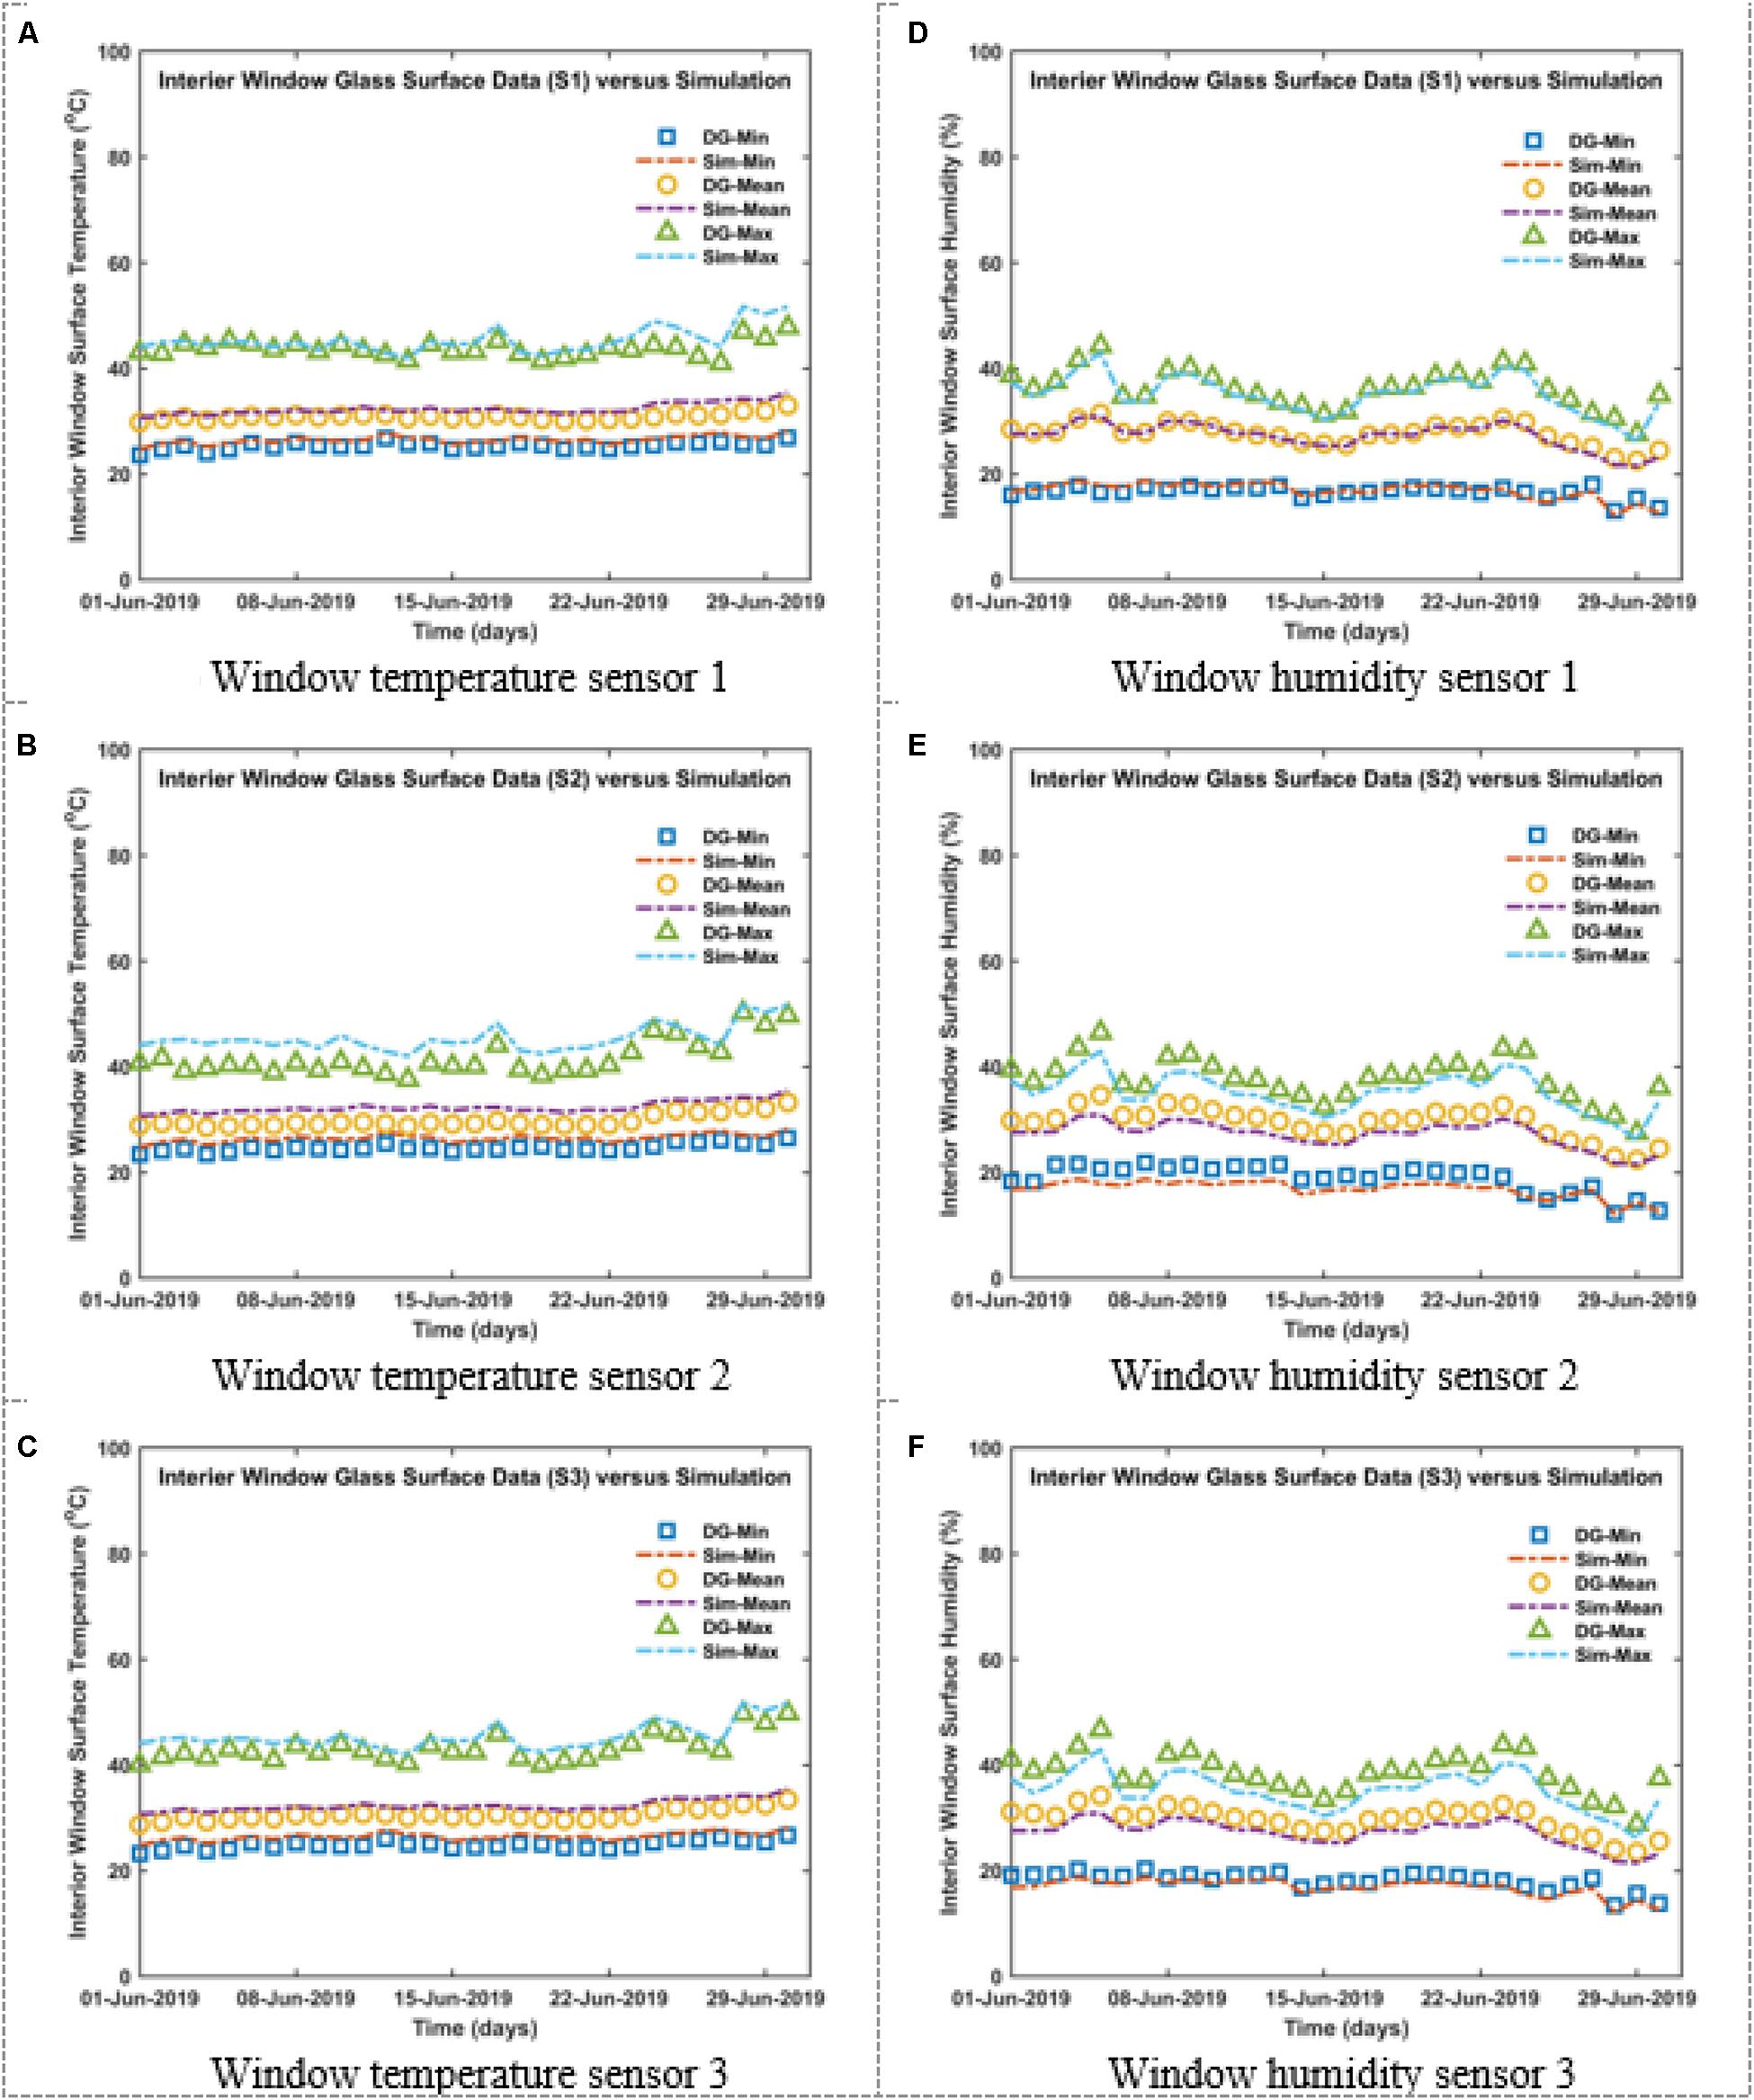
Figure 15. Temperature and humidity (max-mean-min) for three DHT22 sensors on the interior glass surface data versus simulations (Sim) of the offices with double-glazed (DG) windows during the month of June 2019; (A–C) temperatures, and (D–F) humidity variations.
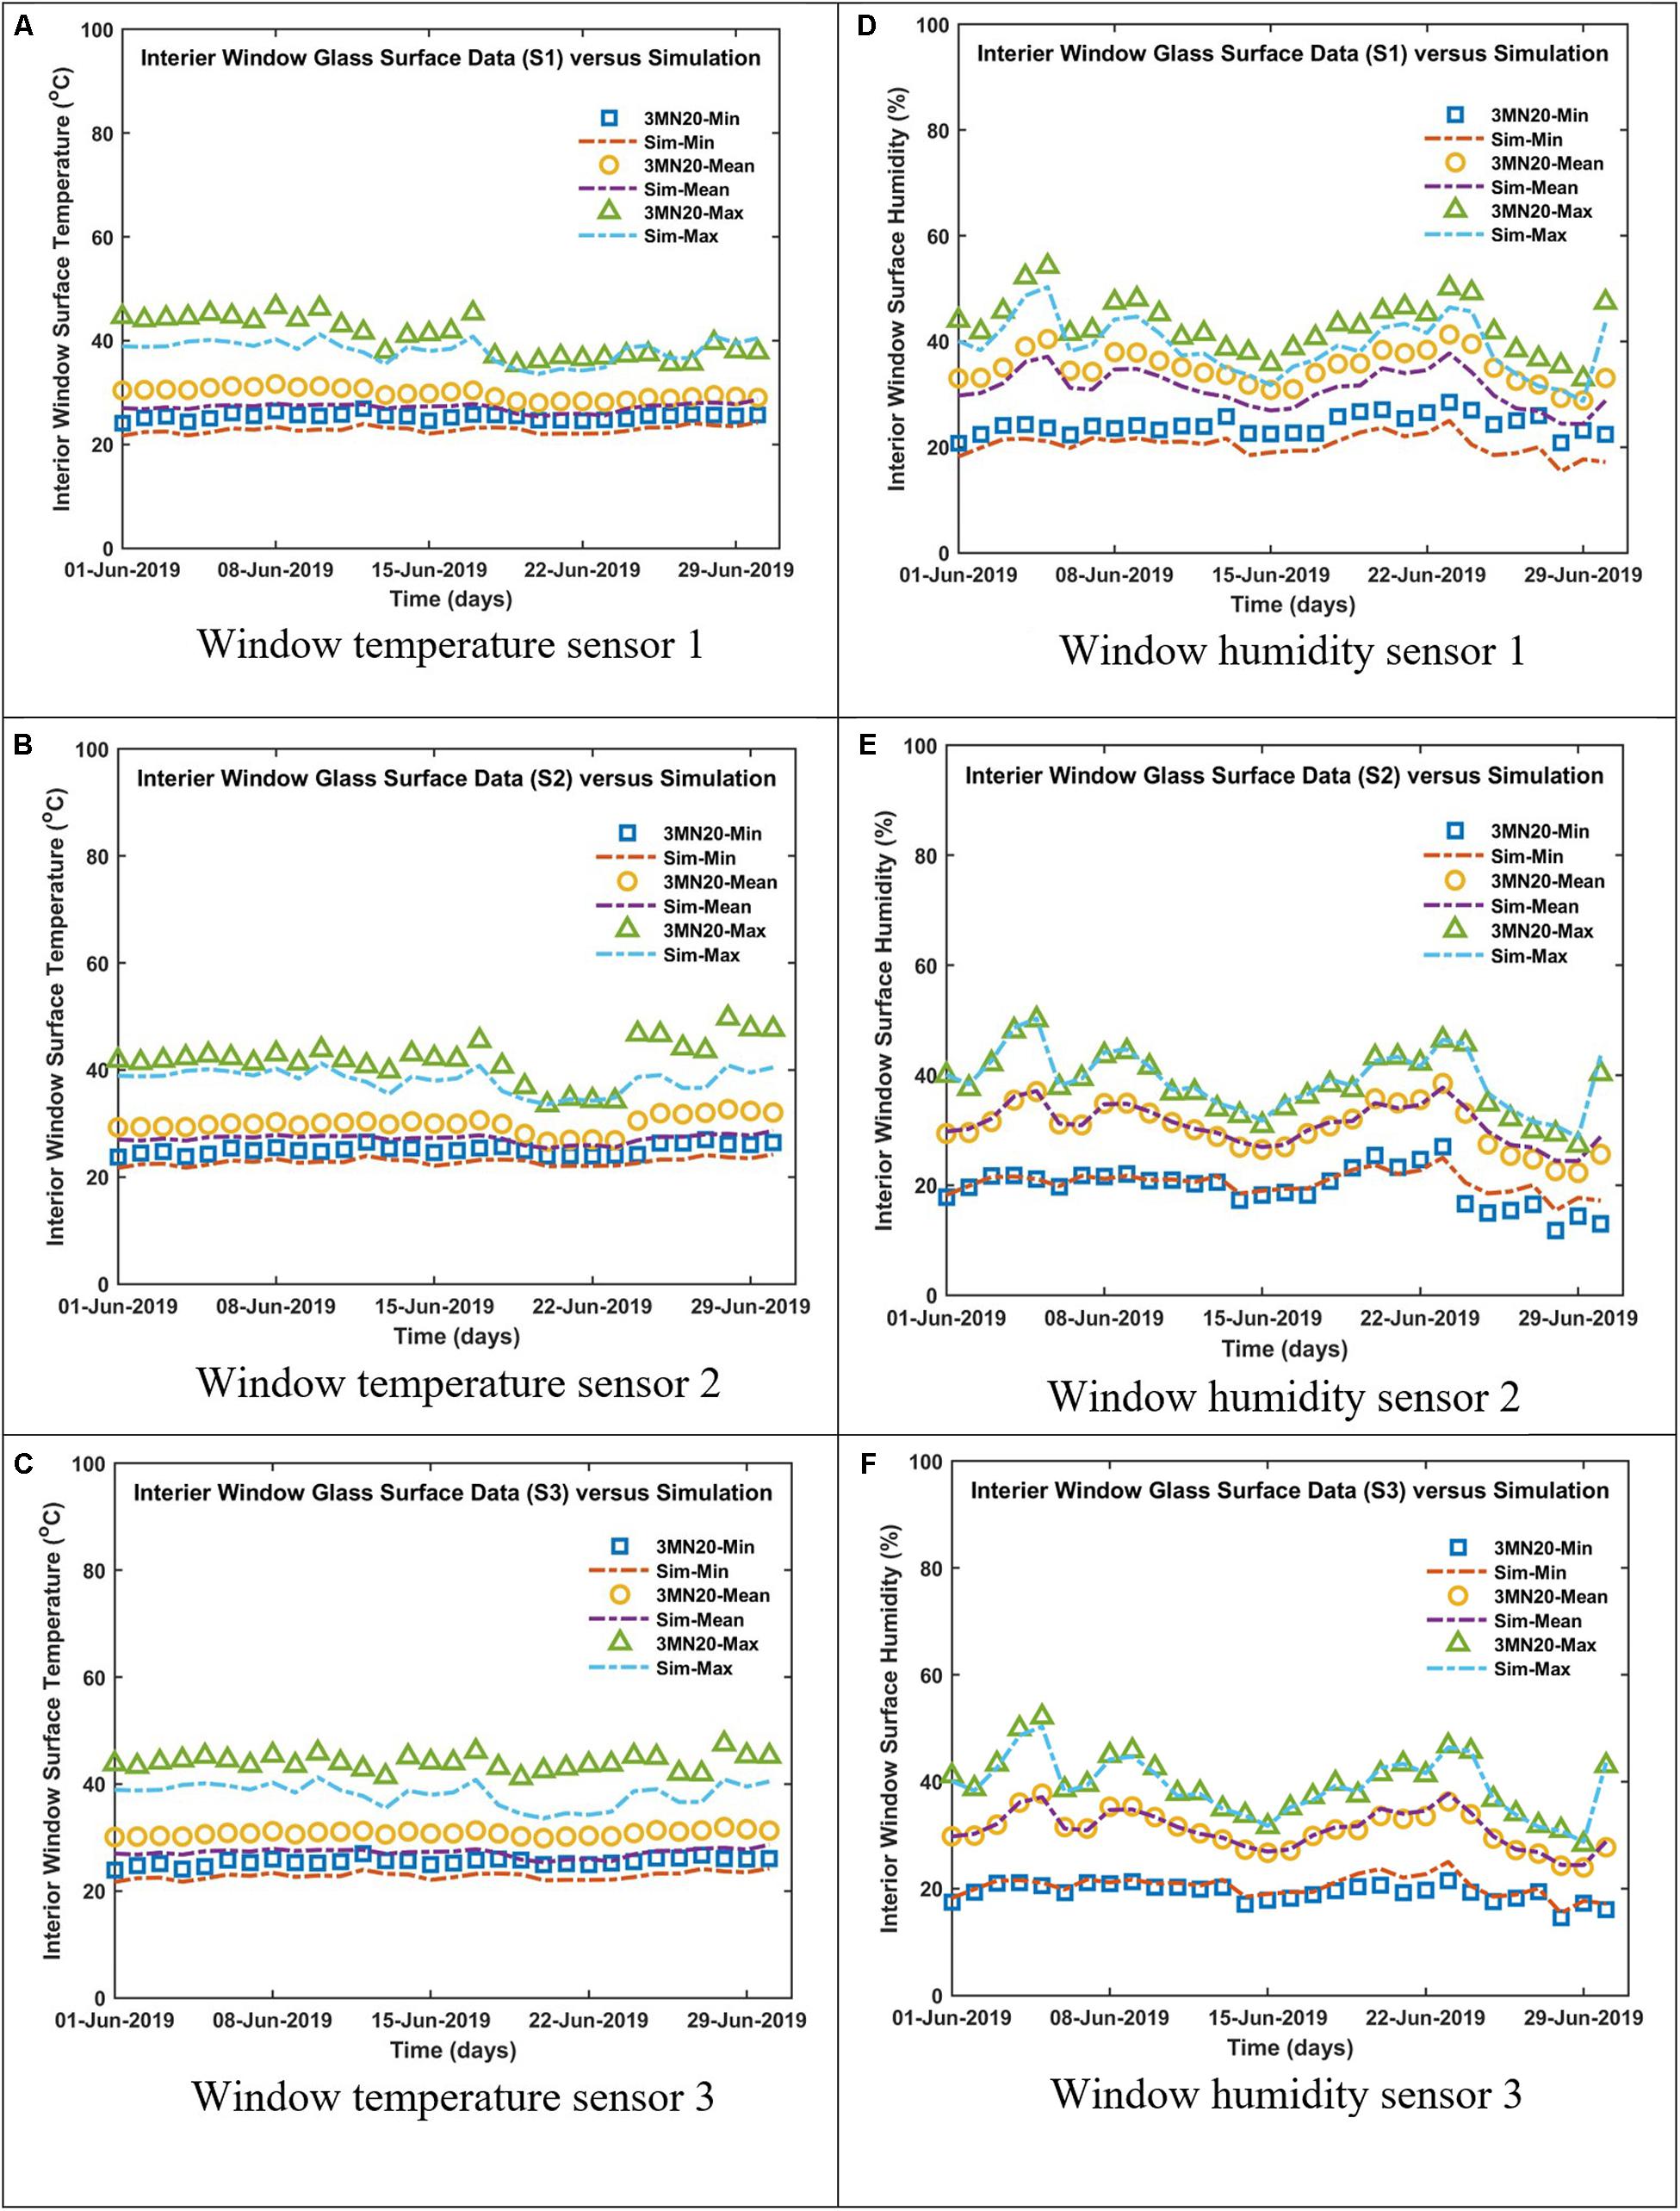
Figure 16. Temperature and humidity (max-mean-min) for three DHT22 sensors on the interior glass surface data versus simulations (Sim) of the offices with 3M Neutral 20 (3MN20) windows during the month of June 2019; (A–C) temperatures, and (D–F) humidity variations.
Conclusion
The electricity consumption of AC systems in hot-arid climates demands around 70% of peak load and above 40% of the annual production of electricity. Energy saving and CO2 footprint reduction in residential/office buildings is becoming a national priority in many countries. Window films are passive and economic methods for obstructing more than 76% of solar heat rays and about 99% of UV rays particularly in hot summer months. In this paper, the energy saving and CO2 footprint reduction of two types of window films, 3M Neutral 20 and 3M Neutral 70, were investigated experimentally in four offices in an extremely hot-arid climate. Two floors of the same building with 31 offices were simulated with/without four types of window films including SOL 101 and SOL 102 window films. Two million of experimental data were created using an in-house-developed data logging system through a Wi-Fi system and stored in iCloud using an IoT system. Temperature/humidity experimental data were analyzed and the histogram/PDF distribution structure of univariate and bivariate kernel density estimation (KDE) function were explored. A systematic method was presented to develop a monthly PDF (probability density function) indicator using a rational function for parameters of interest such as temperature, humidity, and illuminance. From experimental results, it was observed that the office with the 3M Neutral 20 window film performed better than its counterpart without a window film by increasing the relative humidity by 5 to 10% and decreasing temperatures between 2°C and 5°C during the months June, July, and August 2019 in Kuwait. Simulation results depicted that the SOL 101 window film could produce far better energy savings and a CO2 footprint reduction of 2.76% annually compared with the other types of studied window films. The summary of conclusions are mentioned below:
• A systematic method was presented to develop a monthly PDF (probability density function) indicator using a rational function for parameters of interest such as temperature, humidity, and illuminance.
• The offices with window films always possessed 5% to 10% higher humidity compared with offices without windows films.
• The offices with window films always possessed lower temperatures between 2 degrees and 5 degrees Celsius compared with offices without window films.
• The lux intensity was reduced by applying window films particularly during the peak solar radiation of the day around 3 to 4 p.m.
• For the 3M Neutral 20 window films in July 2019 in Kuwait, the electricity consumption and carbon dioxide production could be reduced by 0.973%.
• For the 3M Neutral 70 window films in July 2019 in Kuwait, the electricity consumption and carbon dioxide production could be reduced by 0.004%.
• The energy saving in the month of July 2019 by installation of 3M Neutral 20 window films was about 147.11 kWh.
• The energy saving in the month of July 2019 by installation of 3M Neutral 70 window films was merely about 0.71 kWh.
• Simulations for the SOL 101 window film indicated a 699.537 kg CO2 footprint reduction and 1154.28 kWh energy saving in summer 2019 for one floor in the ACK building.
• Results for the SOL 102 window film showed a 653.215 kg CO2 footprint reduction and 1077.83 kWh energy saving in summer 2019 for the same floor.
Some of the challenges this project included communication between the sensors and Wi-Fi network, calibration of experimental data with software modeling, experimental data processing, and defining the properties of solar window films in Design Builder software, etc.
One of the best suggestions for future work is thermo-economic analysis of a big commercial building using solar control window films and estimating the amount of energy cost savings in different hot-arid climates.
Data Availability Statement
The original contributions presented in the study are included in the article/Supplementary Material, further inquiries can be directed to the corresponding author.
Author Contributions
KT and FS: reviewing, editing, writing, and methodology. AS: conceptualization, writing, methodology, and software. SA and FA: writing, methodology, and software data curation. MM: writing, methodology, software, reviewing, and editing. MS: reviewing, editing, and writing. HS: software, reviewing, and editing. AM: software, reviewing, editing, original draft preparation, and supervision. AI: data curation and visualization. MJ: conceptualization, writing methodology, and writing manuscript. SC: methodology and software data curation. All authors contributed to the article and approved the submitted version.
Funding
This study was fully funded by the Kuwait Foundation for the Advancement of Sciences (KFAS) under grant number PN18-15EE-04 which is greatly acknowledged. The corresponding author also wishes to acknowledge the support by grant number ENV6402012N from Prince of Songkla University.
Conflict of Interest
The authors declare that the research was conducted in the absence of any commercial or financial relationships that could be construed as a potential conflict of interest.
Supplementary Material
The Supplementary Material for this article can be found online at: https://www.frontiersin.org/articles/10.3389/fenrg.2021.665978/full#supplementary-material
References
Ahmadi, M. H., Baghban, A., Sadeghzadeh, M., Zamen, M., Mosavi, A., Shamshirband, S., et al. (2020). Evaluation of electrical efficiency of photovoltaic thermal solar collector. Eng. Appl. Comput. Fluid Mech. 14, 545–565. doi: 10.1080/19942060.2020.1734094
Ahmadi, M. H., Ghazvini, M., Sadeghzadeh, M., Alhuyi Nazari, M., Kumar, R., Naeimi, A., et al. (2018). Solar power technology for electricity generation: a critical review. Energy Sci. Eng. 6, 340–361. doi: 10.1002/ese3.239
Al Doury, R. R. J., Salem, T. K., Nazzal, I. T., Kumar, R., and Sadeghzadeh, M. (2020). A novel developed method to study the energy/exergy flows of buildings compared to the traditional method. J. Therm. Anal. Calorim. doi: 10.1007/s10973-020-10203-1 [Epub ahead of print].
Alahmad, B., Shakarchi, A. F., Khraishah, H., Alseaidan, M., Gasana, J., Al-Hemoud, A., et al. (2020). Extreme temperatures and mortality in Kuwait: who is vulnerable? Sci. Total Environ. 732:139289. doi: 10.1016/j.scitotenv.2020.139289
AlSanad, S. (2015). Awareness, drivers, actions, and barriers of sustainable construction in Kuwait. Proc. Eng. 118, 969–983. doi: 10.1016/j.proeng.2015.08.538
Alsulaili, A. D., Al-Matrouk, M. F., Al-Baghli, R. A., and Al-Enezi, A. F. (2020). Environmental and economic benefits of applying green building concepts in Kuwait. Environ. Dev. Sustain. 22, 3371–3387. doi: 10.1007/s10668-019-00352-1
Benseddik, A., Azzi, A., Chellali, F., Khanniche, R., and Allaf, K. (2018). An analysis of meteorological parameters influencing solar drying systems in Algeria using the isopleth chart technique. Renew. Energy 122, 173–183. doi: 10.1016/j.renene.2018.01.111
Bordass, B. (2004). “Energy performance of non-domestic buildings: closing the credibility gap,” in Proceedings of the 2004 Improving Energy Efficiency of Commercial Buildings Conference, (Citeseer).
Chen, B., Ji, Y., and Xu, P. (2012). Impact of window shading devices on energy performance of prototypical buildings. EPS 30:42.
ClimaTempts.com (2020). Kuwait. Available online at: http://www.kuwait.climatemps.com/
Cuce, E., and Riffat, S. B. (2015). A state-of-the-art review on innovative glazing technologies. Renew. Sustain. Energy Rev. 41, 695–714. doi: 10.1016/j.rser.2014.08.084
Davis, R. A., Lii, K.-S., and Politis, D. N. (2011). “Remarks on some nonparametric estimates of a density function,” in Selected Works of Murray Rosenblatt, eds R. Davis, K. S. Lii, and D. Politis (New York, NY: Springer), 95–100. doi: 10.1007/978-1-4419-8339-8_13
Dussault, J.-M., Gosselin, L., and Galstian, T. (2012). Integration of smart windows into building design for reduction of yearly overall energy consumption and peak loads. Solar Energy 86, 3405–3416. doi: 10.1016/j.solener.2012.07.016
Esbati, S., Amooie, M. A., Sadeghzadeh, M., Ahmadi, M. H., Pourfayaz, F., and Ming, T. (2019). Investigating the effect of using PCM in building materials for energy saving: case study of Sharif Energy Research Institute. Energy Sci. Eng. 8, 959–972. doi: 10.1002/ese3.328
Granqvist, C. G. (2007). Transparent conductors as solar energy materials: a panoramic review. Solar Energy Mater. Solar Cells 91, 1529–1598. doi: 10.1016/j.solmat.2007.04.031
Hee, W., Alghoula, M. A., Bakhtyar, B., Elayeba, O., Shameri, M. A., Alrubaih, M. S., et al. (2015). The role of window glazing on daylighting and energy saving in buildings. Renew. Sustain. Energy Rev. 42, 323–343. doi: 10.1016/j.rser.2014.09.020
Huang, Y., Niu, J.-L., and Chung, T.-M. (2014). Comprehensive analysis on thermal and daylighting performance of glazing and shading designs on office building envelope in cooling-dominant climates. Appl. Energy 134, 215–228. doi: 10.1016/j.apenergy.2014.07.100
Jelle, B. P., Hynd, A., Gustavsen, A., Arasteh, D., Goudey, H., and Hart, R. (2012). Fenestration of today and tomorrow: a state-of-the-art review and future research opportunities. Solar Energy Mater. Solar Cells 96, 1–28. doi: 10.1016/j.solmat.2011.08.010
King, D., Browne, J., Layard, R., O’Donnell, G., Rees, M., Stern, N., et al. (2015). A Global Apollo Programme to Combat Climate Change. London: London School of Economics and Political Science.
Lee, J.-W., Jung, H. J., Park, J. Y., Lee, J. B., and Yoon, Y. (2013). Optimization of building window system in Asian regions by analyzing solar heat gain and daylighting elements. Renew. Energy 50, 522–531. doi: 10.1016/j.renene.2012.07.029
Li, C., Tan, J., Chow, T. T., and Qiu, Z. (2015). Experimental and theoretical study on the effect of window films on building energy consumption. Energy Build. 102, 129–138. doi: 10.1016/j.enbuild.2015.04.025
Lund, P. D. (2009). Effects of energy policies on industry expansion in renewable energy. Renew. Energy 34, 53–64. doi: 10.1016/j.renene.2008.03.018
Meslier, V., and DiRuggiero, J. (2019). “Endolithic microbial communities as model systems for ecology and astrobiology,” in Model Ecosystems in Extreme Environments, eds J. Seckbach and P. Rampelotto (Amsterdam: Elsevier), 145–168. doi: 10.1016/B978-0-12-812742-1.00007-6
Meszaros, R., Merle, B., Wild, M., Durst, K., Göken, M., and Wondraczek, L. (2012). Effect of thermal annealing on the mechanical properties of low-emissivity physical vapor deposited multilayer-coatings for architectural applications. Thin Solid Films 520, 7130–7135. doi: 10.1016/j.tsf.2012.07.086
Mohelnikova, J. (2009). Materials for reflective coatings of window glass applications. Construct. Build. Mater. 23, 1993–1998. doi: 10.1016/j.conbuildmat.2008.08.033
Parzen, E. (1962). On estimation of a probability density function and mode. Ann. Math. Stat. 33, 1065–1076. doi: 10.1214/aoms/1177704472
Peel, M. C., Finlayson, B. L., and McMahon, T. A. (2007). Updated world map of the Köppen-Geiger climate classification. Hydrol. Earth Syst. Sci. 11, 1633–1644. doi: 10.5194/hess-11-1633-2007
Plummer, J. R. (2015). Window Film: A Cost Effective Window Retrofit. Lake City, CO: Green Builder Media.
Recast, E. (2010). Directive 2010/31/EU of the European Parliament and of the Council of 19 May 2010 on the Energy Performance of Buildings (recast). Brussels: Official Journal of the European Union, 18.
Sayegh, E. A. A. (2012). Overview on The Development of Green Buildings Codes for Kuwait. Adailiyah: The Public Authority for Applied Education and Training.
Scott, D. W. (2015). Multivariate Density Estimation: Theory, Practice, and Visualization. Hoboken, NJ: John Wiley & Sons. doi: 10.1002/9781118575574
Sedaghat, A., Alkhatib, F., Oloomi, S. A. A., Sabri, F., Salem, H., Sabati, M., et al. (2020). Experimental study on the performance of solar window films in office buildings in Kuwait. J. Nanopart. Res. 22:85. doi: 10.1007/s11051-020-04789-8
Sedaghat, A., Sabati, M., Alkhatib, F., Oloomi, S. A., Sabri, F., Salem, H., et al. (2021). Climate change and thermo-solar patterns of office buildings with/without window films in extreme hot-arid climate of Kuwait. Solar Energy 217, 354–374.
Ürge-Vorsatz, D., Cabeza, L. F., Serrano, S., Barreneche, C., and Petrichenko, K. (2015). Heating and cooling energy trends and drivers in buildings. Renew. Sustain. Energy Rev. 41, 85–98. doi: 10.1016/j.rser.2014.08.039
Vanhoutteghem, L., Skarning, G. C. J., Hvii, C. A., and Svendsen, S. (2015). Impact of façade window design on energy, daylighting and thermal comfort in nearly zero-energy houses. Energy Build. 102, 149–156. doi: 10.1016/j.enbuild.2015.05.018
Wang, L., and Greenberg, S. (2015). Window operation and impacts on building energy consumption. Energy Build. 92, 313–321. doi: 10.1016/j.enbuild.2015.01.060
Yang, Q., Liu, M., Shu, C., Mmereki, D., Hossain, U., and Zhan, X. (2015). Impact analysis of window-wall ratio on heating and cooling energy consumption of residential buildings in hot summer and cold winter zone in China. J. Eng. 2015, 538254. doi: 10.1155/2015/538254
Yin, R., Xu, P., and Shen, P. (2012). Case study: Energy savings from solar window film in two commercial buildings in Shanghai. Energy Build. 45, 132–140. doi: 10.1016/j.enbuild.2011.10.062
Keywords: CO2 footprint, energy saving, illuminance, kernel density estimation, office building, solar window film
Citation: Sedaghat A, Abbas Oloomi SA, Malayer MA, Alkhatib F, Sabri F, Sabati M, Salem H, Zafar WJ, Mostafaeipour A, Issakhov A, Jahangiri M, Techato K and Chowdhury S (2021) Effects of Window Films in Thermo-Solar Properties of Office Buildings in Hot-Arid Climates. Front. Energy Res. 9:665978. doi: 10.3389/fenrg.2021.665978
Received: 09 February 2021; Accepted: 07 April 2021;
Published: 20 May 2021.
Edited by:
Mohammad Hossein Ahmadi, Shahrood University of Technology, IranReviewed by:
Mamdouh El Haj Assad, University of Sharjah, United Arab EmiratesRavinder Kumar, Lovely Professional University, India
Milad Sadeghzadeh, University of Tehran, Iran
Copyright © 2021 Sedaghat, Abbas Oloomi, Malayer, Alkhatib, Sabri, Sabati, Salem, Zafar, Mostafaeipour, Issakhov, Jahangiri, Techato and Chowdhury. This is an open-access article distributed under the terms of the Creative Commons Attribution License (CC BY). The use, distribution or reproduction in other forums is permitted, provided the original author(s) and the copyright owner(s) are credited and that the original publication in this journal is cited, in accordance with accepted academic practice. No use, distribution or reproduction is permitted which does not comply with these terms.
*Correspondence: Kuaanan Techato, S3VhYW5hbi50QHBzdS5hYy50aA==