 Chuan He1,2
 Jiajun Tang3Weishi Zhang1,2Zhi Zhang3Zhemin Lin1,2
 Yating Li3Hanhan Qian1,2Hailong Jiang1,2Zhenzhi Lin3,4*Li Yang3
- 1State Grid Anhui Electric Power Co., Ltd., Hefei, China
- 2Anhui Power Exchange Center Company, Hefei, China
- 3College of Electrical Engineering, Zhejiang University, Hangzhou, China
- 4College of Electrical Engineering, Shandong University, Jinan, China
The orderly deregulation of planned electricity generation and consumption is an important measure for electricity market reform in several countries (such as China), and a reasonable proportion of planned electricity in the total energy consumption is conducive to the smooth transition from the regulation mode to the market mode. Under the plan-market double-track mechanism (PMDM) implemented, a modified linear bidding function of generation companies (GCs) is first proposed, and the unified clearing price of unilateral generation market is determined accordingly. Second, considering the robust bidding strategies of generation companies, a bi-level optimal planned electricity allocation model for power exchange (PX) is constructed. In the upper level, the proportion of planned electricity is optimized by PX to minimize the CVaR of Lerner Index (LI), so as to maintain the market power at a low level. In the lower level, based on the robust optimization theory and the prediction of rival bidding, the bidding strategy of a GC is optimized by solving a specified max–min problem. Simulations based on data from a provincial electricity market in China illustrate that the market power can be reduced through a reasonable proportion of planned electricity designed by the PX. In addition, when more GCs tend to avoid a market risk, the proportion of planned electricity can be increased accordingly.
Introduction
Electricity market reform is a task that many countries are facing or will face, the key point of which is to ensure the smooth transition from regulation to deregulation (National Development and Reform Commission National Energy Administration, 2017). In the past, due to low load demand and low risk of reform at the initial stage of electricity market construction, it took only a short time for many countries or regions to complete the transition, and the liberalization of these electricity markets is achieved by gradually easing market access. For example, it took only 5 months for ERCOT electricity market in Texas, the United States, to realize the transition from the pilot stage to the full liberalization of electricity market users (Sioshansi, 2013). All eligible users are allowed to participate in the transaction at the early stage of electricity market reform in Norway, which is the predecessor of Nord Pool (Woo et al., 2003). However, the rapid liberalization of the electricity market may also lead to many problems in the early stage of electricity market reform. Among them, the market power issue is the most concern of the PX. For example, the rotational and large-scale blackouts in California from 2000 to 2001, which led to direct economic losses of as much as US $40 billion, were partly caused by GCs using market power to manipulate market prices (Budhraja, 2001). In 2006, the economic withholding of GCs in the capacity market in New York caused a total loss of US $160 million (Antitrust, 2010). Even in a period of low load demand and little influence of market power, huge economic losses have been caused by the rapid liberalization of market. Nowadays, electricity market reform is underway in China and the load demand is much higher than 20 years ago, thus it is necessary to pay more attention to the market power in the transition from the regulation mode to the market mode.
Electricity market reform had been carried out in some areas of China several years ago. For example, the generation side market bidding transaction was implemented in Northeast China in the last electricity market reform. However, because of the full liberalization of market in the early stage of the reform, the generation and consumption plans are highly mismatching. In May 2006, Northeast Power Grid Company lost a total of 3.2 billion CNY within 16 days as GCs improved their bidding price together (International Energy Agency, 2006). Therefore, in the current electricity market reform, in order to ensure the stability of the market, China gradually allows users to participate in the electricity market according to the voltage level or annual electricity consumption, which is similar to the mode of the British electricity market reform (Sioshansi, 2013). The plan-market double-track mechanism (PMDM) is put forward in the electricity market reform since 2016, which means that only some of the qualified electricity users participate in the market, and correspondingly, GCs have both planned electricity and market electricity. The PMDM is also an effective mechanism that can be used in electricity market reforms for other countries. The key task of PMDM is to determine the reasonable proportion of planned electricity in total consumption.
Under this background, an appropriate method to determine the proportion of planned electricity in total electricity consumption is needed by PX, so as to set the market access conditions and ensure the smooth progress of electricity market reform. In a study by Jiang et al. (2004), the economic allocation of planned electricity and market electricity is realized considering the unit operation and network congestion constraints. In a study by Sun et al. (2020), an intraday planned electricity rolling model aiming at fairness is established to deal with the uncertainty of wind power generation. Obviously, the existing researches focus on the allocation and scheduling of planned and market electricity for specified units in time series, but few on the proportion of planned electricity in the total consumption. Therefore, to make up for the lack of previous research, an optimal planned electricity allocation model for PX is established, with the bidding strategy of GCs under PMDM considered.
The bidding strategy of generators has been studied. In the study by Bompard et al. (2008), the optimal bidding strategy of generators is obtained by analyzing the residual demand curve, and the stable state of the market is studied by iteration. In the study by Park et al. (2001), the bidding behaviors of generators under complete information market is modeled and analyzed based on the Nash equilibrium game theory. In other studies, probability statistics or fuzzy mathematics are introduced to model the uncertainty of market price and rival biddings, so as to optimize the bidding strategy of GCs. In a study by Wen and David (2001), the linear bidding model of generators under incomplete information is constructed, and the prediction of competitors’ bidding strategies is simulated by the probability density function of joint normal distribution. In a study by Ansari and Rahimi-Kian (2015), considering the uncertainty of market demand, a bidding model of generators is established which takes variance of profit as the risk measurement. In the study by Pousinho et al. (2013), the prediction of market demand and competitors’ bidding strategies is reflected by the residual demand curve in multi-scenarios, and the conditional value at risk is used to measure the profit risk of market, and then the sectional bidding model of generators is constructed. The bidding model of microgrid based on robust optimization is constructed in the study by Liu et al. (2016), and the uncertainty of its own output and market price is simulated by the scenario based on prediction data. However, the bidding strategies of GCs are influenced by the planned electricity under PMDM. In order to model the bidding behavior of GCs under the special market mechanism, a modified linear bidding function is proposed in this study, and an optimal bidding strategy model of power generation companies based on robust optimization is further constructed.
The contributions of this work are presented as follows:
(1) The optimal planned electricity allocation model for PX is built in the study to formulate a reasonable proportion of planned electricity in total consumption, so as to reduce the risk of transition from regulation to deregulation. Considering that the existing studies rarely focus on the proportion of planned electricity and related market power issues in the transition of electricity market, this study provides effective support for the PX to operate the market.
(2) A modified linear bidding function of generators is proposed in the study due to the traditional linear bidding function is not suitable for PMDM. By comparison, since the impact of planned electricity is considered, the bidding strategies of GCs under PMDM are better reflected by the modified linear bidding function, which further supports PX to determine the proportion of planned electricity.
The rest of this article is as follows. The modified linear bidding function of generators is analyzed in Modified Linear Bidding Function of Generation Companies under Plan-Market Double-Track Mechanism. The planned electricity allocation bi-level model for PX is constructed in Bi-level Optimal Planned Electricity Allocation Model Considering Generation Companies’ Robust Bidding Strategies. The effectiveness of the model is analyzed by the market data of a province in China in Case Study, and the main research results of the study are summarized in Conclusion.
Modified Linear Bidding Function of Generation Companies Under Plan-Market Double-Track Mechanism
Under PMDM in China, the total electricity generation is divided into planned electricity and market electricity by PX, planned electricity is allocated according to the generation capacity of GCs and settled at regulated prices, while the market-oriented generation is allocated according to the bidding of each generating unit. The market electricity on the consumption side is determined by the types of electricity users and market access conditions of each province. For example, in 2017, it was only large industrial enterprises with annual electricity consumption of more than 80 million kWh, commercial users with consumption of more than 50 million kWh, and some designated enterprises or users that were allowed to participate in the electricity market in the Guangdong Province of China (Guangdong Economic and Information Commission et al., 2017); and in 2020, industrial/commercial enterprises with annual electricity consumption of more than four million kWh are allowed to participate in the transaction (Guangdong Electric Power Exchange Center Co., Ltd, 2020). Let QP and QM represent planned electricity and market electricity, respectively. Thus, the total electricity consumption QU is expressed as follows:
The planned electricity for the year Y + 1 is announced by PX at the end of the year Y and allocated to GCs according to the ratio of the generation capacity. After allocation, GCs participate in the electricity market of the year Y + 1 based on their residual generation capacity. Therefore, in order to give priority to meeting the planned demand for electricity, part of the capacity of GCs in a certain period of time is occupied, and the rest is involved in market transactions. Considering the increasing marginal generation cost of units, the occupied capacity will increase the cost of the market electricity of GC, which should be fully considered in market bidding.
Generally, quadratic function is introduced to model the relationship between generation cost and generation capacity, and expressed as follows (Dagoumas, 2019):
where
Linear bidding function is a common form of cost-based bidding strategy for GCs, which can be expressed as follows:
where
The marginal generation cost of GC is positively related to the total generation, and planned electricity increases the marginal cost of the market electricity, which is not considered in the bidding function in Eq. 4. Let
where n is the total number of GCs.
As shown in Figure 1, the bidding function curve of GCs (in green) is higher than the marginal generation cost (in yellow) without planned electricity. But under PMDM in China, as part of the generating capacity of GCs is occupied by the planned electricity, and the traditional linear bidding function (in blue) of GCs is lower than the marginal generation cost within a certain range (i.e., the shadow part). For rational GCs, the linear bidding function under PMDM should be modified, as shown by the red curve in Figure 1. On the premise that the allocated planned electricity is known to GC in advance, its quotation in the market will be higher than or equal to the corresponding marginal cost. Thus, the modified bidding function can be expressed as follows:
where
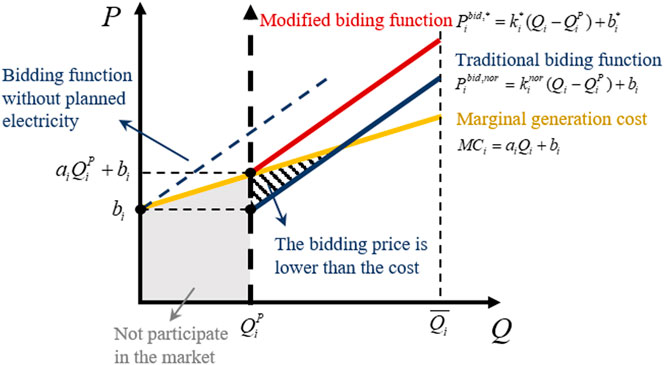
FIGURE 1. The bidding function of GCs under the PMDM.
For a generation side quotation market with n generation companies, the unified clearing price
Here,
By solving the Eqs 1, 5, 7, and 8 simultaneously, the unified clearing price of the electricity market under PMDM is obtained, which can be expressed as follows (Wen and David, 2001):
The Bi-Level Optimal Planned Electricity Allocation Model Considering Generation Companies’ Robust Bidding Strategies
In order to ensure the stable operation of the electricity market in reform, it is important to allocate planned electricity and market electricity reasonably. The impact of the planned electricity on the market behavior of GCs should be fully considered by PX when determining the planned electricity. Under this background, a bi-level model of planned electricity allocation considering the robust bidding strategy of GCs is constructed in this section, and the schematic diagram of the model is shown in Figure 2. In the upper level, the planned electricity is optimized by PX to minimize the CVaR of Lerner index in multiple scenarios, considering the uncertainty of the load demand. In the lower level, the bidding coefficient is optimized by GCs to maximize the robust profit under a certain confidence level considering the uncertainty of the competitors’ bidding strategies. The decision variable of the upper level model will affect the earnings of GCs in the lower level model, which in turn affect their bidding strategies; the bidding strategies of GCs determine the price of the market, which affects the Lerner index in the upper target function. More details on the objectives and variables of the upper and lower level models are presented in Robust Bidding Strategies and The Lower Level Model: An Optimal GC’s Bidding Strategy Model Based on Robust Optimization Theory and The Upper Level Model: Optimal Planned Electricity Allocation Model Based on CVaR, respectively.
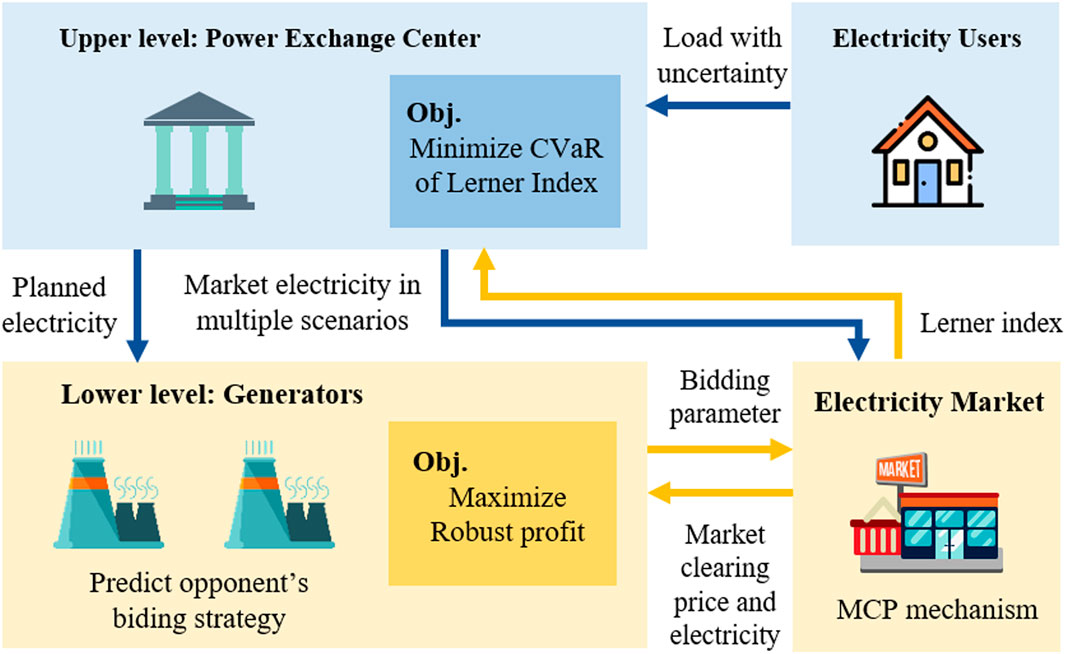
FIGURE 2. Schematic diagram of the bi-level model of planned electricity allocation.
Bi-level nonlinear optimization is a relatively complex optimization problem. Common solving algorithms include the penalty method by Dault and Shanker (2015), tabu search by Wu and Soto (2020), the genetic algorithm by Silva et al. (2019), the neural network by Zarco and Froese (2018)., etc. The proportion of planned electricity consumption is related to user structure, while the latter is related to market access conditions. In fact, the relevant parameters of market access conditions are usually discrete points in a limited range, so that the solution of the model does not need to be globally optimal and accurate. The genetic algorithm (GA) has good global search capability, and it is suitable for solving the optimal planned electricity. Thus, in this study, GA is used to solve the upper level model and the fmincon function in MATLAB is used to solve the lower level model.
The Lower Level Model: An Optimal Generation Companies Bidding Strategy Model Based on Robust Optimization Theory
With the implementation of PMDM, the revenue of GCs includes planned electricity revenue and market electricity revenue. The planned electricity and the corresponding regulated price are determined in advance in the previous year, while the market electricity quantity and the unified price are obtained according to the clearing results of the electricity market. The revenue of GC i under PMDM can be expressed as follows:
Here,
In fact, the bidding strategies of GCs is carried out in a market with limited information. The bidding coefficients of other companies are unknown to a particular GC, but the uncertainty set of their bidding coefficients can be calculated based on the historical bidding data. For GC i, the predicted uncertainty set of its rival’s quotation coefficient is
Due to the uncertainty of competitors’ bidding, the market quotation of power generation companies is a kind of risk decision. According to the robust optimization theory, risk-averse GCs are usually more concerned about the highest revenue they can earn in the worst case while meeting a certain degree of confidence conditions in the decision-making (Annamraju and Nandiraju, 2019). The theory has been applied in many fields such as power system planning (Chowdhury et al. 2020) and dispatching (Choi et al. 2018). Based on robust optimization theory, the model is established to maximize the lowest possible profit
where the decision variable
In order to solve the problem,
where
Here,
In addition, the constraints of the bidding model of GCs are as follows:
The Upper Level Model: An Optimal Planned Electricity Allocation Model Based on CVaR
As a nonprofit organization, the goal of PX is to improve social benefits through reasonable planned electricity allocation. In an immature electricity market, due to the oligopoly of the generation side, some generation companies may have great market power. Therefore, market power supervision is one of the key tasks for PX to promote the reform of electricity market (Hakam et al., 2020).
The commonly used market power indicators include the Herfindahl–Hirschman index (HHI), must run ratio (MRR), the Lerner index (LI), etc. HHI and MRR are static index which reflect the capacity concentration of the market participants (Hajiabadi and Samadi 2019) and the possibility of market power based on market share (Wang et al. 2004), respectively. By contrast, LI reflects the degree of market monopoly by measuring the deviation between market clearing price and marginal cost, and is a market power index used to analyze the performance of electricity market afterward (Razmi et al., 2021). Therefore, LI is used to reflect the market power under PMDM in this section.
Considering that the LI of the market is influenced by the load demand, the load on the user side is assumed to obey the normal distribution N (μ, σ2) in this study. The scenario set S of load demand can be obtained by sampling user load through quantiles of normal distribution (Soranzo and Epure, 2014), as shown in Figure 3. The median of two quantiles is taken as the sampling value and the shadow area is the probability of the sampling value.
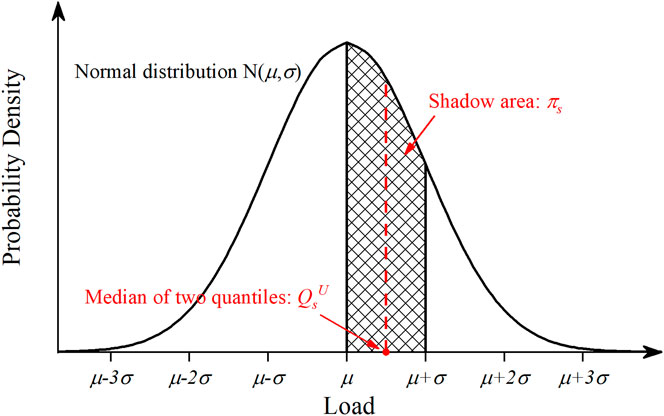
FIGURE 3. The method of sample user load based on normal distribution quantile.
Because the load demand is uncertain, LI is subject to a probability distribution rather than a certain value. Furthermore, as the market power cannot be avoided, the LI in adverse conditions is more concerned by PX than the expectation of LI. CVaR measures the average loss when the loss exceeds the value at risk (VaR) in a certain confidence level. For the PX, CVaR of the LI indicates the expected value when the LI is higher than the critical value (Yin and Zhao, 2018). Therefore, the objective function of the upper model is to minimize the CVaR of LI, and expressed as follows:
where
Here,
The constraint of the planned electricity allocation model is the upper and lower limit of the electricity, which can be expressed as follows:
Case Study
The data of a provincial electricity market in China are served for demonstrating the proposed planned electricity allocation model for PX. The generation cost and bidding parameters of the five major large power generation companies in the province are shown in Table 1. The original planned electricity in the province is set at 250 billion kWh, and the regulated price of planned electricity generation is 0.384 CNY/kWh. The normal distribution obeyed by load demand is N (300,225). The confidence level
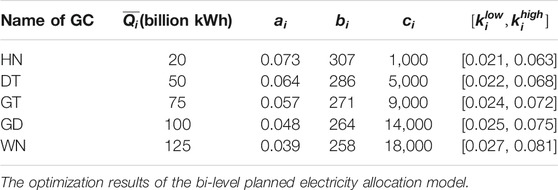
TABLE 1. Generation costs and bidding parameters.
By solving the above bi-level model, the optimal planned electricity allocation is 93 billion kWh (the proportion is about 31%). Compared with original planned electricity (250 billion kWh), the CVaR of LI decreases from 0.2015 to 0.1344, that is, a decrease of 33.3%. The LI of electricity market under different load demand is shown in Figure 4, and the LI is obviously decreased after optimization. The main reason for the decrease of LI is the reduction of average electricity price. As the regulated price of planned electricity is much higher than that of the market, the reduction of planned electricity means the decrease of the average electricity price. However, as can be inferred from Eq. 9, when the market electricity increases, the supply and demand ratio decreases and the market unified clearing price increases correspondingly, which leads to a higher LI. Therefore, it is necessary to maintain a certain amount of planned electricity under a given constant supply side conditions.
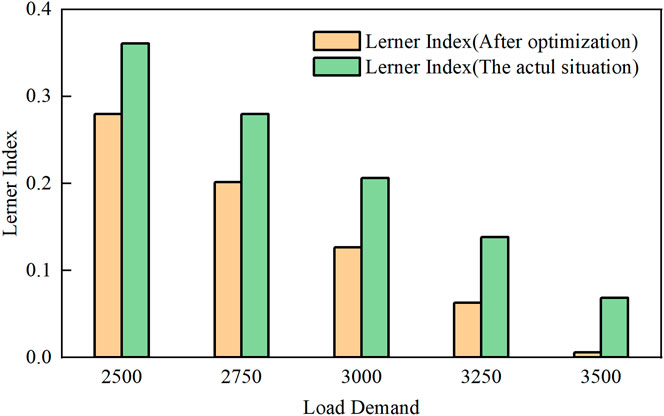
FIGURE 4. The Lerner Index of electricity market in actual situation and after optimization.
For the 5 GCs, when the planned electricity is 250 billion kWh and the load demand is equal to the expected value of 300 billion kWh, their market electricity are 3.95 billion kWh, 25.67 billion kWh, 40.78 billion kWh, 58.20 billion kWh, and 74.27 billion kWh, respectively. It can be seen from the Figure 5A that the market electricity shares of generation companies HN, GD, GT, DT, and HN are 3.4, 6.0, 14.7, 28.9, and 46.4%, respectively, and the shares allocated in proportion to their maximum generation capacity are 5.4, 13.5, 20.3, 27.0, and 33.8%, respectively. The market shares of HN, GD, and GT are less than their maximum generation shares, while the market electricity shares of DT and HN are higher than that of maximum generation. This is mainly because the market share of each GCs is determined by their cost-based bidding strategies. The larger the generation scale of the company, the smaller the power generation cost and the bidding coefficient, and the stronger its competitiveness in the electricity market. As a result, GCs with larger capacity can gain more market electricity than small GCs, which improves the market power.
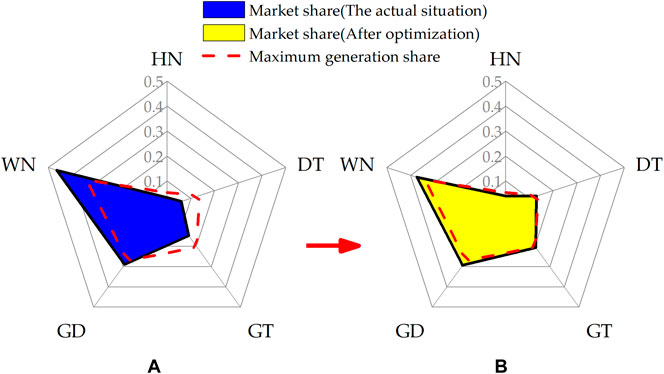
FIGURE 5. The market shares and maximum generation shares of GCs: (A) in actual situation; (B) after optimization.
The market share of each GC under the optimized proportion of planned electricity is shown in Figure 5B. By comparison, it can be found that in the case of optimized planned electricity allocation, the GCs acquired reasonable market share based on maximum generation share. When planned electricity is 250 billion kWh and market electricity is low, most of the market electricity is won by low-cost companies. On the other hand, when the market electricity is high, the market electricity of large GCs is limited by the increasing generation costs. Take the generation company WN as an example, the market share decreases from 46.4 to 37.4%, which shows that the optimization result of the bi-level model can effectively reduce the excessive market share of large-scale GCs and significantly decrease the market power.
The annual electricity consumption of various users of this province is shown in Table 2. In the original situation (the planned electricity is 250 billion kWh), some of the large industrial enterprises, general industrial enterprises, and commercial users are accessed to the electricity market according to their voltage level or annual electricity consumption. The market access conditions and the lists of market users are decided by PX. In order to reduce the planned electricity from 250 billion kWh to 93 billion kWh, the market access conditions should be changed correspondingly. For example, when industrial enterprises and commercial users with consumption of more than five million kWh are allowed to participate in the electricity market, the total consumption accessed in the market is about 190 billion kWh and the planned electricity is about 110 billion kWh which is close to the optimal result of the model. As for the generation side, PX only needs to reduce GCs’ planned electricity.
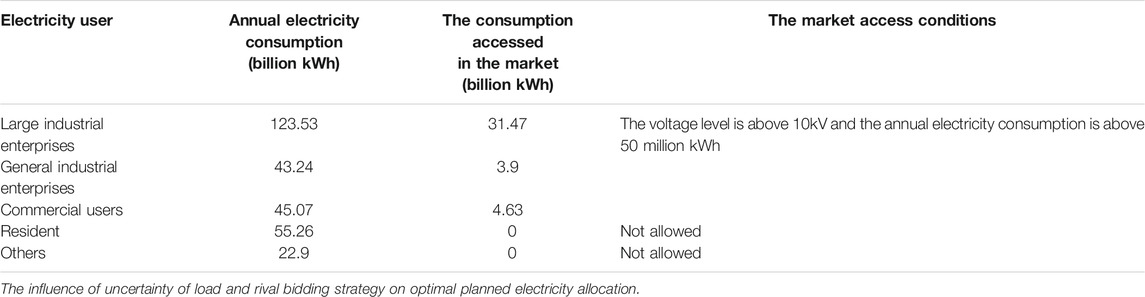
TABLE 2. The annual electricity consumption and market electricity of various users.
There are two uncertain factors in the bi-level model constructed in this study, that is, the uncertain load demand in the upper model and the uncertain bidding coefficients of competitors in the lower model. In the upper model, the uncertainty of load demand is represented by the standard deviation of the normal distribution, the greater the standard deviation, the greater the uncertainty of load. The relationship among the optimal allocation of planned electricity, the CVaR of LI, and the uncertainty of load is shown in Figure 6. It can be seen from Figure 6 that both the quantity of the planned electricity and the CVaR of LI are proportional to the standard deviation. When the standard deviation of load forecast is five billion kWh, the optimal planned electricity is 63.2 billion kWh and the CVaR of LI is 0.1270. Both of them are the least among five standard deviations. This is mainly because the CVaR of LI measures the expectation of LI when it exceeds the critical value. The smaller the volatility of the load demand is, the more stable the LI of the market is, and the smaller the CVaR value is.
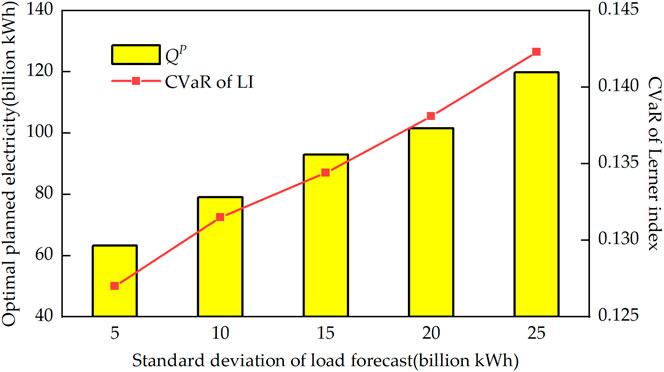
FIGURE 6. The relationship between optimization results and uncertainty of load demand.
In the lower level model, the uncertainty of generation companies’ bidding strategies can be reflected by the interval size of competitors’ bidding coefficient. The larger the interval, the greater the uncertainty of the bidding coefficient. Taking generation company WN as an example, the relationship between its bidding coefficient and the uncertain of rival bidding strategy is shown in Figure 7 with planned electricity set at 93 billion kWh and the load demand set at 300 billion kWh. It can be seen from Figure 7 that the bidding coefficient is inversely proportional to the uncertainty of rival bidding strategy. When the predicted interval of rival bidding coefficient is 0.037 and 0.071, the bidding coefficient of WN is 0.0831 and the LI is 0.1287. When the predicted interval is 0.017 and 0.091 whose size is the largest, the bidding coefficient of WN is least (0.0676) and the corresponding LI is also the smallest (0.1238). The main reason is that GCs aim to maximize their revenue in the worst case. Thus, the more uncertain the rival bidding strategy is, the greater the fluctuation range of GC revenue is, and the lower the revenue in the worst case is, which makes GCs more inclined to adopt bidding strategies close to the cost.
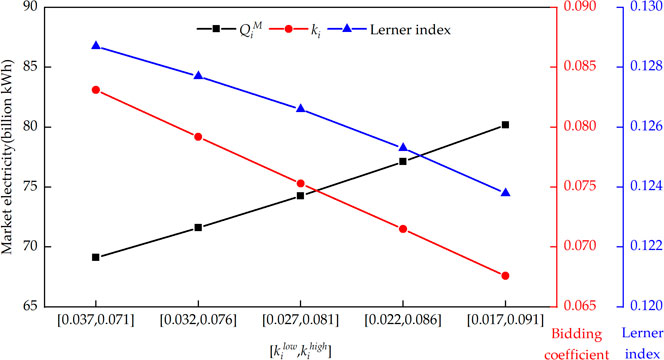
FIGURE 7. The relationship between the bidding strategy of generation company WN and the uncertainty of rival bidding.
The Influence of the Risk Aversion Degree of Generation Companies on Optimal Planned Electricity Allocation
The confidence level ε in the lower level model indicates the risk aversion degree of GCs. The larger the ε, the higher the degree of risk aversion of GCs. Figure 8 shows the optimal allocation results of planned electricity under different risk aversion degrees of GCs, and Table 3 shows the market clearing results and LI under the corresponding optimal planned electricity allocation. It can be seen from Figure 8 that the higher the risk aversion degree of GCs is, the lower the allocation value of planned electricity is, and the smaller the CVaR of LI is. GCs who tend to avoid risk are willing to adopt conservative bidding strategies with low-bidding coefficients. According to Table 3, as ε increases from 0.84 to 0.96, the unified clearing price decreases from 0.3267°CNY/kWh to 0.3131°CNY/kWh, and the LI decreases from 0.1331 to 0.1198, that is, a decrease of 10.0%. For PX, its objective function is to minimize the CVaR of the LI. The decline of market clearing price enables the PX to allocate more market electricity, reducing the optimal allocation value of planned electricity.
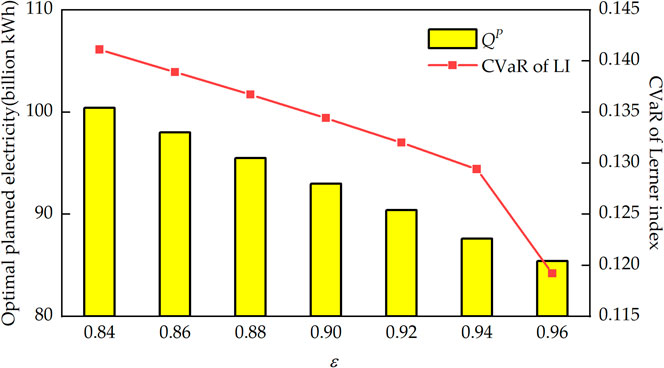
FIGURE 8. Optimal allocation of planned electricity under different risk aversion degrees of GCs.
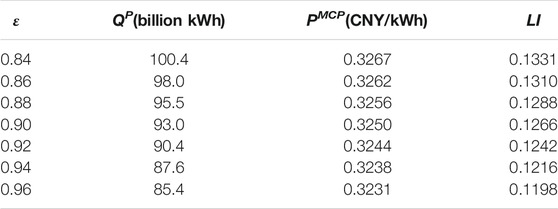
TABLE 3. Market-clearing results under different risk aversion degrees of GCs.
Conclusion
An optimal planned electricity allocation model considering the robust bidding strategy of GCs is constructed under PMDM for PX to determine the proportion of planned electricity in the total energy consumption. The Lerner Index is used to reflect the level of market power. The impact of planned electricity on the market electricity generation cost of GCs under PMDM is considered in the lower level model. Considering the bidding strategies of GCs, the planned electricity quantity is optimized in the upper level model with the objective of minimizing the CVaR of LI. The validity of the model is analyzed by taking the market data of a province in China and the main conclusions are as follows:
1) The market power in the electricity market is effectively decreased under the optimization results of the proposed model. PX can reduce market power by setting a reasonable proportion of planned electricity.
2) The optimal planned electricity decreases with the reduction of the uncertainty of the load demand. PX should improve the load forecasting accuracy and avoid reducing the planned electricity when the load demand fluctuates greatly.
3) The market power is related to the risk aversion degree of GCs. The more the GCs tend to avoid market risks, the lower the market power. For PX, it is necessary to evaluate the risk aversion degree of GCs in the process of orderly deregulation of planned electricity generation and consumption.
In the future, the research on the bidding strategies of GCs or the market methods of PX can be more complicated and comprehensive.
Data Availability Statement
The original contributions presented in the study are included in the article/Supplementary Material, and further inquiries can be directed to the corresponding author.
Author Contributions
CH, LY, and ZL conceptualized the study; JT, WZ, and ZZ performed the analysis; JT, HQ, and HJ performed investigations; JT and CH acquired resources; CH, WZ, ZL, HQ, and HJ acquired funding; CH wrote the original draft; JT, ZZ, and YL reviewed and edited the manuscript. All authors agree to be accountable for the content of the work.
Funding
This work was supported by State Grid Anhui Electric Power Co., Ltd. Science and Technology Project (B31200200006) and National Key R&D Program of China (No. 2016YFB0901100).
Conflict of Interest
CH, JT, WZ, ZL, HQ, and HJ were employed by State Grid Anhui Electric Power Co., Ltd. and Anhui Power Exchange Center Company.
The remaining authors declare that the research was conducted in the absence of any commercial or financial relationships that could be construed as a potential conflict of interest.
References
Annamraju, A., and Nandiraju, S. (2019). Robust Frequency Control in a Renewable Penetrated Power System: an Adaptive Fractional Order-Fuzzy Approach. Prot. Control. Mod. Power Syst. 4 (1), 1–15. doi:10.1186/s41601-019-0130-8
Ansari, B., and Rahimi-Kian, A. (2015). A Dynamic Risk-Constrained Bidding Strategy for Generation Companies Based on Linear Supply Function Model. IEEE Syst. J. 9 (4), 1463–1474. doi:10.1109/JSYST.2015.2427374
Antitrust, D. (2010). United States V. Keyspan Corporation, Public Comments and Response on Proposed Final Judgment. Available at: https://www.federalregister.gov/documents/2010/07/20/2010-16321/united-states-v-keyspan-corporation-public-comments-and-response-on-proposed-final-judgment (Accessed March 8, 2021)
Bompard, E., Carpaneto, E., Ciwei, G., Napoli, R., Benini, M., Gallanti, M., et al. (2008). A Game Theory Simulator for Assessing the Performances of Competitive Electricity Markets. Electric Power Syst. Res. 78 (2), 217–227. doi:10.1016/j.epsr.2007.02.007
Budhraja, V. (2001). California's Electricity Crisis. Vancouver, BC: Power Engineering Society Summer Meeting. doi:10.1109/pess.2001.970051
Choi, S.-H., Hussain, A., and Kim, H.-M. (2018). Adaptive Robust Optimization-Based Optimal Operation of Microgrids Considering Uncertainties in Arrival and Departure Times of Electric Vehicles. Energies. 11 (10), 2646. doi:10.3390/en11102646
Chowdhury, N., Pilo, F., and Pisano, G. (2020). Optimal Energy Storage System Positioning and Sizing with Robust Optimization. Energies 13 (3), 512. doi:10.3390/en13030512
Dagoumas, A. (2019). Impact of Bilateral Contracts on Wholesale Electricity Markets: in a Case where a Market Participant Has Dominant Position. Appl. Sci. 9 (3), 382. doi:10.3390/app9030382
Dault, D., and Shanker, B. (2015). An interior Penalty Method for the Generalized Method of Moments. IEEE Trans. Antennas Propagat. 63 (8), 3561–3568. doi:10.1109/TAP.2015.2430876
Guangdong Economic and Information CommissionGuangdong Development and Reform CommissionNational Energy Administration Southern Supervision Bureau (2017). Notice on Matters Related to Power Users Participating in Market Transactions in 2017. Available at: http://gdii.gd.gov.cn/dlny/content/post_942834.html (Accessed March 8, 2021).
Guangdong Electric Power Exchange Center Co., Ltd (2020). Guangdong Electricity Market Half-Year Report 2020. Available at: https://pm.gd.csg.cn/views/page/xwzxCont-10589.html (Accessed March 8, 2021)
Hajiabadi, M. E., and Samadi, M. (2019). Locational Marginal price Share: a New Structural Market Power index. J. Mod. Power Syst. Clean. Energ. 7 (6), 1709–1720. doi:10.1007/s40565-019-0532-7
Hakam, D. F., Wiyono, S. K., and Hariyanto, N. (2020). Competition in Power Generation: Ex-Ante Analysis of Indonesia's Electricity Market. Energies. 13 (24), 6741. doi:10.3390/en13246741
International Energy Agency (2006). China's Power Sector Reforms: Where to Next. Paris: OECD Publishing
Jiang, D., Liu, X., and Li, Q. (2004). Economically Distributing Strategies for Daily Generation Scheduling in a Power System under Power Market Environment. Proc. Chin. Soc. Electr. Eng. 24 (7), 94–98. doi:10.13334/j.0258-8013.pcsee.2004.07.017
Liu, G., Xu, Y., and Tomsovic, K. (2016). Bidding Strategy for Microgrid in Day-Ahead Market Based on Hybrid Stochastic/robust Optimization. IEEE Trans. Smart Grid. 7 (1), 227–237. doi:10.1109/TSG.2015.2476669
National Development and Reform Commission National Energy Administration (2017). Notice on Orderly Releasing Plans of Power Generation and Power Utilization. Available at: http://www.gov.cn/xinwen/2017-04/11/content_5184607.htm (Accessed March 8, 2021)
Park, k. J., Kim, B., Kim, J., Jung, M., and Park, J. (2001). A Continuous Strategy Game for Power Transactions Analysis in Competitive Electricity Markets. IEEE Trans. Power Syst. 16 (4), 847–855. doi:10.1109/59.962436
Pousinho, H. M. I., Contreras, J., Bakirtzis, A. G., and Catalao, J. P. S. (2013). Risk-constrained Scheduling and Offering Strategies of a price-maker Hydro Producer under Uncertainty. IEEE Trans. Power Syst. 28 (2), 1879–1887. doi:10.1109/TPWRS.2012.2229473
Razmi, P., Oloomi Buygi, M., and Esmalifalak, M. (2021). A Machine Learning Approach for Collusion Detection in Electricity Markets Based on Nash Equilibrium Theory. J. Mod. Power Syst. Clean. Energ. 9 (1), 170–180. doi:10.35833/MPCE.2018.000566
Silva, F. T., Silva, M. X., and Belchior, J. C. (2019). A New Genetic Algorithm Approach Applied to Atomic and Molecular Cluster Studies. Front. Chem. 7, 707. doi:10.3389/fchem.2019.00707
Sioshansi, F. (2013). Evolution of Global Electricity Markets: New Paradigms, New Challenges, New Approaches. USA: Academic Press
Soranzo, A., and Epure, E. (2014). Very Simply Explicitly Invertible Approximations of normal Cumulative and normal Quantile Function. ams. 8 (87), 4323–4341. doi:10.12988/ams.2014.45338
Sun, L., Zhang, N., Li, N., Liu, X., and Li, W. (2020). An Intra-day Rolling Scheduling Considering Energy Equity Based on Gini Coefficient. Power Sys. Techno. 44 (1), 340–347. doi:10.13335/j.1000-3673.pst.2019.1459
Wang, P., Xiao, Y., and Ding, Y. (2004). Nodal Market Power Assessment in Electricity Markets. IEEE Trans. Power Syst. 19 (3), 1373–1379. doi:10.1109/TPWRS.2004.831695
Wen, F., and David, A. (2001). Optimal Bidding Strategies and Modeling of Imperfect Information Among Competitive Generators. IEEE Trans. Power Syst. 16 (1), 15–21. doi:10.1109/59.910776
Woo, C.-K., Lloyd, D., and Tishler, A. (2003). Electricity Market Reform Failures: UK, Norway, Alberta and California. Energy Policy. 31 (11), 1103–1115. doi:10.1016/S0301-4215(02)00211-2
Wu, K., and García de Soto, B. (2020). Spatiotemporal Modeling of Lifting Task Scheduling for tower Cranes with a Tabu Search and 4-D Simulation. Front. Built Environ. 6, 79. doi:10.3389/fbuil.2020.00079
Yin, J., and Zhao, D. (2018). Fuzzy Stochastic Unit Commitment Model with Wind Power and Demand Response under Conditional Value-At-Risk Assessment. Energies. 11 (2), 341. doi:10.3390/en11020341
Zarco, M., and Froese, T. (2018). Self-optimization in Continuous-Time Recurrent Neural Networks. Front. Robot. AI 5, 96. doi:10.3389/frobt.2018.00096
Keywords: plan-market double-track mechanism, planned electricity, conditional value at risk, robust optimization, lerner index
Citation: He C, Tang J, Zhang W, Zhang Z, Lin Z, Li Y, Qian H, Jiang H, Lin Z and Yang L (2021) Optimal Planned Electricity Allocation Model for Power Exchange Under the Plan-Market Double-Track Mechanism. Front. Energy Res. 9:679365. doi: 10.3389/fenrg.2021.679365
Received: 11 March 2021; Accepted: 21 May 2021;
Published: 15 June 2021.
Edited by:
Ningyi Dai, University of Macau, ChinaReviewed by:
Amirreza Naderipour, University of Technology Malaysia, MalaysiaHaibo Li, Tsinghua University, China
Copyright © 2021 He, Tang, Zhang, Zhang, Lin, Li, Qian, Jiang, Lin and Yang. This is an open-access article distributed under the terms of the Creative Commons Attribution License (CC BY). The use, distribution or reproduction in other forums is permitted, provided the original author(s) and the copyright owner(s) are credited and that the original publication in this journal is cited, in accordance with accepted academic practice. No use, distribution or reproduction is permitted which does not comply with these terms.
*Correspondence: Zhenzhi Lin, bGluemhlbnpoaUB6anUuZWR1LmNu