 Mónica Amado
 Cristian Barca
 Mario A. Hernández1*
 Jean-Henry Ferrasse
- 1Facultad de Ingeniería, Universidad EAN, Bogotá D.C., Colombia
- 2Aix Marseille Univ, CNRS, Centrale Marseille, M2P2, Marseille, France
This study provides the first overview in Colombia on energy recovery potential by anaerobic digestion (AD) and dark fermentation (DF) of three different residual biomasses: coffee mucilage (CFM), cocoa mucilage (CCM), and swine manure (SM). First, AD and DF models were developed based on the ADM1 model. Then, simulated biogas production yields were compared to experimental data to validate the models. The results of comparative simulations indicate that energy recovery potentials from biogas for the different Colombian departments range from 148 to 48,990 toe, according to the local production amounts of CFM, CCM, and SM in 2017. The study provides crucial information that can be used to assess the best design, operation mode, and locations of AD and DF plants in Colombia. The results indicate that biogas production performances and energy recovery yields improve by increasing CFM/SM and/or CCM/SM ratios of the feed, and by increasing organic load from 2 to 26 gCOD∙l−1.
Introduction
Biomass is considered a renewable source for several production processes such as biofuel and metabolite production (Osman et al., 2019; IEA, 2020), and, consequently, an increasing number of international studies have been investigating the valorization potential of different biomass types during the last two decades. Furthermore, legislation restrictions have led researchers to focus on developing sustainable biomass management and treatment (Gonzalez-Salazar et al., 2014; Rajesh Banu et al., 2020). Since 2010, in Colombia, the National Administrative Department of Statistics (DANE) has reported an increase in different agro-industrial activities (DANE, 2020), which has improved the income and social benefits of the national economy. According to DANE data (2018), coffee production increased from 0.64 to 0.86 Mton, cocoa production from 34.9 to 101 kton, and pork production from 0.23 to 0.41 Mton between 2011 and 2018 (Supplementary Figure S1), resulting in increased production of residual biomass from these agro-industrial sectors (e.g. coffee and cocoa mucilage, and swine manure). This residual biomass requires treatment processes for biological stabilization and/or final disposal, which represent an over cost for the agro-industry.
In recent years, biogas production has been identified as a sustainable process to treat and valorize residual biomass in Colombia (Hernández et al., 2014; Hernandez et al., 2018; Sagastume Gutiérrez et al., 2020). In this context, coffee and cocoa mucilage usually have high contents in carbohydrates, including dextrose, cellulose, hemicellulose, and others. Carbohydrates are fundamental compounds in the processes of dark fermentation (DF) and anaerobic digestion (AD) for biochemical conversions such as acidogenesis, acetogenesis, methanogenesis and fermentation, thus leading to the production of biogas and other by-products (e.g. volatile fatty acids, alcohols) (Redgwell et al., 2003; Battista et al., 2016; Okiyama et al., 2017). Meanwhile, swine manure usually presents high alkalinity and high contents of proteins and nutrients (e.g. phosphorus and nitrogen), which may improve pH control and decrease the ratio of carbon to nitrogen (C/N) in co-digestion processes (Astals et al., 2011, 2015; Ye et al., 2013; Hernández et al., 2014; Neshat et al., 2017; Wang et al., 2018).
The simulation of bioprocesses presents new advantages due to the computational development that contributes to complex calculations. Indeed, process simulation represents a powerful tool for industry and researchers because it evaluates real scenarios with cheaper costs (Astals et al., 2011; Rajendran et al., 2014a, 2014b). The Anaerobic Digestion Model No 1 (ADM1) is one of the most referenced models in the literature for the description of anaerobic processes (Batstone et al., 2002). It has been used as a base model for the development of most of the latest AD and DF models (Penumathsa et al., 2008; Antonopoulou et al., 2012; Saady, 2013; Rajendran et al., 2014a; Alexandropoulou et al., 2018). Although studies have been carried out to assess the energy potential of a large number of different substrates, in the literature to date there is no systematic and complete study of AD and DF for coffee and cocoa mucilage or possible blends with swine manure.
This study aims to provide the first overview in Colombia on energy recovery potential by AD and DF of coffee mucilage, cocoa mucilage, and swine manure. The main objectives are 1) to develop the AD and DF models for the simulation of the bioprocesses, 2) to identify the most suitable blends and process schemes for biogas production (e.g. AD, DF, and DF followed by AD), and 3) to evaluate the energy recovery potential of residual biomass in Colombia. First, AD and DF process models were developed based on the ADM1 model. Conversion reactions and yields, inhibition modules, and kinetic constants from the literature were included in the models, and simulations were performed at mesophilic temperature conditions (35°C) by using the commercial software Aspen Plus. The biogas production yields obtained by simulations were compared with experimental results of laboratory tests to validate the models. Finally, the developed models of AD and DF were used to assess the energy recovery potentials of the different Colombian departments based on the local availability of residual biomass. The energy recovery potentials using a comparative simulation approach between three biogas production processes were assessed to identify the most suitable scenarios for residual biomass valorization in Colombia.
Material and Methods
Model Development and Simulation Design
Simulation of the biological processes of AD and DF was performed in Aspen Plus V9 software, the Soave-Redlich-Kwong (SRK) method was chosen as it correlates and calculates the mole fractions and activity coefficients. In addition, the SRK model is suitable for vapor-liquid equilibrium (VLE) (Madeira et al., 2017). The starting point for the simulation of AD was the ADM1 model, which relates the stoichiometric equations for the stages of hydrolysis, acidogenesis, acetogenesis, and methanogenesis (Serrano, 2010). The same methodology was also used to simulate the stages of hydrolysis, amino acid degradation, and fermentation for DF, as proposed by Serrano (2011).
For each simulation in Aspen Plus, carbohydrates (e.g. dextrose), complex carbohydrates (e.g. cellulose, hemicellulose), fats (triolein, tripalmitin), proteins, and water mass fractions of the feed substrate were included in the reactor inlet stream. A maximum of 3 U were used in Aspen Plus to simulate all stages of the biological processes (Figure 1).
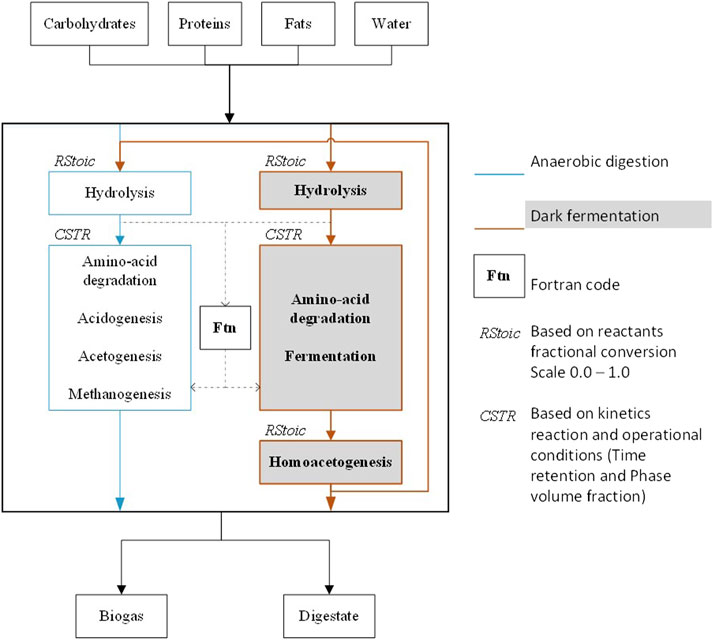
FIGURE 1. Block diagram of simulated processes in Aspen Plus.
The first unit is a stoichiometric reactor (RStoic) that simulates the hydrolysis stage for both the AD and DF processes. It calculates the mass flows for carbohydrates, proteins, and fats based on the hydrolysis reactions and fractional conversions (Supplementary Table S1) (Rajendran et al., 2014a).
The second unit is a continuous stirred tank reactor (CSTR) for both the AD and DF processes. The CSTR was selected following the most common operating mode of AD and DF reactors in the literature (Barca et al., 2015; Adarme et al., 2017; Neshat et al., 2017; Rajesh Banu et al., 2020). The CSTR simulates the processes of amino acid degradation, acidogenesis, acetogenesis and methanogenesis for AD, and amino acid degradation and fermentation for DF (Figure 1). A set of 42 reactions was used to describe the main metabolic pathways associated with the bioconversions for the AD and DF processes (Supplementary Table S2) (Rajendran et al., 2014a). The compounds in Table S2 come from the feed substrates and/or from the hydrolysis stage (Supplementary Table S1). All the kinetic reactions are supposed to follow first-order kinetics (Angelidaki et al., 1999). Simulations were performed according to the process simulation model (PSM) proposed by (Rajendran et al., 2014a). PSM model is based on the ADM1, and it includes ammonia inhibition on the calculations of the kinetic constants for the conversion reactions, thus following the model proposed by Angelidaki et al. (1993) and Angelidaki et al. (1999). The model also takes into account variables such as pH and temperature to the calculations of the kinetic constants by correlation functions presented by (Siegrist et al., 1993; Vavilin et al., 1994; Serrano, 2010). All these correlation functions were introduced in the CSTR unit through calculator blocks available in Aspen Plus. Each calculator block had a FORTRAN code to determine the kinetic constants of the conversion reactions. In addition, for DF process a calculator block was integrated into the model to establish the restriction of hydrogen gas production yield from carbohydrates within the values 1–4 mol H2∙mol hexose−1, where 4 is the maximum stoichiometric yield (Alexandropoulou et al., 2018).
The third unit was developed and applied for the DF process to simulate the homoacetogenic stage, which involves the consumption of hydrogen (H2) and carbon dioxide (CO2) gas (Eq. 1) (Saady, 2013).
H2 consumption by homoacetogenesis usually increases by increasing the mass transfer limitation of H2 from the liquid to the gas phase (Saady, 2013). In this study, the minimum conversion rates reported in the literature (Saady, 2013) were considered to simulate low mass transfer limitation conditions in the DF reactors. According to this, homoacetogenesis is carried out in an RStoic block with a conversion factor of 0.1 ± 0.1, as a function of the H2 and CO2 composition of the biogas produced during the fermentation step. The methanogenic stage controls the H2 concentration as H2 is consumed by hydrogentrophic methanogenesis (pathway n° 39, Supplementary Table S2). Therefore, the homoacetogenic stage is discarded for the AD process.
Substrate Characterisation
The residual biomasses selected for this study were coffee mucilage (CFM), cocoa mucilage (CCM) and swine manure (SM), which are related to the most relevant agro-industrial activities in Colombia. Raw samples of CCM, CFM and SM were collected from the departments of Santander and Cundinamarca from the farms on a medium production scale. Then, the total volatile solids (TVS) and total organic load (COD) of the samples were determined by standard methods (APHA, 2005). Total carbohydrates, cellulose, hemicellulose, lignin, and protein were determined by high performance liquid chromatography (HPLC), by using a chromatographer Agilent Model 1200 (Agilent Technology, United States). Total organic carbon (C) was determined by the Walkley Black titration method according to the Colombian technical norm NTC 5167 (2003). Total organic nitrogen (N) and total organic sulfur (S) were determined after acid digestion according to the Kjeldahl method and to the barium sulfate precipitation method, respectively. Then, oxygen (O) and hydrogen (H) contents were estimated stoichiometrically. The results of biomass characterization are summarized in Table 1. These results are in good agreement with those provided by the online database of the Netherlands Energy Research Center (Phyllis2, 2020).

TABLE 1. Composition of coffee mucilage, cocoa mucilage, and swine manure.
A new category for the substrates had to be created in Aspen Plus due to the database not having this specific kind of complex biomaterials. Therefore, CCM, CFM and SM were defined in the database of Aspen Plus through a set of specific properties, as summarized in Table 1. In the inlet streams for AD and DF models, total fats were divided in equal fractions between triolein and tripalmitin.
Model Validation
The validation of the AD and DF models was carried out by comparison of simulated results to those of batch laboratory tests that aimed at evaluating the biogas production potential of different blends of CFM, CCM, and SM (Cabeza et al., 2016; Hernandez et al., 2018). A Box-Behnken design (Table 2), based on three independent parameters, was used to determine the number of blends for the comparative experiments: 1) the dried mass ratio between CFM and CCM (CFM:CCM ratio), 2) the mass ratio of C to N (C/N ratio), and 3) the total organic load. For each parameter, three levels were considered: the CFM:CCM ratios were 3:1, 1:1, and 1:3; the C/N ratios were 25, 35, and 45; and the organic loads, based on chemical oxygen demand (COD), were 2, 5, and 8 gCOD·l−1. SM was used as N rich substrate to set the C/N ratio of each blend. Then, distilled water was added to set the COD concentrations of each blend.
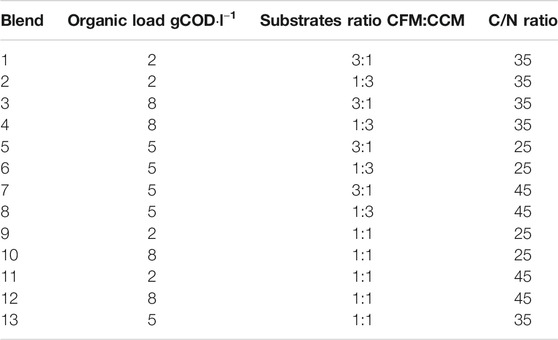
TABLE 2. Total organic loads, CFM:CCM dried mass ratios, and C/N mass ratios of the different blends used for laboratory experiments of AD and DF.
The experiments were carried out in 250 ml bottles with a total working volume of 200 ml. The reactors were operated under batch conditions and at mesophilic temperature (35°C). The inoculum used for AD and DF experiments was obtained from the biodigester of the wastewater treatment plant of a dairy company (ALPINA, Sopó, Cundinamarca). Before DF tests, a heat shock treatment of the inoculum (30 min at 100°C) was applied to select spore-forming hydrogen-producing bacteria and to destroy hydrogen-consuming archaea that are usually non-spore-forming (Barca et al., 2015). The measurement of methane (CH4) and hydrogen gas (H2) was taken daily by volume displacement. NaOH solution (pH > 10) was used as a carbon dioxide gas (CO2) trap and, therefore, it is assumed that the displaced gas only corresponds to CH4 in process AD and H2 in process DF. The duration of the tests was between 10 and 20 days for AD, and between 5 and 12 days for DF experiments. The experimental biogas yields (ml CH4∙g COD−1 and ml H2∙g COD−1 for AD and DF, respectively) were calculated based on the cumulated volume of biogas produced from each experiment. All the tests were performed in triplicate and average biogas yields were determined for each experimental condition. As the duration of the tests varied between the different experiments, it was used as the input value of hydraulic retention time for each simulation. All simulations were performed at 35°C and 0.1 MPa. The simulated biogas production yields (ml biogas∙g COD−1) were calculated based on the mass amount of CH4, H2, and CO2, and on the density of each compound at standard conditions (25°C and 0.1 MPa).
Process Scheme Simulation
The biogas production performances of each substrate blend (Table 2) were further simulated at three different process schemes: anaerobic digestion (AD), dark fermentation (DF), and dark fermentation followed by anaerobic digestion (ADF). The main objective was to identify the most suitable blends and process schemes, for the production of biogas or a specific gas (CH4, H2, CO2), using a comparative simulation approach, thus taking into account relevant factors such as the C/N ratio and the organic load of the feed. Indeed, previous studies have already shown that these factors may significantly affect biogas production performance (Zhang et al., 2014; Xie et al., 2016; Kovalovszki et al., 2017; Mosquera et al., 2020). All the simulations were performed at 35°C and 0.1 MPa, and according to hydraulic retention times of 20 and 10 days for AD and DF, respectively. Then, the biogas yields (ml biogas∙g COD−1) were calculated to assess and compare the performances of the different process scenarios.
Evaluation of Energy Recovery Potential in Colombia
The energy recovery potential in Colombia was based on residual biomass production data of 26 departments (out of the 32 Colombian departments) according to the agricultural production reports of the National Department of Statistics, the Colombian Institute of Agriculture, and the National Pork Producers Association (DANE, 2020). A factor of 0.75 was used to estimate the CFM and CCM effectively available (Şenol, 2019), thus assuming 25% of losses in their collection. In addition, the SM availability was calculated as 75% of the total SM from technical farms (ICA, 2018). Once the availability of CFM, CCM, and SM was established, the annual total was divided as daily flow and the ADF process was simulated for each department. The inlet organic load of 26 gCOD·l−1 was used as an input value for all the department simulations based on the COD concentration of the substrates (Table 1) and their total available amounts for each department (Table 3). Temperatures and heat duties, from the results of ADF simulations, were analyzed and gathered to perform the heat integration procedure, according to the pinch method, thus considering the minimum approach temperature ΔTmin of 3°C. Heat transfer from the effluents was integrated into the calculations by considering their cooling down to a temperature of 25°C (Abdou Alio et al., 2021).

TABLE 3. Total available amounts of CFM, CCM, and SM (wet mass) in 2017.
For each department, the total daily masses of inlet substrate Msubstrate (CCM, CFM, SM) (kg∙day−1), outlet biogas Mbiogas (NH3, CO2, H2, CH4, H2S) (kg∙day−1), and outlet digestate Mdigestate (propionate, butyrate, ethanol, benzene, acetate, furfural, residual carbohydrates, and proteins) (kg∙day−1), were calculated based on the results from simulations. Then, total input power Pinput (MJ∙day−1), substrate power Psubstrate (MJ∙day−1), biogas power Pbiogas (MJ∙day−1), and digestate power Pdigestate (MJ∙day−1) were determined by Eqs 2–5, respectively, where LHV is the related lower heating value (MJ/kg) and Pprocess (MJ∙day−1) represents the energy flow required to heat the feedstock and maintain a constant process temperature in the reactors.
The energy recovery potentials E (toe) from biogas and digestate by ADF process were calculated using Eqs 6, 7, respectively, where d represents the days of the year (365) and fE represents the conversion factor ton of oil equivalent per Joule (2.388ˑ10−5 toe/MJ).
The energy recovery yields for biogas
Finally, a sensitivity analysis of the ADF model was made to assess the effect of nine different organic loads (from 2 to 26 gCOD·l−1) on the total energy recovery yields
Results and Discussion
Model Validation
Figure 2 shows the correlation between simulated and experimental biogas production yields for the different blends tested. Overall, the results show an average ratio between simulated and experimental yields (ysim/yexp) of 1.05 ± 0.24 for AD and 1.17 ± 0.28 for DF (average values ± standard deviations), respectively, thus indicating a good general agreement between the data.
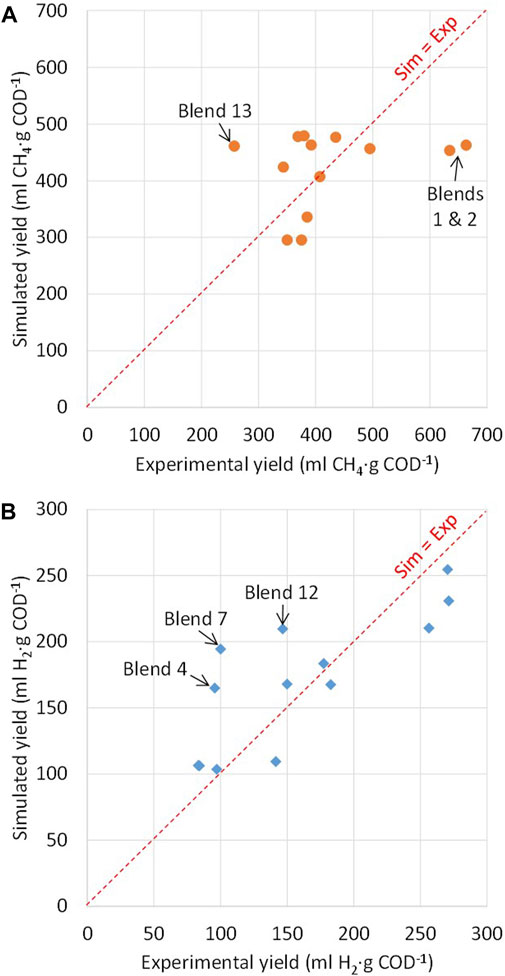
FIGURE 2. Simulated and experimental biogas production yields: (A) anaerobic digestion (AD); (B) dark fermentation (DF).
With the only exceptions of blends 1, 2, and 13, the ratio ysim/yexp for AD varied from 0.79 to 1.26 (Figure 2A), thus indicating that the AD model gives a good estimation of CH4 production yields. The lowest differences were observed for blends 3, 7, and 10 (ysim/yexp ratios of 0.92, 1.00, and 1.09, respectively), whereas the highest differences were observed for blends 2 and 13 (ysim/yexp ratios of 0.70 and 1.79, respectively). The results indicate that the differences between simulated and experimental data for AD increase by decreasing the organic loads and/or by increasing the SM content of the blends. Higher organic loads probably resulted in dominant organic compounds in the blends used for the experiments, thus leading to more stable and more predictable conversion pathways. Moreover, variability in the single substrate composition used for the different experiments, especially for SM, may further explain the differences between simulated and experimental yields.
With the only exceptions of blends 4, 7, and 12, the ratio ysim/yexp for DF varied from 0.77 to 1.28 (Figure 2B), thus confirming the validity of the DF model. The lowest differences were observed for blends 3 and 6 (ysim/yexp ratios of 1.03 and 1.06, respectively), whereas the highest differences were observed for blends 4, 7, and 12 (ysim/yexp ratios of 1.72, 1,94, and 1.43, respectively), thus indicating an overestimation of H2 production yields compared to the experimental data. The results of DF seem to indicate that the differences between simulated and experimental yields increase by increasing the CCM and/or CFM loads of the blends. Most probably, incomplete hydrolysis of complex carbohydrates (e.g. cellulose, hemicellulose) may account for the lower experimental yields for blends at high loads of CCM and/or CFM (blends 4 and 7, respectively).
The results of the validation model suggest that variability on single substrate composition between the different experiments and incomplete hydrolysis of carbohydrates may account for the differences between simulated and experimental yields. However, using the same AD and DF models for evaluating the potential of biogas production potential from model substrates may overcome these technical limitations of laboratory experiments and thus allow comparison of the potential of energy recovery potentials from different blends and different process schemes.
Simulated Biogas Production Performances
The total biogas production yields and compositions obtained by the simulations of AD, DF, and DF followed by AD (ADF) processes, for the different substrate blends (Table 2), are summarized in Figure 3.
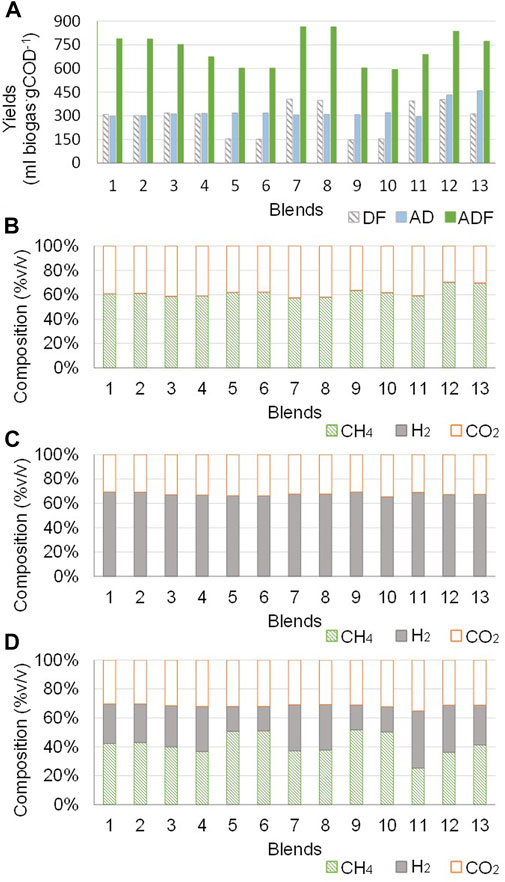
FIGURE 3. Simulations of AD, DF, and ADF processes for the different substrate blends: (A) Total biogas production yields for AD, DF, and ADF; (B) Biogas composition for AD; (C) Biogas composition for DF; (D) Biogas composition for ADF.
The biogas production yields for DF varied between 147 and 405 ml biogas·gCOD−1, and the H2 and CO2 content of biogas varied between 65–70% and 30–35%, respectively (Figure 3C). These results are in good agreement with the theoretical compositions of biogas from the fermentative pathways used for DF simulation (n° 39 and 40, Supplementary Table S2) (Gomes et al., 2015). The lowest biogas production yield for DF was observed for blend 9, where the dominant substrate is SM (more than 80% based on total organic load) and COD concentration is 2 gCOD∙l−1. Instead, the highest biogas production yield for DF was observed for blend 7, where the dominant substrate is CFM and COD concentration is 5 gCOD∙l−1. These differences in biogas production yields are probably primarily related to the different compositions of proteins, fats, and carbohydrates considered for CFM and SM (Table 1). Higher carbohydrate content of CFM resulted in higher H2 production yields for blend 7, as carbohydrates represent the most suitable substrate for DF (pathways n° 39 and 40, Supplementary Table S2), whereas higher protein content of SM resulted to lower C/N ratios that may inhibit DF as described by the ammonia inhibition modules integrated into the model (Madeira et al., 2017; Serrano, 2011). These results are in good agreement with the findings of previous experimental studies (Zhu et al., 2008; Ghimire et al., 2015), which have indicated that low C/N ratio and high concentration of ammonium ion (NH4+) inhibit H2 production during DF when SM is used as the only substrate, with maximum production yields of 3.65 ml H2∙VS−1. Indeed, higher production yields (from 68 to 652 ml H2∙gCOD−1) were obtained by co-fermentation of substrate blends (e.g. swine manure, sewage sludge, food waste, agro-industrial waste) (Kim et al., 2004; Perera et al., 2012; Hernández et al., 2014).
The biogas production yields for AD varied between 295 and 459 ml biogas·gCOD−1, thus showing a lower variability according to the different blends rather than DF. The CH4, CO2 and H2 biogas components were 57–70%, 29–42%, and 0.3–0.4%, respectively (Figure 3B). Higher yields of biogas production were observed for blends containing higher amounts of CFM and CCM rather than SM. Overall, biogas production yields obtained by simulations are within the ranges reported in the literature (61–650 ml CH4∙gCOD−1). This large variability in experimental yields is mainly attributed to the different organic substrates and operating parameters (e.g. retention time, temperature, inoculum) between the different studies (Garfí et al., 2011; Hernández and Rodríguez, 2013; Astals et al., 2015). The blends 12 and 13, with equal CFM and CCM contents, showed the highest biogas yields (433 and 459 ml biogas·gCOD−1, respectively) with the highest CH4 content (70 and 69%, respectively). Therefore, they appear to be the most suitable blends for AD. These results are consistent with the experimental results of Wang et al. (Wang et al., 2018), who indicated that biogas production performances of AD are significantly affected by the ratios of swine manure, corn stove, and cucumber residues in the co-digested mixture.
The biogas production yields for DF followed by AD (ADF) varied between 602 and 864 ml biogas·gCOD−1, and the CH4, CO2, and H2 content of biogas varied between 25–51%, 30–35%, and 17–40%, respectively (Figure 3D). The highest total biogas production yields were observed for blends 7 and 8 (863 and 864 ml biogas·gCOD−1, respectively), where the CFM and CCM are above 65% of the total organic load. Additionally, one of the substrates, CFM or CCM, dominates over the others. The lowest yields (<160 ml biogas·gCOD−1) were obtained for blends 5, 6, 9, and 10, where SM is greater than 80% over the total organic load. However, despite the lowest biogas production yields, these blends also show the highest CH4 contents in biogas. This appears to confirm that SM is more suitable for CH4 than for H2 production, most probably because it has a lower content in carbohydrates compared to the other substrates. While, blends with an SM load equal or lower than those of CFM and CCM (blends 7, 8, 11, 12, and 13) generate biogas with CH4 and H2 contents comprised between 28 and 40%. ADF showed higher yields of total biogas production compared to AD and DF, this for all the substrate blends studied. As shown in Figure 3A, total biogas production yields for ADF were 1.3–2.3 times higher than DF, and 1.5–2.4 times higher than AD, thus indicating a greater conversion efficiency of organic substrate to biogas. This is coherent with the assumptions of the ADM1 model that was used for the simulations, as organic products from DF (e.g. volatile fatty acids) represent viable substrates for methanogenesis in the AD process (Hernández et al., 2014), thus increasing the total biogas production yields (Yeshanew et al., 2018).
The results of the simulations confirm the effectiveness of co-digestion of CFM, CCM, and SM, in a two-step process of DF followed by AD compared to the individual process steps. The higher content in proteins, fats, and hemicellulose of SM supports the production of fatty acids, amino acids, and carbohydrates by hydrolysis in the DF step (Supplementary Table S1). These byproducts are further converted and used as substrates for CH4 production by acidogenesis, acetogenesis, and methanogenesis in the AD step (Supplementary Table S2). Instead, the higher content in carbohydrates of CFM and CCM conducted to the production of acetate and H2 by fermentation in the DF step (Supplementary Table S2), which are used as substrates for CH4 production by acetotrophic and hydrogenotrophic methanogenesis in the AD step (pathways 37 and 38, Supplementary Table S2). Moreover, the simulation results show that different organic loadings do not seem to have a significant impact on the production yields and biogas composition for the different blends and processes studied. This behavior was related to all blends and processes simulated with the same stoichiometric ratios, considering residence times long enough to reach conversion equilibrium and without considering excess substrate inhibition. However, despite showing similar production yields, higher organic loads may give higher flow rates of biogas production in real operating conditions, as more organic substrate is available for biogas production per unit of time (Barca et al., 2015).
Evaluation of Energy Recovery Potential in Colombia
Among the 26 departments considered in this study, 17 report coffee production more than twice higher than cocoa production (DANE, 2020). Only eight departments (Bolívar, Córdoba, La Guajira, Meta, Arauca, Putumayo, and Vichada) show higher cocoa production than coffee production, and their total coffee production amounts are relatively low (<210 tons of coffee/year) compared to the other departments (>2000 tons of coffee/year). According to DANE data (2017), the departments of Huila, Cauca, Tolima, Caldas, and Antioquia generates 73% of the Colombian coffee production and they are therefore considered as the main Colombian coffee region. Additionally, their coffee production is more than 15 times higher than their cocoa production, thus indicating a much lower availability of CCM rather than CFM (Supplementary Figures S2, S3).
Table 3 summarizes the CFM, CCM, and SM availability data for 26 Colombian departments in 2017. Overall, the data indicates that CFM production dominates over CCM production in the center and south of the Andean region (Antioquia, Huila, Tolima, Caldas, Risaralda, Quindío), in the Pacific region (Chocó, Valle del Cauca, Nariño, Cauca), and more generally in the south-west of Colombia, whereas CCM production dominates over CFM production in the Orinoquía region (Arauca, Casanare, Meta, Vichada), in the Caribbean region (Atlántico, Bolívar, Córdoba, Sucre, La Guajira Cesar, Magdalena), in the north of the Andean region (Boyacá, Norte de Santander, Cundinamarca, Santander), and more generally in the north-east of Colombia. The Amazon region does not show significant productions of CFM and CCM, with the only exception of the department of Caquetá. SM availability per department in 2017 varies from 3,347 ton (Vichada) to 1084000 ton (Antioquia). The mass ratio of available SM over the sum of available CFM, CCM, and SM (SM/total) varies from 0.878 (Santander) to 1.000 (Atlántico), thus indicating a larger availability of SM compared to CFM and CCM for all the departments.
For each department, the potential recovery of biogas and digestate was evaluated by comparative ADF simulations according to the total available amounts of CFM, CCM, and SM in 2017, and considering for all the simulations an inlet COD concentration of 26 g COD∙l−1. As shown in Table 4, the total mass of biogas recovered per department varied from 307.6 ton (Vichada) to 102200 ton (Antioquia), whereas the total mass of digestate recovered per department varied from 146.3 ton (Vichada) to 47,580 ton (Antioquia). The main components of biogas were CO2 and CH4, with an evaluated production potential ranging between 176.6–58,960 ton and 105.7–34,950 ton, respectively, whereas the main components of digestate were ethyl cianoacetate and propionate, with an evaluated production potential ranging between 11.19–3,693 ton and 10.08–3,295 ton, respectively.
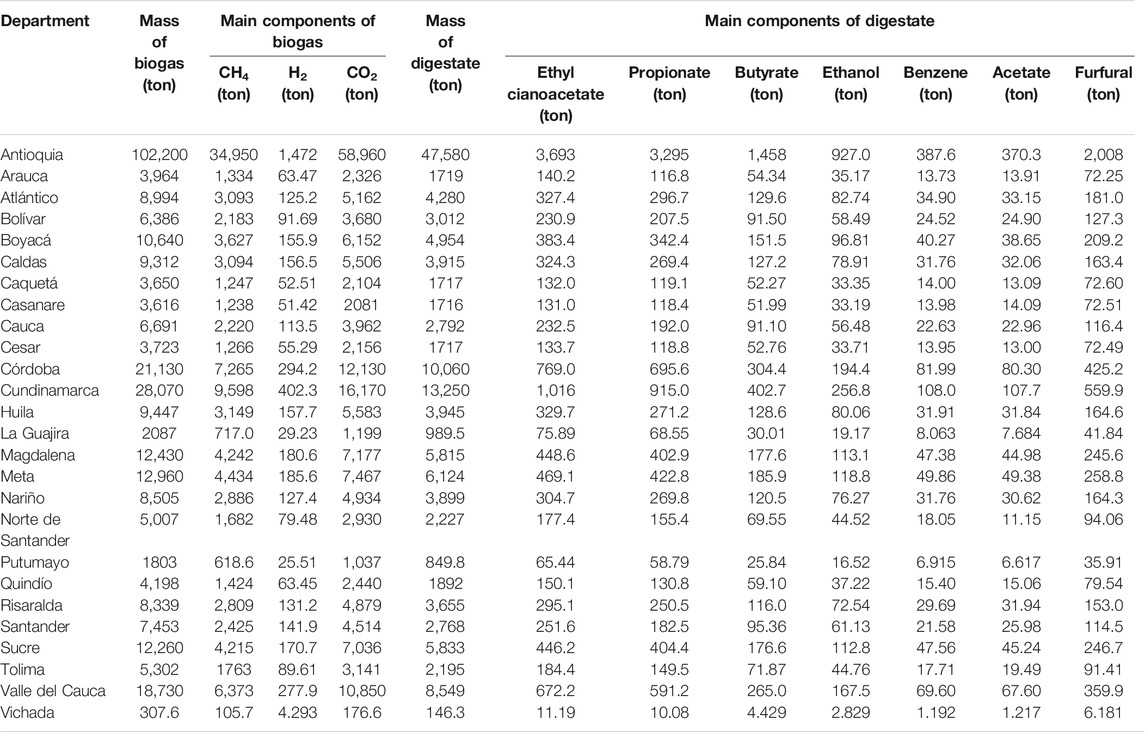
TABLE 4. Total mass and main components of biogas and dried mass and main components of digestate obtained by ADF simulation according to the total availability of CFM, CCM, and SM in 2017 (inlet organic load 26 gCOD·l−1).
Table 5 summarizes the energy recovery potential (toe) from the biogas and digestate obtained for each department based on production data of 2017, as well as the energy recovery yields for biogas
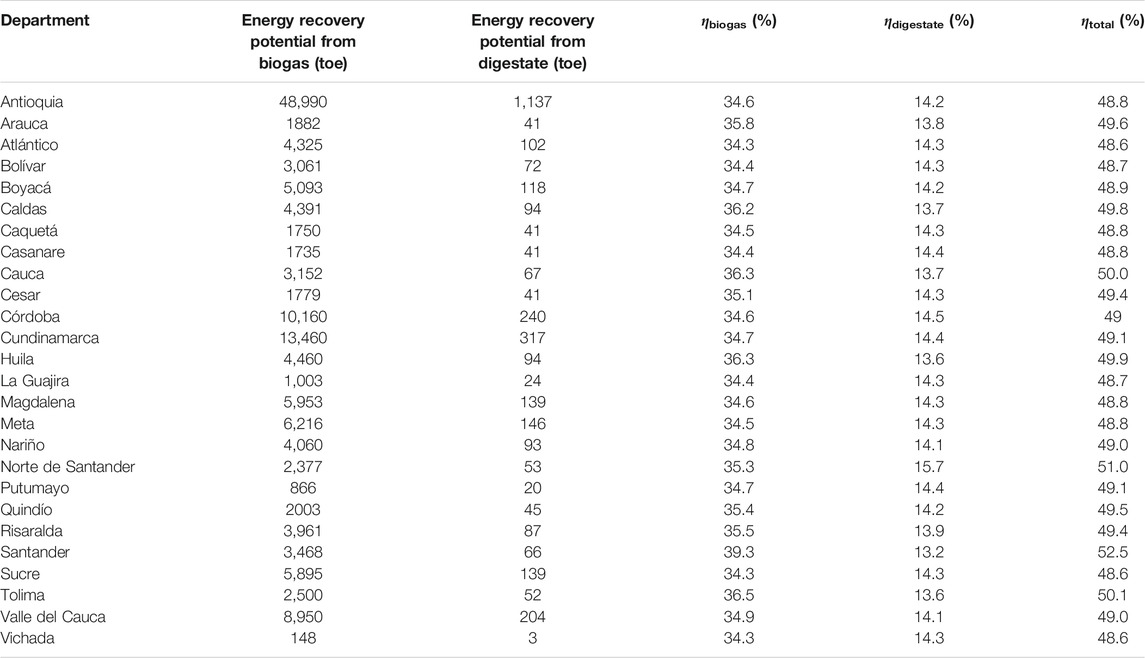
TABLE 5. Energy recovery potential from biogas and digestate, energy recovery yields for biogas and digestate, and total energy recovery yields obtained by ADF simulation according to the total availability of CFM, CCM, and SM in 2017 (inlet organic load 26 gCOD·l−1).
As shown in Table 5, the energy recovery yields for biogas
The results show higher total energy recovery yields
Effect of Organic Load on Energy Recovery Yield
One of the impact factors on biogas production yields is the input load (Jiang et al., 2020). Figure 4 shows the evolution of total energy recovery yield
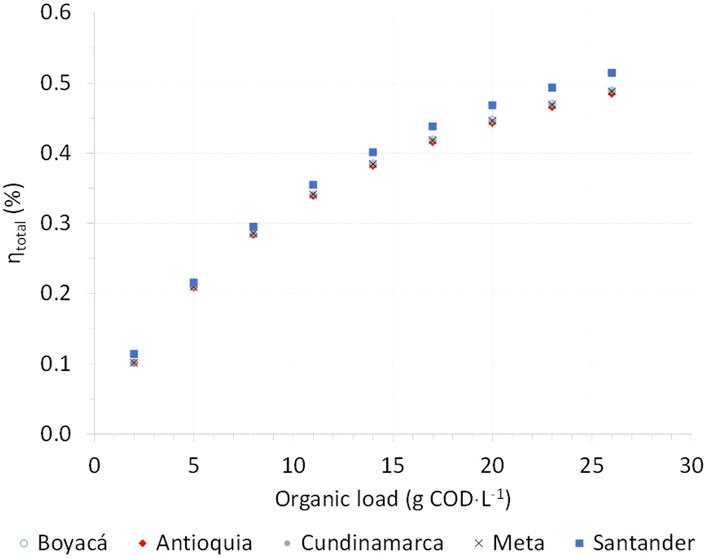
FIGURE 4. Total energy recovery yield as a function of inlet organic load: comparative ADF simulations according to CFM, CCM, and SM production data in 2017.
Closing Remarks and Perspectives
In recent years the Colombian economy has come to strongly depend on hydrocarbon production from non-renewable natural resources. In April 2020, 16.6 million barrels of crude oil were exported, which represented a 19.7% drop compared to April 2019 (DANE, 2020). Biofuel production from alternative renewable sources such as agro-industrial wastes may represent a sustainable way to overcome the shortage of natural deposits of fossil carbon. During the last 5 yr, the increase in pork breeding, coffee, and cocoa production (DANE, 2020) suggests an interesting potential market of SM, CFM, and CCM valorization as organic substrates for biogas production. However, the fluctuation in production of these residual biomasses may represent a weakness for perspective evaluations, and therefore a regular updating of inlet data for the models is recommended to better follow future production dynamics. It should also be noticed that most of the coffee, cocoa, and pork production activities are located in rural areas, and, currently, more than 20% of transport roads in Colombia are without pavement (DANE, 2020). This may significantly hinder the collection of co-substrates from different production areas, and it may also generate supplementary transport costs. The bioprocess simulation approach developed in this study may be followed to evaluate energy recovery potential from other types of locally available substrates (IEA, 2020), thus showing flexibility of adaptation to local contexts. Furthermore, the integration of thermochemical (e.g. gasification, pyrolysis, hydrothermal liquefaction) and separation (e.g. membrane, extraction, distillation) processes may allow the recovery of further by-products (e.g. nutrients, biochar, amino acids, organic acids) from the effluents of AD and DF processes (Cebreiros et al., 2017; Arora et al., 2018; Rajesh Banu et al., 2020; Uddin et al., 2021). Therefore, an accurate life cycle analysis (LCA), integrating energy balances and operating costs for each unit of the process, would be required to identify the best design, location, and size of the biorefinery plants in Colombia.
Conclusion
This study contributes to the development of AD and DF models to assess biogas production performances from residual biomass. The results indicate that the local availability of different types of residual biomass represents the most influential parameter in assessing the energy recovery potential in Colombia. The energy recovery potential in Colombia for 2017 is 155.1 ktoe according to the local production amounts of CFM, CCM, and SM. Overall, energy recovery yields improve by increasing CFM/SM and/or CCM/SM ratios of the feed, and by increasing organic load from 2 to 26 gCOD∙l−1.
Data Availability Statement
The raw data supporting the conclusions of this article will be made available by the authors, without undue reservation.
Author Contributions
MA and J-HF contributed to process design and simulation and PINCH analysis. MH, contributed to experimental design of the study, J-HF contributed design of the energy analysis. MA organized the database and wrote the first draft of the manuscript. MA and CB wrote sections of the manuscript. All authors contributed to manuscript revision, read, and approved the submitted version.
Funding
The authors acknowledge financial support from Minciencias (Ministry of Science, Technology and Innovation of Colombia) - Project number FP44842-38-2017 - – contract 038-2017.
Conflict of Interest
The authors declare that the research was conducted in the absence of any commercial or financial relationships that could be construed as a potential conflict of interest.
Supplementary Material
The Supplementary Material for this article can be found online at: https://www.frontiersin.org/articles/10.3389/fenrg.2021.690161/full#supplementary-material
References
Abdou Alio, M., Marcati, A., Pons, A., and Vial, C. (2021). Modeling and Simulation of a Sawdust Mixture-Based Integrated Biorefinery Plant Producing Bioethanol. Bioresour. Technol. 325, 124650. doi:10.1016/j.biortech.2020.124650
Adarme, O. F. H., Baêta, B. E. L., Lima, D. R. S., Gurgel, L. V. A., and de Aquino, S. F. (2017). Methane and Hydrogen Production from Anaerobic Digestion of Soluble Fraction Obtained by Sugarcane Bagasse Ozonation. Ind. Crops Prod. 109, 288–299. doi:10.1016/j.indcrop.2017.08.040
Alexandropoulou, M., Antonopoulou, G., and Lyberatos, G. (2018). A Novel Approach of Modeling Continuous Dark Hydrogen Fermentation. Bioresour. Technol. 250, 784–792. doi:10.1016/j.biortech.2017.12.005
Angelidaki, I., Ellegaard, L., and Ahring, B. K. (1993). A Mathematical Model For Dynamic Simulation of Anaerobic Digestion of Complex Substrates: Focusing on Ammonia Inhibition. Biotechnol. Bioeng. 42, 159–166. doi:10.1002/bit.260420203
Angelidaki, I., Ellegaard, L., and Ahring, B. K. (1999). A Comprehensive Model of Anaerobic Bioconversion of Complex Substrates to Biogas. Biotechnol. Bioeng. 63, 363–372. doi:10.1002/(SICI)1097-0290(19990505)63:3<363::AID-BIT13>3.0.CO;2-Z
Antonopoulou, G., Gavala, H. N., Skiadas, I. V., and Lyberatos, G. (2012). Modeling of Fermentative Hydrogen Production from Sweet Sorghum Extract Based on Modified ADM1. Int. J. Hydrog. Energ. 37, 191–208. doi:10.1016/j.ijhydene.2011.09.081
APHA (2005). Standard Methods for the Examination of Water and Wastewater. Stand. Methods. Available at: https://www.standardmethods.org/
Arora, A., Banerjee, J., Vijayaraghavan, R., MacFarlane, D., and Patti, A. F. (2018). Process Design and Techno-Economic Analysis of an Integrated Mango Processing Waste Biorefinery. Ind. Crops Prod. 116, 24–34. doi:10.1016/j.indcrop.2018.02.061
Astals, S., Ariso, M., Galí, A., and Mata-Alvarez, J. (2011). Co-digestion of Pig Manure and Glycerine: Experimental and Modelling Study. J. Environ. Manage. 92, 1091–1096. doi:10.1016/j.jenvman.2010.11.014
Astals, S., Musenze, R. S., Bai, X., Tannock, S., Tait, S., Pratt, S., et al. (2015). Anaerobic Co-digestion of Pig Manure and Algae: Impact of Intracellular Algal Products Recovery on Co-digestion Performance. Bioresour. Technol. 181, 97–104. doi:10.1016/j.biortech.2015.01.039
Barca, C., Soric, A., Ranava, D., Giudici-Orticoni, M.-T., and Ferrasse, J.-H. (2015). Anaerobic Biofilm Reactors for Dark Fermentative Hydrogen Production from Wastewater: A Review. Bioresour. Technol. 185, 386–398. doi:10.1016/j.biortech.2015.02.063
Batstone, D. J., Keller, J., Angelidaki, I., Kalyuzhnyi, S. V., Pavlostathis, S. G., Rozzi, A., et al. (2002). The IWA Anaerobic Digestion Model No 1 (ADM1). Water Sci. Technol. J. Int. Assoc. Water Pollut. Res. 45, 65–73. doi:10.2166/wst.2002.0292
Battista, F., Fino, D., and Mancini, G. (2016). Optimization of Biogas Production from Coffee Production Waste. Bioresour. Technol. 200, 884–890. doi:10.1016/j.biortech.2015.11.020
Cabeza, I., Thomas, M., Vasquez, A., Acevedo, P., and Hernandez, M. (2016). Anaerobic Co-digestion of Organic Residues from Different Productive Sectors in Colombia: Biomethanation Potential Assessment. Chem. Eng. Trans. 49, 385–390. doi:10.3303/CET1649065
Cebreiros, F., Guigou, M. D., and Cabrera, M. N. (2017). Integrated Forest Biorefineries: Recovery of Acetic Acid as a By-Product From Eucalyptus Wood Hemicellulosic Hydrolysates by Solvent Extraction. Ind. Crops Prod. 109, 101–108. doi:10.1016/j.indcrop.2017.08.012
DANE (2020). Departamento Administrativo Nacional de Estadística. Estadistica por tema. Available at: http://www.dane.gov.co/
Garfí, M., Ferrer-Martí, L., Perez, I., Flotats, X., and Ferrer, I. (2011). Codigestion of Cow and guinea Pig Manure in Low-Cost Tubular Digesters at High Altitude. Ecol. Eng. 37, 2066–2070. doi:10.1016/j.ecoleng.2011.08.018
Ghimire, A., Frunzo, L., Pirozzi, F., Trably, E., Escudie, R., Lens, P. N. L., et al. (2015). A Review on Dark Fermentative Biohydrogen Production From Organic Biomass: Process Parameters and Use of By-Products. Appl. Energ. 144, 73–95. doi:10.1016/j.apenergy.2015.01.045
Gomes, S. D., Fuess, L. T., Penteado, E. D., Lucas, S. D. M., Gotardo, J. T., and Zaiat, M. (2015). The Application of an Innovative Continuous Multiple Tube Reactor as a Strategy to Control the Specific Organic Loading Rate for Biohydrogen Production by Dark Fermentation. Bioresour. Technol. 197, 201–207. doi:10.1016/j.biortech.2015.08.077
Gonzalez-Salazar, M. A., Morini, M., Pinelli, M., Spina, P. R., Venturini, M., Finkenrath, M., et al. (2014). Methodology for Estimating Biomass Energy Potential and its Application to Colombia. Appl. Energ. 136, 781–796. doi:10.1016/j.apenergy.2014.07.004
Hernández, M. A., Rodríguez Susa, M., and Andres, Y. (2014). Use of Coffee Mucilage as a New Substrate for Hydrogen Production in Anaerobic Co-digestion with Swine Manure. Bioresour. Technol. 168, 112–118. doi:10.1016/j.biortech.2014.02.101
Hernandez, M., González, A., Suárez, F., Ochoa, C., Candela, A., and Cabeza, I. (2018). Assessment of the Biohydrogen Production Potential of Different Organic Residues in Colombia: Cocoa Waste, Pig Manure and Coffee Mucilage. Chem. Eng. Trans. 65. 247–252. doi:10.3303/CET1865042
Hernández, M., and Rodríguez, M. (2013). Hydrogen Production by Anaerobic Digestion of Pig Manure: Effect of Operating Conditions. Renew. Energ. 53, 187–192. doi:10.1016/j.renene.2012.11.024
ICA (2018). Instituto Colombiano Agropecuario. Available at: https://www.ica.gov.co/areas/pecuaria/servicios/epidemiologia-veterinaria/censos-2016/censo-2018.aspx (Accessed January 20, 2021).
IEA (2020). International Energy Statistics - U.S. Energy Information Administration. Available at: https://www.iea.org/ (Accessed January 15, 2021).
Jiang, J., He, S., Kang, X., Sun, Y., Yuan, Z., Xing, T., et al. (2020). Effect of Organic Loading Rate and Temperature on the Anaerobic Digestion of Municipal Solid Waste: Process Performance and Energy Recovery. Front. Energ. Res. 8, 89. doi:10.3389/fenrg.2020.00089
Kim, S.-H., Han, S.-K., and Shin, H.-S. (2004). Feasibility of Biohydrogen Production by Anaerobic Co-digestion of Food Waste and Sewage Sludge. Int. J. Hydrog. Energ. 29, 1607–1616. doi:10.1016/j.ijhydene.2004.02.018
Kovalovszki, A., Alvarado-Morales, M., Fotidis, I. A., and Angelidaki, I. (2017). A Systematic Methodology to Extend the Applicability of a Bioconversion Model for the Simulation of Various Co-digestion Scenarios. Bioresour. Technol. 235, 157–166. doi:10.1016/j.biortech.2017.03.101
Madeira, J. G. F., Delgado, A. R. S., Boloy, R. A. M., Coutinho, E. R., and Loures, C. C. A. (2017). Exergetic and Economic Evaluation of Incorporation of Hydrogen Production in a Cassava Wastewater Plant. Appl. Therm. Eng. 123, 1072–1078. doi:10.1016/j.applthermaleng.2017.05.153
Mosquera, J., Varela, L., Santis, A., Villamizar, S., Acevedo, P., and Cabeza, I. (2020). Improving Anaerobic Co-digestion of Different Residual Biomass Sources Readily Available in Colombia by Process Parameters Optimization. Biomass Bioenergy 142, 105790. doi:10.1016/j.biombioe.2020.105790
Neshat, S. A., Mohammadi, M., Najafpour, G. D., and Lahijani, P. (2017). Anaerobic Co-digestion of Animal Manures and Lignocellulosic Residues as a Potent Approach for Sustainable Biogas Production. Renew. Sustain. Energ. Rev. 79, 308–322. doi:10.1016/j.rser.2017.05.137
Okiyama, D. C. G., Navarro, S. L. B., and Rodrigues, C. E. C. (2017). Cocoa Shell and its Compounds: Applications in the Food Industry. Trends Food Sci. Technol. 63, 103–112. doi:10.1016/j.tifs.2017.03.007
Osman, A. I., Abdelkader, A., Farrell, C., Rooney, D., and Morgan, K. (2019). Reusing, Recycling and Up-Cycling of Biomass: A Review of Practical and Kinetic Modelling Approaches. Fuel Process. Technol. 192, 179–202. doi:10.1016/j.fuproc.2019.04.026
Penumathsa, B. K. V., Premier, G. C., Kyazze, G., Dinsdale, R., Guwy, A. J., Esteves, S., et al. (2008). ADM1 Can Be Applied to Continuous Bio-Hydrogen Production Using a Variable Stoichiometry Approach. Water Res. 42, 4379–4385. doi:10.1016/j.watres.2008.07.030
Perera, K. R. J., Ketheesan, B., Arudchelvam, Y., and Nirmalakhandan, N. (2012). Fermentative Biohydrogen Production II: Net Energy Gain from Organic Wastes. Int. J. Hydrog. Energ. 37, 167–178. doi:10.1016/j.ijhydene.2011.09.042
Phyllis2 (2020). Database for (Treated) Biomass, Algae, Feedstocks for Biogas Production and biochaECN Phyllis Classification. Available at: https://phyllis.nl/ TNO Biobased and Circular Technologies
Rajendran, K., Kankanala, H. R., Lundin, M., and Taherzadeh, M. J. (2014a). A Novel Process Simulation Model (PSM) for Anaerobic Digestion Using Aspen Plus. Bioresour. Technol. 168, 7–13. doi:10.1016/j.biortech.2014.01.051
Rajendran, K., Kankanala, H. R., Martinsson, R., and Taherzadeh, M. J. (2014b). Uncertainty Over Techno-Economic Potentials of Biogas from Municipal Solid Waste (MSW): A Case Study on an Industrial Process. Appl. Energ. 125, 84–92. doi:10.1016/j.apenergy.2014.03.041
Rajesh Banu, J., Kavitha, S., Yukesh Kannah, R., Dinesh Kumar, M., Preethi, , Atabani, A. E., et al. (2020). Biorefinery of Spent Coffee Grounds Waste: Viable Pathway towards Circular Bioeconomy. Bioresour. Technol. 302, 122821. doi:10.1016/j.biortech.2020.122821
Redgwell, R., Trovato, V., Merinat, S., Curti, D., Hediger, S., and Manez, A. (2003). Dietary Fibre in Cocoa Shell: Characterisation of Component Polysaccharides. Food Chem. 81, 103–112. doi:10.1016/S0308-8146(02)00385-0
Saady, N. M. C. (2013). Homoacetogenesis During Hydrogen Production by Mixed Cultures Dark Fermentation: Unresolved Challenge. Int. J. Hydrog. Energ. 38, 13172–13191. doi:10.1016/j.ijhydene.2013.07.122
Sagastume Gutiérrez, A., Cabello Eras, J. J., Hens, L., and Vandecasteele, C. (2020). The Energy Potential of Agriculture, Agroindustrial, Livestock, and Slaughterhouse Biomass Wastes through Direct Combustion and Anaerobic Digestion. The Case of Colombia. J. Clean. Prod. 269, 122317. doi:10.1016/j.jclepro.2020.122317
Şenol, H. (2019). Biogas Potential of Hazelnut Shells and Hazelnut Wastes in Giresun City. Biotechnol. Rep. 24, e00361. doi:10.1016/j.btre.2019.e00361
Serrano, R. P. (2010). Biogas Process Simulation Using Aspen Plus in Universitat Politècnica de Catalunya. Escola Tècnica Superior d’Enginyeria Industrial de Barcelona. Escola Tècnica Superior d’Enginyeria Industrial de Barcelona. Mobilitat, (Enginyeria Química). Available at: https://upcommons.upc.edu/bitstream/handle/2099.1/14429/Biogas%20Process%20Simulation%20using%20Aspen%20Plus%20v3.pdf;sequence=1.
Siegrist, H., Renggli, D., and Gujer, W. (1993). Mathematical Modelling of Anaerobic Mesophilic Sewage Sludge Treatment. Water Sci. Technol. 27, 25–36. doi:10.2166/wst.1993.0070
Uddin, M. N., Siddiki, S. Y. A., Mofijur, M., Djavanroodi, F., Hazrat, M. A., Show, P. L., et al. (2021). Prospects of Bioenergy Production from Organic Waste Using Anaerobic Digestion Technology: A Mini Review. Front. Energ. Res. 9, 627093. doi:10.3389/fenrg.2021.627093
Vavilin, V. A., Vasiliev, V. B., Ponomarev, A. V., and Rytow, S. V. (1994). Simulation Model ‘Methane’ as a Tool for Effective Biogas Production during Anaerobic Conversion of Complex Organic Matter. Bioresour. Technol. 48, 1–8. doi:10.1016/0960-8524(94)90126-0
Wang, Y., Li, G., Chi, M., Sun, Y., Zhang, J., Jiang, S., et al. (2018). Effects of Co-digestion of Cucumber Residues to Corn Stover and Pig Manure Ratio on Methane Production in Solid State Anaerobic Digestion. Bioresour. Technol. 250, 328–336. doi:10.1016/j.biortech.2017.11.055
Xie, S., Hai, F. I., Zhan, X., Guo, W., Ngo, H. H., Price, W. E., et al. (2016). Anaerobic Co-digestion: A Critical Review of Mathematical Modelling for Performance Optimization. Bioresour. Technol. 222, 498–512. doi:10.1016/j.biortech.2016.10.015
Ye, J., Li, D., Sun, Y., Wang, G., Yuan, Z., Zhen, F., et al. (2013). Improved Biogas Production From Rice Straw by Co-digestion with Kitchen Waste and Pig Manure. Waste Manag. 33, 2653–2658. doi:10.1016/j.wasman.2013.05.014
Yeshanew, M. M., Paillet, F., Barrau, C., Frunzo, L., Lens, P. N. L., Esposito, G., et al. (2018). Co-production of Hydrogen and Methane From the Organic Fraction of Municipal Solid Waste in a Pilot Scale Dark Fermenter and Methanogenic Biofilm Reactor. Front. Environ. Sci. 6. doi:10.3389/fenvs.2018.00041
Zhang, C., Su, H., Baeyens, J., and Tan, T. (2014). Reviewing the Anaerobic Digestion of Food Waste for Biogas Production. Renew. Sustain. Energ. Rev. 38, 383–392. doi:10.1016/j.rser.2014.05.038
Keywords: agro-industrial residues, biogas production, bioconversion modeling, ADM1 model, bioprocess simulation, energy recovery yields
Citation: Amado M, Barca C, Hernández MA and Ferrasse J-H (2021) Evaluation of Energy Recovery Potential by Anaerobic Digestion and Dark Fermentation of Residual Biomass in Colombia. Front. Energy Res. 9:690161. doi: 10.3389/fenrg.2021.690161
Received: 02 April 2021; Accepted: 07 June 2021;
Published: 18 June 2021.
Edited by:
Jacek Dach, Poznan University of Life Sciences, PolandReviewed by:
Alissara Reungsang, Khon Kaen University, ThailandDillirani Nagarajan, National Cheng Kung University, Taiwan
Copyright © 2021 Amado, Barca, Hernández and Ferrasse. This is an open-access article distributed under the terms of the Creative Commons Attribution License (CC BY). The use, distribution or reproduction in other forums is permitted, provided the original author(s) and the copyright owner(s) are credited and that the original publication in this journal is cited, in accordance with accepted academic practice. No use, distribution or reproduction is permitted which does not comply with these terms.
*Correspondence: Mario A. Hernández, bWFoZXJuYW5kZXpAdW5pdmVyc2lkYWRlYW4uZWR1LmNv