 N Melzack
 RGA Wills
 A Cruden
- Energy Technology Research Group, University of Southampton, Southampton, United Kingdom
In the context of growing demand on energy storage, exploring the holistic sustainability of technologies is key to future-proofing our development. In this article, a cradle-to-gate life cycle assessment of aqueous electrolyte aluminum-ion (Al-ion) batteries has been performed. Due to their reported characteristics of high power (circa 300 W kg−1 active material) and low energy density (circa 15 Wh kg−1 active material), these results were compared with those of supercapacitors (per kW). Initial findings suggest these aluminum-ion cells have fewer environmental impacts than commercial supercapacitors, hence offering a more environmentally sensitive energy storage technology solution. Al-ion batteries are in their early development, and this result shows a strong argument for continuing research into this technology alongside other emerging energy storage systems.
Introduction
In the search for sustainable energy, there is a diverse range of renewable methods to generate electricity, such as wind and solar. Of course, the question then arises on the use of this energy and how it is stored when not needed. Looking into sustainable energy storage (such as supercapacitors and batteries) is therefore critical for a fully sustainable energy service. This is true for both grid storage and the smaller storage devices in our cars and phones.
Al-ion (aluminum ion) batteries have received recent interest as alternatives to Li-ion (lithium-ion) chemistries (Elia, et al., 2021). While there are aqueous Li-ion technologies (Profili, et al., 2020), most studies have looked at ionic liquid electrolytes, and preliminary environmental comparisons have been made (Ellingsen, et al., 2018; Salgado Delgado, 2019). Utilizing an aqueous electrolyte may have life cycle assessment (LCA) benefits compared to organic and ionic liquid systems. The potential ionic storage of aqueous electrolytes is two orders of magnitude higher than that of organic nonaqueous electrolytes—this could enable far higher power capability as well (Zhang, et al., 2020). The aqueous electrolyte Al-ion cell (Holland, et al., 2018) is a good candidate for analysis as its performance characteristics overlap with both supercapacitor and battery application areas. It is also a new chemistry and offers the opportunity to develop the system in synergy with LCA, rather than undertaking an LCA as a retrospective assessment. Its high power density [300 W kg−1 (Holland, et al., 2018)] and energy density [15 Wh kg−1 (Holland, et al., 2018)] show promise for the development of a commercial, useable product. The Al-ion cell consists of a titanium dioxide (TiO2)-negative electrode and a copper hexacyanoferrate (CuHCF)-positive electrode, and has reported cycle life of 1,750 cycles at 20 C. However, with 7% capacity fade after these cycles, there is potential for a longer cycle life, and 1,750 may have been a limit of the study, not the cell (Holland, et al., 2018). Performing an LCA on this Al-ion cell is therefore a useful tool in understanding the sustainability of the cell itself, in terms of its material constituent parts. Due to the high power density of the cell and observations of self-discharge, this cell behaves similarly to a supercapacitor, and is seen as a potential hybrid cell as well as compared to LCAs of supercapacitors in Comparison to Supercapacitors.
There is little literature on supercapacitor LCAs; however, a hybrid battery supercapacitor has been assessed in the past (Conte, et al., 2014), and it has been found to have fewer environmental impacts than traditional supercapacitors. A more recent supercapacitor LCA (Cossutta, et al., 2020) looked at two electrode materials—activated carbon and graphene—finding that overall, an activated carbon electrode had fewer environmental impacts. No LCAs of aqueous supercapacitors could be found. The results from the study by Cossutta, et al. (2020) are compared to those in this work in terms of the environmental impact to understand the key differences and to also see where potential improvements can be made if scaled up.
Methodology
This LCA looked at the cradle-to-gate section of the product life cycle, using the methodology set out in Potocnik (2013) and Siret (2018). Cradle-to-gate includes the mining and production of raw materials through to manufacture, but does not include the use phase, or any second-life applications or end of life activities (such as recycling).
Then, using the information available from the study by Holland, et al. (2018); Holland (2018) and the University of Southampton, the raw materials that formed each component were listed. The mass of each raw material used was then calculated based on the electrode masses given to construct the cell described. Using OpenLCA v 1.10.3 (Ciroth, 2007) software, the processes and emissions involved in obtaining the raw materials were backed up with either the ecoinvent 3.2 database (Steubing, et al., 2016), or the Gabi Think Step database (AG Thinkstep, 2012)—as used in the study by Siret (2018). The distance from key production locations to the United Kingdom was calculated. The production of the overall cell was then scaled up to provide the correct mass for one functional unit (FU), and the impact assessment was performed.
The environmental impact across 19 categories was then assessed per FU using the European Union’s Environmental Footprint (EUEF) methods (Potocnik, 2013). The outputs were analyzed and compared to similar LCAs for other energy storage technology to understand where the Al-ion technology sits with its potential peers. To allow for comparison with other technology, the energy used in production was scaled up from information provided in the study by Siret (2018); however, this was not directly calculated for the Al-ion cell. The process used in this article followed that shown in Figure 1, from detailing the cell components through to analysis of the full cell.
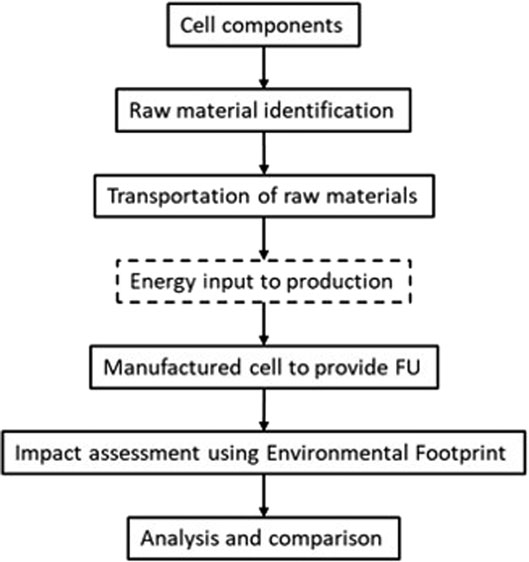
FIGURE 1. LCA process.
Raw Material Identification
The cell components were first identified as the following:
The positive electrode, which comprised a carbon-polymer substrate onto which an active layer was coated. The active layer contained copper hexacyanoferrate, CuHCF (active material), carbon black to improve electrical conduction, and Nafion as an electrolyte/ion permeable binder.
The negative electrode, which comprised a carbon-polymer substrate onto which an active layer was coated. The active layer contained TiO2 (active material), carbon black to improve electrical conduction, and Nafion as an electrolyte/ion-permeable binder.
Current collectors, which were copper foil, placed on the outer (nonelectrolyte) face of the carbon-polymer substrate.
An electrolyte, which comprised an aqueous solution of KCl and AlCl3.
The cell chamber, which comprised a PEEK (polyether ether ketone) gasket to separate the electrodes and provide a reservoir for the electrolyte.
Battery casing, which comprised PEEK.
The cell manufacturing process was taken from the literature (Holland, et al., 2018) and shown in Figure 2. The active materials for the positive and negative electrode active layers were mixed into inks, which were then coated onto the carbon-polymer substrates and cut to shape to form the electrodes. The components were assembled and clamped together with the PEEK casing. A cross-sectional diagram of the resulting cell is provided in Figure 3, which shows the PEEK cell casing on each outer face, inside which is the copper current collector and carbon-polymer substrate. The positive and negative active material layers are shown on the left and right carbon-polymer substrates, respectively, and the electrolyte reservoir is between the two electrodes. The PEEK gasket forming the cell chamber and holding the electrolyte reservoir is not shown. A full material inventory can be found in Supplementary Table S1.
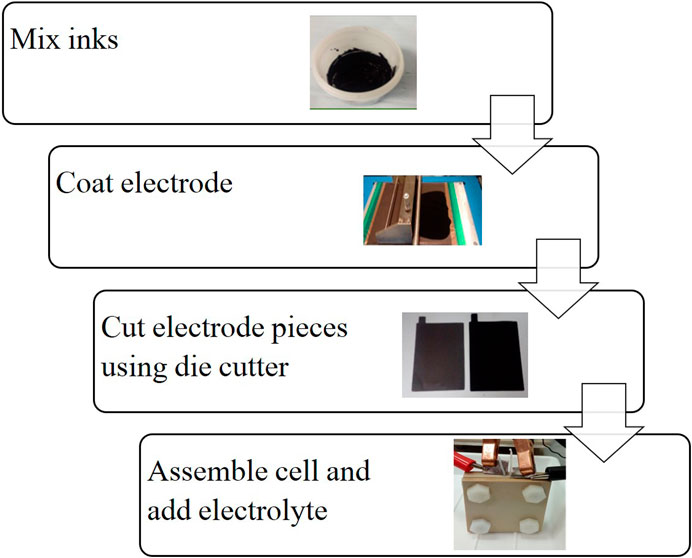
FIGURE 2. Cell construction process (Holland, et al., 2018).

FIGURE 3. Cross section of the assembled cell.
Electrodes
For each electrode, a mixture of active material, carbon black, and Nafion binder was prepared—a dry mix. Isopropanol was then added to these mixes to create an electrode ink which was applied to a Sigracell PV10 carbon polymer electrode substrate from SGL carbon (SGL Carbon, 2021). The materials common to both electrodes are discussed first, followed by the active materials and ratios of mixtures for the individual electrodes. The processes involved in the production of carbon black have been taken from the ecoinvent 3.2 database. With regard to Nafion, as this is a branded product, the constituent parts have been taken from the study by Mauritz and Moore (2004), and therefore, an estimate for production processes and proportions was made with the inputs taken from the ecoinvent 3.2 database (see Supplementary Table S1 for full breakdown of these parts). Isopropanol has a well-defined production method, and the processes involved in producing isopropanol were taken from the ecoinvent 3.2 database. Like Nafion, the Sigracell PV10 electrode substrate is a branded product, and as such, the constituent parts and proportions have been assumed based on the Sigracell (2016) and general carbon polymers, including polyvinyl fluoride and polycarbonate—the processes of which were taken from the GaBi Thinkstep database (AG Thinkstep, 2012). The active material for the positive electrode was copper hexacyanoferrate (CuHCF) and anatase TiO2 nanopowder for the negative electrode.
Positive Active Material (CuHCF)
The steps used to make the positive electrode (Holland, et al., 2018) are as follows:
(1) CuHCF was made using a mixture of 1.5 mol dm−3 solution of Cu(NO3)2 and 1 mol dm−3 solution of K3[Fe(CN)6]. The processes involved in the production of both Cu(NO3)2 and K3[Fe(CN)6] are taken from the ecoinvent 3.2 database.
(2) CuHCF, carbon black, and a Nafion binder were mixed in the ratio of 8:1:1 by wt% to create a dry mix.
(3) Isopropanol was then added to form inks in the proportions of approximately 3:1 (isopropanol:active material).
(4) The ink was then painted on Sigracell PV10 carbon polymer electrode substrate from SGL.
The total weight of the electrode ink layer was 38 mg, and the Sigracell PV10 substrate weighs ∼10 g (Sigracell, 2016). Figure 4 shows the production flow from the positive electrode to its constituent parts to the positive electrode. The positive electrode materials comprise the carbon-polymer substrate and CuHCF ink. The electrode substrate further comprises polycarbonate and polyvinyl fluoride, while the CuHCF ink comprises seven materials: isopropanol, copper nitrate, potassium ferrocyanide, alcohol ether sulfate, chlorine dioxide, hydrogen fluoride, and tetrafluoroethane. Details on specific masses, processes, and datasets used for these raw materials can be found in Supplementary Table S1. The packaging and transport has been taken into account for the items shown—a plastic packaging or glass bottle is assumed based on the item. The packaging processes are taken from the ecoinvent 3.2 database.
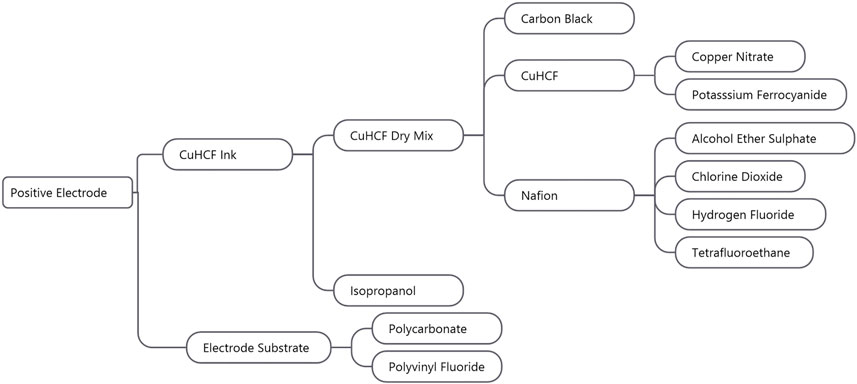
FIGURE 4. Production flow for the positive electrode redrawn from OpenLCA.
Negative Active Material (TiO2)
The steps used in making the negative electrode are as follows:
(1) TiO2 commercial nanopowder from Sigma Aldrich, carbon black, and a Nafion binder were mixed in the proportion of 9:0.5:0.5 by wt% to create a dry mix. Standard TiO2 was assumed as the base of the nanopowder, with the processes involved in the mining and production taken from the ecoinvent 3.2 database.
(2) Isopropanol was then added to form inks in the proportions of approximately 3:1 (isopropanol:active material).
(3) The ink was then painted on Sigracell PV10 carbon polymer current collectors from SGL.
The total weight of the dry ink layer was 85 mg. As with the positive electrode, Figure 5 shows the production flow for the materials of the negative electrode. The negative electrode materials comprise the carbon-polymer substrate and TiO2 ink. The electrode substrate further comprises polycarbonate and polyvinyl fluoride, while the TiO2 ink comprises six materials: isopropanol, TiO2, alcohol ether sulfate, chlorine dioxide, hydrogen fluoride, and tetrafluoroethane. Details on specific masses, processes, and datasets used for these raw materials can be found in Supplementary Table S1.
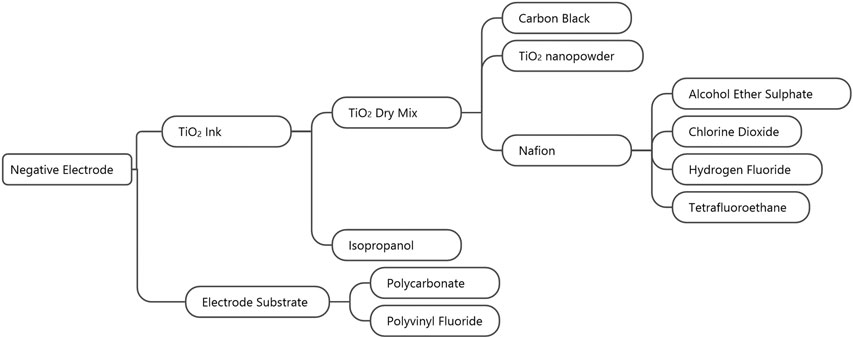
FIGURE 5. Production flow for the negative electrode redrawn from OpenLCA.
Electrolyte Components
The electrolytes used were 1 M AlCl3 and 1 M KCl in deionized water. The processes involved in the production of these chemicals have been taken from the ecoinvent 3.2 database. It is assumed that a total of 6 g of electrolyte was used, given the spacing in the electrolyte cavity (Holland, 2018); this value will be investigated further in future cell builds. Figure 6 shows the production flow for the electrolyte.
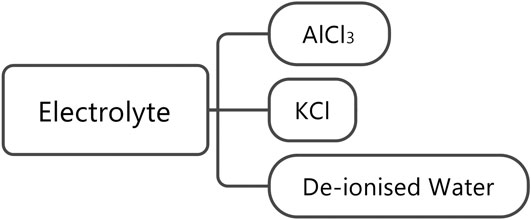
FIGURE 6. Production flow for the electrolyte redrawn from OpenLCA.
Battery Casing and Other Supporting Materials
The current collectors are copper sheets, given the 10 × 10 cm layout of the electrode (Holland, 2018), and typical values for copper current collectors (Choi, et al., 2013); 1 g is assumed for each current collector. This value will be investigated further in future cell builds. The processes involved in the production of copper sheets have been taken from the ecoinvent 3.2 database. The battery casing is assumed to be a thermosetting plastic (processes for production taken from the GaBi Thinkstep database) and that 2.5 g would be appropriate for a cell of this size. The overall construction of an Al-ion cell will be similar to that of Pb acid, which has varying casing contributions around 10% (Liu, et al., 2015; Ballantyne, et al., 2018), with other Li-ion cases being between 8 and 24% of the total mass (Kim, et al., 2016; Peters and Weil, 2018; Siret, 2018).
Full Cell
The full cell therefore is made up of both electrodes, current collectors, the electrolyte, and the battery casing. A summary of the percentage by weight of each component is presented in Figure 7. The positive electrode, negative electrode, and electrolyte each contribute slightly over one-quarter of the overall mass (27%), with the casing and current collector together making up the remaining 20%.
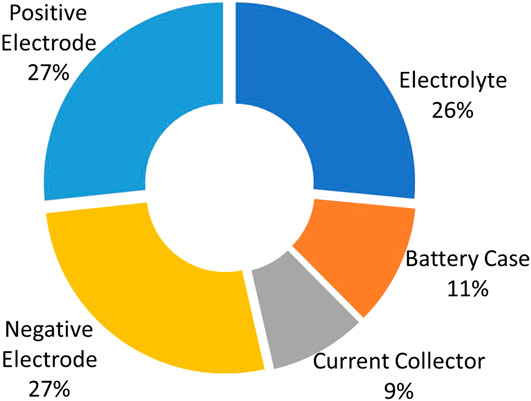
FIGURE 7. Cell component breakdown by % wt.
Transportation of Raw Materials
Transportation of raw materials has been considered from the point of mining/processing/production to delivery to the United Kingdom. Countries of high production were based on the U.S. Geological Survey (U.S. Geological Survey, 2020). A summary of the main components for the aqueous Al-ion cell is presented in Table 1. Their geographical source area is identified along with the approximate distance for transporting the component to a manufacturing plant in the center of Great Britain. Potash shown in the table for the production of KCl and potassium ferricyanide is not shown in Figure 4 or Figure 5, as the datasets which comprise the manufacture of these materials (from ecoinvent 3.2) have already taken this into account. However, to understand the transport distances of such items, potash was considered. This is similar for aluminum, as AlCl3 production from the dataset already considers the aluminum component. The transport is not shown in Figures 4–6.
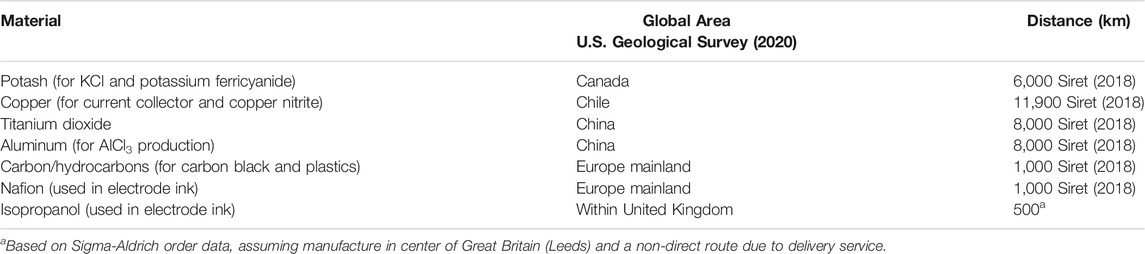
TABLE 1. Geographical location of production and associated delivery distance to the United Kingdom for key components of the aqueous Al-ion cell.
Functional Unit Identification
The functional unit is a reference unit which normalizes the results in a useable way (Matheys, et al., 2007). For the use of this study, the functional unit of per kWh was chosen. The functional kWh is defined as the total amount of energy given over a lifetime (per kg) and is calculated using
Converting this to kWh/kg and taking the inverse gives 0.038 kg per functional kWh. From values given in the study by Holland, et al. (2018) for the electrode mass, the mass per kWh is determined as ∼0.026 kg for the negative electrode and ∼0.0118 kg for the positive electrode. Supporting material (such as electrolyte or battery casing) is scaled accordingly—with the cell mass assessed at ∼7 kg. It is important to note that given the Al-ion cell’s high-power density (300 W kg−1), it has applications similar to those of a supercapacitor (Smith, et al., 2020), and so a second functional unit defined as functional kW will also be assessed when comparing the environmental impacts to supercapacitors in Comparison to supercapacitors , to give a more realistic understanding of the impacts.
And taking the inverse gives 0.002 kg kW−1. Therefore, the results presented per kWh can be multiplied by a factor of 0.053 to provide the impacts per kW.
Results and Discussion
Using OpenLCA and the EUEF midpoint analysis, the impacts of production were assessed over 19 impact categories, grouped as 1) acidification, 2) carcinogenic properties, 3) climate impact, 4) land usage, 5) ozone impact, and 6) energy resource:
(1) Acidification of water, reported as in increase in the mole of H+ eq., reduces the amount of carbonate available for sea life and effects their environment. Most notably, it can limit the growth of corals and plankton which serve as vast ecosystems for many other marine life (Doney, et al., 2009; Bach, et al., 2016). Ecotoxicity of fresh water measured in Comparative Toxic Units ecotoxicity (CTUe) attempts to understand the overall pollution to fresh water from air, land runoff (such as pesticides), and direct chemical release into the water (Otte, 2016). Eutrophication refers to the increase of nutrients to water such that algae and other organisms thrive on the surface, blocking sun and depriving oxygen to those living below the surface. Due to the processes by which eutrophication takes place in different bodies of water, it is measured in kg P eq. in fresh water, kg N eq. for marine water, and as an increase in the mole of N eq. for terrestrial water.
(2) Cancer-causing human health effects, measured in Comparative Toxic Unit for human (CTUh), provides the increased risk of morbidity from cancer for the entire human population, given the chemicals emitted during the production process. Similarly, non–cancer-causing human health effects are also measured in CTUh and summarize other potential hazards. Ionizing radiation is assessed in a separate category, given as kBq U235 eq. released. The release of respiratory inorganics, in the form of particles less than 2.5 μm in diameter, can also cause lung disease and irritation, and is measured as kg PM2.5 eq.
(3) Climate change impact is given as kg CO2 eq. added to the atmosphere. This category is then subdivided into impacts from biogenic sources (such as burning wood or other biofuels), fossil sources (such as petrol or other crude oil products), and through land use change (such as from deforestation and the reduction of carbon sinks).
(4) Land use is given in eco-points, Pt, which takes into account the use of the land, the area, and the amount of time for which the land is in use—for example, animal grazing may take a different amount of time than growing crops for the same area.
(5) Ozone contribution is split into two categories, ozone depletion, given in kg CFC eq. (kg chlorofluorocarbons eq._), which is in terms of the upper atmosphere. Ozone formation is also assessed, as at a local level, this impacts human health in kg non-methane volatile organic compound eq. (kg NMVOC eq.).
(6) Resource use is quantified as energy in MJ. The use of minerals and metals (such as through mining) is measured in kg Sb eq. The use of water is assessed in m3 water.
Al-Ion Per kWh
Using OpenLCA and the EUEF midpoint analysis, the impacts of production were assessed per functional kWh. The total impact in a variety of categories was calculated. Table 2 shows the absolute values of each category per functional kWh, whereas Table 3 shows the results normalized and weighted to the product environmental footprint (PEF) suggested values (Potocnik, 2013)—which aim to quantify the impacts so that they can be compared to each other. The top five impact categories, taken as the categories with the highest normalized values, obtained from the data obtained in Table 3 are analyzed further to identify their main contributors. These are respiratory inorganics (6.74 × 10⁻⁷ kg PM2.5 eq.), resource use, energy carriers (4.10 × 10+1 MJ) and minerals and metals (9.18 × 10⁻⁵ kg Sb eq.), climate change (2.95 × 10+0 kg CO2 eq. overall), and acidification of water (1.76 × 10⁻² mole of H+ eq.). These are presented graphically in Figure 8. The percentage impact contribution is provided for the production of AlCl3, copper battery casing, electrode substrate, KCl, and “other.” The category “other” includes all other processes assessed during the impact assessment.
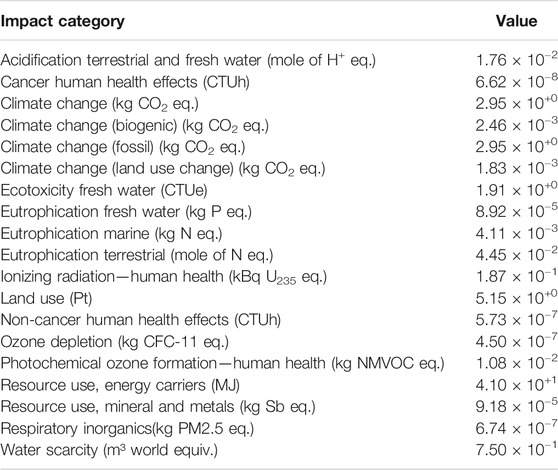
TABLE 2. Impact assessment per functional kWh.
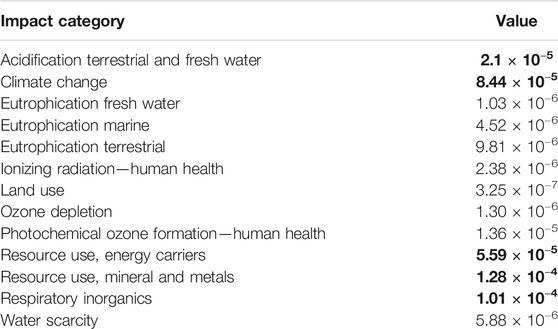
TABLE 3. Normalized and weighted impact assessment per function kWh, with highest impact results in bold. The bold values are the highest impact categories.
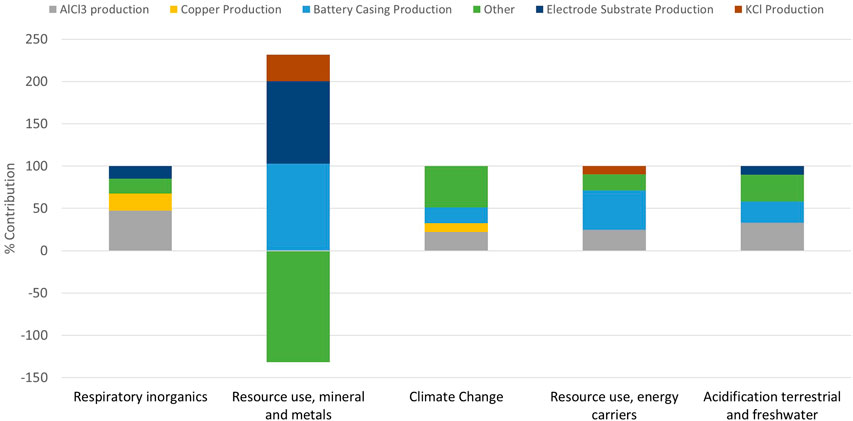
FIGURE 8. Top five impact categories with their main contributors.
Figure 8 shows that the battery casing productions—which includes the mining of hydrocarbons through to the production of the plastic granulates—appear as a contributor to the main impacts. It is again worth mentioning that the assumption of casing mass was based off an Li-ion battery, and when using a lower mass for the casing, the impacts of this are reduced. Plastic is also highly recyclable; thus, changing the input of the battery casing to a higher percentage recycled plastic would again reduce the impacts of this component.
In terms of the copper contribution for the current collector, this could be reduced by looking into recycling methods at the end of life (EoL); for Pb-acid batteries, the recycling/reuse accounts for −21% of the overall impact (Liu, et al., 2015). However, copper is not the only current collector option; there are many polymer or other metal foils which could be investigated for use in this cell. The choice for this component within the software was “copper sheet,” whereas for the production of CuHCF, “copper mix” was used as it has different production methods (see Supplementary Table S1 for component breakdown). It is important to note that the negative “other” within the “Resource use; minerals and metals” category is due to the CuHCF copper production, as it is assumed that for the CuHCF production, 40% of the copper was from scrap or recycled sources. These assumptions can make a large difference in the outcome of the LCA, and therefore, the recyclability of copper in all aspects of the cell will be assessed in future work.
The impacts from the electrolyte cannot be reduced through a substitution; however, recycling at EoL will most likely play a role in reducing the overall impact. In terms of aluminum, it has been shown that recycled Al uses 10% of the energy needed for primary production (Butterwick and Smith, 1986; IEA, 2009).
It is important to bear in mind that there were many assumptions made within this analysis. The key difficulties with this task were in finding the appropriate production methods for branded products such as Nafion, as well as the electrode substrate, and thus a more general descriptor was used—which may not have taken into account the key production processes and waste produced. Many assumptions were made on transport distances based on the locations of productive mines and manufacturing plants around the world; however, these were in line with those recommended (and therefore used) in the study by Siret (2018).
Comparison to Supercapacitors
To compare the values with those produced in the findings by Cossutta, et al. (2020), resources needed in order to manufacture the batteries were added—along with a charger—to match the analysis. These values were taken from the study by Siret (2018), as they had not been assessed for the initial impact assessment. Key additions to this analysis were electricity (0.82 MJ) and water (0.48 kg) used in the manufacturing process. A full breakdown of components and the relevant datasets used can be found in Supplementary Table S1. As mentioned previously, given the Al-ion cell’s tendency to perform like a supercapacitor, potential commercial applications could complement or even replace supercapacitor roles in the future. The Al-ion cell is already seen as a cheaper alternative to expensive supercapacitors, and therefore, it is important to evaluate the environmental impacts as well (Holland, 2018; Salgado Delgado, 2019; Pan, et al., 2019; Smith, et al., 2020). The values presented in Table 4 are calculated per functional kW over the lifetime of the assessed supercapacitors described in (Cossutta, et al., 2020) for a cradle-to-gate scenario. This FU was calculated as shown in Functional unit identification.
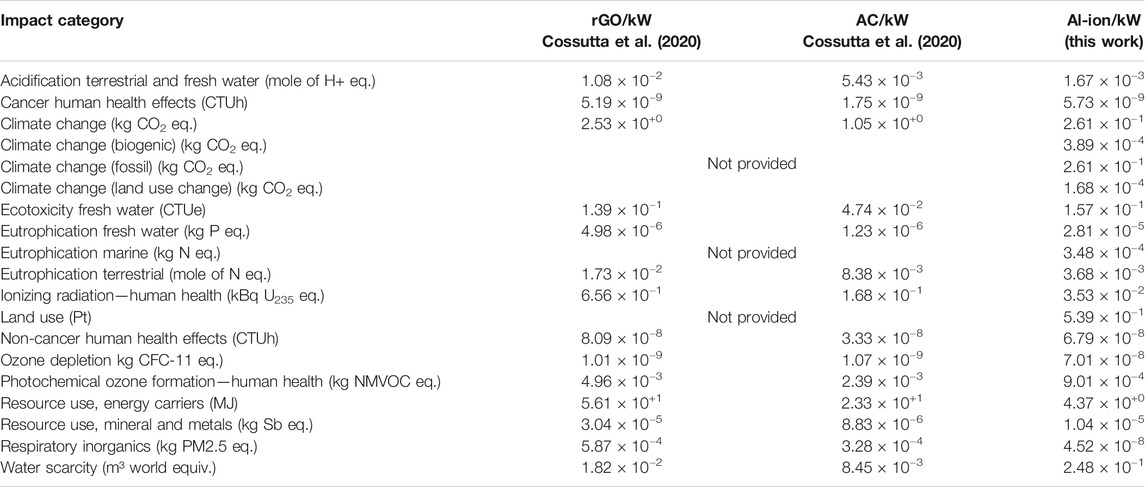
TABLE 4. Comparison with Graphene (rGO) and activated carbon (AC) supercapacitors per kW with this work. Values calculated from (Cossutta, et al., 2020) supplementary information.
When compared with the graphene (rGO) and activated carbon (AC) supercapacitors in Table 4, the Al ion has fewer impacts per kW in all categories. A breakdown of climate change contributions is not provided in the study by Cossutta et al. (2020); however, in total, Al-ion batteries produce an order of magnitude less kg CO2 eq. per kW (∼10−1 for Al-ion and ∼100 for both supercapacitors). Electrode manufacture and electricity use are reported as the key contributors to this category (Cossutta, et al., 2020).The resource use (energy carriers) for the two supercapacitors is an order of magnitude higher than that of Al-ion, ∼10+1 and 10+0 MJ per kW, respectively. The production techniques involved for manufacturing these supercapacitors, overall, are reported as more energy intense than for the battery. This may be due to the more complex manufacturing processes for the advanced materials used in the supercapacitors.
The discussion in the study by Cossutta et al. (2020 mentions uncertainty in techniques for measuring and understanding the emission of nanoparticles in the production of advanced materials for supercapacitors, and therefore, it was not fully included in the LCA. For the Al-ion battery, the TiO2 electrode uses anatase nanopowder—an item not found in the datasets used, and so the “nano” aspect of the material in the Al-ion LCA was also not fully accounted for. This leads to uncertainty on the exact impact of respiratory inorganics, as a method for accounting for nanomaterial release has not yet been formalized (Salieri, et al., 2018). Keeping this in mind, the Al ion still appears to emit four orders of magnitude less particulates than the supercapacitors in this analysis, ∼10−8 and ∼10−4 kg PM2.5 eq, respectively.
The key contributor to this category for the supercapacitors is the production of electrodes (Cossutta, et al., 2020). While not fully explored in the article, the use of of n-methylpyrrolidone (NMP) is common in supercapacitor manufacture. It is a solvent used in the production of electrodes and is linked with a high impact in the respiratory particulate category (Arunkumar and Amit, 2017). Isopropanol is used as a solvent in the production of the Al-ion electrodes, which has a negligible contribution to this impact category. More research into the use of appropriate solvents when scaling up the production is needed to fully understand the choice and impact on respiratory inorganics.
The Al-ion battery has an order of magnitude more impact on ozone depletion, ∼10-8 kg CFC-11 eq. for Al-ion compared to ∼10-9 kg CFC-11 eq. for the supercapacitors. The main contributor to this is the electrode manufacture for both supercapacitors (Cossutta, et al., 2020), although the main details are not fully explored. A key contributor to this category for Al ion is the production of tetrafluoroethylene, a material modeled in the production of Nafion—the binder for the electrode ink. This may refer to the estimates made when modeling Nafion; however, it may also be useful to investigate alternate binder materials for future battery designs. When normalized and weighted for impact, however, overall ozone depletion has negligible impact.
More water is used in producing Al-ion batteries than the supercapacitors (for rGO 1.82 × 10⁻²m3, for AC 8.45 × 10⁻³ m3, and for Al-ion 2.48 × 10⁻¹ m3). The main contribution to this category is the water added to model production, taken from the findings of Siret (2018), and may not be completely valid. Further investigation into the production method of the Al-ion cells is needed to get a clearer picture.
Conclusion
This work presents the first life cycle assessment for an Al-ion aqueous electrolyte cell. The production of the salt, AlCl3, and the plastic battery casing contribute highly to the environmental impacts (22 and 18%, respectively, of the kg CO2 eq. emitted). However, this assessment did not include recycling, which may reduce the impact of these processes.
Compared to supercapacitors, the cell had significantly less impact in terms of energy resource (∼81% reduction), respiratory inorganics (∼100% reduction), and climate change (∼75% reduction), with comparable values for the other impact categories per kW. This presents an argument for the development of Al-ion aqueous technology as a sustainable energy storage device when comparing to supercapacitors.
Aqueous Al-ion cells are currently pre-commercial systems. As such, this study can be used in synergistic development for the battery, which minimizes the environmental impact of materials and design choices in its future development. For example, the use of isopropanol over NMP as a solvent has reduced particulate impact, but the use of the Nafion binder increases the contribution to ozone depletion, and other binders may be interesting to study.
Furthermore, increasing the capacity of the cell will require either increasing the quantity of active material per cell or reducing the percentage of nonactive material. For example, identifying materials with reduced mass for the electrode substrates to replace the carbon polymer currently used can be assessed from an environmental perspective against the inclusion of 3D active material scaffolds for increasing the percentage of active material per cell. These activities can now be run alongside the LCA to identify a balance between environmental impact and device performance.
Further work is also needed to expand the results displayed in this work. This should comprise an investigation into the use phase and end of life, including reuse and recycling capabilities, to allow the full life cycle assessment to be made and compared to other energy storage options.
Data Availability Statement
The original contributions presented in the study are included in the article/Supplementary Material, and further inquiries can be directed to the corresponding author.
Author Contributions
All authors listed have made a substantial, direct, and intellectual contribution to the work and approved it for publication
Funding
This work was funded by UKRI under an STFC Studentship and the EPSRC Faraday Training Grant EP/S514901/1.
Conflict of Interest
The authors declare that the research was conducted in the absence of any commercial or financial relationships that could be construed as a potential conflict of interest.
Supplementary Material
The Supplementary Material for this article can be found online at: https://www.frontiersin.org/articles/10.3389/fenrg.2021.699919/full#supplementary-material
References
Arunkumar, M., and Amit, P. (2017). Importance of Electrode Preparation Methodologies in Supercapacitor Applications. ACS Omega 2 (11), 8039–8050. doi:10.1021/acsomega.7b01275
Bach, V., Möller, F., Finogenova, N., Emara, Y., and Finkbeiner, M. (2016). Characterization Model to Assess Ocean Acidification within Life Cycle Assessment. Int. J. Life Cycle Assess. 21 (10), 1463–1472. doi:10.1007/s11367-016-1121-x
Ballantyne, A. D., Hallett, J. P., Riley, D. J., Shah, N., and Payne, D. J. (2018). Lead Acid Battery Recycling for the Twenty-First century. R. Soc. Open Sci. 5 (5), 171368. doi:10.1098/rsos.171368
Butterwick, L., and Smith, G. D. W. (1986). Aluminium Recovery from Consumer Waste-I. Technology Review. Conservation & Recycling 9 (3), 281–292. doi:10.1016/0361-3658(86)90018-4
Choi, J.-Y., Lee, D. J., Lee, Y. M., Lee, Y.-G., Kim, K. M., Park, J.-K., et al. (2013). Silicon Nanofibrils on a Flexible Current Collector for Bendable Lithium-Ion Battery Anodes. Adv. Funct. Mater. 23 (17), 2108–2114. doi:10.1002/adfm.201202458
Ciroth, A. (2007). ICT for Environment in Life Cycle Applications openLCA — A New Open Source Software for Life Cycle Assessment. Int. J. Life Cycle Assess. 12 (4), 209–210. doi:10.1065/lca2007.06.337
Conte, M., Genovese, A., Ortenzi, F., and Vellucci, F. (2014). Hybrid Battery-Supercapacitor Storage for an Electric Forklift: a Life-Cycle Cost Assessment. J. Appl. Electrochemistry 44 (4), 523–532. doi:10.1007/s10800-014-0669-z
Cossutta, M., Vretenar, V., Centeno, T. A., Kotrusz, P., McKechnie, J., and Pickering, S. J. (2020). A Comparative Life Cycle Assessment of Graphene and Activated Carbon in a Supercapacitor Application. J. Clean. Prod. 242, 118468. doi:10.1016/j.jclepro.2019.118468
Doney, S. C., Fabry, V. J., Feely, R. A., and Kleypas, J. A. (2009). Ocean Acidification: The Other CO2 Problem. Annu. Rev. Mar. Sci. 1, 169–192. doi:10.1146/annurev.marine.010908.163834
Elia, G. A., Kravchyk, K. V., Kovalenko, M. V., Chacón, J., Holland, A., and Wills, R. G. A. (2021). An Overview and Prospective on Al and Al-Ion Battery Technologies. J. Power Sourc. 481, 228870. doi:10.1016/j.jpowsour.2020.228870
Ellingsen, L., Holland, A., Drillet, J.-F., Peters, W., Eckert, M., Concepcion, C., et al. (2018). Environmental Screening of Electrode Materials for a Rechargeable Aluminum Battery with an AlCl3/EMIMCl Electrolyte. Materials 11 (6), 936. doi:10.3390/ma11060936
Holland, A. (2018). “Development and Characterisation of an Aqueous Aluminium-Ion Battery,”PhD Thesis. (Southampton: University of Southampton).
Holland, A., McKerracher, R. D., Cruden, A., and Wills, R. G. A. (2018). An Aluminium Battery Operating with an Aqueous Electrolyte. J. Appl. Electrochem. 48 (3), 243–250. doi:10.1007/s10800-018-1154-x
IEA (2009). Energy Technology Transitions for Industry: Strategies for the Next Industrial Revolution. Paris: OECD Publishing.
Kim, H. C., Wallington, T. J., Arsenault, R., Bae, C., Ahn, S., and Lee, J. (2016). Cradle-to-Gate Emissions from a Commercial Electric Vehicle Li-Ion Battery: A Comparative Analysis. Environ. Sci. Technology 50 (14), 7715–7722. doi:10.1021/acs.est.6b00830
Liu, W., Sang, J., Chen, L., Tian, J., Zhang, H., and Olvera Palma, G. (2015). Life Cycle Assessment of lead-acid Batteries Used in Electric Bicycles in China. J. Clean. Prod. 108, 1149–1156. doi:10.1016/j.jclepro.2015.07.026
Matheys, J., Van Autenboer, W., Timmermans, J.-M., Van Mierlo, J., Van den Bossche, P., and Maggetto, G. (2007). Influence of Functional Unit on the Life Cycle Assessment of Traction Batteries. Int. J. Life Cycle Assess. 12 (3), 191–196. doi:10.1065/lca2007.04.322
Mauritz, K. A., and Moore, R. B. (2004). State of Understanding of Nafion. Chem. Rev. 104 (10), 4535–4586. doi:10.1021/cr0207123
Pan, W., Wang, Y., Zhang, Y., Kwok, H. Y. H., Wu, M., Zhao, X., et al. (2019). A Low-Cost and Dendrite-free Rechargeable Aluminium-Ion Battery with superior Performance. J. Mater. Chem. A 7 (29), 17420–17425. doi:10.1039/C9TA05207K
Peters, J. F., and Weil, M. (2018). Providing a Common Base for Life Cycle Assessments of Li-Ion Batteries. J. Clean. Prod. 171, 704–713. doi:10.1016/j.jclepro.2017.10.016
Potocnik, J. (2013). Commission Recommendation of 9 April 2013 on the Use of Common Methods to Measure and Communicate the Life Cycle Environmental Performance of Products and Organisations Text with EEA Relevance. Official J. Eur. Union 56. doi:10.3000/19770677.L_2013.124.eng
Profili, J., Rousselot, S., Tomassi, E., Briqueleur, E., Aymé-Perrot, D., Stafford, L., et al. (2020). Toward More Sustainable Rechargeable Aqueous Batteries Using Plasma-Treated Cellulose-Based Li-Ion Electrodes. ACS Sustain. Chem. Eng. 8 (12), 4728–4733. doi:10.1021/acssuschemeng.9b07125
Salgado Delgado, M. L., Usai, L., Ellingsen, L. A.-W., Pan, Q., and Hammer Strømman, A. (2019). Comparative Life Cycle Assessment of a Novel Al-Ion and a Li-Ion Battery for Stationary Applications. Materials 12 (23), 3270. doi:10.3390/ma12193270
Salieri, B., Turner, D. A., Nowack, B., and Hischier, R. (2018). Life Cycle Assessment of Manufactured Nanomaterials: Where Are We? NanoImpact 10, 108–120. doi:10.1016/j.impact.2017.12.003
SGL Carbon (2021). Bipolar Plates and End Plates. Available at: https://www.sglcarbon.com/en/markets-solutions/material/sigracell-bipolar-plates-and-end-plates/ (Accessed 20 May 2021).
Siret, C., Tytgat, J., Ebert, T., and Mistry, M. (2018). Product Environmental Footprint Category Rules for High Specific Energy Rechargeable Batteries for Mobile Applications. Belgium: Recharge: Brussels.
Smith, B. D., Wills, R. G. A., and Cruden, A. J. (2020). Aqueous Al-Ion Cells and Supercapacitors - A Comparison. Energ. Rep. 6, 166–173. doi:10.1016/j.egyr.2020.03.021
Steubing, B., Wernet, G., Reinhard, J., Bauer, C., and Moreno-Ruiz, E. (2016). The Ecoinvent Database Version 3 (Part II): Analyzing LCA Results and Comparison to Version 2. Int. J. Life Cycle Assess. 21 (9), 1269–1281. doi:10.1007/s11367-016-1109-6
Keywords: aluminum-ion batteries, life cycle (impact) assessment, aqueous electrolyte, Al-ion, energy storage (batteries), environmental impact assessment—EIA
Citation: Melzack N, Wills R and Cruden A (2021) Cleaner Energy Storage: Cradle-to-Gate Life Cycle Assessment of Aluminum-Ion Batteries With an Aqueous Electrolyte. Front. Energy Res. 9:699919. doi: 10.3389/fenrg.2021.699919
Received: 24 April 2021; Accepted: 25 May 2021;
Published: 24 June 2021.
Edited by:
Xinghui Wang, Fuzhou University, ChinaReviewed by:
Yongzhu Fu, Zhengzhou University, ChinaManickam Minakshi, Murdoch University, Australia
Bingan Lu, Hunan University, China
Copyright © 2021 Melzack, Wills and Cruden. This is an open-access article distributed under the terms of the Creative Commons Attribution License (CC BY). The use, distribution or reproduction in other forums is permitted, provided the original author(s) and the copyright owner(s) are credited and that the original publication in this journal is cited, in accordance with accepted academic practice. No use, distribution or reproduction is permitted which does not comply with these terms.
*Correspondence: N Melzack, bi5tZWx6YWNrQHNvdG9uLmFjLnVr