 Quang-Vu Bach
 Jinxia Fu
 Scott Turn
- Hawaiʻi Natural Energy Institute, University of Hawaiʻi, Honolulu, HI, United States
Detailed characterization of physical and fuel properties of construction and demolition waste (CDW) can support research and commercial efforts to develop sustainable aviation fuels. The current study reports time-series data for bulk density, mineral composition, reactivity, and fuel properties (proximate analysis, ultimate analysis, heating value and ash fusibility) of the combustible material fraction of samples mined from an active CDW landfill on the island of Oʻahu, Hawaiʻi. The fuel properties are in ranges comparable to other reference solid wastes such as demolition wood, municipal solid wastes, and landfilled materials. Ash fusion temperatures (from initial deformation to fluid deformation) among the samples were found to lie in a narrow range from 1,117 to 1,247°C. Despite higher ash contents, the CDW derived feedstock samples had comparable heating values to reference biomass and construction wood samples, indicating the presence of higher energy content materials (e.g., plastics, roofing material, etc.) in addition to wood. The waste samples show lower reactivity peaks in the devolatilization stage, but higher reactivity peaks (located at lower temperatures) in the gasification and combustion stage, compared with those of reference biomass and construction woods. Mineral elemental analysis revealed that materials from various sources (gypsum, plastic, rust, paint, paint additives, and soils) were present in the samples. Soil recovered from the landfill contained higher Ca, Cu, Fe, K, Mn, Pb, and Zn levels than soil samples from elsewhere on the island. Results from this study can provide insight on variations in the physical and fuel properties of the CDW derived feedstocks, and support the design of conversion systems.
Introduction
Construction and demolition waste (CDW), one of the major wastes associated with population growth and rapid industrial development, is generated during the construction, renovation, and demolition of buildings and civil-engineering structures. In the United States, about 569 million tons of CDW materials were generated in 2017 (US EPA, 2017). More than 90% of CDW is generated by demolition and renovation activities, while construction waste accounts for the rest (US EPA, 2017). In the European Union, CDW is the most voluminous component, accounting for 25–30% of the total waste (Cristelo et al., 2018). The composition of CDW strongly depends on the activities and the sources that generate the debris. Depending on location, CDW may also be mixed with other municipal wastes and/or hazardous materials. Concrete, asphalt, bricks, metals (ferrous and non-ferrous), wood, gypsum, glass, plastics, fibers, and soils are major components of CDW. They may also contain potentially hazardous elements and chemicals at trace concentration levels (Clark et al., 2006), e.g., arsenic (in termite treated wood), cadmium (in paints and batteries), lead (in paints and batteries), mercury (in electrical switches and thermostats), asbestos insulations, polycyclic aromatic hydrocarbons (PAHs), and polychlorinated biphenyls (PCBs). While some inert materials (concrete, asphalt) are believed to have minimal environmental impacts (Wu et al., 2014) and may be beneficial for reuse, e.g., recycled concrete production (Sadek, 2012; Safiuddin et al., 2013), the other fractions of CDW are normally disposed in landfills. Improper disposal or management of CDW may cause negative impacts on human health and the surrounding environment, therefore, regulations and standards have been promulgated and enforced to reduce unsafe management and utilization (Clark et al., 2006).
To reduce the disposal of wastes in landfills and dependency on fossil fuels, organic fractions (construction wood, tree parts, paper, cardboard, and plastics) of CDW can be utilized for sustainable aviation fuel (SAF) production (Shahabuddin et al., 2020). Implementation, however, requires insight and management of the variability in composition and fuel properties resulting from the inherent heterogeneity of CDW streams (Edo et al., 2018). Varied composition and fuel properties of CDW are known to contribute to conversion facility operating problems and require additional attention placed on emission controls and ash disposal.
Recently, SAF from waste materials, such as municipal solid waste (MSW) and CDW (Yilmaz and Atmanli, 2017; Shahabuddin et al., 2020), has received great interest. By May 2021, seven conversion pathways have been approved by ASTM for incorporation into ASTM D7566-20c (ASTM, 2020). Detailed fuel properties of CDW feedstocks are required to select appropriate technologies and system designs for these thermochemical conversion processes (Ragland et al., 1991; Bosmans et al., 2013). CDW can be extremely heterogeneous with composition that varies from sample to sample, making fuel characterization more challenging. Although some researchers investigated the composition of the CDW or similar wastes (e.g., MSW), these works mainly focused on the classification and characterization of individual components/materials (Rodríguez-Robles et al., 2015; Ansah et al., 2016; Nordi et al., 2017) rather than composite CDW materials. In addition, most of the studies considered CDW as debris rather than fuel-production feedstock, so their findings were helpful for waste management (Douglas et al., 2001; Roussat et al., 2008; Wu et al., 2014; Song et al., 2017; Bassani et al., 2019) but may not be useful for utilization of CDW as feedstock. Attention has been also paid to landfill-mined materials (van der Zee et al., 2004; Krook et al., 2012; Jain et al., 2013; Powell et al., 2016; Jagodzińska et al., 2021). Reclamation, material recycling, pollution control, and market opportunities of landfill mining have been discussed in recent publications (van der Zee et al., 2004; Krook et al., 2012; Jain et al., 2013; Jagodzińska et al., 2021). In addition, Powell et al. (Powell et al., 2016) estimated that a gross energy of 338 billion MJ per year can be produced from a total municipal waste stock of 8.5 billion Mg available in 1,232 landfills in U.S. from 1960 to 2013. Currently, there are only a few studies (Littlejohns et al., 2020; Passos et al., 2020; Peres et al., 2020) examining the fuel properties of CDW or landfilled materials and their potential for energy conversion via gasification. However, none of these works characterized the composite CDW materials in detail. Peres et al. (Peres et al., 2020) classified the biomass at a construction site into four sub-groups: mixed wood, pine (Pinus elliotti), plastic-coated plywood, and resin-coated plywood. Littlejohns et al. (Littlejohns et al., 2020) subdivided landfill diverted wood waste into CDW, discarded pallets and oriented strand board (OSB). García-López et al. (García-López et al., 2019) segregated waste directly excavated from a landfill into several types of materials including glass, inert, non-ferric metals, ferric metals, plastics, textile, paper, wood and fine particles. In addition, these studies employed single sampling events, which may not reflect the compositional variation of the CDW materials.
The present study characterizes the fuel properties of the combustible fraction of CDW derived feedstock necessary for its use for SAF production via thermochemical pathways. The analyses include non-combustible fraction, bulk density, proximate analysis, ultimate analysis, heating value, mineral composition, ash fusion temperatures, and reactivity. The CDW derived feedstock (CDWDF) samples reported in this study were collected from a construction and demolition landfill on the island of Oʻahu (Hawaiʻi) over the course of several months to characterize the variation in composition and fuel properties. Material collection, preparation, and analysis were guided by ASTM standards. For perspective, three different types of construction timbers and two woody biomass samples were also characterized.
Material Collection and Characterization Methods
Material Collection and Preparation
The CDWDF samples were collected at the PVT Land Company Ltd. (approximate location: 21°24′07.9″N, 158°08′39.3″W), located in Nānākuli in the Wai'anae district of Oʻahu (Hawaiʻi). Climate characteristics relevant to landfill conditions include the mean annual rainfall 667 mm (Giambelluca et al., 2013), mean annual temperature 23.64°C (Giambelluca et al., 2014), and mean annual Priestley-Taylor potential evapotranspiration of 1,625 mm. CDWDF material was generated either directly from trucks entering the landfill or from material mined from the landfill. CDWDF (Figure 1A and blue arrow in Figure 1B) was processed by PVT to remove recyclable material and noncombustible material. Feedstock for energy conversion exited the process line from an outfall conveyor (red arrow in Figure 1B) and was collected and stored in a dedicated cell in the landfill to be reclaimed for future use. One sample was collected from processed material that originated from incoming trucks in 2018. All the other samples were collected from processed material that had been mined from the existing landfill (11 samples). These materials were landfilled for ∼25 years. During the 2019 sampling campaign, the process line operated exclusively on mined material. The samples were identified by processing day, i.e., #yymmdd. The total amount of collected materials ranged from 35 to 55 kg per batch. It is worth noting that big inert objects, such as concrete and stones, were removed by the company prior to the sample collection in this study. The CDWDF samples obtained from the outfall conveyor were further hand sorted into combustible and non-combustible fractions. The non-combustible fraction includes small stones, ceramic, glass, and metal pieces (e.g., nails extracted from wood). After the removal of the non-combustible fraction, the weight of remaining combustible material ranged from 24 to 46 kg. These materials were primarily composed of construction wood, tree parts, plastics, rubber, paper, textiles, and roofing material. Of these, wood-based materials were abundant. This remaining combustible fraction of CDWDF, which can be employed as feedstock for energy and fuel production, is termed “combustible construction and demolition waste derived feedstock” (CCDWDF). The entire CCDWDF sample was ground to pass a 6 mm screen (SM400 XL Cutting Mill, Retsch, Haan, Germany). Subsequently, the 6 mm CCDWDF samples were riffled repeatedly, following ASTM E1757 (ASTM, 2015b), until four riffled subsamples of 200–400 g remained. To confirm the reproducibility of the characterization and analyses, one sample batch (#190213) was subdivided from the initial 25+ kg CCDWDF sample to a nominal 200 g sample four times. After producing a 200 g sample, the remaining material (∼25 kg) was remixed and the riffling process repeated to produce four identical sub-samples (∼200 g each) for analysis and comparison. This reproducibility assessment was conducted early in the sampling campaign to provide an estimate of error.
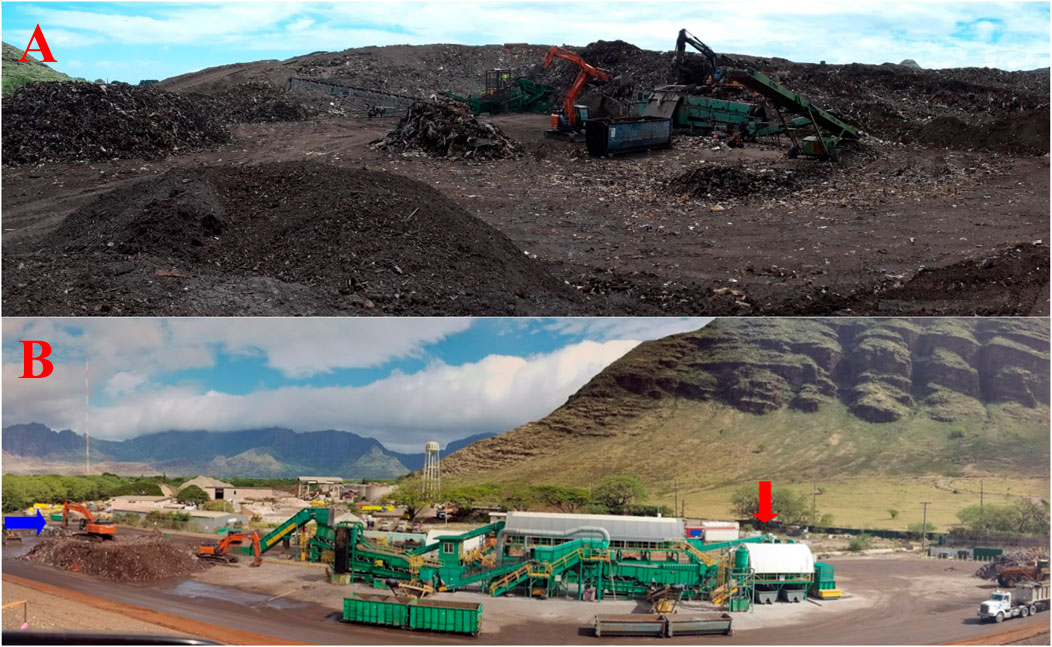
FIGURE 1. CDWDF materials (A) mining and (B) processing at PVT Land Company (blue arrow: CDWDF intake, red arrow: CDWDF sampling position).
Three construction wood and two woody biomass samples were included in this study and serve as reference woods for comparison with the CCDWDF materials. Two Douglas Fir construction wood samples purchased from local stores were not termite treated and were labeled “Constr. Wood 1” and “Constr. Wood 2.” The third sample (labeled “CCA Wood”) was removed from a home constructed in Honolulu in 1973 when construction wood was commonly treated with chromated copper arsenate (CCA) as a termite preventative. The two woody biomass are Douglas Fir and Eucalyptus. These reference woods were also ground to pass a 6 mm screen. However, they were not riffled due to their high homogeneity.
Characterization Methods
After riffling and subsampling were complete, the bulk density of the CCDWDF materials reduced to <6 mm particle size was determined according to ASTM E873 (ASTM, 2013b). Moisture content of the CCDWDF subsamples was determined using ASTM E871 (ASTM, 2013a). After measuring the moisture content, the remainder of the ∼250 g CCDWDF sample was dried at 105 ± 1°C (Lindberg MO-1440A Blue M Mechanical Oven, Asheville, NC, United States) for 16 h prior to size reduction. The dried CCDWDF materials were ground using a ball mill (Retsch PM100, Düsseldorf, Germany). Milled material was hand screened to pass a 70-mesh sieve (opening size of 0.21 mm). A small fraction of the CCDWDF material could not be adequately pulverized to pass the 70-mesh sieve after repeated ball milling and typically consisted of flexible polymeric materials, such as plastics, rubbers, and textiles. A cryogenic ball mill (Retsch Cryomill, Düsseldorf, Germany) using liquid nitrogen was employed to grind the recalcitrant materials to pass a 70-mesh sieve. The cryogenic and ambient ball milled materials were recombined and thoroughly mixed by a shaker and stored in a sealed bag for further analyses.
Proximate analysis of the ∼0.2 mm particle size CCDWDF samples was conducted using a LECO Macro TGA-801 (LECO Corporation, St. Joseph, MI, United States) according to ASTM D7582 (ASTM, 2015a). The moisture content reflected the moisture that CCDWDF materials adsorbed during fine grinding, handling, and storage. The moisture and ash contents from this test were used to convert subsequent measured quantities to dry basis (db) or dry and ash-free basis (daf), following the calculations provided in ASTM E791 (ASTM, 2016b).
Ultimate analysis (including C, H, N, and S contents) of the CCDWDF samples was measured using a LECO CHN-628 with a sulfur module S-628 (LECO Corporation, St. Joseph, MI, United States) according to ASTM D5373 (ASTM, 2016a) and ASTM D4239 (ASTM, 2018a), respectively. Higher heating values (HHVs) of the CCDWDF samples were measured using a Parr 6200 bomb calorimeter (Parr Instrument Company, Moline, IL, United States), according to the ASTM D4809 (ASTM, 2018b). Mineral compositions of CCDWDF materials were determined by X-ray fluorescence (XRF) (Bruker S8 Tiger, Bruker Corporation, Karlsruhe, Germany). The elemental concentration determined by XRF was calculated using a C6H10O5 matrix representing lignocellulosic biomass. The detailed XRF sample preparation and measurement procedure were described by Morgan et al. (Morgan et al., 2017).
Because most CCDWDF samples were mined from the landfill and were in contact with soil present in the landfill, analysis of soil samples was included in the study to provide context. Samples were collected from 1) screened soil recovered as part of PVT landfill mining operations and used internally on site (sample identification PVT); 2) an undisturbed land parcel upwind and upslope from the PVT landfill and across Lualualei Naval Road from the PVT landfill site (sample identification AR); and 3) screened recycled soil product offered for sale by the West Oʻahu Aggregate Co. Inc., located on an adjacent land parcel ∼1 km from the landfill mining activities (sample identification WOA). The PVT soil sample is representative of material adherent upon the CCDWDF samples. The AR soil sample serves as a reference soil indicative of the environment surrounding the landfill. West Oʻahu Aggregate’s recycling services takes in material from across Oʻahu and the WOA soil sample represents a composite for the island. At each of the three locations, five sub-samples were collected. The soil samples were sent to the Agricultural Diagnostic Service Center (ADSC) at the University of Hawaiʻi at Mānoa to analyze their loss-on-ignition and metal content following ASTM D7348 (ASTM, 2008) and EPA Method 3050B (US EPA, 1996), respectively.
Selected CCDWDF samples (#181227, #190116, #190213, #19312, #190405, #190718, and #19815) were also sent to a commercial laboratory (Hazen Research Inc., Golden, CO, United States) for additional analyses. The analyses, including proximate analysis, ultimate analysis, heating value, and elemental composition, were performed to provide comparative data to University of Hawaiʻi (UH) measurements. Hazen employed an inductively coupled plasma, optical emission spectrometry (ICP-OES) for determination of CCDWDF mineral composition, while the UH analysis employed XRF. Prior to ICP analysis, the samples were oxidized at 600°C and the resulting ash was microwave digested in a mixture of four acids. For the volatile elements As, Br, Hg, and Se, a parallel ICP-OES analysis was performed that acid digested fuel samples directly (i.e., no ashing step). The acid HF was not used in this parallel analysis to allow F quantification. Ash fusion temperatures of the selected samples were determined by Hazen according to ASTM E953 (ASTM, 2016c) to characterize ash deformation behavior.
Reactivity of the CCDWDF samples in reducing and oxidizing atmospheres was determined using a thermogravimetric analyzer Mettler Toledo TGA/SDTA851e (Schwerzenbach, Switzerland). The CCDWDF sample was loaded into a crucible, which was heated from room temperature to a final temperature set point at a heating rate of 10°C/min under a gas flow rate of 100 ml/min. For reducing reactivity tests, a ∼10 mg sample was heated to 1,100°C under a CO2 atmosphere, whereas a ∼1 mg sample and final temperature of 900°C was used for oxidizing reactivity tests in synthetic air. An initial 30 min isothermal period was performed at 105°C for all tests to remove moisture absorbed during storage and handling.
Similar sample preparation processes and fuel analyses were applied to the reference wood samples. However, non-combustible fraction, bulk density, and ash fusion temperatures of the reference wood samples were not determined due to limited sample amounts. In addition, at least three replicates were conducted for all measurements to provide an error estimate for the experimental data (i.e., measurement uncertainties). Data variations in the four sub-samples from the batch #190213 are reported as sampling uncertainties. A list of characterizations conducted in the current study is presented in Supplementary Table S1.
Results and Discussion
The following section presents the analytical results from the sampling campaign and the reference materials.
Material Fractions of CDWDF
Figure 2 illustrates the material fractions of CDWDF samples. Note that the mined samples were normally coupled with soil, dust and adventitious materials; some materials were also degraded or deformed, making material separation and identification more challenging. The CDWDF samples at PVT were classified into four general fractions: non-combustible material, moisture, combustible non-wood material and woody material. Non-combustible material, combustible non-wood material and woody material were hand sorted and weighed. Moisture content was calculated after drying at 105°C until constant weight. The non-combustible fraction of CDWDF spans a wide range from 8.8 to 35.4 wt% across sampling events and reflects the effectiveness of the PVT processing line. Moisture accounts for 10.1–19.8 wt% of the CDWDF materials. The lowest fraction (1.2–13.6 wt%) in CDWDF belongs to the non-wood material, which may include rubber, plastics, paper, and textile. Woody material is the largest fraction with 50.6–70.8 wt%. The CDWDF in this study contains more woody materials (>50 wt%) than García-López et al. (García-López et al., 2019) reported for material excavated from a landfill and directly characterized (<4.1 wt%). Removal of non-combustible and recyclable materials by the PVT Land Co. processing line prior to the sample collection point was largely responsible for this difference. The fraction of mined material removed by the process line was not quantified. García-López et al. characterized all the mined materials (García-López et al., 2019). In addition, the landfill studied by García-López et al. (García-López et al., 2019) accepted MSW, which would result in a lower wood fraction than CDWDF.
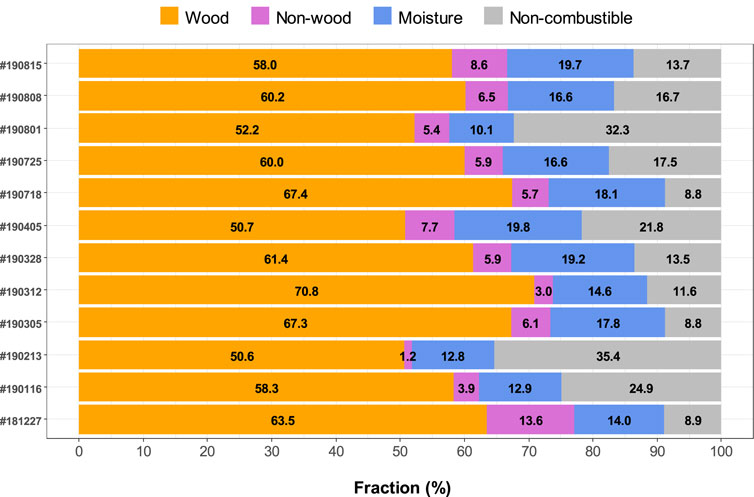
FIGURE 2. Material fractions of CDWDF from PVT Land Co.
Moisture Content and Bulk Density of CCDWDF Materials
From this point forward, the results pertain only to the combustible fraction of construction and demolition waste derived feedstock (CCDWDF).
Table 1 presents data for the wet bulk density, moisture content and dry bulk density for the <6 mm CCDWDF materials. The wet bulk density of seven batches of the CCDWDF materials (<6 mm) ranged from 220 to 269 kg/m3, with an average of 241 kg/m3 and a standard deviation of ±18 kg/m3. The range of moisture content of the <6 mm CCDWDF materials was 14.88–25.35 wt%, and was higher than the reference wood samples (10.12–14.21 wt%); the latter indicative of equilibrium moisture content at ambient conditions. The mean annual rainfall, temperature, and evapotranspiration rates at the site contribute to the relatively low moisture content of samples; wood recovered in samples was notably well preserved. Apart from the inherent moisture of the CCDWDF materials, water was actively sprayed on the CDWDF materials for dust control by PVT personnel during mining operations and at the inlet and outlet of the processing line (Figure 1B). This added water contributed to the moisture content of the CCDWDF materials, partially explaining their elevated moisture content compared to the reference wood samples. The moisture data in this study are in good agreement with that of Littlejohns (Littlejohns et al., 2020), a CDWDF moisture content (as-received) of 20 wt%, and in a common moisture content range (6.16–38.70 wt%) of other solid waste samples (Table 2). The dry bulk density, calculated from the wet bulk density and moisture content, varied from 171 to 229 kg/m3. The bulk densities (both wet and dry) are relatively consistent across sampling days and are close to the bulk densities of other wood chips reported in the literature (Eisenbies et al., 2019), indicating that the handling, transporting, and feeding requirements for CCDWDF and wood chip fuels may be similar. It is worth noting that the particle size of the CCDWDFs in this study is less than 6 mm, but data for the wood chips in (Eisenbies et al., 2019) were not reported.
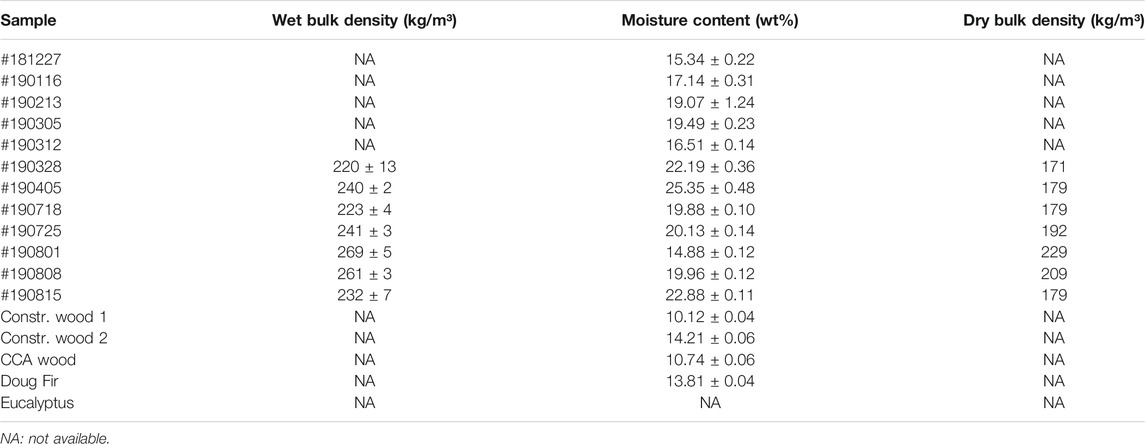
TABLE 1. Physical properties of CCDWDF materials (<6 mm) and reference woods.
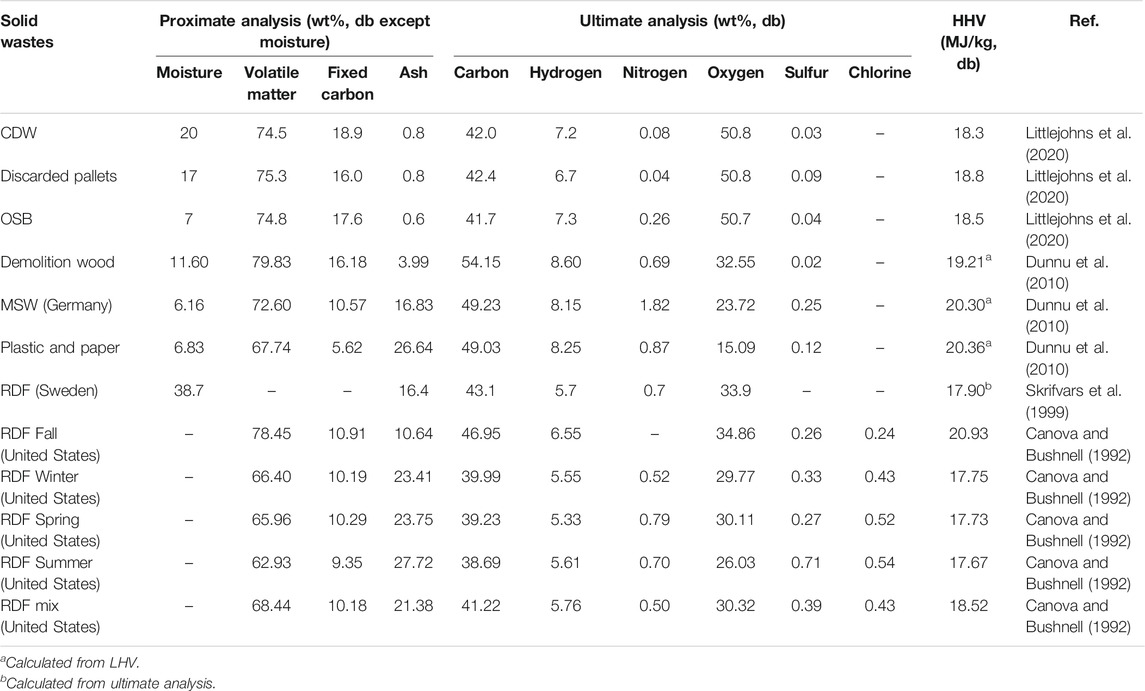
TABLE 2. Summary of higher heating values, proximate and ultimate analyses of solid waste samples from the literature.
Proximate Analysis
The proximate analysis results of the CCDWDF materials and the reference woods are listed in Table 3. The ash content of the CCDWDF varies in a wide range from 6.20 to 18.21 wt% because of the heterogeneity of these materials, collected from different sources and containing varied components. Compared with the ash contents of the reference wood samples (0.05–0.89 wt%), those of the CCDWDF are significantly higher, implying that the CCDWDF includes materials with elevated ash content that may include wood adulterated with inorganic material such as wood treatment chemicals, wall plaster, paint additives, rust, soil, and dust particles. Cardboard, paper, PVC, low density polyethylene, rubber, textiles and roofing materials, present in varying amounts in the CCDWDF samples, each has higher ash content (Cui and Turn, 2018) and would contribute to elevated ash in the composite sample. Management of high ash fuels is often necessary in thermochemical energy conversion facilities to mitigate negative impacts on operations, working surface materials, and emissions.
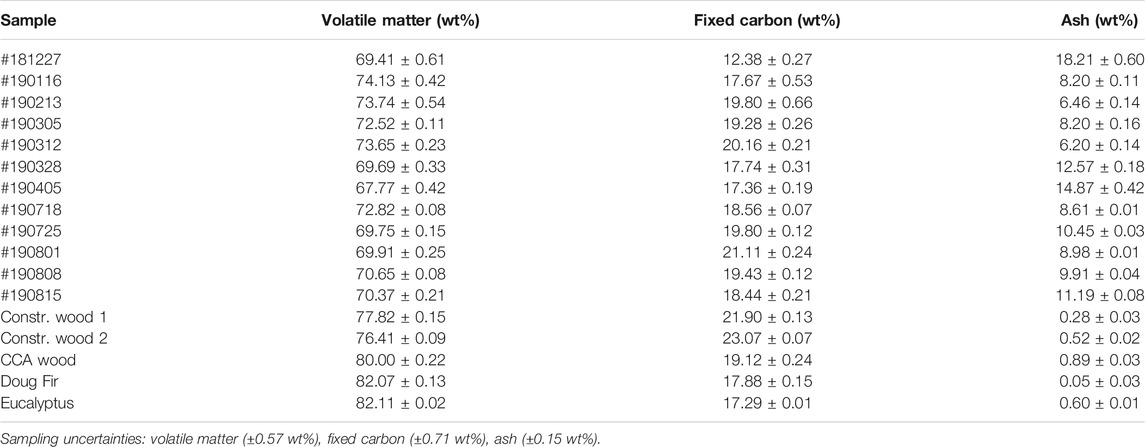
TABLE 3. Proximate analysis of CCDWDF materials and reference woods (on dry basis).
The volatile matter contents of the CCDWDF materials (67.77–74.13 wt%) are all lower than those of the reference wood samples (76.41–82.11 wt%). The fixed carbon contents of the CCDWDF samples vary from 12.38 to 21.11 wt%, which are lower than those of the two construction wood samples (21.90 and 23.07 wt%). The fixed carbon contents of the CCA wood (19.12 wt%) and two woody biomass (17.88 and 17.29 wt%) are in the bottom range of the CCDWDF values. These data indicate that the more labile components of the CCDWDF materials that are measured as volatile matter have been preferentially degraded during their time in the landfill. The PVT landfill opened in 1985 and the portion under active mining during the project period was estimated to date to the mid to late 1990s. PVT’s location falls between 525 and 800 mm annual rainfall isohyets (Giambelluca et al., 2013) so low degradation rates are not unexpected.
Proximate analysis values reported from other high-ash biomass such as rice husk (Ma et al., 2015) and macroalgae (Bach et al., 2014), are comparable to the CCDWDF materials. The volatile matter contents of the CCDWDF materials (67.77–74.13 wt%) are in the range spanned by those summarized in Table 2 (62.93–78.83 wt%), while the CCDWDF materials fixed carbon (12.38–21.11 wt%) and the ash (6.20–18.21 wt%) contents trend higher (5.62–18.90 wt%) and lower (3.99–27.72 wt%, except value in Littlejohns et al., 2020) respectively, than those in the literature. The ash content of CCDWDF measured in this study is much higher than the 0.8 wt% (air dry basis) value reported by Littlejohns et al. (Littlejohns et al., 2020). Although they did not clearly describe the location and processing of the CDW, it appears that the waste was relatively clean. The sample unloaded from incoming trucks (#181227) has higher ash content but lower fixed carbon content than the samples mined from the landfill. Nevertheless, more data are needed for material from incoming trucks to establish trends.
Ultimate Analysis
Results from the ultimate analysis (i.e., average C, H, N, S and O contents) of the CCDWDF materials and reference woods on dry basis are tabulated in Table 4. Carbon and hydrogen contents of the CCDWDF materials are similar to those of the reference woods. The carbon contents of the CCDWDF materials and reference wood samples are respectively 42.77–49.85 wt% and 49.12–53.21 wt%, while the hydrogen contents of the CCDWDF materials and reference woods are 5.16–5.81 wt% and 5.88–6.06 wt%, respectively. Conversely, the nitrogen contents of the CCDWDF materials (0.25–0.41 wt%) are higher than those of the reference wood samples (0.13–0.19 wt%). The sulfur contents of the CCDWDF materials vary from 0.33 to 2.04 wt%, while those of the reference woods are below the detection limits. Consequently, the oxygen contents (calculated by difference) of the CCDWDF materials (31.41–38.52 wt%) are lower than those of the reference woods (40.26–44.04 wt%).
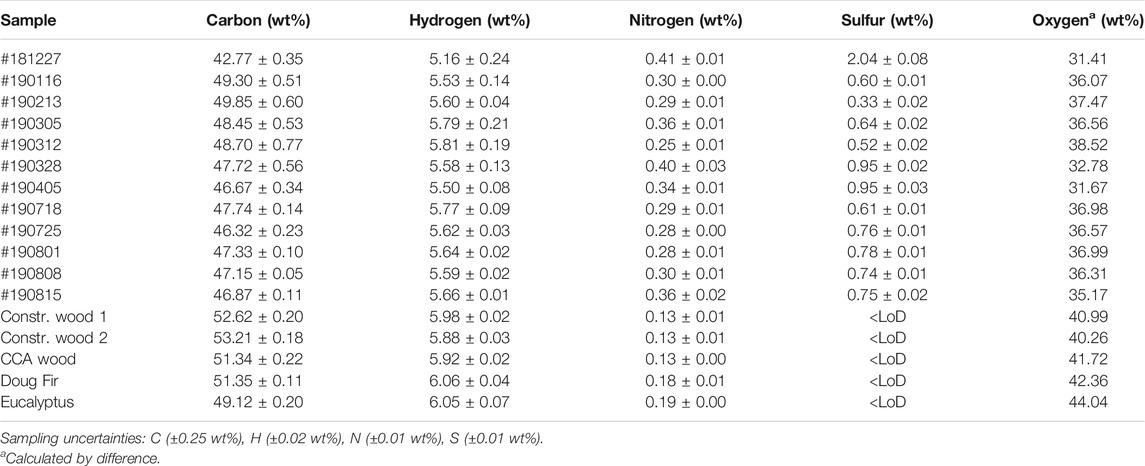
TABLE 4. Ultimate analysis of CCDWDF materials and reference woods (on dry basis).
Compare with other solid wastes in Table 2, the carbon, nitrogen and oxygen contents of the CCDWDF materials are well-fitted in the ranges of those of the solid wastes. The hydrogen contents of the CCDWDF materials are in the lower range but the sulfur contents of the CCDWDF materials are in the higher range, compared with those of the solid wastes. Overall, the ultimate analysis data of the CCDWDF materials are in good agreement with those of the solid wastes.
The atomic H/C and O/C ratios were calculated based on the ultimate analysis data and plotted in a van Krevelen diagram (Figure 3). The diagram show that the positions of the CCDWDF materials and the construction woods (Constr. Wood 1, Constr. Wood 2, and CCA Wood) are all in the biomass area. The O/C and H/C ratios of these materials are in the range of 0.56–0.72 and 1.47–1.70, respectively, whereas those of the woody biomass (Douglas fir and Eucalyptus) are 0.72–0.80 and 1.61–1.74.
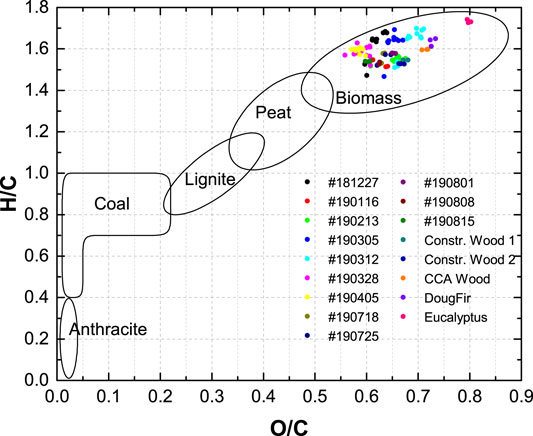
FIGURE 3. Van Krevelen diagram for CCDWDF materials and reference woods.
Higher Heating Value
Higher heating values (HHVs) of the CCDWDF materials and reference woods on dry basis are presented in Figure 4. Sampling uncertainty of this analysis is ±0.35 MJ/kg as determined from the #190213 replicates. On dry basis, the HHV averages of the CCDWDF materials vary from 17.22 to 20.22 MJ/kg, and are similar to those of the CCA treated wood (19.87 MJ/kg) and the two woody biomass (18.74 and 18.88 MJ/kg). However, the CCDWDF materials have lower HHVs than the untreated construction woods (21.04–21.08 MJ/kg). The CCDWDF sample having the highest ash contents (#181227) also possessed the lowest HHV whereas the CCDWDF sample with the lowest ash contents (#190312) has the highest HHV. Nevertheless, there is no correlation between the ash content and the HHV of the CCDWDF materials. The HHVs of the CCDWDF materials in this study are in good agreement with the reported values for other solid wastes (17.67–20.93 MJ/kg) in Table 2 (Canova and Bushnell, 1992; Skrifvars et al., 1999; Dunnu et al., 2010; Littlejohns et al., 2020).
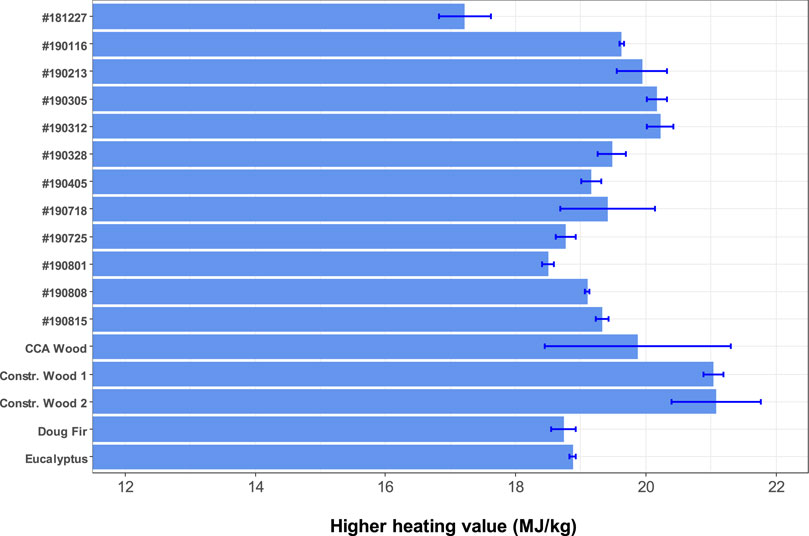
FIGURE 4. Higher heating values of CCDWDF materials and reference woods.
Mineral Analysis
This section presents results from the mineral analysis of all CCDWDF materials by XRF and selected samples by ICP-OES. Soil sample analyses by ICP-OES are also presented.
Soil Analysis
The composition of the soil samples serves as background data useful in tracing the origin of the mineral elements present in CCDWDF materials. Figure 5 shows that the AR and WOA soils have comparable concentrations of K, Zn, Mn, Cu, V, Ca, and Fe. The PVT sample has significantly higher contents of K, Zn, Cu, Pb, As, Cd, Ca and Na than the AR and WOA soils, indicating that these elements originated from the CCDWDF materials. Naturally occurring As concentration in Hawaiʻi soils are <20 ppmw (USDA-NRCS, 2011).
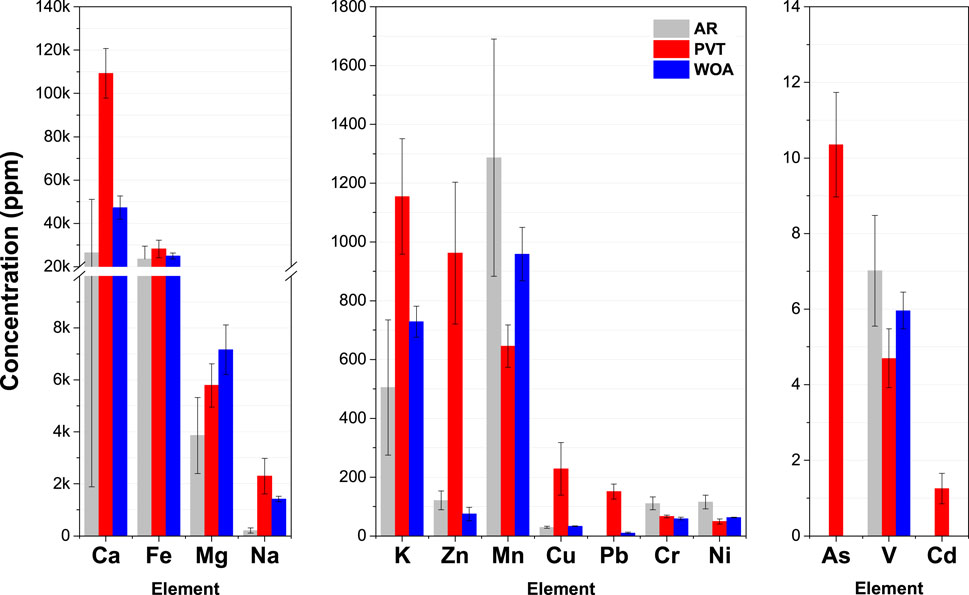
FIGURE 5. Element concentrations in different soil samples.
The loss on ignition data (12.44, 23.22 and 13.39 wt% for AR, PVT, and WOA samples, respectively) indicates that the samples from PVT had higher organic matter than the other locations and that the PVT sample was a mixture of soil and CCDWDF. Certain elements (i.e., Mn, Cr, Ni, and V) are present at lower concentrations in the PVT soil, compared with the AR soils, indicating that the soil contributions have been diluted by inorganic matter originating from the PVT CDW. Fe in the three soil samples is the second highest in abundance and has comparable concentrations among the samples. This is expected as Hawaiʻi’s volcanic soils are normally high in Fe (Thompson et al., 2011). Most trace element concentrations are in typical ranges for soils (Pais and Jones, 1997), with the exception of Zn levels in the PVT sample.
CCDWDF Analysis
The values reported are the average of 6 measurement (3 pellets and 2 sides for batches with a single sub-sample) or 24 measurements (3 pellets and 2 sides for batches with 4 sub-samples). Detected elements divided into three ranges are presented in Figures 6A–C, based on their average concentrations: >1,000 ppm, 100–1,000 ppm, and <100 ppm, respectively. In total, 68 elements were scanned by the XRF. Elements concentrations below the detection limits were excluded from Figure 6.
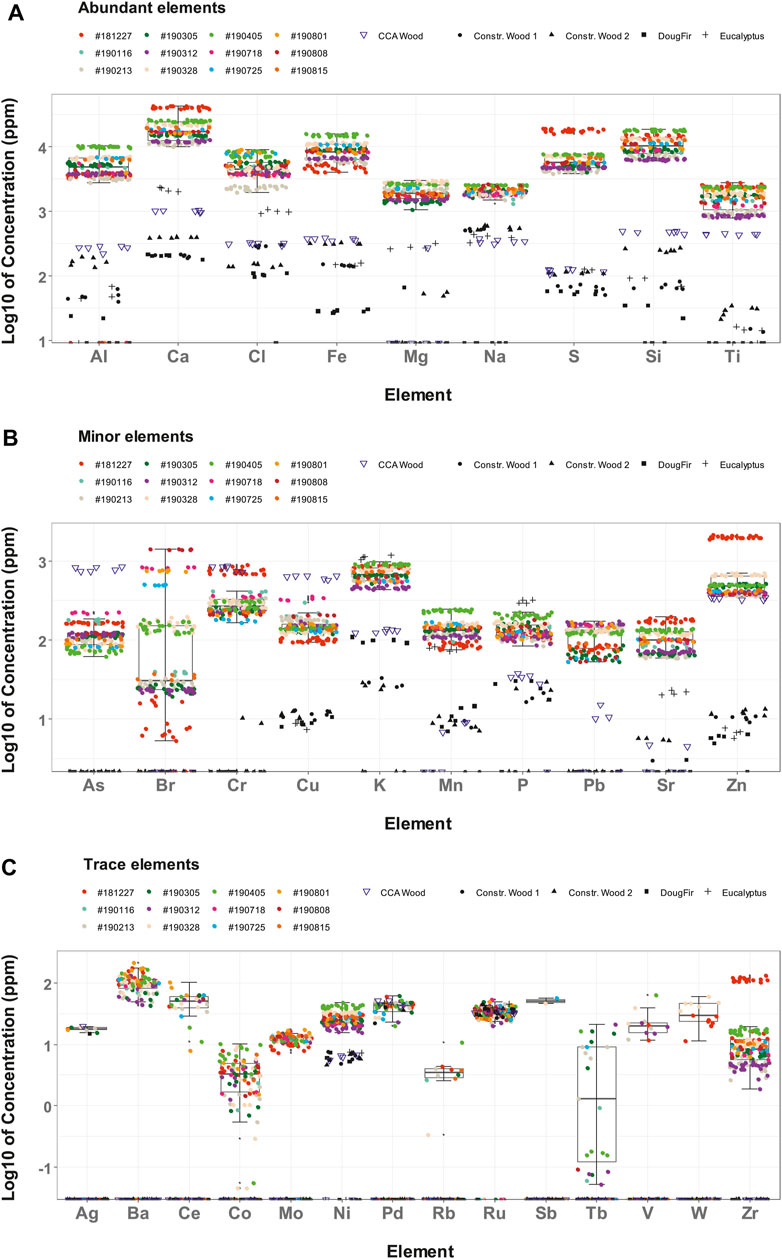
FIGURE 6. Concentration of elements from individual measurements in CCDWDF materials and reference woods for (A) abundant elements, (B) minor elements, and (C) trace elements.
The limit of detection (LoD) for each element slightly varies due to differences in element concentration from sample to sample. The reported LoDs, tabulated in Supplementary Table S2, for the CCDWDF materials and the reference wood samples are the maximum individual LoD values for each element in the two material groups. In addition, a full list of all scanned elements is tabulated in Supplementary Table S3 for the CCDWDF materials and Supplementary Table S4 for the reference wood samples.
CCDWDF Analysis: Abundant Elements (>1,000 ppm)
Figure 6A presents the measured concentrations of the major elements (>1,000 ppm) in the CCDWDF materials, including Ca, Si, Fe, S, Al, Cl, Mg, Na, and Ti, listed here in order of generally decreasing concentration. The concentrations of these elements in the CCDWDF materials are much higher than those in all reference wood samples, indicating that the wood fraction of CCDWDF would not be expected to be their source.
The most abundant mineral element in the CCDWDF materials is calcium (12,078–42,485 ppm) Samples with higher calcium content also have higher sulfur and silicon contents, and vice versa. Although construction wood, the main component of CCDWDFs, also contains calcium, its concentration is much lower. The potential sources of calcium in the CCDWDF samples are from gypsum (CaSO4·2H2O) as wall plaster and surrounding soils (e.g., in form of calcite CaCO3). It is easy to understand the presence of gypsum in the CCDWDF materials because sheetrock or drywall is one of the most common substances for house construction. The second highest concentration is silicon (6,790–19,010 ppm), which may originate as caulking present as a material of construction or be present as adherent soil from activities prior to landfill entry or within the landfill after delivery. Iron, in third highest concentration (5,053–15,960 ppm), may originate from corroded fasteners, steel, and other iron-based materials. Adherent soil may also contribute to high concentrations of iron in CCDWDF samples (Figure 5). The range of concentration of sulfur in the CCDWDF materials, 4,501–18,837 ppm, is associated with the presence of calcium. This is supported by the Ca to S molar ratios ranging from 1.64 to 2.94 (Supplementary Table S5), indicating a positive correlation between the two elements. The fifth most abundant element is aluminum (1,384–10,590 ppm) that may be derived from household aluminum-based materials, paint additives, and soil. The next most abundant element is chlorine (2,477–8,879 ppm), commonly found in polyvinyl chloride (PVC), one of the most widely produced polymer in the world, and other chlorine-containing polymers such as polychloroprene (Neoprene) and chlorinated butyl rubber. Magnesium (1,489–2,978 ppm) and sodium (1,780–2,680 ppm) concentrations are slightly lower than chlorine. They are present at much higher concentrations in the CCDWDF materials in comparison with the reference woods. Presumably the source of the two elements are soil impurities although only magnesium was detected in the soil analysis in the previous section. The lowest concentration in this group is titanium (917–2,595 ppm). Considering lower titanium concentrations in the reference woods, this elements might be derived from TiO2 present in soils and additives for surface coating materials and paints.
Note that the CCDWDF sample from trucks (#181227) has significantly higher concentrations of calcium and sulfur than other CCDWDF samples, indicating that the sample from trucks may have much higher amount of gypsum than the others. Another possible explanation is that the gypsum (CaSO4·2H2O) in landfilled samples was leached and mobilized in the landfill over time (Palha et al., 2012; Aldaood et al., 2015), resulting in lower concentrations of calcium and sulfur in the landfilled CCDWDF samples and higher calcium concentration in the soil.
CCDWDF Analysis: Minor Elements (100–1,000 ppm)
Figure 6B presents the concentrations of minor elements in the CCDWDF materials, including As, Br, Cr, Cu, K, Mn, P, Pb, Sr, and Zn. Among the reference wood samples, the CCA wood has much higher concentrations of chromium, copper, and arsenic. Also, the concentrations of these three elements in the CCA wood are higher than those in the CCDWDF materials, with the exception of the chromium content of sample #181227. The higher Cr, Cu, and As concentrations in the CCA wood sample resulted from the CCA treatment used as a wood preservative and to repel termites. The lower concentrations of the three elements in the CCDWDF materials may be because the wood-based materials in the CCDWDFs were not all CCA treated, or were treated at lower concentrations. Mobilization of CCA within the landfill over time could also result in reduced concentrations.
Concentrations of potassium and phosphorus in eucalyptus are higher than the other wood and CCDWDF materials. These two elements are plant macronutrients and it might be presumed that eucalyptus absorbed them from fertilizers applied to the plantation or from the surrounding soils during growth. The potassium and phosphorus concentrations of the CCDWDF materials are much higher than those of other reference woods (noting the exception of eucalyptus). Referring to the soil analysis, the PVT soil has significantly higher potassium content than the other soils indicating that potassium was present in the CCDWDF materials and mixed with surrounding soil at PVT. On the other hand, the source of phosphorus in the CCDWDF materials appears to be from the soil impurities.
For the remaining elements, Br, Mn, Pb, Sr, and Zn, the CCDWDF materials overall have higher concentrations than the reference wood samples. In addition, the concentrations of chromium and zinc in the CCDWDF sample from trucks (#181227) was significantly higher than the other CCDWDF samples. These elements were likely present in paint additives rather than in woody materials. This observation is coupled with the highest concentrations of calcium and sulfur in this sample. Because paints were used to cover the surface of gypsum, the sample with a higher amount of gypsum is also associated with more elements present in paint additives. Zinc is also used to galvanize metal that may be present in water pipes and roofing materials of older homes in Hawaiʻi. Among the elements, bromine in the CCDWDF materials varies in a very wide range from 45 to 1,437 ppm, and was not detected in any reference wood samples. These concentrations are consistent with its presence in plastics and its use as a flame retardant in consumer products and building materials (Vainikka and Hupa, 2012). Bromine stands at the fourth position in average concentration in this group, the top three concentrations are potassium (493–9,580 ppm), zinc (394–2,096 ppm), and chromium (184–784 ppm). The following elements are copper (104–345 ppm), manganese (92–250 ppm), phosphorous (115–215), and lead (81–171 ppm).
These elements (except lead) are present in the reference woods at lower concentrations, which indicate that their main sources were not from wood-based materials. Among those, copper may come from electric wires and water pipes besides wood treated chemicals; manganese can be found at a small concentration in steel and aluminum household items, phosphorous might be present in soil impurities, while lead is normally used in paints. Arsenic (81–229 ppm) and strontium (68–185 ppm) have the lowest concentrations among the minor elements. The former is likely from CCA treated wood and the latter can occasionally be found in Hawaiʻi soil (Chadwick et al., 2009).
CCDWDF Analysis: Trace Elements (<100 ppm)
Elements that were detected by the XRF in individual scans of CCDWDF samples are presented in Figure 6C and include Ag, Ba, Ce, Co, Mo, Ni, Pd, Rb, Ru, Sb, Tb, V, W, and Zr. However, most of these elements have the average concentrations lower than the LoDs, except nickel and molybdenum, indicating that the presences of these elements in the CCDWDF materials have high uncertainties. Moreover, most of these elements were not detected in the reference woods, recognizing that their LoDs for the reference woods were lower than those of the CCDWDF materials as indicated in Supplementary Table S1. With the exception of nickel, most of the trace elements in the CCDWDF materials do not appear to be derived from wood components and thus are sourced from adherent soil or other construction materials.
Comparison of XRF and ICP-OES Data
Seven CCDWDF samples were sent to an external commercial laboratory for independent analyses to provide comparative measurements. For the proximate, ultimate, and heating value analyses, both the UH and Hazen teams followed the same ASTM standards and their results are in good agreement, see Supplementary Figure S1. The XRF and ICP-OES datasets are presented in Supplementary Tables S3, S6, respectively, and compared in Figure 7. Note that the concentrations of elements S and Cl in Figure 7 used the total chlorine and sulfur contents from the Hazen analysis result rather than ICP-OES data. Overall, the elemental concentrations acquired from the two techniques are consistent with a few exceptions. The elements fluorine, mercury, bismuth, cadmium, lanthanum, rhenium, antimony, and yttrium were detected only by ICP-OES (see Supplementary Table S5 for values). Cobalt and molybdenum were identified only by XRF. The ICP-OES data show higher concentrations in vanadium, zirconium, and barium than the XRF data, whereas the XRF analysis report higher content of nickel, bromine, lead, zinc, chlorine, and calcium.
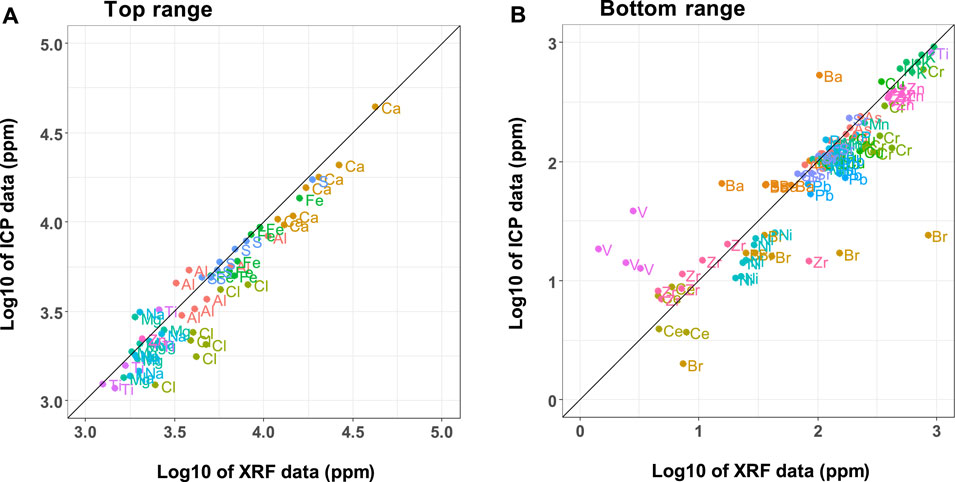
FIGURE 7. Comparison of mineral element data from UH XRF and Hazen ICP analyses across two concentration ranges, (A) >1,000 ppm and (B) <1,000 ppm (ICP data do not include chlorine and sulfur).
The comparison in Figure 7 reveals that the ICP-OES may be more sensitive and can detect more elements at low concentrations, while the element concentrations from the XRF are mostly greater than those from the ICP-OES for elements present in higher concentrations. Lower LoDs for ICP-OES compared to XRF have been reported elsewhere (McComb et al., 2014; Chojnacka et al., 2018). The differences may come from the principles of the analytical methods. In the XRF method, the X-ray scans the surface of the sample pellets within a few micrometers to millimeters depth, depending on the matrix. This scanning principle makes trace elements at low concentrations difficult to detect. Sample preparation to produce a homogeneous mixture in the pellet thus plays an important role for XRF. For ICP-OES, acid digestion is employed to prepare the sample prior to detection by the ICP-OES. Elements such as silicon may resist acid digestion resulting in measured element concentrations lower than actual. Samples subjected to either ICP or XRF were dried and ground (<0.2 mm) prior to analysis, but the ICP samples were ashed and acid digested. These additional steps provide opportunities for loss of elemental mass prior to analysis and could contribute to the generally lower values determined by ICP-OES. In addition, spectral interferences and matrix effects may occur and reduce the precision of the ICP-OES method in detecting elements with high concentration (Olesik, 1991).
Comparison With Other Data
Table 5 compares heavy metal concentrations in other MSW and landfilled materials (Esakku et al., 2005; Jain et al., 2005; García-López et al., 2018; Littlejohns et al., 2020) reported in common with CCDWDF data. Among the elements, the CCDWDF materials have higher Al, As, and Ba levels than other wastes. Cr, Cu, Fe, Mn, Ni, Pb, and Zn contents in the CCDWDF materials are comparable. Cd, Co, Hg, Se, and V concentrations in the CCDWDF materials were lower than their LoDs, but were occasionally detected in the samples from the literature.
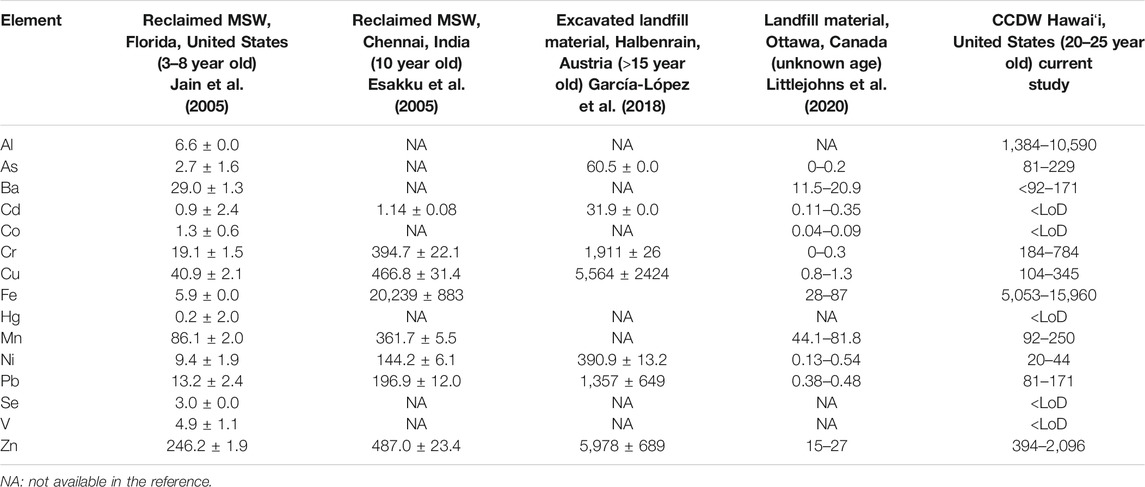
TABLE 5. Heavy metal contents in other MSW and landfill materials (in ppm).
The mineral composition in the CCDWDF samples (from both XRF and ICP measurements) are calculated and illustrated in Figure 8 in the chemical classification system of inorganic matter in biomass adopted from (Vassilev et al., 2012), note that Si content from XRF was also used for ICP data because the ICP analysis did not report it. Data for other solid wastes (in Tables 2, 8) are also included for comparison. The ternary diagram shows that the CCDWDF materials are located in the shaded biomass area and surrounded by MB (mixture of biomass), AVB (all varieties biomass) and HAS (herbaceous and agricultural straw). The variation between XRF and ICP analyses is visible but not unexpected, because the ICP measured the element concentrations in the ashes prepared at 600°C while the XRF was employed without an ashing step. In both analysis methods, the truck sample (#181227) is located lower in the diagram and distant from the other samples due to its significantly high calcium content. On the other hand, most referenced solid wastes are positioned in the coal area, except the demolition wood (Dunnu et al., 2010), locating outside of either coal or biomass area. This may result from its very high Mg and Ca in ash.
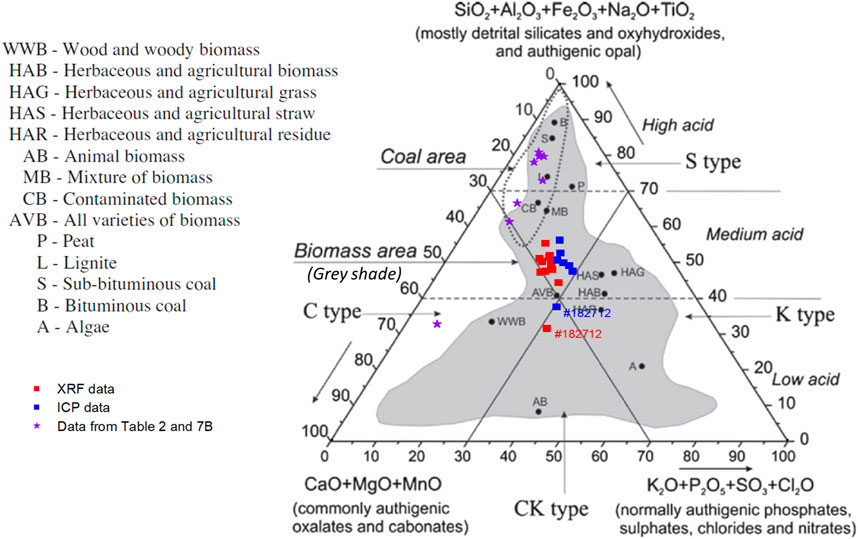
FIGURE 8. Position areas of CCDWDF samples and referenced solid wastes in the chemical classification system of inorganic matter in biomass based on (Vassilev et al., 2012). Reprinted from Fuel, 94, Vassilev, S. V., D. Baxter, L. K. Andersen, C. G. Vassileva, and T. J. Morgan. An overview of the organic and inorganic phase composition of biomass. pp 1-33, Copyright 2012, with permission from Elsevier.
Ash Fusion Temperature
Table 6 presents ash fusion temperatures of selected CCDWDF materials under reducing and oxidizing atmospheres. After initial fuel characterization (proximate, ultimate, and XRF analyses), samples were chosen to represent a range of collection dates and variation in ash contents and compositions. The CCDWDF ash samples started their initial deformation at 1,117–1,245 and 1,184–1,205°C in reducing and oxidizing atmospheres, respectively. Fluid deformation occurred at temperatures ranging from 1,138 to 1,248°C in a reducing atmosphere and 1,191–1,210°C in an oxidizing atmosphere. Although the elemental and mineral compositions of the CCDWDF materials are varied, their ash fusion temperatures show marginal variation among these samples. In addition, the temperature ranges from the initial deformation to fluid temperature of most samples are relatively narrow, only 3–9°C, with a few exceptions for the samples #190116, #190405, #190815 in the reducing atmosphere, in which the differences between the initial deformation and fluid temperatures are 21–38°C.
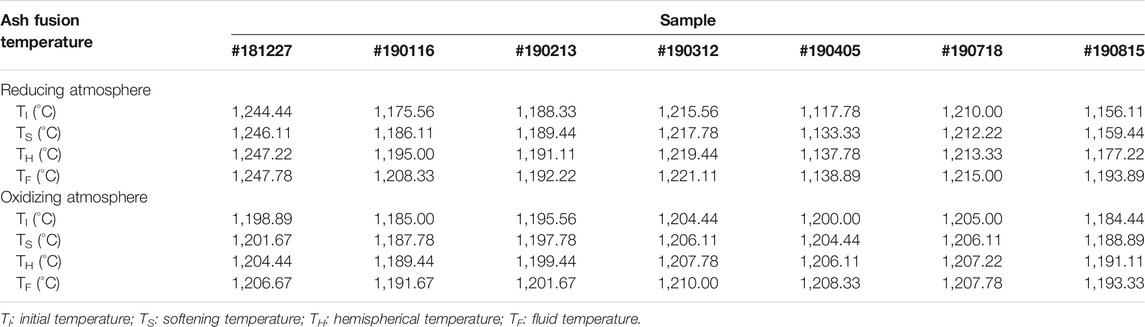
TABLE 6. Ash fusion temperature of selected CCDWDF materials.
Table 7 presents ash composition and deformation (oxidizing atmosphere) data for biomass with ash fusion temperature ranges comparable to the CCDWDF materials (Fernández Llorente and Carrasco García, 2005; Skrifvars et al., 2005; Du et al., 2014; Chen et al., 2015). Their initial and fluid deformation temperatures ranged from 1,088 to 1,200 and 1,206–1,280°C, respectively. The data reveal that the ash initial deformation temperatures of the CCDWDF are in the higher range of those of the selected biomass, while the fluid temperature of the CCDWDF ashes are in the lower range of those of the selected biomass ashes. In addition, the temperature ranges from the initial deformation to fluid temperature of the biomass samples are 70–118°C, which is much wider than those of the CCDWDF materials. Although full ash composition data of Table 7 biomass samples were not reported, their ash tended to have significantly higher concentrations of CaO (13–52 wt%) and SiO2 (26–52 wt%, excluding eucalyptus bark in (Skrifvars et al., 2005), only 0.1 wt%) than other oxides, indicating higher concentrations of Ca and Si than other elements. These two elements are also the most abundant in CCDWDF materials in this study.
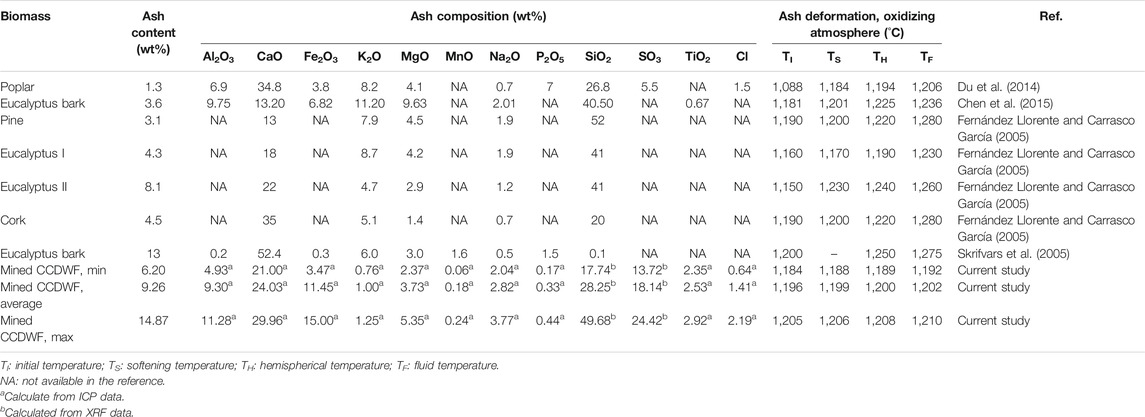
TABLE 7. Ash composition and fusibility of a selection of biomass comparable to CCDWDF materials.
Ash composition and deformation (oxidizing atmosphere) data from demolition wood, waste plastic and paper, MSW, and refuse derived fuel (RDF) are presented in Table 8. Initial and fluid deformation temperatures of these wastes ranged from 1,090 to 1,180 and from 1,210 to 1,277°C, respectively. The demolition wood (Dunnu et al., 2010) has exceptional high initial and fluid deformation temperatures of 1,335 and >1,500°C, respectively, noting that this material does not belong to either coal or biomass in the ternary inorganic matter plot (Figure 8). The data indicate that the CCDWDF materials in this study have ash fusion temperatures in the range of other solid wastes reported in the literature.
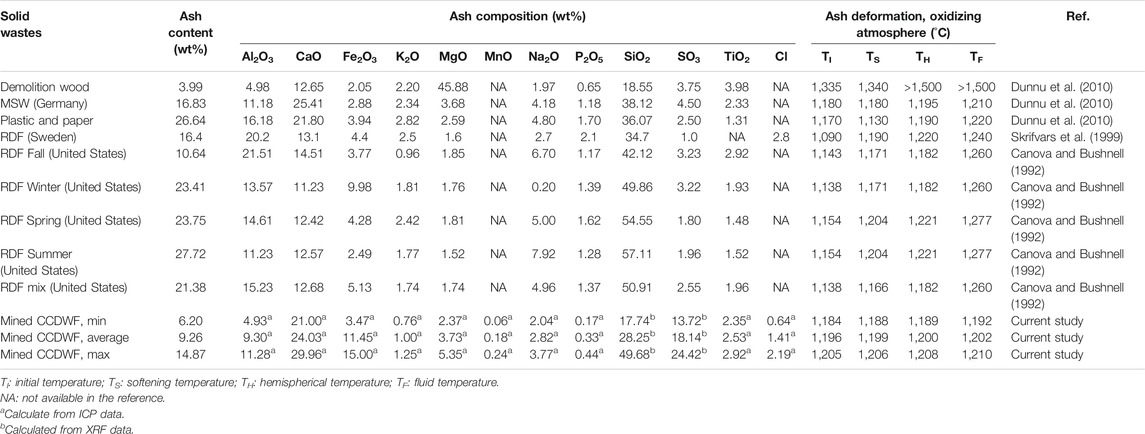
TABLE 8. Ash composition and fusibility of selected solid wastes.
Reactivity
Thermogravimetric data were differentiated, smoothed, and normalized by the reactive sample mass to produce comparable conversion rates. Figure 9 shows the conversion rate curves of three CCDWDF samples, one construction wood, CCA wood, and Douglas fir under reducing (Figure 9A) and oxidizing (Figure 9B) atmospheres (isothermal drying at 105°C is not included in the figure). The CCDWDF samples selected in this experiment are #190312, #190815, and #181227, which have the lowest, medium, and highest ash contents, respectively.
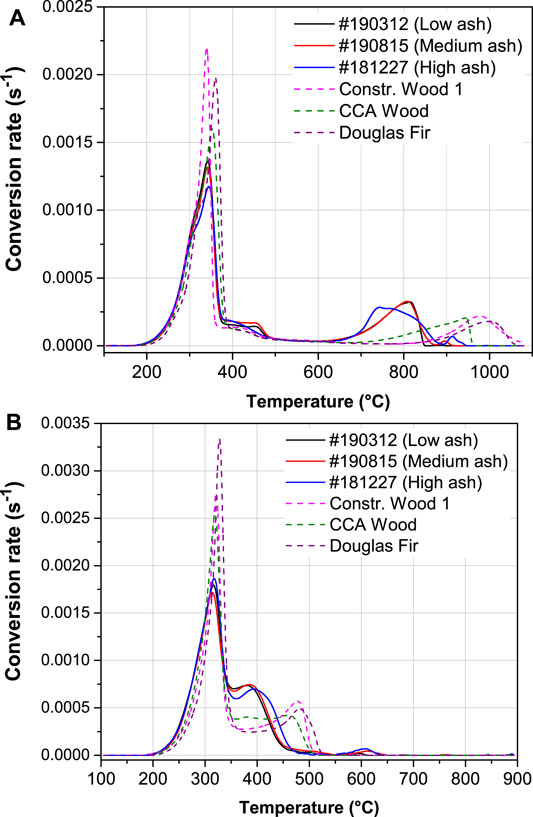
FIGURE 9. Reactivity of CCDWDF materials in (A) reducing and (B) oxidizing atmospheres.
The initial devolatilization of the samples peaked at 340–360°C in reducing atmosphere and 315–330°C in oxidizing atmosphere. Note the reactivity of the sample groups are different in this stage: the CCDWDF materials always have lower reactivity than the reference woods in both atmospheres, stemming from their lower volatile matter contents (see Table 3). As expected, the conversion rates of the samples in reducing atmosphere are lower than those in oxidizing atmosphere.
The conversion at 400–500°C in Figure 9A shows a broader and protracted peak for the CCDWDF materials that may indicate higher lignin content resulting from biodegradation while landfilled or the presence of non-biomass polymer content.
The char gasification of the CCDWDFs occurred earlier (initiated at approximately 600°C, peaking at 740–810°C, and ending at ∼950°C) than that of the reference wood samples (initiated at approximately 700°C, peaking at 950–1,010°C, ending at ∼1,080°C) (Figure 9A). The reactivity of the CCDWDF samples during the gasification stage is higher than that of reference wood samples.
The conversion of the CCDWDF samples immediately following devolatilization, peaked at 380–390°C, and ended at ∼550°C. The combustion of the reference woods occurred at higher temperatures than that of the CCDWDFs, peaked at 450–480°C, and also ended at ∼550°C. The lower reaction temperatures and higher combustion rates of the CCDWDFs compared to those of reference wood samples may indicate catalytic activity of the elements (e.g., K) present in the elevated ash content.
Besides the main gasification and combustion peaks, the CCDWDFs also have small peaks at 895–915°C (in reducing atmosphere) and 595–615°C (in oxidizing atmosphere), which do not exist in the curves of the reference woods. These peaks likely result from reactions of ash elements at high temperatures, considering the significantly high ash contents of CCDWDF samples.
The thermogravimetric analysis reveals that the CCDWDFs are not reactive at temperatures higher than 950°C in reducing atmosphere and 650°C in oxidizing atmosphere because only ash remains at this temperature. Initial ash deformation temperatures for all CCDWDF samples are higher than 1,100°C (Table 6) under both reducing and oxidizing environments indicating that ash-related problems (e.g., agglomeration and slagging) associated with the thermochemical conversions of CCDWDFs may be reduced.
Conclusion
Results from the fuel analyses indicate that the CDWDF materials have a wide range of non-combustible fractions that should be removed prior to thermochemical applications. The appearance of the CCDWDF materials and their physical properties are similar to those of woody biomass and wood chip fuels. The bulk density of CCDWDF materials are in the same common range as other wood chips. Similarly, the CCDWDF materials have the proximate and ultimate compositions comparable to other reference woods. However, the ash contents of the CCDWDFs are significantly higher than those of the reference woods. On the van Krevelen diagram, the CCDWDF materials lie closer to the coal region than Douglas fir and eucalyptus. The HHVs (on dry basis) of CCDWDFs are comparable to woody biomass (Douglas fir and eucalyptus) but lower than those of the reference construction wood samples.
The ash fusion temperatures of the selected CCDWDF materials show a marginal variation among the samples. The CCDWDFs have lower reactivity than the reference woods in the devolatilization stage (in both reducing and oxidizing atmospheres), but higher reactivity in the gasification and combustion stages. In addition, the gasification and combustion of the CCDWDF samples occurred earlier, at lower temperatures, than the reference wood samples. The thermogravimetric analysis shows that the CCDWDF materials are reduced to ash and have virtually no reactivity at temperatures higher than 950°C in reducing atmosphere and 650°C in oxidizing atmosphere. Ash melting begins at temperatures higher than 1,100°C. These characteristics may reduce the ash-related problems of these CCDWDFs in thermochemical conversion systems.
Mineral elemental analysis reveals that the CCDWDF includes material from various sources; gypsum, plastic, rust, paint, paint additives, and soils. In addition, the CCDWDF sample collected from trucks had much higher concentrations of calcium, sulfur, chromium, and zinc which may come from gypsum, paint, and paint additives. Analysis reveals that certain elements (Ca, Cu, Fe, K, Mn, Pb, and Zn) were present in soil recovered from the landfill. A comparison of elemental data confirms that the ICP-OES can quantify trace elements at lower concentrations than the XRF. Measured concentrations of abundant elements in the XRF data are higher (with few exceptions) than those from the ICP-OES measurement. The reduced sample preparation required for XRF analysis compared to ICP can reduce analysis time making XRF a potential screening tool for fuels management.
In summary, CCDWDF has potential use in the production of SAF, other bio-based fuels, or electric power. Nevertheless, more study is recommended to understand the fates of mineral elements during thermochemical conversion of CCDWDF materials. In addition, a better understanding of the relationship between the mineral composition and the ash fusion temperatures of the CCDWDF materials warrant further analysis.
Data Availability Statement
The original contributions presented in the study are included in the article/Supplementary Material, further inquiries can be directed to the corresponding author.
Author Contributions
Q-VB and ST collected and pre-processed the materials. Q-VB and JF characterized the fuels. Q-VB prepared the first draft of the manuscript, ST and JF revised and improved the manuscript. ST acquired funding and supervised this work.
Funding
This research was funded in part by the U.S. Federal Aviation Administration Office of Environment and Energy through ASCENT, the FAA Center of Excellence for Alternative Jet Fuels and the Environment, Project 001 through FAA Award Number 13-C-AJFE-UH under the supervision of James Hileman and Nathan Brown. Funding was also provided by Hawaii’s Environmental Response, Energy, and Food Security Tax (HRS Section 243-3.5 “Barrel Tax”) through the Hawaii Natural Energy Institute’s Energy Systems Development Special Fund and the Office of Naval Research, Asia Pacific Regional Energy System Assessment Program, (Award No. N0014-17-1-2923). Any opinions, findings, conclusions or recommendations expressed in this material are those of the authors and do not necessarily reflect the views of the FAA.
Conflict of Interest
The authors declare that the research was conducted in the absence of any commercial or financial relationships that could be construed as a potential conflict of interest.
Publisher’s Note
All claims expressed in this article are solely those of the authors and do not necessarily represent those of their affiliated organizations, or those of the publisher, the editors and the reviewers. Any product that may be evaluated in this article, or claim that may be made by its manufacturer, is not guaranteed or endorsed by the publisher.
Acknowledgments
The authors would like to thank: Dr. Kristin C. Lewis (U.S. Dept. of Transportation, Volpe Center) for her thorough review of the manuscript prior to submission and her suggestions for improvement; Sohrab Haghighi Mood (Washington State University) for his help with thermogravimetric analyses of CCDWDF and reference wood samples; Steve Joseph, Billy Lyon, and the management of PVT Land Company Ltd. for guidance, access, and support.
Supplementary Material
The Supplementary Material for this article can be found online at: https://www.frontiersin.org/articles/10.3389/fenrg.2021.711808/full#supplementary-material
References
Aldaood, A., Bouasker, M., and Al-Mukhtar, M. (2015). Effect of Long-Term Soaking and Leaching on the Behaviour of Lime-Stabilised Gypseous Soil. Int. J. Pavement Eng. 16 (1), 11–26. doi:10.1080/10298436.2014.893329
Ansah, E., Wang, L., and Shahbazi, A. (2016). Thermogravimetric and Calorimetric Characteristics during Co-pyrolysis of Municipal Solid Waste Components. Waste Management 56, 196–206. doi:10.1016/j.wasman.2016.06.015
ASTM (2018a). ASTM D4239-18e1, Standard Test Method for Sulfur in the Analysis Sample of Coal and Coke Using High-Temperature Tube Furnace Combustion. West Conshohocken, PA: ASTM International. Available at: www.astm.org.
ASTM (2016a). ASTM D5373-16, Standard Test Methods for Determination of Carbon, Hydrogen and Nitrogen in Analysis Samples of Coal and Carbon in Analysis Samples of Coal and Coke. West Conshohocken, PA: ASTM International. Available at: www.astm.org.
ASTM (2008). ASTM D7348-08, Standard Test Methods for Loss on Ignition (LOI) of Solid Combustion Residues. West Conshohocken, PA: ASTM International. Available at: www.astm.org.
ASTM (2020). ASTM D7566-20c, Standard Specification for Aviation Turbine Fuel Containing Synthesized Hydrocarbons. West Conshohocken, PA: ASTM International. Available at: www.astm.org.
ASTM (2015a). ASTM D7582-15, Standard Test Methods for Proximate Analysis of Coal and Coke by Macro Thermogravimetric Analysis. West Conshohocken, PA: ASTM International. Available at: www.astm.org.
ASTM (2016c). Practice for Fusibility of Refuse-Derived Fuel (RDF) Ash. West Conshohocken, PA: ASTM International. Available at: www.astm.org.
ASTM (2015b). Standard Practice for Preparation of Biomass for Compositional Analysis. West Conshohocken, PA: ASTM International. Available at: www.astm.org.
ASTM (2013b). Standard Test Method for Bulk Density of Densified Particulate Biomass Fuels. West Conshohocken, PA: ASTM International. Available at: www.astm.org.
ASTM (2016b). Standard Test Method for Calculating Refuse-Derived Fuel Analysis Data from As-Determined to Different Bases. West Conshohocken, PA: ASTM International. Available at: www.astm.org.
ASTM (2018b). Standard Test Method for Heat of Combustion of Liquid Hydrocarbon Fuels by Bomb Calorimeter (Precision Method). West Conshohocken, PA: ASTM International. Available at: www.astm.org.
ASTM (2013a). Standard Test Method for Moisture Analysis of Particulate Wood Fuels. West Conshohocken, PA: ASTM International. Available at: www.astm.org.
Bach, Q.-V., Sillero, M. V., Tran, K.-Q., and Skjermo, J. (2014). Fast Hydrothermal Liquefaction of a Norwegian Macro-Alga: Screening Tests. Algal Res. 6 (0), 271–276. doi:10.1016/j.algal.2014.05.009
Bassani, M., Tefa, L., Russo, A., and Palmero, P. (2019). Alkali-activation of Recycled Construction and Demolition Waste Aggregate with No Added Binder. Construction Building Mater. 205, 398–413. doi:10.1016/j.conbuildmat.2019.02.031
Bosmans, A., Vanderreydt, I., Geysen, D., and Helsen, L. (2013). The Crucial Role of Waste-To-Energy Technologies in Enhanced Landfill Mining: a Technology Review. J. Clean. Prod. 55, 10–23. doi:10.1016/j.jclepro.2012.05.032
Canova, J. H., and Bushnell, D. J. (1992). “Testing and Evaluating the Combustion Characterictics of Densified RDF and Mixed Paper,” in Energy from Biomass and Wastes XVI. Institite of Gas Technology). Editor D. L. Klass.
Chadwick, O. A., Derry, L. A., Bern, C. R., and Vitousek, P. M. (2009). Changing Sources of Strontium to Soils and Ecosystems across the Hawaiian Islands. Chem. Geology. 267 (1), 64–76. doi:10.1016/j.chemgeo.2009.01.009
Chen, M., Yu, D., and Wei, Y. (2015). Evaluation on Ash Fusion Behavior of eucalyptus Bark/lignite Blends. Powder Technology 286, 39–47. doi:10.1016/j.powtec.2015.07.043
Chojnacka, K., Samoraj, M., Tuhy, Ł., Michalak, I., Mironiuk, M., and Mikulewicz, M. (2018). Using XRF and ICP-OES in Biosorption Studies. Molecules 23 (8), 2076. doi:10.3390/molecules23082076
Clark, C., Jambeck, J., and Townsend, T. (2006). A Review of Construction and Demolition Debris Regulations in the United States. Crit. Rev. Environ. Sci. Technology 36 (2), 141–186. doi:10.1080/10643380500531197
Cristelo, N., Fernández-Jiménez, A., Vieira, C., Miranda, T., and Palomo, Á. (2018). Stabilisation of Construction and Demolition Waste with a High Fines Content Using Alkali Activated Fly Ash. Construction Building Mater. 170, 26–39. doi:10.1016/j.conbuildmat.2018.03.057
Cui, H., and Turn, S. (2018). Fuel Properties and Steam Reactivity of Solid Waste Streams from Contingency Bases. Waste Management 78, 16–30. doi:10.1016/j.wasman.2018.05.023
Du, S., Yang, H., Qian, K., Wang, X., and Chen, H. (2014). Fusion and Transformation Properties of the Inorganic Components in Biomass Ash. Fuel 117, 1281–1287. doi:10.1016/j.fuel.2013.07.085
Dunnu, G., Maier, J., and Scheffknecht, G. (2010). Ash Fusibility and Compositional Data of Solid Recovered Fuels. Fuel 89 (7), 1534–1540. doi:10.1016/j.fuel.2009.09.008
Edo, M., Ortuño, N., Persson, P.-E., Conesa, J. A., and Jansson, S. (2018). Emissions of Toxic Pollutants from Co-combustion of Demolition and Construction wood and Household Waste Fuel Blends. Chemosphere 203, 506–513. doi:10.1016/j.chemosphere.2018.03.203
Eisenbies, M. H., Volk, T. A., Therasme, O., and Hallen, K. (2019). Three Bulk Density Measurement Methods Provide Different Results for Commercial Scale Harvests of Willow Biomass Chips. Biomass and Bioenergy 124, 64–73. doi:10.1016/j.biombioe.2019.03.015
Esakku, S., Selvam, A., Joseph, K., and Palanivelu, K. (2005). Assessment of Heavy Metal Species in Decomposed Municipal Solid Waste. Chem. Speciation Bioavailability 17 (3), 95–102. doi:10.3184/095422905782774883
Fernández Llorente, M. J., and Carrasco García, J. E. (2005). Comparing Methods for Predicting the Sintering of Biomass Ash in Combustion. Fuel 84 (14), 1893–1900. doi:10.1016/j.fuel.2005.04.010
García López, C., Küppers, B., Clausen, A., and Pretz, T. (2018). Landfill Mining: A Case Study Regarding Sampling, Processing and Characterization of Excavated Waste from an Austrian Landfill. Detritus 2, 29–45. doi:10.31025/2611-4135/2018.13664
García-López, C., Ni, A., Parrodi, J. C. H., Küppers, B., Raulf, K., and Pretz, T. (2019). Characterization of Landfill Mining Material after Ballistic Separation to Evaluate Material and Energy Potential. Detritus 8, 5–23.
Giambelluca, T. W., Chen, Q., Frazier, A. G., Price, J. P., Chen, Y.-L., Chu, P.-S., et al. (2013). Online Rainfall Atlas of Hawai'i. Bull. Amer. Meteorol. Soc. 94 (3), 313–316. doi:10.1175/BAMS-D-11-00228.1
Giambelluca, T. W., Shuai, X., Barnes, M. L., Alliss, R. J., Longman, R. J., Miura, T., et al. (2014). Evapotranspiration of Hawai‘i. Final Report Submitted to the U.S. Army Corps of Engineers—Honolulu District, and the Commission on Water Resource Management, State of Hawai‘i.
Jagodzińska, K., Garcia Lopez, C., Yang, W., Jönsson, P. G., Pretz, T., and Raulf, K. (2021). Characterisation of Excavated Landfill Waste Fractions to Evaluate the Energy Recovery Potential Using Py-GC/MS and ICP Techniques. Resour. Conservation Recycling 168, 105446. doi:10.1016/j.resconrec.2021.105446
Jain, P., Kim, H., and Townsend, T. G. (2005). Heavy Metal Content in Soil Reclaimed from a Municipal Solid Waste Landfill. Waste Management 25 (1), 25–35. doi:10.1016/j.wasman.2004.08.009
Jain, P., Townsend, T. G., and Johnson, P. (2013). Case Study of Landfill Reclamation at a Florida Landfill Site. Waste Management 33 (1), 109–116. doi:10.1016/j.wasman.2012.09.011
Krook, J., Svensson, N., and Eklund, M. (2012). Landfill Mining: A Critical Review of Two Decades of Research. Waste Management 32 (3), 513–520. doi:10.1016/j.wasman.2011.10.015
Lawson, N., Douglas, I., Garvin, S., McGrath, C., Manning, D., and Vetterlein, J. (2001). Recycling Construction and Demolition Wastes - a UK Perspective. Env Mgtt and Health 12 (2), 146–157. doi:10.1108/09566160110389898
Littlejohns, J. V., Butler, J., Luque, L., and Austin, K. (2020). Experimental Investigation of Bioenergy Production from Small-Scale Gasification of Landfill-Diverted Wood Wastes. Waste Biomass Valor. 11 (12), 6885–6901. doi:10.1007/s12649-020-00940-7
Ma, Z., Ye, J., Zhao, C., and Zhang, Q. (2015). Gasification of rice Husk in a Downdraft Gasifier: The Effect of Equivalence Ratio on the Gasification Performance, Properties, and Utilization Analysis of Byproducts of Char and Tar. BioResorces 10 (2), 2888–2902. doi:10.15376/biores.10.2.2888-2902
McComb, J. Q., Rogers, C., Han, F. X., and Tchounwou, P. B. (2014). Rapid Screening of Heavy Metals and Trace Elements in Environmental Samples Using Portable X-Ray Fluorescence Spectrometer, A Comparative Study. Water Air Soil Pollut. 225 (12), 2169. doi:10.1007/s11270-014-2169-5
Morgan, T. J., Andersen, L. K., Turn, S. Q., Cui, H., and Li, D. (2017). XRF Analysis of Water Pretreated/Leached Banagrass to Determine the Effect of Temperature, Time, and Particle Size on the Removal of Inorganic Elements. Energy Fuels 31 (8), 8245–8255. doi:10.1021/acs.energyfuels.7b01135
Nordi, G. H., Palacios-Bereche, R., Gallego, A. G., and Nebra, S. A. (2017). Electricity Production from Municipal Solid Waste in Brazil. Waste Manag. Res. 35 (7), 709–720. doi:10.1177/0734242X17705721
Olesik, J. W. (1991). Elemental Analysis Using ICP-OES and ICP/MS. Anal. Chem. 63 (1), 12A–21A. doi:10.1021/ac00001a00110.1021/ac00001a711
Palha, F., Pereira, A., de Brito, J., and Silvestre, J. D. (2012). Effect of Water on the Degradation of Gypsum Plaster Coatings: Inspection, Diagnosis, and Repair. J. Perform. Constr. Facil. 26 (4), 424–432. doi:10.1061/(ASCE)CF.1943-5509.0000258
Passos, J., Alves, O., and Brito, P. (2020). Management of Municipal and Construction and Demolition Wastes in Portugal: Future Perspectives through Gasification for Energetic Valorisation. Int. J. Environ. Sci. Technol. 17 (5), 2907–2926. doi:10.1007/s13762-020-02656-6
Peres, S., Loureiro, E., Santos, H., Vanderley e Silva, F., and Gusmao, A. (2020). The Production of Gaseous Biofuels Using Biomass Waste from Construction Sites in Recife, Brazil. Processes 8 (4), 457. doi:10.3390/pr8040457
Powell, J. T., Pons, J. C., and Chertow, M. (2016). Waste Informatics: Establishing Characteristics of Contemporary U.S. Landfill Quantities and Practices. Environ. Sci. Technol. 50 (20), 10877–10884. doi:10.1021/acs.est.6b02848
Ragland, K. W., Aerts, D. J., and Baker, A. J. (1991). Properties of wood for Combustion Analysis. Bioresour. Technology 37 (2), 161–168. doi:10.1016/0960-8524(91)90205-X
Rodríguez-Robles, D., García-González, J., Juan-Valdés, A., Morán-del Pozo, J. M., and Guerra-Romero, M. I. (2015). Overview Regarding Construction and Demolition Waste in Spain. Environ. Technology 36 (23), 3060–3070. doi:10.1080/09593330.2014.957247
Roussat, N., Méhu, J., Abdelghafour, M., and Brula, P. (2008). Leaching Behaviour of Hazardous Demolition Waste. Waste Management 28 (11), 2032–2040. doi:10.1016/j.wasman.2007.10.019
Sadek, D. M. (2012). Physico-mechanical Properties of Solid Cement Bricks Containing Recycled Aggregates. J. Adv. Res. 3 (3), 253–260. doi:10.1016/j.jare.2011.08.001
Safiuddin, M., Alengaram, U. J., Rahman, M. M., Salam, M. A., and Jumaat, M. Z. (2013). Use of Recycled concrete Aggregate in concrete: a Review. J. Civil Eng. Management 19 (6), 796–810. doi:10.3846/13923730.2013.799093
Shahabuddin, M., Alam, M. T., Krishna, B. B., Bhaskar, T., and Perkins, G. (2020). A Review on the Production of Renewable Aviation Fuels from the Gasification of Biomass and Residual Wastes. Bioresour. Technology 312, 123596. doi:10.1016/j.biortech.2020.123596
Skrifvars, B.-J., Öhman, M., Nordin, A., and Hupa, M. (1999). Predicting Bed Agglomeration Tendencies for Biomass Fuels Fired in FBC Boilers: A Comparison of Three Different Prediction Methods. Energy Fuels 13 (2), 359–363. doi:10.1021/ef980045+
Skrifvars, B.-J., Yrjas, P., Kinni, J., Siefen, P., and Hupa, M. (2005). The Fouling Behavior of Rice Husk Ash in Fluidized-Bed Combustion. 1. Fuel Characteristics. Energy Fuels 19 (4), 1503–1511. doi:10.1021/ef049714b
Song, Y., Wang, Y., Liu, F., and Zhang, Y. (2017). Development of a Hybrid Model to Predict Construction and Demolition Waste: China as a Case Study. Waste Management 59, 350–361. doi:10.1016/j.wasman.2016.10.009
Thompson, A., Rancourt, D. G., Chadwick, O. A., and Chorover, J. (2011). Iron Solid-phase Differentiation along a Redox Gradient in Basaltic Soils. Geochimica et Cosmochimica Acta 75 (1), 119–133. doi:10.1016/j.gca.2010.10.005
US EPA (2017). Advancing Sustainable Materials Management. Washington, DC: U.S. Environmental Protection Agency: 2017 Fact Sheet.
US EPA (1996). Method 3050B: Acid Digestion of Sediments, Sludges, and Soils, Revision 2. Washington, DC.
Usda-Nrcs, (2011). National Cooperative Soil Survey Soil Characterization Database. Soil Survey Laboratory, National Soil Survey Center. U.S Department of Agriculture (USDA). Lincoln, Nebraska: Natural Resources Conservation Services NRCS. Available at: http://ssldata.srsc.usda.gov/.
Vainikka, P., and Hupa, M. (2012). Review on Bromine in Solid Fuels - Part 2: Anthropogenic Occurrence. Fuel 94, 34–51. doi:10.1016/j.fuel.2011.11.021
van der Zee, D. J., Achterkamp, M. C., and de Visser, B. J. (2004). Assessing the Market Opportunities of Landfill Mining. Waste Management 24 (8), 795–804. doi:10.1016/j.wasman.2004.05.004
Vassilev, S. V., Baxter, D., Andersen, L. K., Vassileva, C. G., and Morgan, T. J. (2012). An Overview of the Organic and Inorganic Phase Composition of Biomass. Fuel 94, 1–33. doi:10.1016/j.fuel.2011.09.030
Wu, Z., Yu, A. T. W., Shen, L., and Liu, G. (2014). Quantifying Construction and Demolition Waste: An Analytical Review. Waste Management 34 (9), 1683–1692. doi:10.1016/j.wasman.2014.05.010
Keywords: construction and demolition waste (C & D waste), sustainable aviation fuels (SAF), fuel properties, proximate analysis, ultimate analysis, heating value, mineral composition
Citation: Bach Q-V, Fu J and Turn S (2021) Construction and Demolition Waste-Derived Feedstock: Fuel Characterization of a Potential Resource for Sustainable Aviation Fuels Production. Front. Energy Res. 9:711808. doi: 10.3389/fenrg.2021.711808
Received: 19 May 2021; Accepted: 25 October 2021;
Published: 16 November 2021.
Edited by:
Zia Haq, United States Department of Energy (DOE), United StatesReviewed by:
Jean-Henry Ferrasse, Aix-Marseille Université, FranceSalmiaton Ali, Universiti Putra Malaysia, Malaysia
Copyright © 2021 Bach, Fu and Turn. This is an open-access article distributed under the terms of the Creative Commons Attribution License (CC BY). The use, distribution or reproduction in other forums is permitted, provided the original author(s) and the copyright owner(s) are credited and that the original publication in this journal is cited, in accordance with accepted academic practice. No use, distribution or reproduction is permitted which does not comply with these terms.
*Correspondence: Quang-Vu Bach, cXZiYWNoQGhhd2FpaS5lZHU=