 Siddharth Jain
 Yashwant Sawle
- Department of Electrical Engineering, Vellore Institute of Technology, Vellore, India
Due to rising population growth and economic development, there is indeed a growing demand for electricity. Both in aspects of generation and transmission, conventional power firms are striving to manage these demands. Moreover, the ubiquitous utilization of electricity and other power generators, which are mainly driven from fossil fuels, seems to have some limitations, like declining performance and restricted energy production. As a result, use of renewable energy sources is incredibly important. Decentralized power generation in remote regions has become the primary requirement of society, based on renewable energy. Particularly in comparison with the electrification of urban areas, rural electrification is quite expensive. Microgrid’s development utilizing hybrid power is a potential solution for the electrification of rural regions where the transmission chain of network’s extension is unfeasible or inefficient. This research aims to structure a power generation model associated with different HRES combinations using a HOMER software application at a location in India. In the findings of this research, it has been observed that NPC, O&M, COEs, and RF of on-grid energy systems are better than off-grid energy systems. In the study, between eight hybrid system combinations, the lowest COE of 0.034 $/kWh is obtained with the PV-WT-MH-GRID-CT system in the on-grid scenario. This analysis shows NPC, COE, O&M, and renewable fraction are sensitive to the variation in all the considered sensitivity parameters1,2,3,4.
Introduction
Around 1.5 million people worldwide lack accessibility to electrical energy, and one of the world’s most prominent issues is to provide electricity to the population. Approximately 70,000 villages as well as 1.9 billion Indians often do not have reliable electricity. Due to electrical supply instability, multiple households connected to the grids are frequently witnessing power outages. Due to a lack production as well as an outdated transmission system, erratic voltage levels as well as unreliable power supply seem to be significant problems, contributing in recurrent power interruption. In India, nearly 30–50% of electricity is wasted throughout transmission and distribution, which would be exceptionally high as compared to other developed countries.
By 2040, the overall energy consumption will grow by 30%. Around 77% of energy output is generated from conventional energy sources dependent on carbon, which face many challenges and cause many problems. Rural electrification in developing nations aids in enhancing people’s standard of living. The commitment to achieving 100% electrification throughout the nation is due to both the transmission and distribution of power to less populated areas sited far from power generation plants. As a result, discovering a decentralised source of energy to provide power to such towns and villages is vital.
Environmentally sustainable renewables such as PV, FC, biogas, and MH seem to be the most increasing energy forms in developing a country with such a booming economy. In rural communities worldwide, the HES provides an appealing and realistic approach to solve energy needs. Such cost-driving variables do not influence non-conventional energy. Thus, efficient economic growth makes economic growth simpler when renewable energy is used, as energy costs decrease (Doll and Pachauri, 2010).
Even though renewable energy is currently quite expensive, it has become sufficiently effective to outperform non-renewable sources with experience accumulation. Even so, being used in a stand-alone system, the non-conventional sources of energy face a variety of restraints. Specifically, the power generated from WT and PV depends on environmental factors, whereas FC requires hydrogen-enriched fuel. The worldwide non-conventional energy scenario by 2040 is presented in Figure 1 (Panwar et al., 2011), (Sawle et al., 2017).
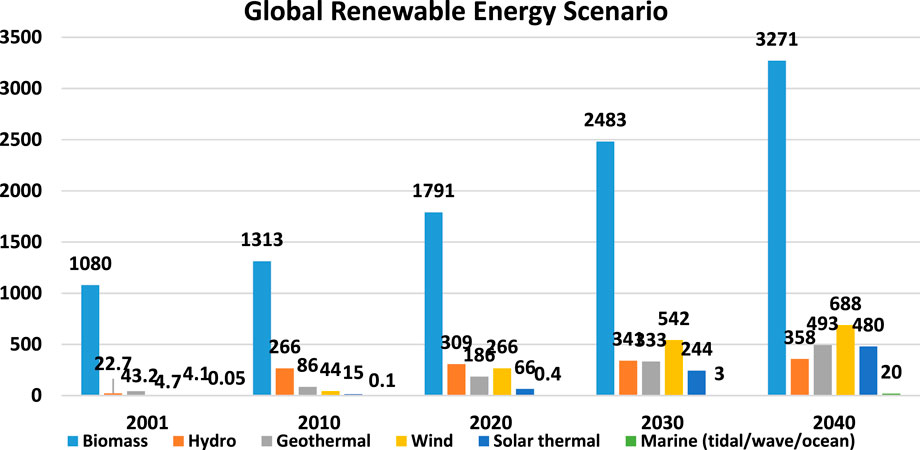
FIGURE 1. Global renewable energy scenario by 2040.
For future renewable sources, FC provides tremendous capability with many advantages, such as high performance, low emission, and dynamic design (Alam and Gao, 2007). Solar and wind energy resources integrate with several resources to overcome these challenges. An HRES is produced by generating more non-conventional resources. Micro grid would provide means of incorporating the generation of cleaner renewable power into the power network (Oulis Rousis et al., 2018), (Sawle et al., 2016).
A micro grid (MG) is indeed an embedded network of distributed generation including loads which operate a controllable grid within the prescribed electrical networks. For both the function of island as well as grid connection mode, the MG network could separate or connect from the grid during different periods. There are three fundamental criteria for the system: To begin, recognizing the distribution network of a particular MG from the other networks seems to be quite simple. Second, when compared to distant resources, MG resources can be regulated, and third, the MG system can function regardless of the size of the grid linked.
The benefits of the MG system are social, economic, environmental, and technological. MG design optimization is required to attain this. These advantages could be experienced by selecting the suitable MG network technology, grid configurations, load component size, and specifications. As a measure, in order to achieve optimal functionality, the system must have maximum energy efficiency storage units. Renewable energy sources are being used in the MG for energy stability as well as consistent power storage. Whenever the production of energy exceeds the consumption, energy is automatically stored.
The MG system can be reviewed and analysed by using a wide range of computer-aided design methods. HOMER, a well-known software design that enables different designs to be evaluated, is widely used during the economic power system model and the experimental study. For MG analysis and model, HOMER can function in three phases: optimization, simulation, and sensitivity analysis. HOMER has a high degree of precision in all three phases of the MG economic and technological study.
HOMER is used to evaluate the off-grid and on-grid electrification problems and build a realistic system for the area. The design of the model needs a keen understanding of the components employed, such as generators, turbines, etc. In other words, rather than people migrating to cities where electricity is accessible, electricity can migrate to remote locations. Engineers must develop hybrid renewable energy systems based on size and cost and optimize their remote region’s applications for electrification.
Much work was done on HRES architecture, using energy management as well as sizing techniques on HOMER software. Some of the research is displayed in Table 1. The main objective of this study is to simulate a microgrid using present MH, PV, wind, as well as DG at the site and conduct a cost optimization exploration to determine the finest microgrid based on the least NPC, COE, O&M, and RF percentage. The literature review makes clear that HRES is an energy source, which is cheaper as well as efficient versus traditional grid systems. Several research scientists have presented hybrid renewable energy systems in different configurations. Much research has still not been performed on the grid compared to Grid HRES, from the existing literature as well as gaps identified in the research. Various micro-grid networks, one interconnected as well as the other independent, are analysed from an economic perspective in this article. This analysis provides technological and economic viability for operation concepts. System efficiency is tested as well as contrasted through different HRES combinations for optimum NPC and COE minimum value configurations. The ideal framework is economically sustainable, has equal environmental advantages, has a reasonable payback period, and produces fewer emissions.
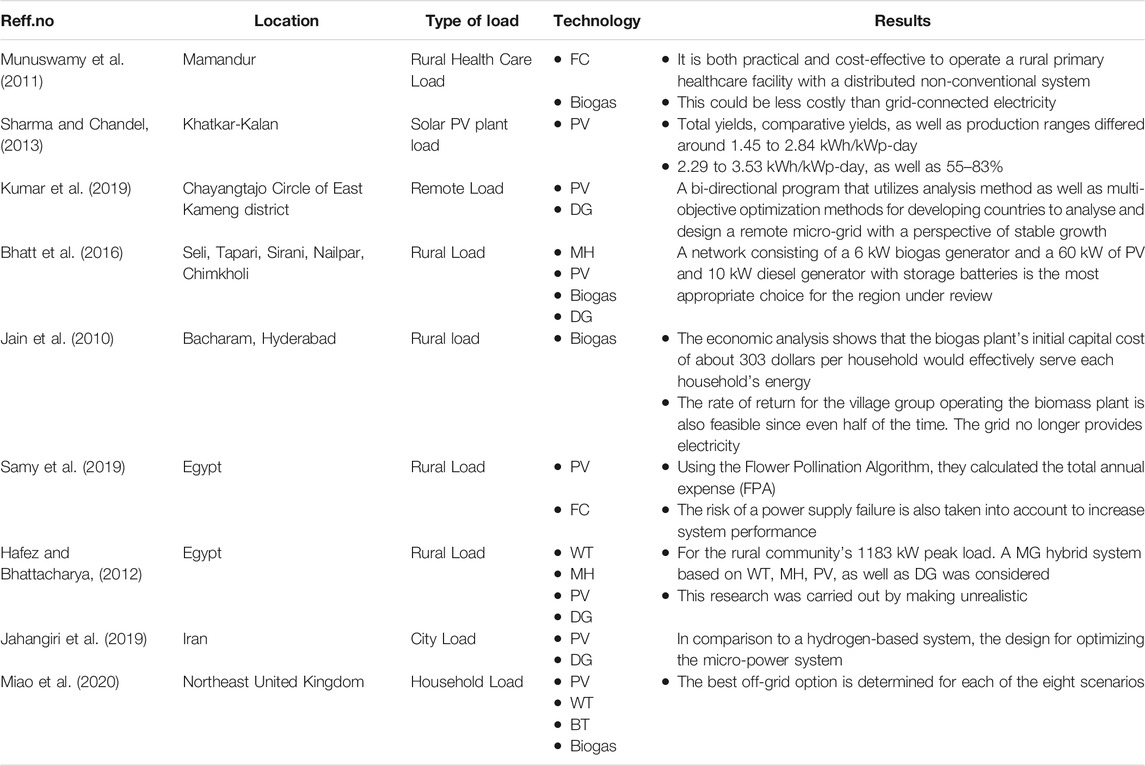
TABLE 1. Summary of literature review.
The following are the paper’s key contributions:
1. A novel hybrid renewable energy system (HRES) was designed to solve scale and cost optimization challenges in remote areas.
2. The hybrid renewable energy system’s COE, NPC, O&M, and RF percentage generation is kept to a minimum.
3. The proposed system provides fair environmental benefits, has a short payback period, and produces less pollution.
4. There is a comparison between on-grid vs off-grid models.
The following is the layout of this paper: Section II presents the methodology used in this study. Section III tells us about the resources used in this study. Section IV depicts the components used in this study and their mathematical modelling. Section V tells us about the system design and its costing. Simulation results and discussions are presented in Section VI. Sensitivity analysis results are presented in section VII. At last, conclusions are displayed in Section VIII.
Methodology
Supplementary Figure S1 shows the methods for incorporating the proposed HES into HOMER. The evaluation of the chosen site’s load profile is accompanied by the determination of solar and wind potential. After that, different components are used to design the system. The financial variables, along with component dimensioning, are incorporated. NPC, O&M, COE, and RF evaluates the overall simulated outcomes to conclude whether the chosen result meets the location target (Kansara and Parekh, 2011).
Case Study
In this study, the hybrid system is designed for the electrification of Bijolia town. The town is located on the southeast of Bhilwara (https://en.wikipedia.org/wiki/Bijolia). The territorial site of Bijolia is displayed in Supplementary Figure S2. Comprehensive data of the location is displayed in Supplementary Table S1.
Energy Demand Assessment
In order to determine electricity usage, the load demand (kW) along with the time (h) of the loading phase will be considered. Primary survey data were used to determine the village’s energy needs. Domestic, community, commercial, and rural enterprises are among the loads. Lighting, fans, televisions, mobile charging stations, and a water pump for drinking water are all part of the domestic load. Street lights in the village, fans in the community hall, and a device for the school are all part of the community load. When it comes to industrial loads, lighting is taken into account for shops in the village that work in the evening. The average load demand is 900 kW-h/day [(https://en.wikipedia.org/wiki/Bijolia)]. Figures 2A,B demonstrate daily as well as seasonal load profiles for the location.
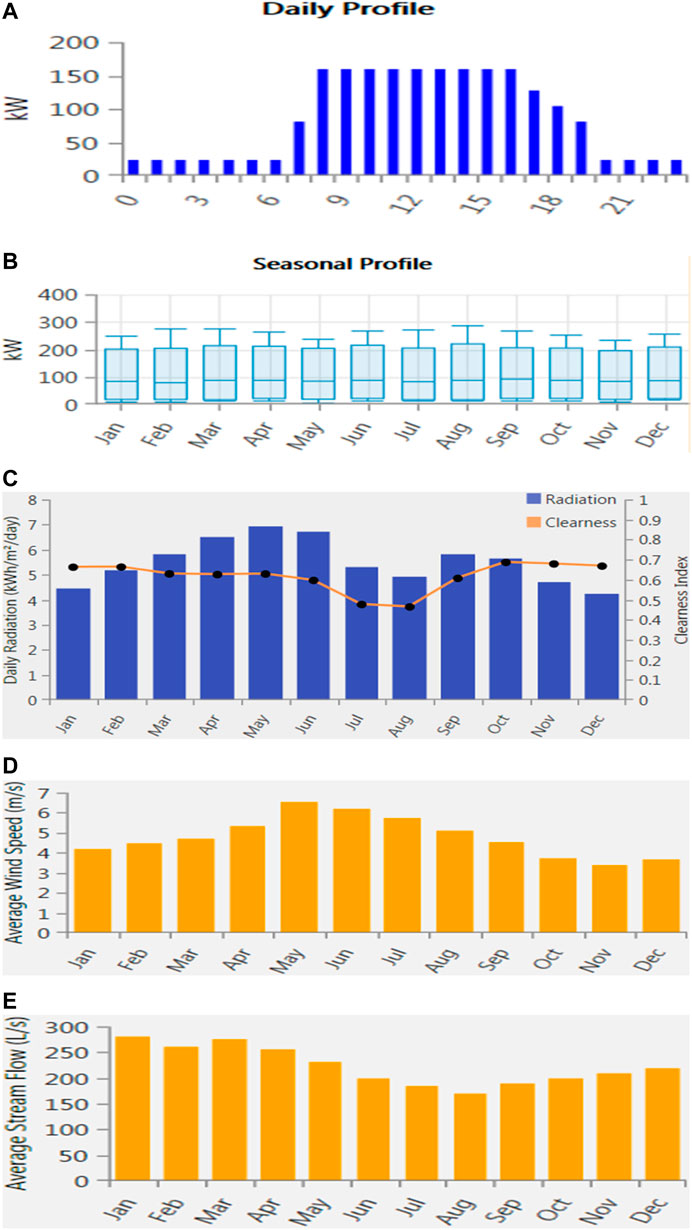
FIGURE 2. (A) Daily load profile. (B) Seasonal load profile. (C) Monthly average solar profile. (D) Monthly average wind profile. (E) Monthly average hydro profile.
Resource Assessment
Solar
In the environment, there is plenty of solar radiation. Solar radiation’s potential is determined by the position or area. The distributed production scheme is proposed for the Indian longitudes of 25°9′50′′N and 75°19′30′′E. The annual average solar radiation for the design site is 5.51 kW/m2 from the NASA resource website as shown in Figure 2C.
Wind
Wind energy is abundant in the architecture location of the distributed generation system (average annual resource of 4.80 m/s) from the NASA resource website as shown in Figure 2D. Other terms for the friction coefficient include Hellmann exponent, power-law exponent, and wind gradient. A number of variables, including wind speed, landscape irregularity, altitude above ground, local temperature, hourly data of the day, as well as the season of the year, affect the friction coefficient.
Micro Hydro
The Jawahar Sagar Dam is situated 29 km upstream of Kota. The Rana Pratap Sagar Dam is the third in a series of Chambal Valley Projects on the Chambal River. It is a 45-m-high, 393-m-long concrete gravity dam that produces 60 MW of electricity with three 33 MW units installed. The monthly water discharge is shown in Figure 2E. The yearly average is 222.92 L/s (https://energy.rajasthan. b).
Components and Mathematical Modelling
PV Array
The PV module that is in play here is the general flat-plate PV. The following equation can be used to approximate the PV array’s power output (Ramesh and Prasad Saini, 2020).
Where
Derating factor is used to scale down the power output of the PV array due to array soiling, wiring losses, shading, snow cover, aging, and other factors. The energy balance for the PV array can be determined using the equation above.
Where
The monthly average clearness index can be estimated by the following:
where K denotes the clearness index, the average radiation on the horizontal surface of the Earth (kW/m2/day) is denoted by
Wind Turbine
A wind turbine module can be described as a combination of a rotor with two or more blades in coaction with an electrical generator. This combination works when the wind’s kinetic energy can capture by the wind’s turbine and, in turn, produce electricity. Power generated by the wind turbine system can be expressed as (Ramesh and Prasad Saini, 2020):
In the above equation,
The key takeaways from the above equation are:
1. The output power of a wind generator is proportional to the area swept by the rotor, i.e., double the area swept by the rotor.
2. The power of the wind generator is proportional to the cube of the wind velocity.
The power equation in large-scale wind turbines where gearbox and generator efficiencies are not negligible anymore can be expressed as the following.
Where
Diesel Generator
The diesel generator uses a non-renewable resource (oil) to produce electricity. It can be used either as the main source or as a backup depending on the system. The amount of fuel required to produce electricity relies on factors like the fuel heat rate efficiency of the generator and the heat content of the fuel (Magarappanavar and Sreedhar, 2016), (Sawle et al., 2018c). The efficiency of the generator also depends on the load at the time.
Battery Module
Batteries are used to store electrical energy to be used during power surges and when other resources are unavailable. For the proposed system, a lead-acid type of battery has been used due to its low cost, high safety level, and recyclability. Lead-acid batteries are rechargeable (Krishan and Suhag, 2020), [ (Sawle and Gupta, 2018)]. A parallel combination of batteries of the same rating is used to achieve higher voltage and current values.
The capacity of the battery is expressed as
In the above expression, C (watt-hour) is the capacity of the battery, D is the daily autonomy of the battery,
Mathematically the battery model is expressed as:
Where E is the no-load voltage,
Converter
The converter is a system that converts alternating current to direct current and vice versa. In HOMER, we can use two types of converters, rotary type and solid-state type (Canales et al., 2017), [(Sawle and Gupta, 2015); (Sawle and Gupta, 2014)]. The size of the converter depends on the converter capacity.
Grid
You can set a constant power price and a sell-back price in Simple Rates mode. We may also determine whether or not to use net metering and set grid power pollution factors. Grid Power Price ($/kWh) is the rate of purchasing electricity from the grid, expressed in dollars per kilowatt-hour. System Sellback Price ($/kWh) is the rate at which the utility pays you for the electricity you sell to the grid in dollars per kilowatt-hour (www.homerenergy.com).
System Design and Its Details
The recommended Hybrid Energy System is incorporated into the software, as shown in Figure 3. Table 2 also includes a detailed overview of each variable.
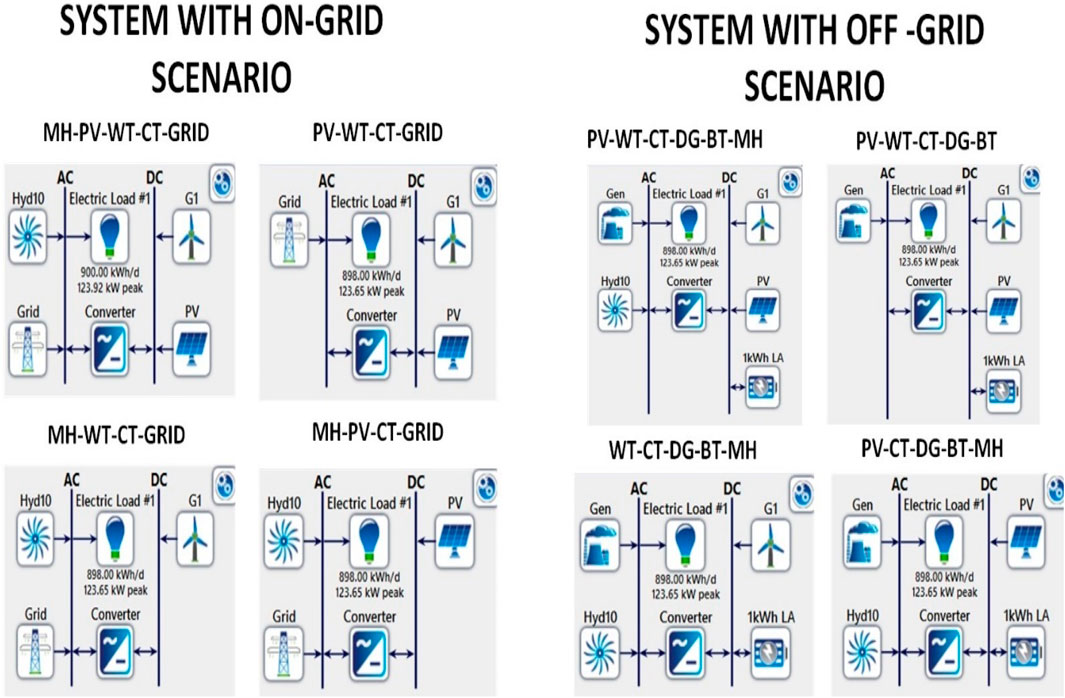
FIGURE 3. System design.
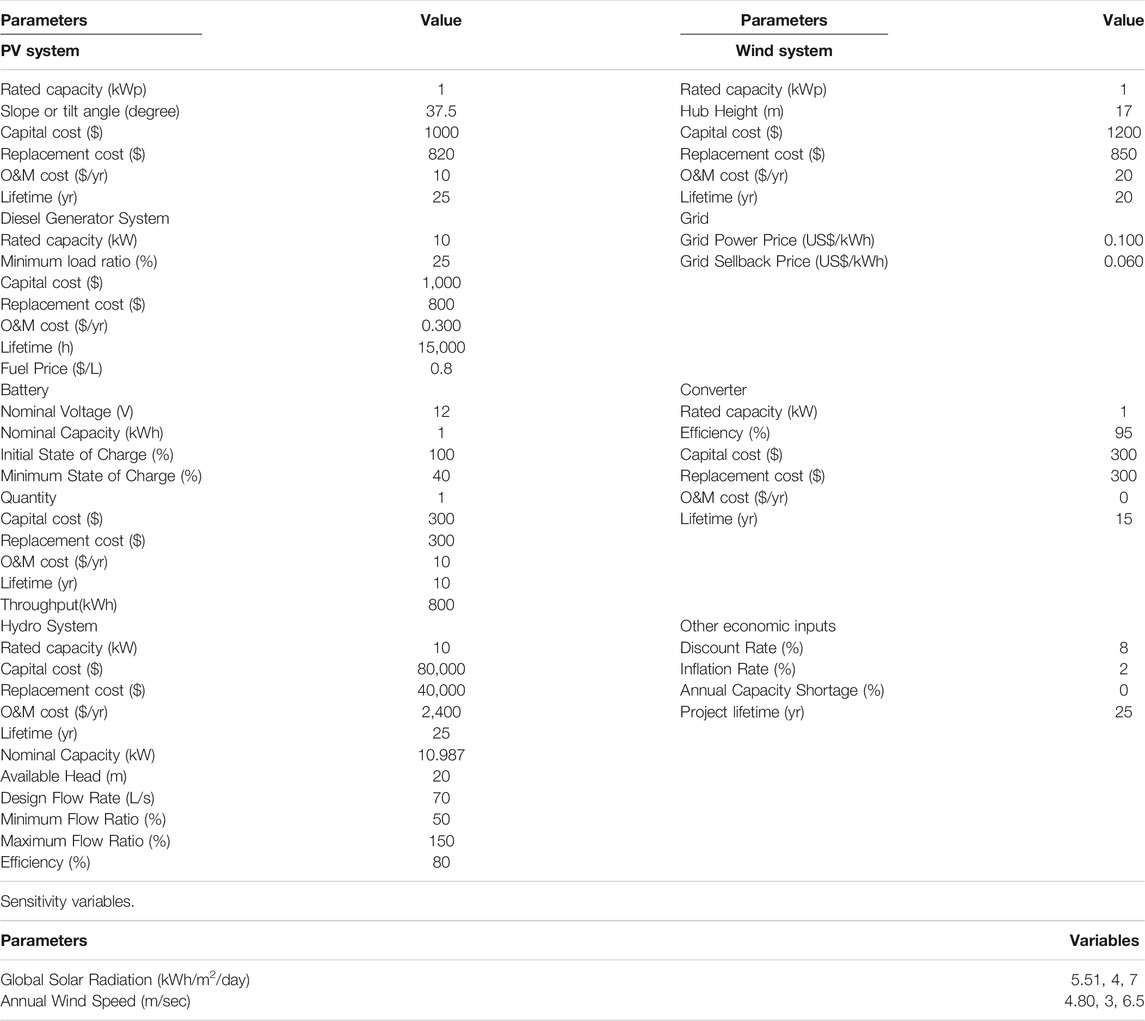
TABLE 2. System specifications.
Sensitivity Analysis
Sensitivity analysis investigates the impact of modifications in certain factors on the ideal system. Any numerical data provided into HOMER is refereed as a parameter. Any numerical data provided into HOMER is refereed as a parameter. The concept sensitivity variables are frequently used to refer to sensitivity analysis parameters. The developer inputs a set of values (sensitivity values) into HOMER for every sensitivity component. The primary sources of energy in the systems under study are wind turbines and solar arrays. As a result, sun radiation, wind speed, and fuel price can all have an impact on the best arrangement. Performing a sensitivity analysis that examined the impact of solar radiation, wind speed, as well as oil prices will provide insight into the role of HRESs in the sustainability of locations. A sensitivity analysis on the ideal system may reveal the importance of collecting these resources outside of the study area. All of these sensitivity factors and their related values are listed in Table 2.
Simulation Results and Discussion
Techno-economic Study Scenarios and Optimal Power Flow Study Cases
The research’s initial optimizing parameters continue as follows: Annual Average Electric Load Demand Measured is 900 kW-h/day. The annual average wind potential is 4.80 m/s, the annual average solar potential is 5.51 kW-h/m2/day, and annual average streamflow (L/second) is 222.92. The nominal Discount Rate is 8%, and project lifetime years are (Sawle et al., 2018b). In this research, a comparison is shown between on-grid vs off-grid HRES to find a cost-effective approach that will meet local load demand while also lowering cost variables (COE, NPC, and O&M) as well as emissions. HOMER runs 1,982,235 simulations in this study, with 13,512 simulation outcomes. Each system is rated based on its NPC, COE, O&M, and RF percentages, with the best system having the lowest NPC, COE, O&M, and RF percentages while emitting a fair amount of radiation.
Case A: - PV-WT-MH-GRID-CT.
Case B: - PV-WT-GRID-CT.
Case C: - WT-MH-GRID-CT.
Case D: - PV-MH-GRID-CT.
Case E: - PV-WT-MH-BT-CT-DG.
Case F: - PV-WT-BT-CT-DG.
Case G: - WT-MH-BT-CT-DG.
Case H: - PV-MH-BT-CT-DG.
HRES with On Grid Scenario
Table 3 displays the optimal findings of all HRES for the on-grid scenario in Bijolia, Rajasthan. Among four HRES configurations, PV-WT-MH-GRID-CT is the utmost reasonable system for on-grid scenarios in terms of NPC, COE, OC, and RF. The least economic configuration is PV-WT-GRID-CT for on-grid scenarios in terms of NPC, COE, OC, and RF.
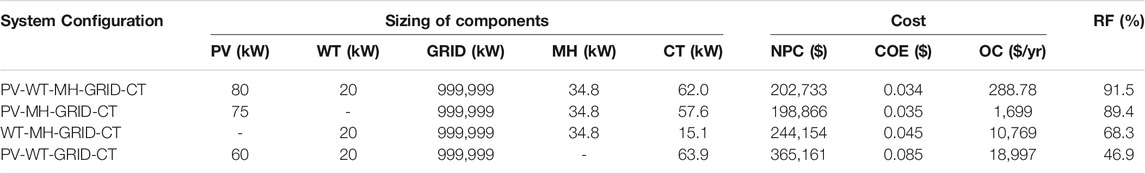
TABLE 3. Performance of optimized results of HRES for ON Grid Scenario.
In the on-grid scenario, the optimal PV-WT-MH-GRID-CT HRES configuration to supply load demand consists of a Photovoltaic of 80 kW, WT of 20 kW, a grid of 999,999 kW, Hydro of 34.8 kW, and 62.0 kW converter. The NPC, COE, OC, as well as RF of the PV-WT-MH-GRID-CT Hybrid Energy systems are $202,733, $0.034, $288.78, and 91.5%, respectively. However, the NPC of PV-MH-GRID-CT HRES configuration is less when compared to PV-WT-MH-GRID-CT HRES configuration, but COE, OC, and RF is more when compared to PV-MH-GRID-CT, as seen from Table 1. Therefore, that is why PV-WT-MH-GRID-CT is placed ahead of the PV-MH-GRID-CT configuration. Detail cost analysis of the optimal HRES configuration is shown in Table 3.
In essence, to the other HRES, grid factor has resulted in negative operational and maintenance costs, salvage as seen in Table 4, effectively denoting profits rather than expenditures, which may lead to quicker payback period.
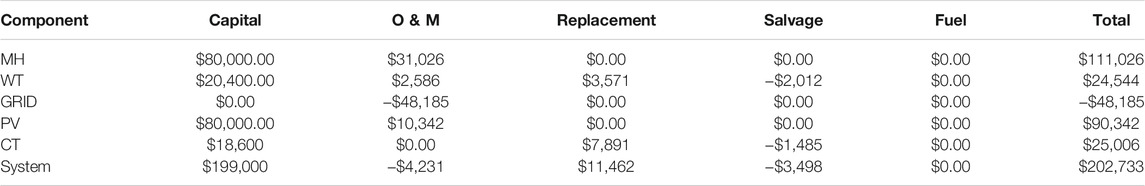
TABLE 4. Detail cost analysis of HRES.
Because of the high capital and operating costs of MH, the total cost of the system components resulted in a higher total cost of $111,026. WT and CT, on the other hand, have a low overall cost and are the cheapest components in HRES. Grid earns rather than expenses, which result in faster payback, as we could observe from Table 5 as grid purchase constitutes 8.28% when compared to grid sales which constitute 27.8% from Table 5. Therefore, the system earns money when it sells energy to the grid, which results in a faster payback period.
TABLE 5. Energy generation of the optimal HRES.
Table 5 displays the energy production of the HRES. Non-conventional energy sources are the primary sources of supply for 465,283 kWh/year.
We could observe from Table 5 that MH and PV produce most of the energy demand for the given load profile. Due to low wind speed at the selected location, the energy generated by wind is less when compared to other sources. The PV array generates 141,153 kWh annually, with 4400 operational hours annually, as well as a COE of $0.0495/kWh. The energy output of the wind turbine is 25,089 kWh per year, with 6,757 operating hours per year, and the COE is $0.0757 per kW-hour. The hydro energy production is 260,528 kWh/year, with 8760 h of operating hours annually as well as COE of $0.0330/kWh. The converter works for 7411 h a year. Figure 4 shows the monthly average electric share of each renewable source for an optimal HES strategy. In terms of energy usage, Table 5 shows that the best configuration plan meets 24-h load demand with no power shortage and backup surplus energy of 3,043 kWh/yr.
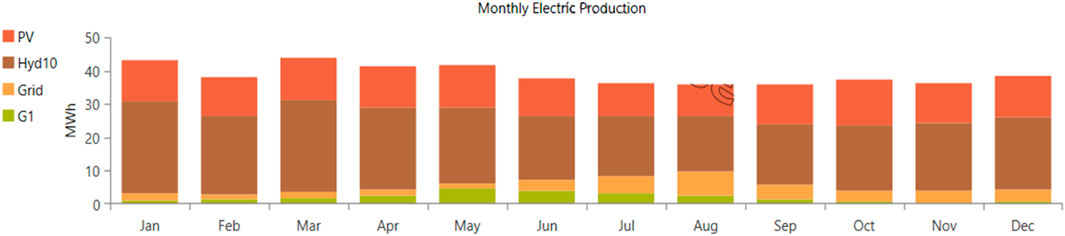
FIGURE 4. Monthly average electric production.
As seen from Table 5, the energy consumption from AC primary load is 327,770 kW-h/yr, which is 72.2% of total utilization. Energy consumption from Grid sales is 126,309 kWh/yr, which constitutes 27.8% of total consumption. The total energy consumption is 454,079 kWh/year. PV, wind turbine, micro-hydro, and system converter outputs of HRES with on-grid scenario are given in Table 6.
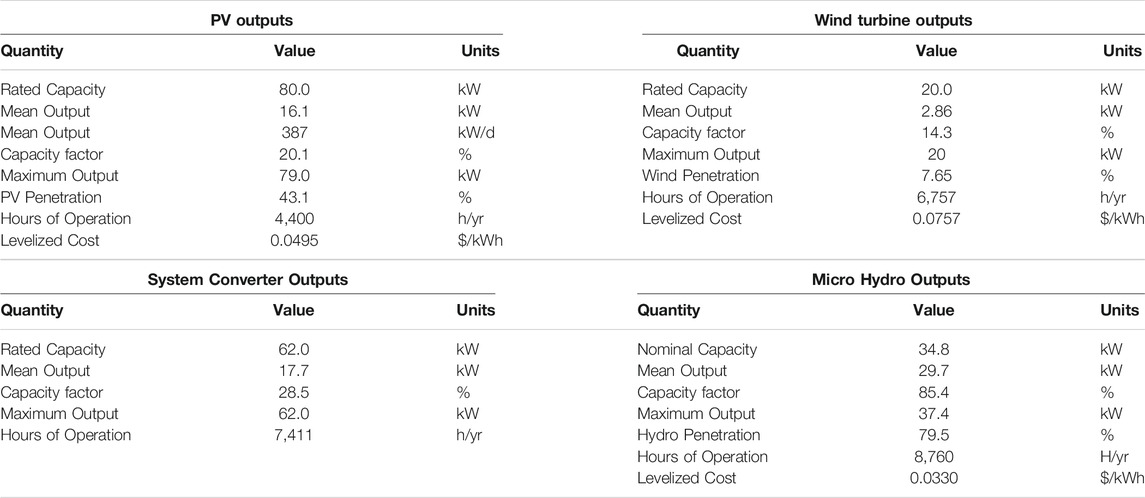
TABLE 6. PV, Wind turbine, Micro-hydro, and system converter outputs of HRES.
Table 7 shows the energy purchased (kWh) and energy sold (kWh) rates to the grid. Figure 5 depicts the on-line energy-scheduling system, which includes generation and load profiles for April 3. The critical review of Figure 5 shows a variety of promising possibilities for the proposed configuration plan. Solar energy generation is found to be possible, starting at 6:00 a.m. and ending at 18:00 p.m., with a high at 13:00 p.m. Since PV is not available before 06:00 and after 18:00, all load is supplied by MH. When compared to the other elements in the method, we can also see that WT only runs for a short period of time. Furthermore, surplus electricity is supplied to the grid, resulting in a quicker payback. The amount of energy purchased from the grid is minimal since PV and MH meet the majority of demand. Emissions produced by HRES are presented in Table 8.
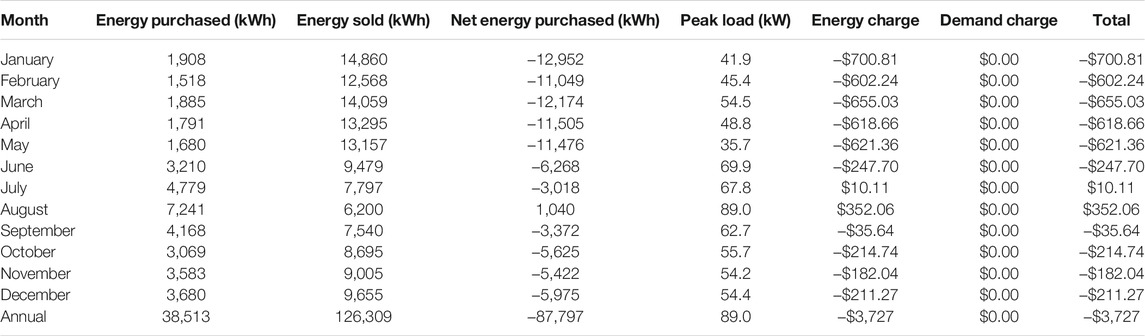
TABLE 7. Energy purchased (kWh) and energy sold (kWh) rates to Grid of HRES.
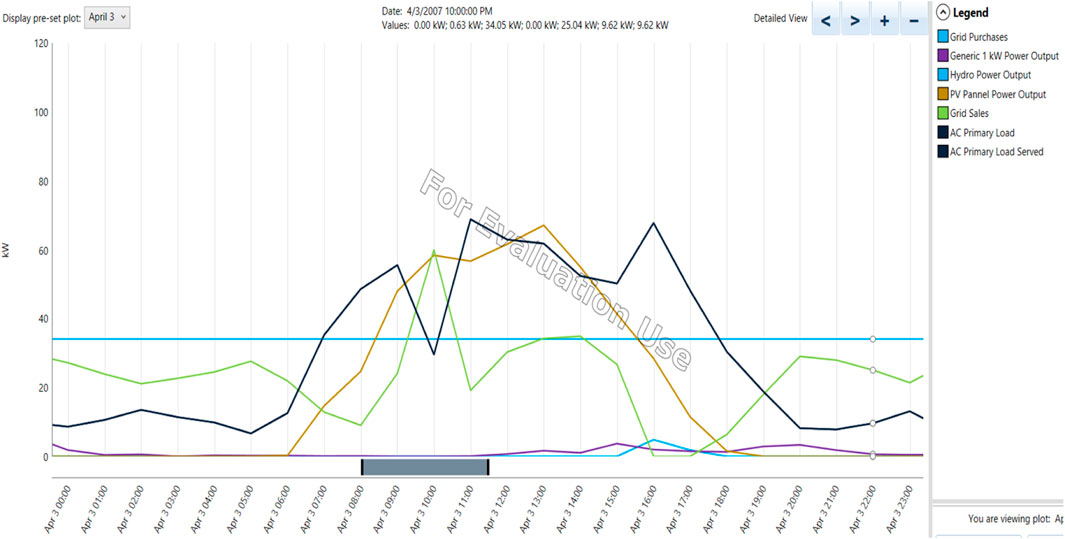
FIGURE 5. On-line energy scheduling for April 3.
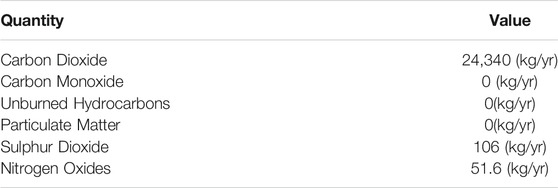
TABLE 8. Emissions produced by HRES.
HRES with Off Grid Scenario
Table 9 shows the optimal findings of all the HRES for off-grid scenario in Bijolia, Rajasthan. Among four HRES configurations, PV-WT-MH-BT-CT-DG is the utmost feasible configuration for an off-grid scenario in terms of NPC, COE, OC, and RF. The least economic configuration is PV-WT-BT-CT-DG for the off-grid scenario in terms of NPC, COE, OC, and RF. In the off-grid scenario, the optimal PV-WT-MH-BT-CT-DG HRES configuration to supply load demand consists of PV of 80 kW, Wind Mill of 20 kW, Diesel Generator of 140 kW, Hydro of 34.8 kW, 74.6 kW converter, and 257 kWh Battery. The NPC, COE, OC, and RF of the PV-WT-MH-BT-CT-DG HES are $612,748, $0.145, $20,334, and 95.5%. Detail cost analysis of the optimal HRES configuration is shown in Table 10.
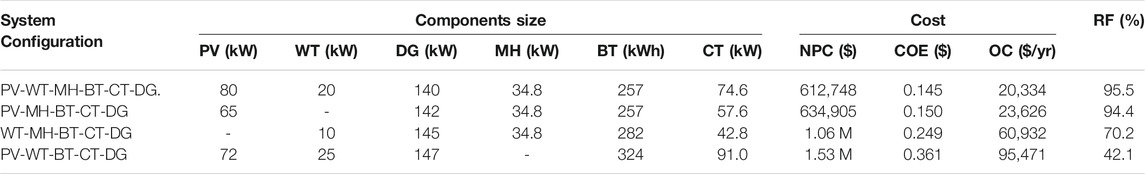
TABLE 9. Performance of optimized results of HRES for off Grid Scenario.
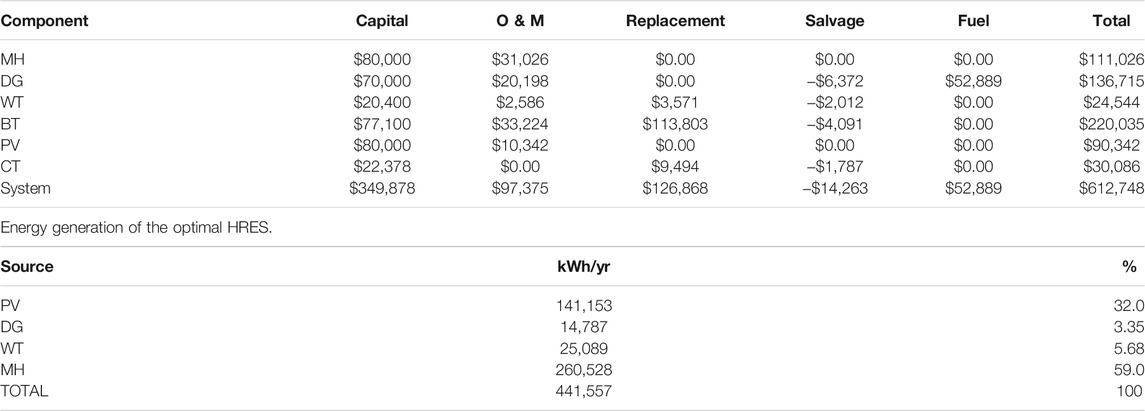
TABLE 10. Detail cost analysis of HRES.
In essence, as opposed to the other HRES, this factor has resulted in negative salvage cost as seen in Table 10, effectively denoting profits rather than expenditures, which may result in a quicker payback period. The high capital and replacement costs of BT result in a higher overall cost between system components of $220,035 due to the high cost of BT. WT and CT, on the other hand, have a low overall cost and are the cheapest components in HRES. Table 10 presents energy generation of the optimal HRES Non-conventional energy sources are the primary sources of supply for 441,557 kWh/yr.
We could observe from Table 10 that MH and PV produce most of the energy demand for the given load profile. Due to low wind speed at the selected location, the energy generated by wind is less when compared to other sources. DG also plays a minimum role in the energy generation of optimal HRES.
The PV array generates 141,153 kWh annually, with 4400 operational hours annually, as well as a COE of $0.0495/kWh. The energy output of wind turbines is 25,089 kWh per year, with 6,757 operating hours per year, and the COE is $0.0757 per kW-hour. The hydro energy production is 260,528 kWh/year, with 8760 operating hours per year and a COE of $0.0330/kWh. The converter runs for 4,427 h a year. The Diesel Generator produces 14,787 kWh per year and operates for 372 h per year.
Figure 6 shows the monthly average electric share of each renewable source for an optimal HRES strategy. In terms of energy usage, Table 11 shows that the best configuration plan meets 24-h load demand with no power shortage and backup surplus energy of 98,738 kWh/yr.
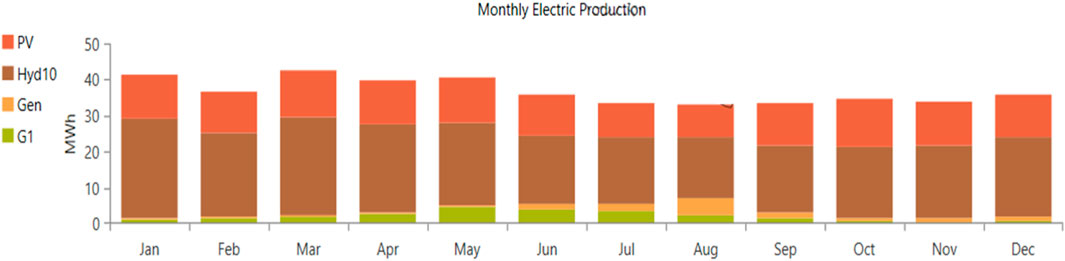
FIGURE 6. Monthly average electric production.
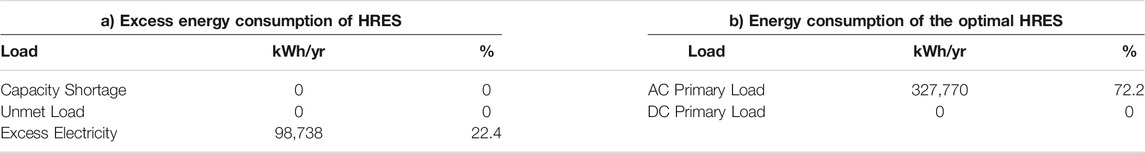
TABLE 11. Excess Energy and consumption of the optimal HRES.
As seen from Table 11, the energy consumption from AC primary load is 327,770 kWh/year, which is 72.2% of total consumption. The total energy consumption is 327,770 kWh/year. PV, Wind turbine, Micro-hydro, and system converter outputs of HRES with off-grid scenario are given in Table 12.
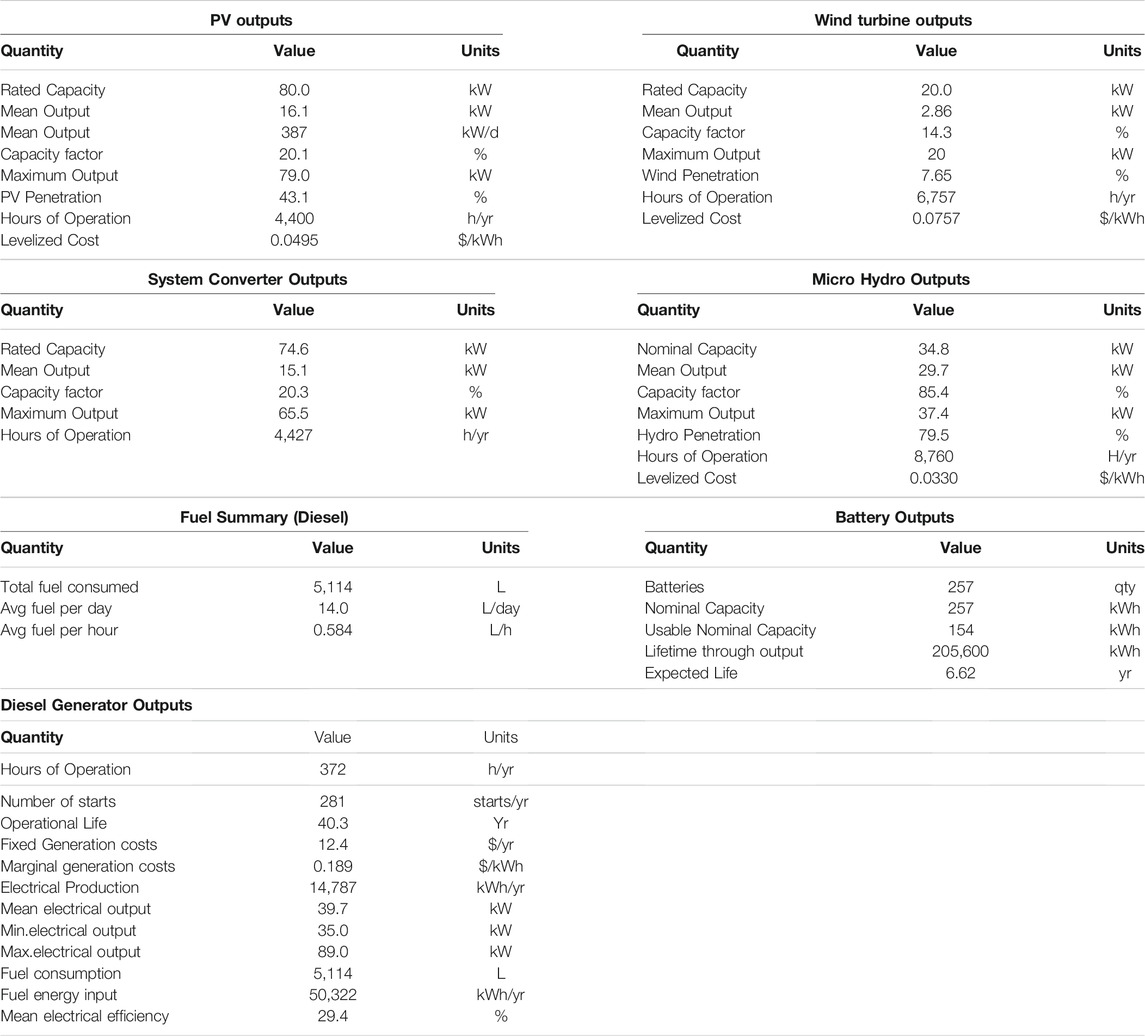
TABLE 12. PV, WT, MH System converter, DG, Batteries outputs of HRES.
Figure 7 depicts the on-line energy-scheduling system, which involves the generation and load profiles for March 6. The critical review of Figure 7 shows a variety of promising possibilities for the proposed configuration plan. Solar energy generation is observed to be available starting at 6:00 a.m. and ending at 18:00 p.m., with a peak at 13:00 p.m. Since PV is not available before 06:00 and after 18:00, all load is supplied by BT, MH, WT, and DG. It’s also worth noting that the MH’s strength remains constant. We could also see that WT operates from 6:00 a.m. to 13:00 p.m. It functions for a limited amount of time when compared to other components in the system because MH and PV serve most of the load. DG functions from 14:00 p.m. to 16:00 p.m., and its peak is at 15:00, as observed from the figure. Emissions produced by HRES are presented in Table 13.
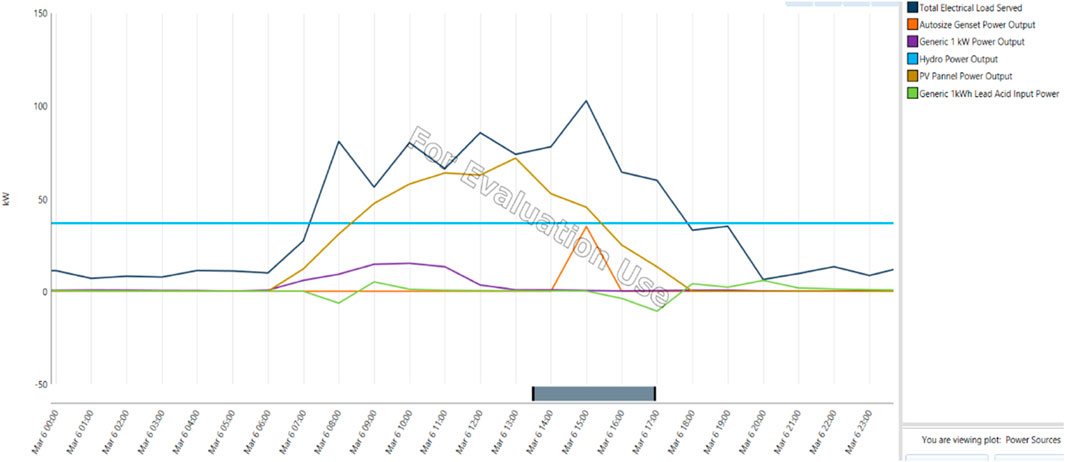
FIGURE 7. On-line energy scheduling for March 6.
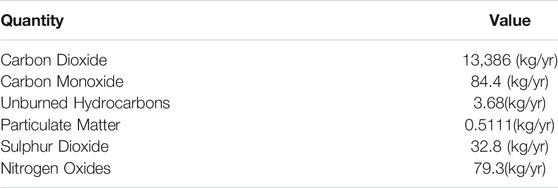
TABLE 13. Emissions produced by HRES.
Sensitivity Analysis Result
As a result of this study, it is seen that NPC, O&M, COEs, and RF of on-grid energy systems are better than off-grid energy systems. In the study, between eight hybrid system combinations, the PV-WT-MH-GRID-CT system is the best optimal system.
The sensitivity parameters selected for this analysis are global solar irradiation and annual wind speed. For each sensitivity variable, the actual value (base case) was either increase or decrease. The base case (actual) values of global solar irradiation, annual wind speed were 5.51 kWh/m2/day, 4.80 m/s respectively. The sensitivity evaluation parameters are NPC, COE, O&M, and RF for the optimal system and are presented in Table 14.
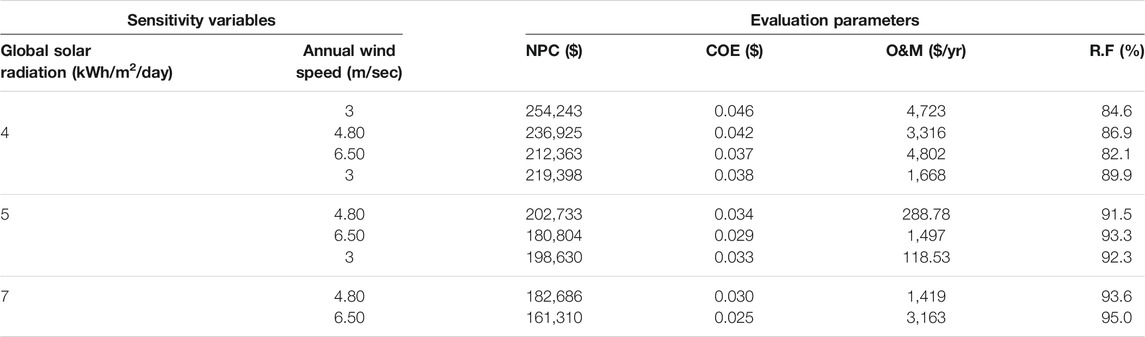
TABLE 14. Sensitivity analysis results.
Observation of the sensitivity results shows that when the global solar radiation is 7 kWh/m2/day with wind speed of 3 m/s results in less NPC, O&M and increase in RF when compared with optimal system. This is because the increase in solar radiation gives rise to increase in production of electricity by PV panel. This variable impacted the NPC, COE O&M, and RF, i.e., NPC has reduced from $202,733 to $198,630 while COE has reduced from 0.034 to 0.033, RF has increased from 91.5 to 92.3% and O&M cost has been drastically decreased from $288.78 to $118.53. For a change in the solar irradiation from 5.51 kWh/m2/day to 7 kWh/m2/day. When global solar radiation is 7 kWh/m2/day with annual average wind speed of 3 m/s has the lowest O&M when compared to other sensitivity cases.
Global solar radiation at 7 kWh/m2/day with wind speed of 6.50 m/s results in decreased NPC, COE and increase in O&M and RF when compared to optimal system. This variable influenced the NPC, COE O&M, and RF, i.e., NPC has reduced from $202,733 to $161,310 while COE has drastically reduced from 0.034 to 0.025, O&M has significantly increased from $288.78 to $3,163, and RF has changed from 91.5 to 95.0%. There is a sudden change in O&M cost because PV panel is now producing 166,800 kWh/yr and wind turbine produces 52,556 kWh/yr, i.e., there is an increase of 18.16% change in electricity production by PV panels. There is a huge increase of 109.47% change in electricity production by wind turbines when compared with the electricity production of the optimal system. COE has drastically reduced because PV panels and wind turbine are producing more electricity. We could also see that RF has also increased drastically by 3.5% when compared to base case because PV and wind turbine when compared to micro hydro and energy purchased from grids are producing most of the electricity per year.
We could see from Table 14 that when global solar radiation is 4 kWh/m2/day with wind speed of 3 m/s and there is a sudden increase in NPC, COE, O&M and decrease in RF%. NPC has increased by 25.40%, COE has increased by 35.29%, O&M has increased from $288.78 to $4,723 because as the global solar radiation and annual wind speed has been reduced so most of the load demand is met by hydro and grid which results in lesser RF and increased in NPC, COE, and O&M costs.
Figures 8A–C show the optimal system plot for NPC, RF, and COE. In these graphs, we have taken annual wind speed in y-axis and global solar radiation in x-axis.
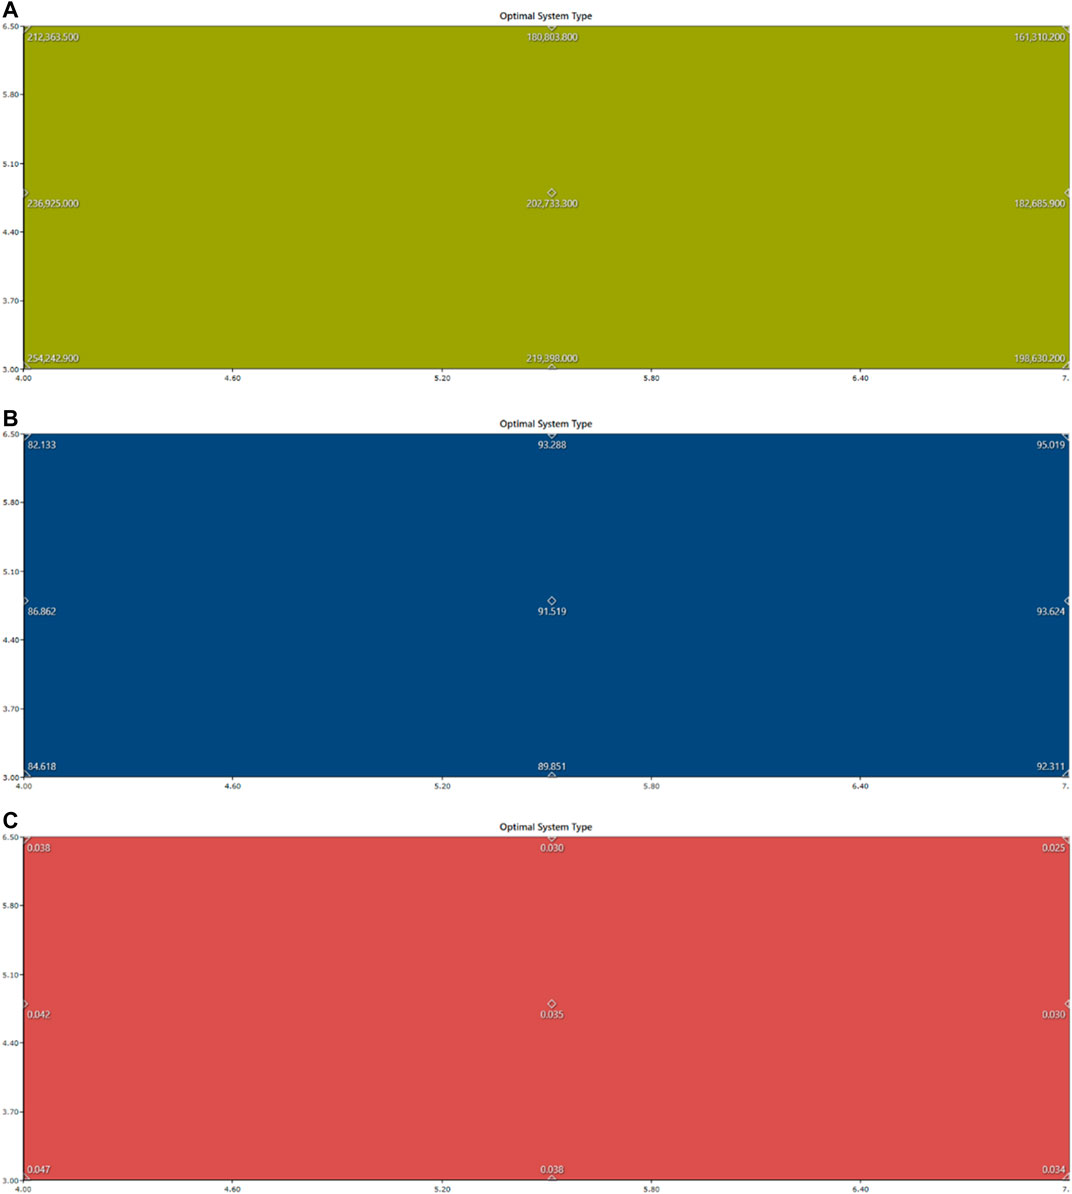
FIGURE 8. (A) Optimal system type plot for Net Present Cost. (B) Optimal system type plot for RF. (C) Optimal system type plot for COE.
[(Sawle et al., 2018a)], [(Sawle et al., 2021)], https://energy.rajasthan.b, https://en.wikipedia.org/,https://energy.rajasthan.a.
Conclusion
Within this research scope, meeting load demands of towns through on-grid/off-grid renewable energy systems is investigated from a techno-economic analysis perspective. As a result of this study, it is seen that NPC, O&M, COEs, and RF of on-grid energy systems are better than off-grid energy systems. In the study, between eight hybrid system combinations, the lowest COE of 0.034 $/kWh is obtained with the PV-WT-MH-GRID-CT system in the on-grid scenario. It should also be kept in mind that on-grid systems contribute to CO2 emission reduction when compared to off-grid systems. PV-WT-MH-BT-CT-DG is the utmost feasible configuration for an off-grid scenario in terms of NPC, COE, OC, and RF. The NPC, COE, OC, and RF of the PV-WT-MH-BT-CT-DG HES are $612,748, $0.145, $20,334, and 95.5%, respectively. Global solar radiation is 7 kWh/m2/day with wind speed of 6.50 m/s results in decreased NPC, COE and increase in O&M and RF when compared to optimal system. This variable influenced the NPC, COE O&M, and RF, i.e., NPC has reduced from $202,733 to $161,310 while COE has drastically reduced from 0.034 to 0.025, O&M has significantly increased from $288.78 to $3,163, and RF has changed from 91.5 to 95.0%.
Data Availability Statement
The original contributions presented in the study are included in the article/Supplementary Material, further inquiries can be directed to the corresponding author.
Author Contributions
This research aims to structure a power generation model associated with different HRES combinations using a HOMER software application at a location in India. This research’s primary goal is to examine the foremost possible HRES configuration utilizing various variations to meet the requirement for village load in a secure, permanent and sustainable way. As a result of this study, it is seen that NPC, O&M, COEs, RF of on-grid energy systems are better than off-grid energy systems. In the study, between eight hybrid system combinations, the lowest COE of 0.034 $/kWh is obtained with the PV-WT-MH-GRID-CT system in the on-grid scenario.
Funding
I don’t have any funding support from agencies. Frontiers journal declared they will help for providing funding support.
Conflict of Interest
The authors declare that the research was conducted in the absence of any commercial or financial relationships that could be construed as a potential conflict of interest.
Publisher’s Note
All claims expressed in this article are solely those of the authors and do not necessarily represent those of their affiliated organizations, or those of the publisher, the editors and the reviewers. Any product that may be evaluated in this article, or claim that may be made by its manufacturer, is not guaranteed or endorsed by the publisher.
Supplementary Material
The Supplementary Material for this article can be found online at: https://www.frontiersin.org/articles/10.3389/fenrg.2021.724162/full#supplementary-material
Supplementary Figure S1 | Methodology used in HOMER.
Supplementary Figure S2 | Geographical map of Bijolia.
Abbreviations
BT, Battery; COE, Cost of Energy; CT, Converter; DG, Diesel Generator; FC, Fuel Cells; HRES, Hybrid Renewable Energy System; MG, Micro Grid; MH, Micro Hydro; RF, Renewable Fraction; WT, Wind Turbine.
Footnotes
1https://energy.rajasthan.gov.in/content/raj/energy-department/rvunl/en/our-plant/hydel/js.html.
2https://energy.rajasthan.gov.in/rvunl.
3https://en.wikipedia.org/wiki/Bijolia.
References
Alam, M. S., and Gao, D. W. (2007). “Modeling and Analysis of a Wind/PV/fuel Cell Hybrid Power System in HOMER,” in Proceeding of the 2007 2nd IEEE Conference on Industrial Electronics and Applications, Harbin, China, 23–25 May, 2007 (IEEE). doi:10.1109/iciea.2007.4318677
Bhatt, A., Sharma, M. P., and Saini, R. P. (2016). Feasibility and Sensitivity Analysis of an Off-Grid Micro Hydro-Photovoltaic-Biomass and Biogas-Diesel-Battery Hybrid Energy System for a Remote Area in Uttarakhand State, India. Renew. Sustainable Energ. Rev. 61, 53–69. doi:10.1016/j.rser.2016.03.030
Canales, F. A., Beluco, A., and Mendes., C. A. B. (2017). Modelling a Hydropower Plant with Reservoir with the Micropower Optimisation Model (HOMER). Int. J. Sustainable Energ. 36 (7), 654–667. doi:10.1080/14786451.2015.1080706
Doll, C. N. H., and Pachauri, S. (2010). Estimating Rural Populations Without Access to Electricity in Developing Countries Through Night-Time Light Satellite Imagery. Energy policy 38 (10), 5661–5670. doi:10.1016/j.enpol.2010.05.014
Hafez, O., and Bhattacharya, K. (2012). Optimal Planning and Design of a Renewable Energy Based Supply System for Microgrids. Renew. Energ. 45, 7–15. doi:10.1016/j.renene.2012.01.087
Jahangiri, M., Haghani, A., Alidadi Shamsabadi, A., Mostafaeipour, A., and Pomares, L. M. (2019). Feasibility Study on the Provision of Electricity and Hydrogen for Domestic Purposes in the South of Iran Using Grid-Connected Renewable Energy Plants. Energ. Strategy Rev. 23, 23–32. doi:10.1016/j.esr.2018.12.003
Jain, Amit., Srinivas, E., Raman, S., Gaddam, R. R., Haritha, V. V. S. S., and Srinath, N. V. (2010). “Sustainable Energy Plan for an Indian Village,” in Proceeding of the 2010 International Conference on Power System Technology, Zhejiang, China, 24–28 October, 2010 (IEEE). doi:10.1109/powercon.2010.5666618
Kansara, B. U., and Parekh, B. R. (2011). “Modelling and Simulation of Distributed Generation System Using HOMER Software,” in Proceeding of the 2011 International Conference on Recent Advancements in Electrical, Electronics and Control Engineering, Sivakasi, India, 15–17 December, 2011 (IEEE). doi:10.1109/iconraeece.2011.6129804
Krishan, O., and Suhag, S. (2020). Grid-independent PV System Hybridization with Fuel Cell-Battery/supercapacitor: Optimum Sizing and Comparative Techno-Economic Analysis. Sustainable Energ. Tech. Assessments 37, 100625. doi:10.1016/j.seta.2019.100625
Kumar, A., Singh, A. R., Deng, Y., He, X., Kumar, P., and Bansal, R. C. (2019). Integrated Assessment of a Sustainable Microgrid for a Remote Village in Hilly Region. Energ. Convers. Management 180, 442–472. doi:10.1016/j.enconman.2018.10.084
Magarappanavar, U. S., and Sreedhar, K. (2016). Optimization of Wind-Solar-Diesel Generator Hybrid Power System Using HOMER. Optimization 3, 6.
Miao, C., Teng, K., Wang, Y., and Jiang, L. (2020). Technoeconomic Analysis on a Hybrid Power System for the UK Household Using Renewable Energy: A Case Study. Energies 13 (12), 3231. doi:10.3390/en13123231
Munuswamy, S., Nakamura, K., and Katta, A. (2011). Comparing the Cost of Electricity Sourced from a Fuel Cell-Based Renewable Energy System and the National Grid to Electrify a Rural Health centre in India: A Case Study. Renew. Energ. 36 (11), 2978–2983. doi:10.1016/j.renene.2011.03.041
Oulis Rousis, A., Tzelepis, D., Konstantelos, I., Booth, C., and Strbac, G. (2018). Design of a Hybrid AC/DC Microgrid Using HOMER Pro: Case Study on an Islanded Residential Application. Inventions 3 (3), 55. doi:10.3390/inventions3030055
Panwar, N. L., Kaushik, S. C., and Kothari., S. (2011). Role of Renewable Energy Sources in Environmental protection: A Review. Renew. Sustain. Energ. Rev. 15 (3), 1513–1524. doi:10.1016/j.rser.2010.11.037
Ramesh, Mala., and Prasad Saini, Rajeshwer. (2020). Dispatch Strategies Based Performance Analysis of a Hybrid Renewable Energy System for a Remote Rural Area in India. J. Clean. Prod. 259, 120697. doi:10.1016/j.jclepro.2020.120697
Samy, M. M., Barakat, S., and Ramadan, H. S. (2019). A Flower Pollination Optimization Algorithm for an Off-Grid PV-Fuel Cell Hybrid Renewable System. Int. J. Hydrogen Energ. 44 (4), 2141–2152. doi:10.1016/j.ijhydene.2018.05.127
Sawle, Y., and Gupta, S. C. (2015). A Novel System Optimization of a Grid-independent Hybrid Renewable Energy System for Telecom Base Station. Int. J. Soft Comput. Mathematics Control. (Ijscmc) 4 (2), 49–57. doi:10.14810/ijscmc.2015.4204
Sawle, Y., Gupta, S. C., and Bohre, A. K. (2018). A Novel Methodology for Scrutiny of Off-Grid Hybrid Renewable System, John Wiley & Sons. Int. J. Energ. Res. 42, 570–586. doi:10.1002/er.3841
Sawle, Y., Gupta, S. C., and Bohre, A. K. (2016). PV-wind Hybrid System: A Review with Case Study. Cogent Eng. J. 3 (1), 1189305. doi:10.1080/23311916.2016.1189305
Sawle, Y., Gupta, S. C., and Bohre, A. K. (2017). Review of Hybrid Renewable Energy Systems with Comparative Analysis of Off-Grid Hybrid System. Renew. Sustainable Energ. Rev. 81, 2217–2235. doi:10.1016/j.rser.2017.06.033
Sawle, Y., Gupta, S. C., and Bohre, A. K. (2018). Socio-techno-economic Design of Hybrid Renewable Energy System Using Optimization Techniques. Renew. Energ. 119, 459–472. doi:10.1016/j.renene.2017.11.058
Sawle, Y., Gupta, S. C., and Bohre, A. K. (2018). Techno-Economic Scrutiny of HRES Through GA and PSO Technique, Inderscience. Int. J. Renew. Energ. Technology 9 (1/2), 84–107. doi:10.1504/ijret.2018.10011069
Sawle, Y., and Gupta, S. C. (2014). “Optimal Sizing of Photovoltaic/wind Hybrid Energy System for Rural Electrification,” in Proceeding of the Power India International Conference (PIICON), 2014, Delhi, India, 5–7 December, 2014 (IEEE), 1–4. doi:10.1109/POWERI.2014.7117758
Sawle, Y., and Gupta, S. C. (2018). Optimization of a Standalone Hybrid Renewable Energy System for Telecom Base Station. Prog. Petrochem Sci. Crimson Journals 2 (5), 1–10. doi:10.31031/PPS.2018.02.000546
Sawle, Y., Jain, S., Babu, S., Nair, A. R., and Khan, B. (2021). Prefeasibility Economic and Sensitivity Assessment of Hybrid Renewable Energy System. IEEE Access 9, 28260–28271. doi:10.1109/access.2021.3058517
Keywords: decentralized power generation, microgrids, sustainable, hybrid power, solar energy, electricity, capacity, growth
Citation: Jain S and Sawle Y (2021) Optimization and Comparative Economic Analysis of Standalone and Grid-Connected Hybrid Renewable Energy System for Remote Location. Front. Energy Res. 9:724162. doi: 10.3389/fenrg.2021.724162
Received: 12 June 2021; Accepted: 24 August 2021;
Published: 18 October 2021.
Edited by:
Muhammad Zubair, Majmaah University, Saudi ArabiaReviewed by:
GM Shafiullah, Murdoch University, AustraliaMohammad Khalil Elahee, University of Mauritius, Mauritius
Copyright © 2021 Jain and Sawle. This is an open-access article distributed under the terms of the Creative Commons Attribution License (CC BY). The use, distribution or reproduction in other forums is permitted, provided the original author(s) and the copyright owner(s) are credited and that the original publication in this journal is cited, in accordance with accepted academic practice. No use, distribution or reproduction is permitted which does not comply with these terms.
*Correspondence: Yashwant Sawle, eWFzaHNhd2xlQGdtYWlsLmNvbQ==