 R. López-Vicente1*
 M. Fernández-Castro2
 J. Abad1
 E. Mazzolini2J. W. Andreasen2
 M. Espindola-Rodriguez2*A. Urbina1
- 1Department of Electronics and Applied Physics, Technical University of Cartagena, Cartagena, Spain
- 2Department of Energy Conversion and Storage, Technical University of Denmark, Lyngby, Denmark
Organic solar cells (OSCs) have increased their power conversion efficiency above 18% thanks to the use of non-fullerene acceptors in binary or ternary blends or in tandem configurations. In this article, a study on the lifetime of P3HT:O-IDTBR bulk heterojunction OSCs on ITO-free flexible substrates is presented. A direct comparison of glass–glass and plastic–plastic encapsulation performance, with a special focus on its effect on the lifetime of the devices after degradation procedures, has been carried out complying with the ISOS protocols for organic photovoltaic devices. The manufactured OSCs with 1 cm2 active layer have power conversion efficiencies ranging from 1.9 to 3.4% depending on the encapsulant material, encapsulation process, and substrate. An exponential degradation rate has been found, with a similar functional behavior for glass and plastic differing in the degradation constants, which ranges from k = 0.01 to 0.002 h−1. Only in one case, the ISOS-T3 essay for plastic encapsulation, a double exponential process, was observed with degradation rates of k1 = 0.03 h−1 and a second slower process with k2 = 0.001 h−1. The longest achieved T80 lifetime is 86 h for glass-encapsulated devices under an accelerated ISOS-T3 protocol.
Highlights
• Stability comparison of OPVs encapsulated in glass–glass or plastic–plastic.
• Stability testing of inverted OPVs over more than 1,000 h.
• Repeated 12-h cycles in a climatic chamber mimicking dawn, noon, and sunset.
• Repeated 6-h cycles with alternating temperatures between −40 and 85°C.
• Glass encapsulation suitable for moderate climates, and plastic for cold or caching climates.
Introduction
Organic solar cells (OSCs) have received great research attention due to their potential low cost, light weight, and flexibility, making them a promising emerging technology. In recent years, their power conversion efficiency (PCE) has increased significantly, reaching up to 18% for full organic cells and up to 12% for tandem architectures (You et al., 2013; Liu et al., 2020), which are recent record efficiencies in the respective technologies (Best-Research-Cell-Efficiencies, 2019). In order to achieve these efficiencies, the active layer materials used in the bulk heterojunction play a fundamental role: a polymer or small molecule acts as an electron donor (P3HT is the benchmark donor) and fullerene derivatives, such as PCBM, or non-fullerene acceptors (NFAs), such as O-IDTBR, act as the acceptors (Wadsworth et al., 2019). Ternary blends combine fullerene and non-fullerene acceptors, both in single junction and in tandem monolithic cells (Xu and Gao, 2018).
After several years in the research stage, organic technologies have reached the market, being viable and attractive for many applications, such as mobile applications, IoT, and building-integrated photovoltaics (BIPV). OSCs can be processed by roll-to-roll (R2R) techniques, easily scalable toward industrial manufacturing (Pascual-San-José et al., 2019), with some examples reaching module areas of 64 cm2 with PCE of 5% on ITO glass substrates using glass encapsulation (Strohm et al., 2018). In many cases, the use of ITO has been avoided and flexible substrates have been preferred, in order to bring costs down and further improve the industrial attractiveness of non–fullerene-based OSCs. Additionally, laboratory roll-processed OSCs with active areas of 1 cm2 have reached an impressive 12.16% PCE, reinforcing the potential of this processing method for OPV (Wang et al., 2020).
NFAs have attracted the attention of researchers because they combine stability, good light absorption, easy synthesis at low cost, and compatibility with the use of solvents that are non-harmful for the environment (Nielsen et al., 2015; Pascual-San-José et al., 2019). One successful family of NFAs is indacenodithiophene (IDT) and indacenodithienothiophene-based acceptors, particularly those benefiting from the planarization obtained by the IDT unit, which allows better aggregation (Holliday et al., 2016). OSC devices with the NFAs O-IDTBR in blend with P3HT have reached efficiencies of up to 6.7% on ITO-coated glass substrates (Pascual-San-José et al., 2019; Holliday et al., 2016; Gertsen et al., 2020; Jørgensen, Norrman, Gevorgyan, Tromholt, Andreasen, Krebs). Additionally, this type of material, as well as the non-chlorinated solvents used for solution processing, enables serial R2R manufacturing and allows OSC processing to be scaled up to an industrial manufacturing level with low environmental impact (Pascual-San-José et al., 2019).
However, non–encapsulated OSCs have some stability limitations when compared with crystalline silicon or inorganic thin-film technologies, which highlights the importance of studying the encapsulant materials and methods (Gertsen et al., 2020). Organic materials degrade quickly due to external environmental agents, mainly oxygen and moisture, as well as UV radiation (Jørgensen, Norrman, Gevorgyan, Tromholt, Andreasen, Krebs; Balderrama et al., 2014; Córcoles et al., 2015). The degradation causes an alteration of the electrical properties of the cells such as PCE, open circuit voltage (VOC), short-circuit current density (JSC), and fill factor (FF). In addition, the burn-in degradation effect (when the solar cell rapidly reduces its PCE by degradation of several electrical parameters, mainly photocurrent, in the first hours of work) is strongly reduced when NFAs are used in the solar cells, with just around 5% relative PCE loss during the first 2,000 h compared to almost 34% in only a few hundred hours in fullerene-acceptor solar cells (Jørgensen, Norrman, Gevorgyan, Tromholt, Andreasen, Krebs).
In recent years, the study of stability and degradation in OSCs has been crucial and focused mainly on increasing their stability and consequently on improving their PCE throughout their lifetime (Jørgensen, Norrman, Gevorgyan, Tromholt, Andreasen, Krebs). A set of protocols called ISOS (Reese et al., 2011) was proposed in order to create standard methodologies, delivering results that could be comparable between different laboratories around the world. These protocols, although not mandatory, are recommended covering a wide range of different variables and environmental conditions to be measured such as oxygen, humidity, ultraviolet radiation, and temperature.
Meitzner et al. (2019) have compared different commercial P3HT batches to study their properties and layer architecture in stress conditions using different ISOS protocols, such as ISOS-L-2 (laboratory weathering), ISOS-O-1 (outdoor aging), and ISOS-D-2 (dark aging). Urban et al. (2019) investigated the degradation of the OSC contacts under very stressful thermal conditions, from −40 to 85°C. Their results show the evolution of the series and shunt resistances due to mechanical stress applied on the contacts. In order to show the effect of UV illumination, mechanical stress, and encapsulation, Weerasinghe et al. (2016) carried out several tests on large-area R2R-processed OSCs under continuous illumination, also including fracture tests. Their results demonstrated better lifetime and better mechanical stability for the encapsulated devices. Encapsulation is therefore a critical component in photovoltaic devices, with strong impact on their lifetime, because it is responsible for protecting the devices from external environmental conditions, including UV radiation. Uddin et al. (2019) enumerated a list of the most important encapsulants in OSCs and their influence on the degradation process. Although no encapsulation procedure is declared as the best one, it is noted that good temperature control to avoid damaging the organic components, as well as an R2R solution process deposition of thin multilayers can be beneficial, also providing a low-cost solution to isolate and protect the device.
In this article, we report a detailed stability study of fully R2R processed ITO-free OSCs using three fast aging tests comparing plastic and glass encapsulation. The devices were tested under different conditions: a weathering chamber with ISOS-LT-1, ISOS-T-3 using a thermal chamber, and ISOS-L-1 (Table 1). The results were compared with previously reported stability data for similar cells (Gevorgyan et al., 2008; Reese et al., 2011; Dos Reis Benatto et al., 2016; Barreiro-Argüelles et al., 2018; Uddin et al., 2019). The main purpose of the study presented in this article is the comparative impact of encapsulating P3HT:O-IDTBR OSCs in glass–glass or plastic–plastic envelopes. Whereas the R2R-compatible plastic–plastic encapsulation preserves the flexibility of the solar cells, the glass–glass encapsulation is widely used by the research community mainly because most of the reported devices are built on ITO substrates, for which a glass–glass encapsulation is straightforward. Therefore, the results presented here are attractive for both research laboratories working on a small scale and research teams aiming to scale-up the production of solar cells regardless of the use of organic, inorganic, or hybrid (e.g., perovskite) photoactive materials. The study on the lifetime of ITO-free, R2R-compatible open-air–produced OSCs with PCEs >3% is reported in this article, where the lifetime essays have reached more than 1,000 h in the devices under ISOS-L-1. Each of the different accelerated degradation systems has been tested using procedures as recommended by the ISOS protocols (Reese et al., 2011).
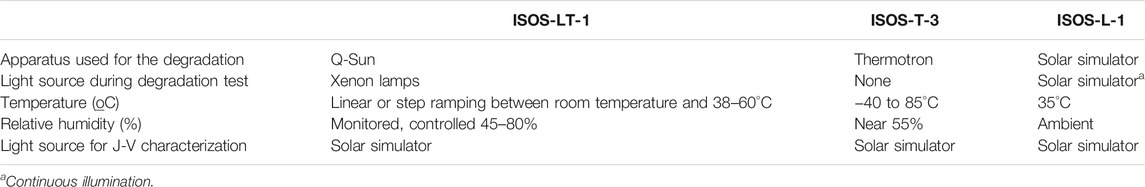
TABLE 1. ISOS test protocol conditions applied during the degradation experiments.
Materials and Methods
Three different accelerated degradation systems have been used to perform a detailed degradation experiment to test the impact of different encapsulation techniques on the performance and lifetime of the devices. We used weathering chambers to simulate accurate irradiances, extreme temperatures, humidity, and storage conditions in darkness. These chambers are used by test centers to produce reliable and reproducible performance reports depending on the storage and operating environment, which are mandatory to bring this kind of OSC closer to commercialization. For the continuous lighting system, a solar simulator calibrated to standard AM1.5G irradiance has been used. Illuminated and dark current density vs. voltage curves (J-V), external quantum efficiency (EQE) of the OSCs, and UV-vis transmittance data of the encapsulants are reported, in order to study the performance of the OSCs and compare their optical aging.
Fabrication of the Solar Cells
OSCs were fabricated on flexible substrates in open-air using R2R compatible processes. Polyethylene terephthalate (PET) substrate–printed finger-like silver electrodes and PEDOT:PSS were used as the front electrode followed by a thin ZnO layer as the electron transport layer (Hösel et al., 2013). The bulk heterojunction photoactive layer was formed by the blend of P3HT acting as the donor and the non–fullerene O-IDTBR material as the acceptor. The molecular structure of the donor and acceptor materials is illustrated in Figures 1A,B. Using previously optimized parameters (Fernández Castro et al., 2020), the ink with the photoactive materials was prepared, with a concentration of 40 mg/ml in a 1:1 ratio in dichlorobenzene with 5% (v/v) of 4-bromoanisole (BrA) as additive. The active layer ink was slot-die–coated at 60°C with a speed of 0.6 m/min and a flow rate of 0.08 ml/min, resulting in a film with a dry thickness of 480 nm. A layer of PEDOT:PSS (Heareus Clevios FET) was then slot-die–coated on top of the active layer as a hole transport layer. Heat curing silver paste (DuPont 5025) was used to flexographically print the finger-like back electrode. The schematic structure of the inverted architecture OSCs in this work is shown in Figure 1C. The substrate was cut into small pieces to obtain solar cells with 1 cm2 of the active area. Finally, two encapsulation materials were used to sandwich the solar cells, either glass or plastic slides, applying UV-curing epoxy glue on both sides. A total of 12 devices were manufactured (six encapsulated in glass and six in plastic), but only the best 6 were used in accelerated degradation studies.
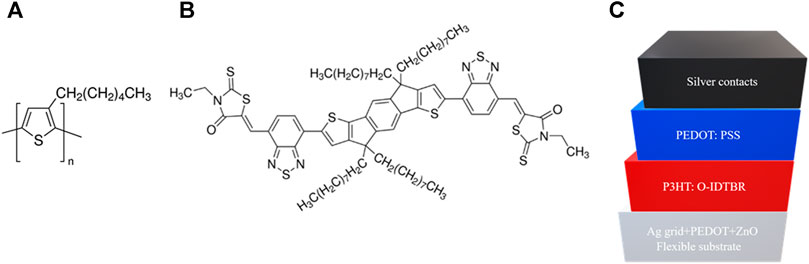
FIGURE 1. The molecular structure of the components of the active layers: (A) P3HT acting as the donor, (B) in combination with the non–fullerene acceptor O-IDTBR. (C) The schematic structure of the ITO-free solar cells.
Optical and Electrical Characterization
A solar simulator was used for J-V characterization (Keithley 2400 SourceMeter Unit) under controlled temperature and AM1.5G, 1,000 W/m2 illumination (calibrated with a monocrystalline silicon reference cell certified by Fraunhofer). The EQE and optical transmittance were measured using a QEX10 system (PV Measurements Inc.) every 24 and 48 h from 300 to 900 nm (5 nm step size) calibrated with a Si photodiode. The continuous monitoring of the EQE and transmittance was only performed for the OSCs subjected to the ISOS-LT-1 and ISOS-T-3 tests (weathering and thermal chamber tests). The OSCs subjected to ISOS-L1 were always kept under the solar simulator light.
Degradation Studies
A detailed study of the degradation process using some of the recommended ISOS protocols has been carried out using two different complementary weather chambers, one being a heat, illumination (Xenon lamp) damp chamber (Q-Sun) and another being a thermal, humidity stress chamber (Thermotron) with a temperature range from −40 to 85°C.
Continuous Illumination (ISOS-L-1)
The OSCs were kept under the solar simulator light at constant temperature (35°C). The J-V curves were measured every 5 min until there was no measurable current density.
Q-Sun and Thermotron Chambers (ISOS-LT-1 and ISOS-T-3)
Two systems were used to carry out degradation studies on the solar cells. These systems allow designing degradation procedures which comply with ISOS protocols for stability testing of organic photovoltaic materials (Reese et al., 2011), as indicated in Table 1.
The Q-Sun system is designed to create real weather and climatic conditions like solar irradiation, ambient temperature, humidity, and even rain. In this case, the illumination is carried out with Xenon lamps that mimic the solar spectrum including the UV part to further increase degradation effects. In order to simulate a real day and to have a fast degradation process, one ISOS-LT-1 cycle is of 12 h, repeated twice during a whole day. For this experiment two irradiances were used, a low irradiance as a simulation of dawn and sunset (0.55 kW/m2) and a high irradiance for noon (1 kW/m2). The conditions used in this work for the ISOS-LT-1 cycle are described in Supplementary Figure S1A and Table 2 and are more extreme than those recommended in the ISOS protocols to put the devices to the limit.
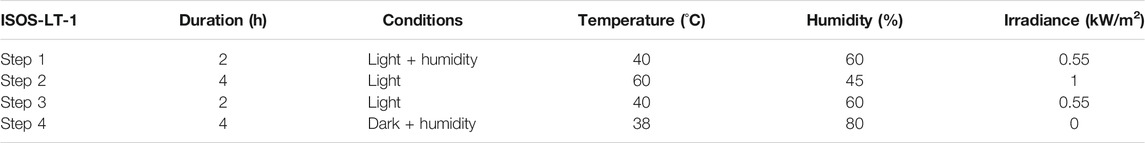
TABLE 2. Cycle of weather simulation using the Q-Sun system to characterize the degradation process, complying with the ISOS-LT-1 protocol.
The Thermotron chamber is designed to carry out accelerated degradation processes by applying harsh weather conditions with fast cycles between extreme temperatures. The ISOS-T-3 cycle is divided into 10 steps following the recommendations of the ISOS protocols for thermal cycling with a duration of 6 h in dark, and it is reproduced four times in 24 h (Reese et al., 2011). The cycle alternates between −40 and 85°C, including intermediate temperatures using different ramp rates from 0.7 to 3°C/min as indicated in Table 3 and Supplementary Figure S1.
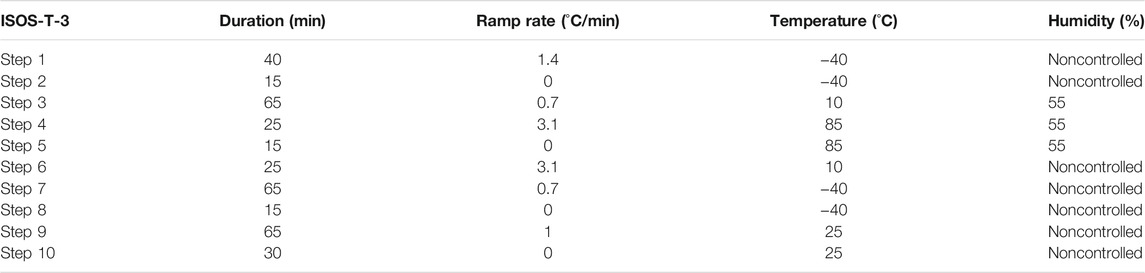
TABLE 3. Cycle of thermal stress simulation using the Thermotron system to characterize the degradation process, complying with the ISOS-T-3 protocol.
Results and Discussion
The key electrical parameters of the solar cells are presented in Table 4. VOC, JSC, FF, and PCE were analyzed as a function of time during the degradation process. The list of electrical parameters, depending on the kind of encapsulation and time T80, when a drop of 20% of the initial PCE is measured, is also included in the last column of Table 4.
TABLE 4. Summary of the main parameters of the solar cells after fabrication and at T80 for the three ISOS-LT-1, -T3, and -L1, for devices with 1 cm2 active area.
The solar cells showed lifetimes reaching up to T80 = 86 h (ISOS-T-3) in an accelerated degradation process. The evolution of the J-V curves of different tests is summarized in Figure 2. For the ISOS-LT-1 test, Figure 2A and Table 4, both plastic and glass encapsulation J-V curves show similar behavior with similar T80 at 12 and 14.5 h, respectively. In the thermal stress experiment (ISOS-T-3), the plastic encapsulation has a better long-term behavior (>700 h) than the glass encapsulation (400 h) as shown in Figure 2C, although T80 is slightly better for glass (Table 4). It might be because the coefficient of thermal expansion of the plastic encapsulants is closer to that of the OSCs, with a stronger influence during mid-life of the cells (after T80 has been reached). This makes plastic encapsulants the material of choice when the OSCs might experience below zero temperatures when installed in the field. In the continuous light illumination test (ISOS-L-1), the main difference between both encapsulations is that T80 is almost three times larger for glass than for plastic encapsulation, with a similar long-term degradation behavior of the J-V curves (Figure 2B).
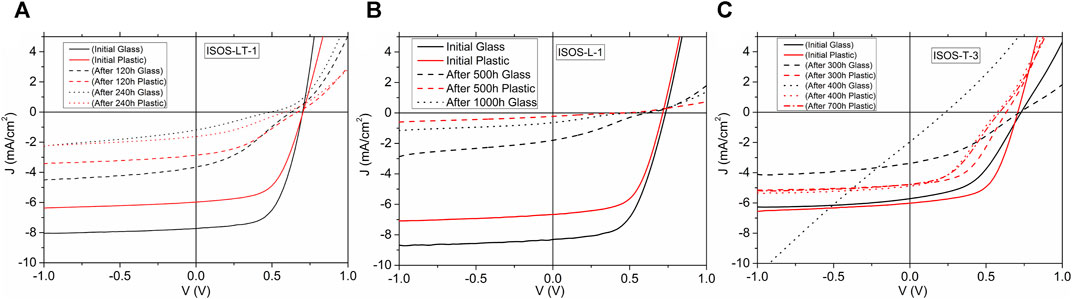
FIGURE 2. Summary of initial and aged J-V curves for the three degradation studies carried out: (A) in the Q-Sun chamber (ISOS-LT-1), (B) under solar simulator under constant temperature (ISOS-L-1), and (C) in the thermal chamber (ISOS-T-3).
In general, the open circuit voltage (Voc) does not follow a clear tendency in the different degradation experiments (Figures 3A, 4A, 5A), since Voc is not a reliable parameter to study the degradation processes. The decrease of the PCE and current density (Figures 3–5) is strong for all OSCs, the latter indicates a loss of photogenerated carriers (considering that absorption and EQE are similar in all cases as shown below). The FF had also decreased (Figures 3B, 4B, 5B), in coincidence with a simultaneous increment in the series resistance (Table 5). This is due to contact degradation and reduction of shunt resistance (indicative of increased bulk recombination) produced by the degradation of the active layer by exposure to oxygen due to poorer encapsulation (Urban et al., 2019). The loss of photocurrent between the measurements is more pronounced in the ISOS-LT-1 test (weathering chamber) than in the ISOS-T-3 test (thermal chamber), probably due to harsher lighting and humidity stress cycles applied to the solar cells there.
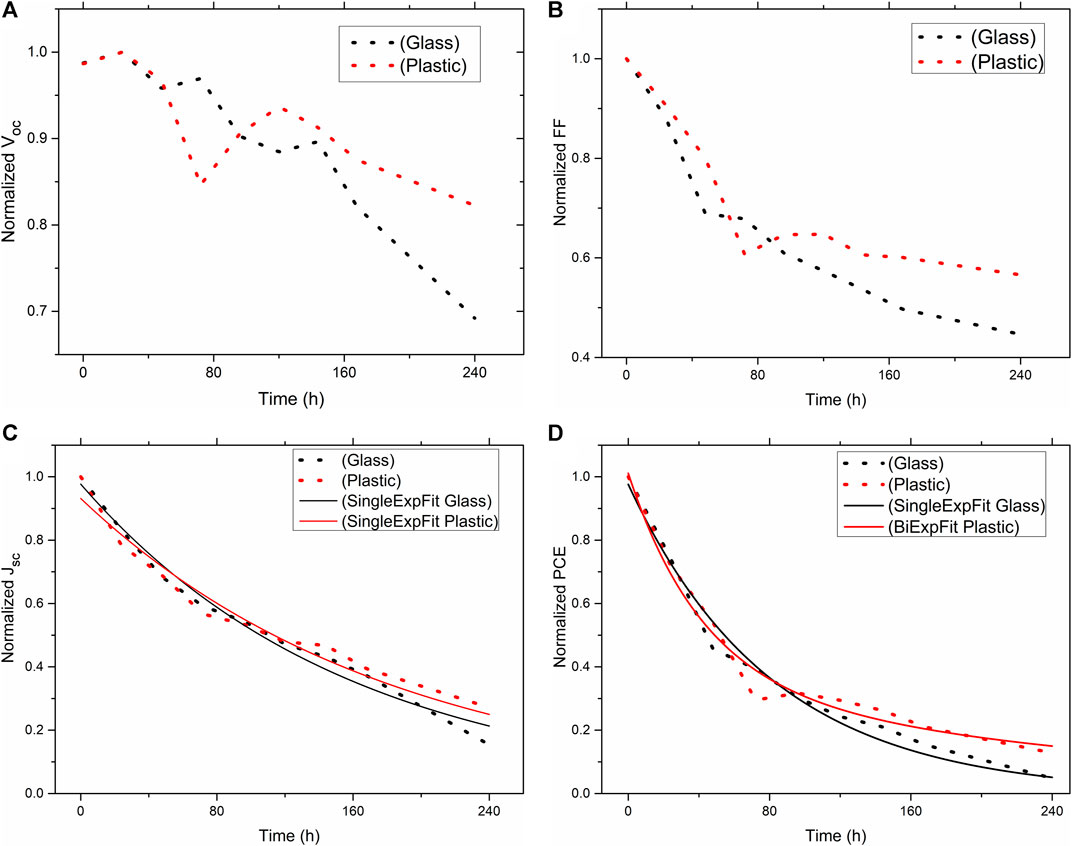
FIGURE 3. Evolution of the OSCs electrical parameters (Voc (A), FF (B), Jsc (C) and PCE (D)) vs. time (glass and plastic encapsulation) for the ISOS-LT-1 test (weathering chamber). For Jsc and PCE, exponential fitting is superimposed.
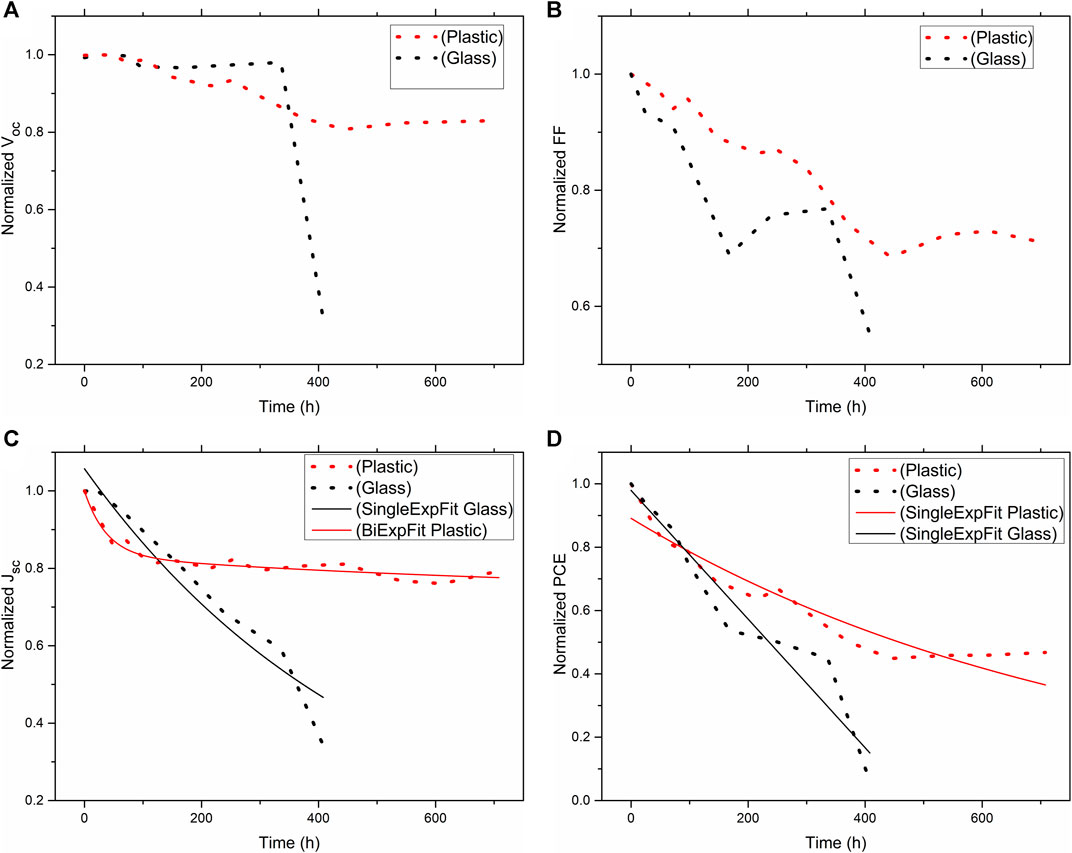
FIGURE 4. Evolution of the OSC electrical parameters (Voc (A), FF (B), Jsc (C) and PCE (D)) vs. time (glass and plastic encapsulation) for the thermal chamber (ISOS-T-3).
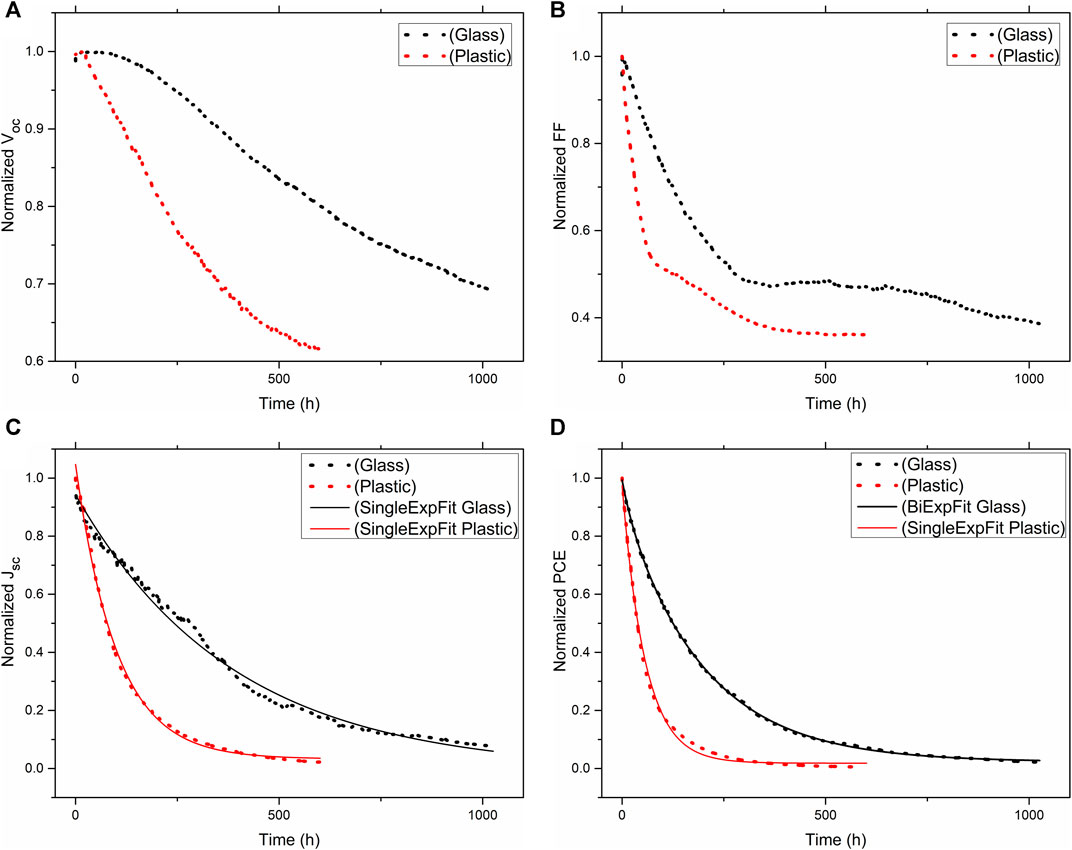
FIGURE 5. Evolution of the OSC electrical parameters (Voc (A), FF (B), Jsc (C) and PCE (D)) vs. time (glass and plastic encapsulation) for the continuous illumination ISOS L-1 test.
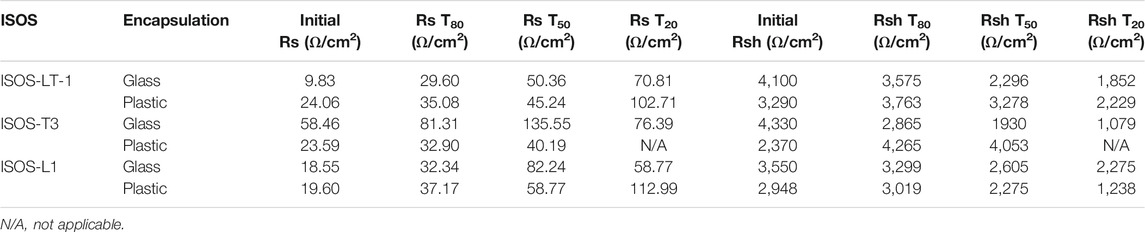
TABLE 5. Summary of the evolution of the series and shunt resistances at different device's lifetime.
Figure 3 shows the evolution of the key photovoltaic parameters obtained for the ISOS-LT-1 test (solar weathering chamber). They provide detailed information about the degradation process of the OSCs and the influence of the different encapsulation materials. The PCE is dependent on the evolution of the other parameters such as JSC and FF. The values shown in the graphs have been normalized to the initial value, and exponential fits to the Jsc and PCE data have been included. The FF behavior is linked to the series and shunt resistances evolution induced by the degradation experiment. The drop in PCE suffers the so-called “burn-in” effect, which makes it rapidly and drastically decrease, only to stabilize later. This is more pronounced in the glass encapsulation device, meaning that this might be caused by ingress of oxygen and moisture through the edges of the samples where the two glass encapsulants are glued by epoxy. In fact, the rigidity of the glass combined with the manual processing may explain a different sealing along the four edges due to unbalanced pressure. This technique results in a poorer sealing in one of the edges. The plastic encapsulation is carried out using a laminating machine, thus providing a more uniform sealing along all the edges of the sample. In all the cells, the degradation curves of the PCE and Jsc are fitted using exponential functions (single or biexponential); however, only the fittings of Jsc are analyzed in detail, since this parameter gives better information of the degradation mechanism than PCE. We want to highlight that linear functions have been also tested, but the fit with the greater coefficient of determination (COD) or R-square has been obtained for exponential functions (De Bettignies et al., 2006).
The single exponential is:
and the biexponential is:
where, k is the so-called degradation constant. For the ISOS-LT-1 test (Figures 3C,D), a single exponential behavior is observed for both encapsulations. This same behavior points out to temperature as the main degradation mechanism (Schuller et al., 2004; Gevorgyan et al., 2008; Djeddaoui et al., 2019).
The ISOS-T-3 test (thermal degradation process) results are shown in Figure 4, and we again observe the variations in VOC and FF, with the drastic drop in VOC for the glass device. For JSC, a biexponential fit for plastic and a single exponential fit for glass (Figure 4C) is used for this system, showing, in this case, two different mechanisms. According to the literature (Schuller et al., 2004; Gevorgyan et al., 2008; Djeddaoui et al., 2019), these two mechanisms are closely linked to temperature and humidity. The plastic-encapsulated device shows a better stability than the glass-encapsulated device, reaching up to 700 h. This behavior seems to indicate that the plastic encapsulation provides better isolation from ambient conditions (less oxygen and moisture ingress into the device), better thermal cycling (from −40 to 85°C), and mainly a superior manipulation resilience. In this case, two exponential degradation processes are present. The second one is much slower than the first one. This one can be attributed to the effect of UV light, in contrast to the first process, which was due to ambient conditions (ingress of moisture and oxygen into the cell).
The evolution of the normalized key photovoltaic parameters of the solar cells subjected to the ISOS-L-1 degradation test (continuous illumination) is shown in Figure 5, showing the difference between the plastic and glass encapsulation. When considering the degradation of VOC, the difference between glass- and plastic-encapsulated devices increases strongly as the process evolves in time. Figure 5 shows a similarity in the evolution of JSC and PCE. JSC decays faster at the beginning and then slows down its decay to almost zero current for both plastic and glass. In the case of Figure 5A, it is observed that the trend is inverse to the other two, where plastic shows better behavior compared to glass. The possible cause of this is due to the breakage or poor sealing of the plastic during the encapsulating process.
It should be emphasized that both cases of exponential fit indicating double or single processes provide, respectively, a good fit for JSC and PCE for glass or plastic encapsulation in the ISOS-L-1 tests. In every degradation test that was carried out, glass encapsulation achieved longer lifetimes for the OSCs except for the thermal chamber (ISOS-T3) where plastic encapsulation was a better choice to extend the working life of the OSCs due to the extreme temperatures of the test. The degradation constants k1 and k2 obtained from the JSC fits for all tests are shown in Table 6.
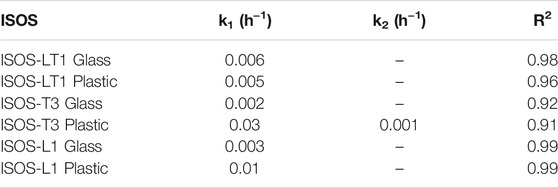
TABLE 6. Degradation constants obtained from the exponential fit for glass and plastic in the different degradation systems.
These degradation constants are used to compare different degradation tests, since each of them is closely related to a fundamental parameter in stability processes. k1 has been related mainly to temperature, whether a linear, simple exponential, or biexponential fit is carried out. This constant is usually mainly responsible for the degradation; k2, on the other hand, is usually related to humidity, another important parameter, but one that is usually present in some specific conditions. The degradation rates included in Table 6 are similar to those reported by Gevorgyan et al. (2008) when the cells are encapsulated, and the slower degradation process is attributed to the effect of UV light. Only in the ISOS-T3 essay for the plastic-encapsulated cell, a biexponential behavior was observed, with a second degradation rate even lower, pointing to a second slower UV-driven degradation process triggered by the effect of temperature.
According to Table 6, it can be observed that even though ISOS-LT1 has a stage of high humidity in darkness, it does not seem decisive for the rapid degradation of the samples, since it is more strongly dependent on the temperature reached because the different irradiances tested are predominant.
On the other hand, in the ISOS-T3, where the thermal stress is very strong, k1 is lower and also shows a very small k2 in the plastic encapsulation system, which indicates that it is probable that some moisture from the stages of extreme cold and heat has penetrated in to the device due to a break in the encapsulation. From then on, it becomes too difficult or unrealistic to fit the data resulting in a fit with low R2.
Finally, when continuous lighting ISOS-L1 test is carried out (Figure 6), where the temperature is controlled but humidity is not (room conditions), a single exponential behavior is recorded. On the other hand, the plastic encapsulation sample shows the highest k1.
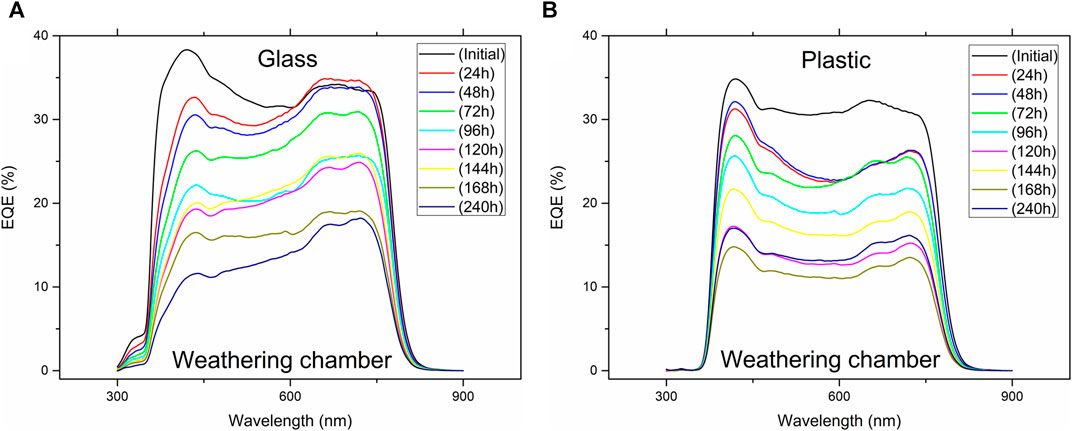
FIGURE 6. Evolution of the EQE vs. time for ISOS-LT-1 for both encapsulations (glass (A) and plastic (B), respectively).
To analyze in detail the different behaviors of the encapsulations, further EQE measurements have been carried out to explore photoelectronic properties of the OSCs and compare the effects of extrinsic degradation agents (Meitzner et al., 2019), such as photo oxidation and possible oxygen and moisture ingress when using two different encapsulants. Figures 6, 7 show the evolution of the EQE at different stages of the degradation ISOS-LT-1 and ISOS-T-3 tests. Considering that the thickness of the absorber layer is the same in all cases during the tests, P3HT degrades faster than O-IDTBR. As seen in Figure 6A, for glass encapsulation and ISOS LT-1 test, the EQE photocurrent of the spectral region where P3HT is expected to contribute (450–650 nm) decreased faster than the EQE photocurrent at the O-IDTBR main contribution region (650–800 nm) (Pascual-San-José et al., 2019). It indicates that in glass encapsulation, P3HT degrades faster than O-IDTBR during the ISOS LT-1 test, which simulates illumination of day cycles with above-zero temperatures. In plastic encapsulation (Figure 6B), the photocurrent decreases more uniformly over the spectral range and time. In Figures 6, 7 the local maximum around 420 nm corresponds mainly to the photocurrent contribution of the secondary absorption peak of O-IDTBR located at 400 nm that in blend with P3HT shifts to 420 nm (Fernández Castro et al., 2020). In Figure 7, the EQE photocurrent at the O-IDTBR contribution regions decreases at a slower pace than the photocurrent at the P3HT region of contribution. It might be indicative of microstructural modifications and possible phase separation for which further studies are necessary (see Supplementary Figure S2). As shown before during the ISOS-T-3 experiments, where the solar cells experience cycles from −40 to 85°C, the plastic encapsulation protects better the solar cells from the environment, allowing the continuation of the experiment for more than 700 h (Figure 2) with a stable photocurrent (∼5 mA/cm2) and VOC (∼0.55 V). Figures 6, 7 also verify that materials such as O-IDTBR can reduce the burn-in effect produced at the beginning of the cell operation, when compared to cells with materials such as PCBM in the active layer. Additionally, the PEDOT:PSS is also degraded by moisture since it is a highly hygroscopic material. This ingress of moisture in the cell might have happened, most probably through the edges of the sample, thus contributing to the degradation of the charge extraction layer.
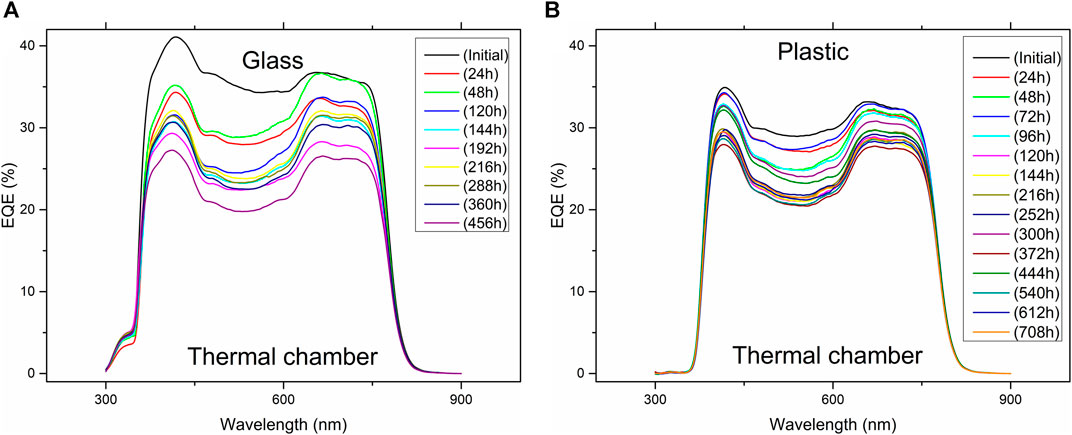
FIGURE 7. Evolution of the EQE vs. time for ISOS-T-3 for both encapsulations (glass (A) and plastic (B), respectively).
Losses in photocurrent are also possibly due to degradation of the electrodes or the encapsulant, which will affect the measured photogenerated current. The series resistance of the devices increases during the degradation experiments in almost all combinations of encapsulation and degradation test protocols. The increment in RS is an indication of internal deterioration of the layers and interfaces, complemented by a probable surface recombination in the electrode/transport layer interfaces, which in this case contributes to the lowering of the shunt resistance. Also, an increase in the reverse saturation current of the solar cells is observed, as seen in the dark current before and after degradation of the solar cells shown in Supplementary Figure S3.
Figures 8, 9 show the transmittance evolution over time for both kinds of encapsulation of the OSCs. For the ISOS-LT-1 degradation test (Figure 8), external factors influence the degradation of the encapsulation. Different irradiation times produce incremental photon losses in the transmittance of the glass/epoxy/glass encapsulation, especially in the visible region. This photo degradation of epoxy glue turns it yellowish and possibly reducing its capability as a moisture barrier. For the plastic encapsulation in Figure 8B, after a minor change in transmittance in the first hours of illumination, the transmittance remains constant up to more than 700 h. In the thermal chamber experiment (ISOS-T-3), shown in Figure 9, the differences between the glass and plastic are less noticeable. Specifically, the plastic is practically intact (Figure 9B) while the epoxy in the glass–glass encapsulation stops acting as a UV barrier (transmittance increase around 300 nm). This allows the epoxy to also turn yellowish as a consequence of extreme temperature cycles in dark. Nevertheless, both experiments indicate that the plastic encapsulation provides better protection against environmental degradation agents. This fact may be mainly due to the encapsulation method. For the case of plastic, both sides are laminated, passing the OSCs between two pressing rolls. In contrast, for glass, the sealing is done with tweezers holding the two glass slides, resulting in a probably less homogeneous sealing with a bigger amount of epoxy trapped between the two glasses.
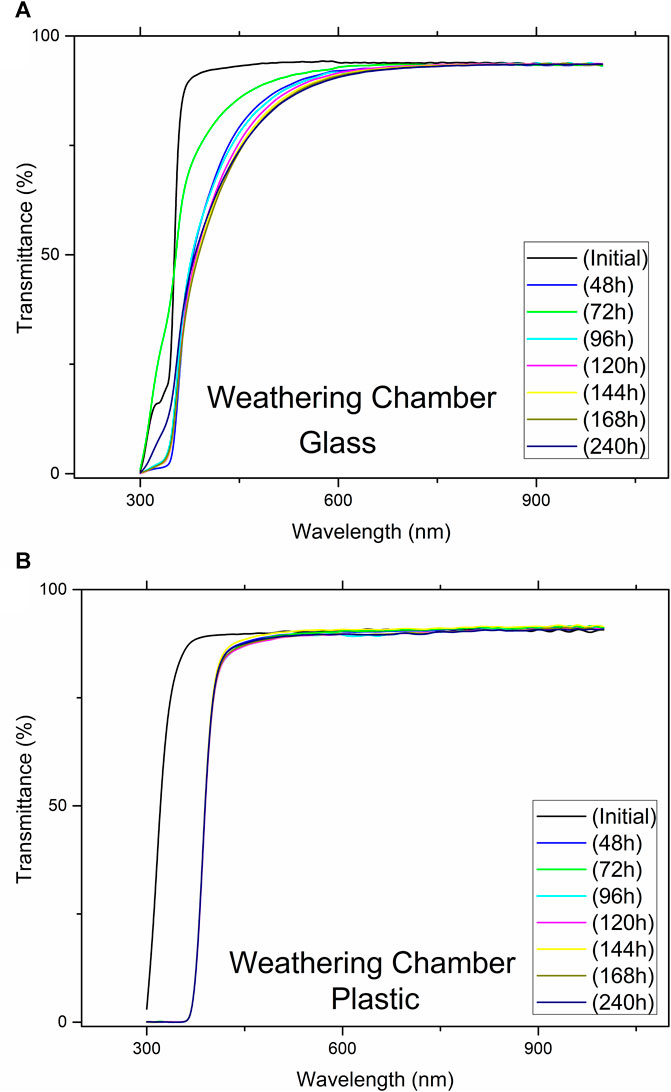
FIGURE 8. Evolution of the transmittance vs. time for ISOS-LT-1 for both encapsulations (glass (A) and plastic (B), respectively).
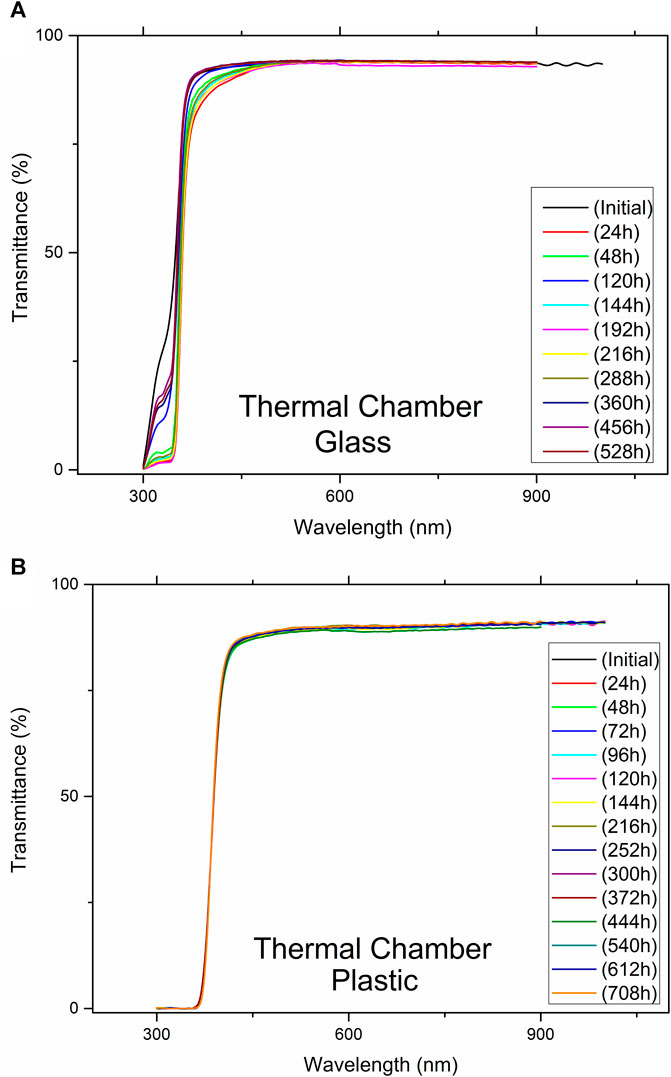
FIGURE 9. Evolution of the transmittance vs. time for ISOS-T-3 for both encapsulations (glass (A) and plastic (B), respectively).
Conclusion
Bulk heterojunction OSCs based on P3HT:O-IDTBR have been fabricated to study the effect of different materials (glass or plastic) as encapsulants. The OSCs have been characterized by J-V, EQE, and UV-vis transmittance measurements during the degradation tests carried out according to recommended ISOS protocols. An exponential degradation rate has been found, with bimodal behavior for plastic in ISOS-T3. The J-V parameters and EQE and UV-vis spectra evolution point to a worsening of the carrier transport and to an increased series resistance as the main causes for the degradation of the solar cell PCE. The longest achieved T80 lifetime is 86 h for glass–glass encapsulated devices under an accelerated ISOS-T3 protocol. The spectral evaluation of the degradation tests indicates that P3HT degrades faster than O-IDTBR during tests with simulated sunlight. We also found that plastic is a better long-term encapsulant, likely reducing ingress of oxygen and humidity into the cell when compared to glass encapsulants carried out, respectively, by hand. The ingress of moisture might affect strongly the PEDOT:PSS/Ag and Ag:PEDOT:ZnO transporting layers, and electrodes as PEDOT:PSS is highly hygroscopic that when degraded, the transport properties are worsened. It is reflected in an increment in the series resistance of the equivalent circuit of the solar cells. Finally, the optimization of the encapsulation process and the use of alternative donors seem to be more important than the encapsulant material itself in order to provide longer lifetimes. The use of NFAs in the active layer together with an improvement of the encapsulation techniques open the possibility of longer lifetimes for bulk heterojunction solar cells.
Data Availability Statement
The raw data supporting the conclusions of this article will be made available by the authors, without undue reservation.
Author Contributions
RL-V helped in setting up the equipment for stability measurements, helped with the encapsulation of the samples in plastic foils, and performed the stability experiments. MF-C and EM optimized the processes for the fabrication of solar cells. MF-C, EM, and ME-R fabricated the solar cells for this work. JA and AU contributed with the analysis of the data. JA and ME-R contributed to conception and design of the study. RL-V, JA, AU, and ME-R wrote sections of the manuscript. All authors contributed to manuscript revision, read, and approved the submitted version.
Funding
This study was funded by F. Séneca (Murcia, 19882/GERM/15 and 20985/PI/18), Agencia Estatal de Investigación (AEI, Spain, ENE 2016-79282-C5-5-R and PID 2019-104272RB-C55) including FEDER funds, Programa interno movilidad de doctorandos de la UPCT, and funding from the European Research Council under SEEWHI, Grant No. 681881.
Conflict of Interest
The authors declare that the research was conducted in the absence of any commercial or financial relationships that could be construed as a potential conflict of interest.
Publisher’s Note
All claims expressed in this article are solely those of the authors and do not necessarily represent those of their affiliated organizations, or those of the publisher, the editors, and the reviewers. Any product that may be evaluated in this article, or claim that may be made by its manufacturer, is not guaranteed or endorsed by the publisher.
Supplementary Material
The Supplementary Material for this article can be found online at: https://www.frontiersin.org/articles/10.3389/fenrg.2021.741288/full#supplementary-material
References
Balderrama, V. S., Estrada, M., Han, P. L., Granero, P., Pallarés, J., Ferré-Borrull, J., et al. (2014). Degradation of Electrical Properties of PTB1:PCBM Solar Cells under Different Environments. Solar Energ. Mater. Solar Cell 125, 155–163. doi:10.1016/j.solmat.2014.02.035
Barreiro-Argüelles, D., Ramos-Ortiz, G., Maldonado, J.-L., Pérez-Gutiérrez, E., Romero-Borja, D., Meneses-Nava, M.-A., et al. (2018). Stability Study in Organic Solar Cells Based on PTB7:PC71BM and the Scaling Effect of the Active Layer. Solar Energy 163, 510–518. doi:10.1016/j.solener.2018.01.090
Best-Research-Cell-Efficiencies (2019). National Renewable Energy Laboratory, Best Research Cell Efficiency Chart, 2019, U.S. Government. Available at https://www.nrel.gov/pv/cell-efficiency.html.
Córcoles, L., Abad, J., Padilla, J., and Urbina, A. (2015). Wavelength Influence on the Photodegradation of P3HT:PCBM Organic Solar Cells. Solar Energ. Mater. Solar Cell 141, 423–428. doi:10.1016/j.solmat.2015.06.023
De Bettignies, R., Leroy, J., Firon, M., and Sentein, C. (2006). Accelerated Lifetime Measurements of P3HT:PCBM Solar Cells. Synth. Met. 156, 510–513. doi:10.1016/j.synthmet.2005.06.016
Djeddaoui, N., Boukezzi, L., and Bessissa, L. (2019). Aging and Degradation of Organic Solar Cells Using QUV Accelerated-Weathering Tester. Trans. Electr. Electron. Mater. 20, 189–197. doi:10.1007/s42341-019-00103-z
Dos Reis Benatto, G. A., Roth, B., Corazza, M., Søndergaard, R. R., Gevorgyan, S. A., Jørgensen, M., et al. (2016). Roll-to-Roll Printed Silver Nanowires for Increased Stability of Flexible ITO-free Organic Solar Cell Modules. Nanoscale 8, 318–326. doi:10.1039/c5nr07426f
Fernández Castro, M., Mazzolini, E., Sondergaard, R. R., Espindola-Rodriguez, M., and Andreasen, J. W. (2020). Flexible ITO-free Roll-Processed Large-Area Nonfullerene Organic Solar Cells Based on P3HT:O-IDTBR. Phys. Rev. Appl. 14, 1. doi:10.1103/physrevapplied.14.034067
Gertsen, A. S., Castro, M. F., Søndergaard, R. R., and Andreasen, J. W. (2020). Scalable Fabrication of Organic Solar Cells Based on Non-fullerene Acceptors. Flex. Print. Electron. 5, 014004. doi:10.1088/2058-8585/ab5f57
Gevorgyan, S. A., Jørgensen, M., and Krebs, F. C. (2008). A Setup for Studying Stability and Degradation of Polymer Solar Cells. Solar Energ. Mater. Solar Cell 92, 736–745. doi:10.1016/j.solmat.2008.02.008
Holliday, S., Ashraf, R. S., Wadsworth, A., Baran, D., Yousaf, S. A., Nielsen, C. B., et al. (2016). High-Efficiency and Air-Stable P3HT-Based Polymer Solar Cells with a New Non-fullerene Acceptor. Nat. Commun. 7, 11585. doi:10.1038/ncomms11585
Hösel, M., Søndergaard, R. R., Jørgensen, M., and Krebs, F. C. (2013). Fast Inline Roll-To-Roll Printing for Indium-tin-oxide-free Polymer Solar Cells Using Automatic Registration. Energ. Technol. 1, 102–107. doi:10.1002/ente.201200029
Jørgensen, M., Norrman, K., Gevorgyan, S. A., Tromholt, T., Andreasen, B., and Krebs, F. C. (2012). Stability of Polymer Solar Cells. Adv. Mater. 24, 580–612. doi:10.1002/adma.201104187
Liu, Q., Jiang, Y., Jin, K., Qin, J., Xu, J., Li, W., et al. (2020). 18% Efficiency Organic Solar Cells. Sci. Bull. 6, 272. doi:10.1016/j.scib.2020.01.001
Meitzner, R., Faber, T., Alam, S., Amand, A., Roesch, R., Büttner, M., et al. (2019). Impact of P3HT Materials Properties and Layer Architecture on OPV Device Stability. Solar Energ. Mater. Solar Cell 202, 110151. doi:10.1016/j.solmat.2019.110151
Nielsen, C. B., Holliday, S., Chen, H.-Y., Cryer, S. J., and McCulloch, I. (2015). Non-Fullerene Electron Acceptors for Use in Organic Solar Cells. Acc. Chem. Res. 48, 2803–2812. doi:10.1021/acs.accounts.5b00199
Pascual-San-José, E., Rodríguez-Martínez, X., Adel-Abdelaleim, R., Stella, M., Martínez-Ferrero, E., and Campoy-Quiles, M. (2019). Blade Coated P3HT:Non-Fullerene Acceptor Solar Cells: A High-Throughput Parameter Study with a Focus on Up-Scalability. J. Mater. Chem. A. 7, 20369–20382. doi:10.1039/c9ta07361b
Reese, M. O., Gevorgyan, S. A., Jørgensen, M., Bundgaard, E., Kurtz, S. R., Ginley, D. S., et al. (2011). Consensus Stability Testing Protocols for Organic Photovoltaic Materials and Devices. Solar Energ. Mater. Solar Cell 95, 1253–1267. doi:10.1016/j.solmat.2011.01.036
Schuller, S., Schilinsky, P., Hauch, J., and Brabec, C. J. (2004). Determination of the Degradation Constant of Bulk Heterojunction Solar Cells by Accelerated Lifetime Measurements. Appl. Phys. A. 79, 37–40. doi:10.1007/s00339-003-2499-4
Strohm, S., Machui, F., Langner, S., Kubis, P., Gasparini, N., Salvador, M., et al. (2018). P3HT: Non-fullerene Acceptor Based Large Area, Semi-transparent PV Modules with Power Conversion Efficiencies of 5%, Processed by Industrially Scalable Methods. Energy Environ. Sci. 11, 2225. doi:10.1039/c8ee01150h
Uddin, A., Upama, M. B., Yi, H., and Duan, L. (2019). Encapsulation of Organic and Perovskite Solar Cells: A Review. Coatings 9, 1. doi:10.3390/coatings9020065
Urban, T., Mette, A., Muller, M., and Heitmann, J. (2019). Front and Rear Pressure Contact Degradation in Solar Modules Due to Thermal Cycle Treatment. IEEE J. Photovoltaics 9, 1360–1365. doi:10.1109/jphotov.2019.2925551
Wadsworth, A., Moser, M., Marks, A., Little, M. S., Gasparini, N., Brabec, C. J., et al. (2019). Critical Review of the Molecular Design Progress in Non-fullerene Electron Acceptors towards Commercially Viable Organic Solar Cells. Chem. Soc. Rev. 48, 1596–1625. doi:10.1039/c7cs00892a
Wang, G., Zhang, J., Yang, C., Wang, Y., Xing, Y., Adil, M. A., et al. (2020). Synergistic Optimization Enables Large-Area Flexible Organic Solar Cells to Maintain over 98% PCE of the Small-Area Rigid Devices. Adv. Mater. 32, e2005153. doi:10.1002/adma.202005153
Weerasinghe, H. C., Rolston, N., Vak, D., Scully, A. D., and Dauskardt, R. H. (2016). A Stability Study of Roll-To-Roll Processed Organic Photovoltaic Modules Containing a Polymeric Electron-Selective Layer. Solar Energ. Mater. Solar Cell 152, 133–140. doi:10.1016/j.solmat.2016.03.034
Xu, W., and Gao, F. (2018). The Progress and Prospects of Non-fullerene Acceptors in Ternary Blend Organic Solar Cells. Mater. Horiz. 5, 206–221. doi:10.1039/c7mh00958e
Keywords: organic solar cells, degradation, encapsulation materials, non-fullerene, lifetime, stability
Citation: López-Vicente R, Fernández-Castro M, Abad J, Mazzolini E, Andreasen JW, Espindola-Rodriguez M and Urbina A (2021) Lifetime Study of Organic Solar Cells with O-IDTBR as Non-Fullerene Acceptor. Front. Energy Res. 9:741288. doi: 10.3389/fenrg.2021.741288
Received: 14 July 2021; Accepted: 14 September 2021;
Published: 19 October 2021.
Edited by:
Vida Engmann, University of Southern Denmark, DenmarkReviewed by:
S. Sundar Kumar Iyer, Indian Institute of Technology Kanpur, IndiaDaniel Tudor Cotfas, Transilvania University of Brașov, Romania
Copyright © 2021 López-Vicente, Fernández-Castro, Abad, Mazzolini, Andreasen, Espindola-Rodriguez and Urbina. This is an open-access article distributed under the terms of the Creative Commons Attribution License (CC BY). The use, distribution or reproduction in other forums is permitted, provided the original author(s) and the copyright owner(s) are credited and that the original publication in this journal is cited, in accordance with accepted academic practice. No use, distribution or reproduction is permitted which does not comply with these terms.
*Correspondence: R. López-Vicente, cm9kb2xmby5sb3BlekB1cGN0LmVz; M. Espindola-Rodriguez, bWVzcm9AZHR1LmRr