 Hao Liang1,2
 Jun Pei
- 1State Key Laboratory of Oil and Gas Reservoir Geology and Exploitation, Southwest Petroleum University, Chengdu, China
- 2CNOOC (China) Co., Ltd. Hainan, Haikou, China
- 3State Key Laboratory of Natural Gas Hydrate, Beijing, China
Natural gas hydrate is a potential energy source in the future, which widely occurs in nature and industrial activities, and its formation and decomposition are identified by phase equilibrium. The calculation of multicomponent gas phase equilibrium is more complex than that of single component gas, which depends on the accurate model characterized by enthalpy and free energy. Based on the Kvamme-Tanaka statistical thermodynamic model, theoretical and experimental methods were used to predict and verify the phase equilibrium of pure methane hydrate and carbon dioxide hydrate in the temperature range of 273.17–289.05 K. The phase equilibrium curves of methane-containing gases such as CH4+CO2,CH4+C2H6,CH4+H2S and CH4+CO2+H2S under different mole fractions were drawn and analyzed, and the decomposition or formation enthalpy and free energy of hydrate were calculated. The results show that, the phase equilibrium curves of the methane containing systems is mainly related to the guest molecule type and the composition of gas. The evolution law of phase equilibrium pressure of different gases varies with composition and temperature, and the phase splitting of CO2 at the quadruple point affects the phase equilibrium conditions. Due to the consideration of the interaction between the motion of guest molecules and the vibration of crystal lattice, the model exhibits a good performance, which is quantified in terms of mean square error (MSE) with respect to the experimental data. The magnitudes of MSE percent are respectively 1.2, 4.8, 15.12 and 9.20 MPa2 for CH4+CO2, CH4+C2H6, CH4+H2S and CH4+CO2+H2S systems, and the values are as low as 3.57 and 1.32 MPa2 for pure methane and carbon dioxide, respectively. This study provides engineers and researchers who want to consult the diagrams at any time with some new and accurate experimental data, calculated results and phase equilibrium curves. The research results are of great significance to the development and utilization of gas hydrate and the flow safety prediction of gas gathering and transportation.
Introduction
Natural gas hydrate (NGH) is a solid clathrate crystal material composed of water cages, which contain molecules such as hydrocarbons, carbon dioxide, hydrogen sulfide and other molecules, in which methane is the dominant gas (Vedachalam et al., 2015). Different structures of NGH can be formed by the reaction of water and gas molecules under certain conditions such as temperature, pressure, gas saturation, water salinity and pH value, etc (Makogon, 1997; Darbouret et al., 2005; Makogon, 2010; Babu et al., 2013; Babu et al., 2014; Veluswamy et al., 2016; Anwar et al., 2018). NGH is a potential alternative energy with tremendous reserves, which occurs in permafrost and marine sediments. Collett et al. estimate that the amount of natural gas stored in hydrate reservoirs in the world is between 2.8×10⁵ and 8 × 10⁸ m3 at standard conditions, which is a fairly high value (Collett, 2009). Therefore, it has attracted great attention in Japan, China, South Korea, India and other countries with relatively scarce resources, where researchers are more interested in hydrates than in the United States, Canada and Europe in recent years (Zhao et al., 2019). Although some hydrate production tests have been carried out all over the world, there is no efficient and safe exploitation method at present, and the exploitation of NGH still faces many basic research problems (Liu et al., 2019; Ye et al., 2020). The academia pay close attention to the phase equilibrium research of NGH, and the related work has been applied in many fields such as energy, chemical industry, bioengineering and environmental protection (Qorbani, 2017).
NGH widely occurs in the natural environment or in the process of oil and gas production and transportation, and its formation and decomposition are identified by phase equilibrium. How to describe all the complex phases and components quantitatively in a model is a question that people have been trying to answer for many years. Since the first hydrate phase equilibrium model was established based on statistical thermodynamic (van der Waals and Platteeuw, 1959), other scholars have proposed more accurate prediction models, most of which are based on van der Waals and Platteeuw’s theory (vdW-P model). For instance, Parrish and Prausnitz used an empirical correlation to calculate the Langmuir constant, which greatly simplified the application of van der Waals- Platteeuw model (Parrish and Prausnitz, 1972). To overcome the disadvantage of Parrish-Prausnitz model in predicting the pressure of asymmetric mixtures, Ng and Robinson modified the chemical potential of water in hydrate phase, which improved the prediction results (Ng and Robinson, 1976). John et al. noticed the effects of the non-spherical and outer water molecules of the guest molecules on the total potential energy of the cavity (John et al., 1985). They used the three-layer sphere model to describe the interaction between the guest molecules in the hydrate cavity and the water molecules around the cavity, and introduced a correction factor Q* to correct the non-spherical characteristics of the molecules. Du and Guo improved the model of John et al., and predicted the hydrate formation conditions of methanol-containing system, and finally obtained satisfactory results (Chen and Guo, 1996). Chen and Guo thought that the similarity between the process of gas molecules wrapped by water molecules and the Langmuir isothermal adsorption process is not as great as van der Waals and Platteeuw thought, so they proposed a new model (Du and Guo, 1990). In 1995, Kvamme and Tanaka extended the theory of van der Waals and Platteeuw to study the thermodynamic stability of C2H4, C2H6 and CO2 (Kvamme and Tanaka, 1995). As we know, the simplest calculation of hydrate phase equilibrium starts from pure gas hydrate. Using the phase equilibrium relationship of pure methane to predict the hydrate formation and decomposition of multicomponent gases was a common phenomenon in oil and gas field production in the past, and even many gas fields over the world adopt this simple method currently. However, this practice can no longer meet the needs of current industrial development, because natural gas contains not only methane, but also hydrocarbon gases such as ethane and propane, as well as non-hydrocarbon gases such as carbon dioxide and hydrogen sulfide. Hence, the models of multicomponent gas hydrate were established by researchers to predict the phase equilibrium boundary of NGH with complex gas components and experiments were carried out to verify the accuracy of these model. Subramanian et al. measured the transformation of sI hydrate and sII hydrate in CH4-C2H6 binary system and studied the phase equilibrium (Subramanian et al., 2000a). Anderson et al. studied the phase equilibrium of CH4-CO2 binary system and found that the phase equilibrium pressure of CO2 hydrate is lower than that of CH4 hydrate when the temperature is lower than 283 K (Anderson et al., 2003). Huang and Sun measured the hydrate formation data of CH4+CO2+H2S system at 274.2–299.7K and 0.58–8.68 MPa, and calculated the phase equilibrium data using Chen-Guo model (Huang et al., 2005). Moradi et al. studied the phase equilibrium of CH4, C2H6, C3H8, CO2, N2 and their two-component gas hydrates (Moradi and Khosravani, 2012). To predict the phase equilibrium data of pure CO2, H2S and multicomponent acid gas hydrates, Bahman and Mohammad proposed a CPA/Electrolyte/Chen–Guo model, which took into account the effects of hydrolysis and hydrogen bond association (ZareNezhad and Ziaee, 2013). In summary, different thermodynamic models have been used to study the multi-component system hydrate, and some conclusions have reached a consensus.
In addition to the pressure and temperature conditions along the equilibrium curve, other thermodynamic properties such as enthalpy and free energy are crucial to studies related to the aforementioned applications. However, it is found that the hydrate formation mechanism of multi-component system is complex, and there are many research models with different precision. Most of these models increase the prediction accuracy by improving Langmuir constant or potential energy function, and the vdW-P model and Chen-Guo model are most widely used in thermodynamic calculation. Nevertheless, there are few studies on the systematic image description of hydrate phase equilibrium for multi-component system containing methane so far, and there is a lack of phase equilibrium research based on the modified Kvamme-Tanaka model. Beyond that, to our knowledge, the phase transition with rapid change in CO2 density is rarely mentioned in the literature, and the misunderstanding of CO2 hydrate is more stable than CH4 hydrate over a limited range of pressures and temperatures is widely recognized. Therefore, to fill the abovementioned gap, the phase equilibrium and thermodynamic parameters of gas hydrate in methane containing system were studied and analyzed by Kvamme-Tanaka statistical thermodynamic model (Kvamme and Tanaka, 1995) in this manuscript. Based on the experimental data and calculation results, we compared the phase equilibrium curves of methane hydrate, carbon dioxide hydrate and some methane containing multi-component hydrate, and calculated the enthalpy change and free energy of them. This study complements the new data for mixed gas phase equilibrium and gives some hydrate phase equilibrium diagrams of methane containing system, which can provide a basis for the development and utilization of NGH, and the prediction of gas gathering and transportation flow safety.
Methodology
Thermodynamic Model of Hydrate
There are many theoretical models to predict the phase equilibrium of gas hydrate, among which the statistical mechanical model based on Langmuir adsorption isotherm theory by van der Waals and Platteeuw plays an important role (van der Waals and Platteeuw, 1959). The four main assumptions of the model include that the guest molecules do not deform the cavity, that there is no interaction between the guest molecules, that each cavity can accommodate only one guest molecule, and that the cavity is spherically symmetric. In theory, the thermodynamic calculation of gas hydrate can be carried out by using the properties of single component gas. However, the vdW-P model does not consider the interaction between the motion of guest molecules and the vibration of crystal lattice, which has some limitations in application. When the guest molecule is a small nonpolar molecule, the interaction between the motion of the guest molecule and the vibration of the crystal lattice is small, and the assumption of vdW-P model is comparatively reasonable. However, the reasonableness of this assumption is weakened for large molecules or small polar molecules because they distort the water lattice and have a very significant interaction, resulting in the inaccuracy of the classical calculation method of Langmuir constant. So Kvamme and Tanaka proposed an improved model, which can calculate the phase equilibrium of multi-component hydrates of large or micro polar molecules such as CO2 and H2S (Kvamme and Tanaka, 1995). In this work, it is assumed that the chemical potentials of guest molecules in large and small cavities are equal and the ideal liquid is chosen as a reference state in fugacity coefficient calculation. The chemical potential of the water inside the hydrate can be expressed as (Kvamme and Tanaka, 1995; Kvamme, 2019; Kvamme et al., 2019):
in which the superscript H denotes hydrate phase, the superscript O denotes empty clathrate. vj is j-type cavity number of per water molecule in hydrate structure. In sI hydrate, small cavity vS = 1/23, large cavity vL = 3/23. R is universal gas constant and T is temperature. hij is canonical partition function of i guest molecule in j cavity, which is given by the following equation:
where β is the inverse of the general gas constant times the temperature. In thermodynamic equilibrium, the chemical potential
where Tc is the critical temperature of the guest molecule. The reference values of ki for different guest molecules are shown in the relevant literature (Kvamme and Tanaka, 1995; Qorbani, 2017). The form of Eq. 3 is also used for empty clathrates. To calculate the chemical potential, it is necessary to associate the cavity partition function with the composition and express the occupancy of guest molecule i in j cavity with the filling fraction
Substituting Eq. 4 into Eq. 2, the relationship between the filling fraction, mole fraction and cavity partition function of the guest molecules can be obtained, which is expressed as follows:
where
in which the subscript H2O refers to the water transformed into hydrate. The water phase is usually liquid or ice, but only liquid water is considered in this study. The chemical potential of liquid water is as follows:
Thermodynamic equilibrium is reached when the temperature, pressure, and chemical potential of all the co-existing phases are equal at the phase boundary. To ensure that the reference state of free energy of each phase is the same, the chemical potential calculation of each phase and each component takes the ideal state as the reference and is expressed as:
where the superscript ig and il denote ideal gas and ideal liquid respectively, and the superscript ∞ denotes infinite dilution. T is temperature and P is pressure.
The Gibbs free energy of the hydrate phase is written as the sum of the chemical potentials of each component and given by:
The free energy gradient of all independent thermodynamic variables must cause the change of free energy to be negative. The following eq. 13 is used to calculate the phase transition free energy.
where
To produce natural gas from large amounts of in-situ methane hydrates scattered around the world and control the hydrate formation and decomposition in low temperature or high pressure pipelines, information about the heat of hydrate formation and dissociation is of vital important. The enthalpies of hydrate formation or decomposition can usually be estimated by Clausius-Clapeyron or Clapeyron methods (Tsimpanogiannis et al., 2019), however, these two methods may be too simplistic. The residual thermodynamic can provide more reliable data and extend the calculation to non-equilibrium conditions. The heat (enthalpy) formed in the hydrate phase transition process must be transported from the reaction system. The absolute value of the heat to be transferred is given by eq. 14, which is solved by numerical method. The enthalpy of pure guest molecular is calculated by residual thermodynamics, as shown in eq. 15.
where N is the number of moles of hydrate formed. The total free energy change △GTotal is the sum of the phase transition free energy △GH and the energy to push away the original phase of the guest molecule.
Experiments
The main purpose of the experiments is to determine the phase equilibrium temperature and pressure of hydrate formation under different gas components, so as to analyze and verify the accuracy of the phase equilibrium diagram. The experiments were completed by SHW-III hydrate electroacoustic testing device (as illustrated in Figure 1), which can meet the requirements of image observation, temperature and pressure measurement. In these experiments, the temperature regulation system, pressure regulation system, fluid control system and data acquisition system of the device are mainly involved (Wei et al., 2021). The main body of the setup is the NGH reactor, where gas hydrate is generated and decomposed. The side wall of the reactor encloses the inside of the reactor into a cylindrical space, and the upper and lower parts of the reactor vessel are sealed by the steel cover of the pressure regulation system. The working pressure range of 0∼30 MPa and the temperature range of −6°C∼25°C in the reactor are considered acceptable. To keep the temperature constant, the hydrate reaction vessel is submerged into the water bath temperature regulation system, to a closed system where the reactor enclosed by a customized cylindrical cooling jacket. Industrial alcohol and water are mixed in a certain proportion and added to the water bath device. The temperature in the reaction kettle is adjusted by the water bath, and monitored by thermocouples (accuracy 0.05% of reading). Continuous commissioning of the water bath temperature regulation system is required according to the experimental conditions to ensure that the temperature meets the requirements. The pressure regulation system is composed of confining pressure regulation system, axial pressure regulation system and gas pressure regulation system. The experiments in this manuscript only need to adjust the gas pressure regulation system to provide the necessary pressure conditions for the phase equilibria measurement of NGH. The fluid control system mainly consists of a vacuum pump, a pressure stabilizing pump and a gas cylinder. The gas flow rate and pressure in the system can be adjusted by using pressure stabilizing pump and gas cylinder after the air in the reactor is vacuumed by vacuum pump. The data acquisition system controls the setting of axial pressure and confining pressure by computer, and automatically records the parameters in the process of experiments. The purity of the gas used in the experiment is 99.9%, which was provided by Huate Gas Co., Ltd. and the distilled water was self-made in the laboratory.
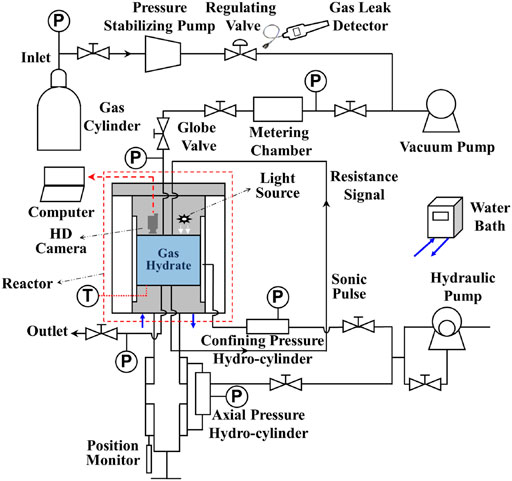
FIGURE 1. Schematic diagram of experimental apparatus for hydrate reaction. Hydrate cores were not used in this manuscript, and the confining pressure regulation system and axial pressure regulation system for core deformation test was not used.
The phase equilibrium temperature of hydrate was determined by decomposition method, and the specific method was carried out according to the following steps.
1) Prepare the experimental system. Clean the reactor with deionized water, then wipe and clean the unit with a wet alcohol cotton to ensure that there are no impurities in the reactor. Calibrate the pressure and temperature sensors, and check the airtightness of valves, pipes and reactors with gas leak detector and soapy water. Vacuum after connecting the re-actor to the line, check and ensure the integrity of the device.
2) Hydrate preparation. After preliminary checking the device, an appropriate amount of distilled water is added into the reactor (about 5 ml water for acid gas reaction and 30 ml water for general gas reaction). Thereafter, the valves of the inlet pipeline are opened and the single or multi-component gas is injected into the pump. To keep the pressure in the reactor constant, the fluid control system is set to adjust the pressure automatically with the change of the pressure in the reactor. Gas leak detector is used to check the tightness of the device at the line interface. After all the preliminary, the refrigeration device is turned on to reduce the temperature, and the hydrate began to form after reaching the appropriate setting temperature.
3) Hydrate decomposition and phase equilibrium temperature measurement. When the gas hydrate is formed, the temperature in the reactor is controlled to be constant, and the pressure is reduced to the level when only a small amount of hydrate does not decomposed (stage 1). When the hydrate does not decompose in 3–4 h under stable temperature and pressure, the pressure in the reactor was reduced by a micro pressure gradient (0.1 MPa) to find the temperature and pressure where the hydrate can decompose completely (stage 2). This process needs to be repeated many times, and the obtained temperature and pressure are phase equilibrium points.
4) Data measurement and recording. The temperature in the reactor, the pressure 1 on the inlet side of the reactor, the pressure 2 on the outlet side of the core are automatically measured and stored. The equilibrium pressure is the average of the above two pressures.
To achieve the experimental purpose, the reaction experiments of two kinds of pure gases and four kinds of mixed gases were designed according to the experimental method, and the phase equilibrium tests of 6 different gas components were carried out under different experimental pressure and temperature, and totally 24 groups of experiments were completed. Repeated tests were carried out to avoid accidental errors in the measurement of phase equilibrium pressure. Nevertheless, some systematic errors are unavoidable. For examples, the pressure difference between the pressure sensors at the inlet and outlet of the reactor is about 0.02∼0.05 MPa due their performance differences. Moreover, the pressure in the reactor changes slightly during the experiments because the gas expands with the decrease of pressure and the hydrate decomposes into gas. The pressure stabilizing pump minimizes this effect, and it is found that this error is acceptable. From the point view of experimental temperature, studies have shown that the actual marine hydrates are mostly distributed in the water depth of 300–2000 m and exist in the reservoir within 300 m below the seabed (Sun et al., 2021a; Sun et al., 2021b). In submarine pipeline at cold climates or offshore production, the pressure and temperature ranges are also in line with the actual conditions. So it is believed that the temperature range is reasonable and sufficient in this study.
Results and Discussion
Thermodynamic Calculation of Pure Gas Hydrate
Taking CH4 and CO2 as examples, the phase equilibria of sI hydrate formed by pure gas were calculated by using the thermodynamic model mentioned above. The thermodynamic calculations carried out in this paper are obtained from FORTRAN code, in which the results of dynamic simulation are used (Kvamme and Tanaka, 1995; Kvamme et al., 2019; Kvamme, 2019). As seen in Figure 2, the equilibrium curve in the temperature range of 273.17–289.05 K is shown. Note that the black and blue lines respectively represent the equilibrium curves of CH4 hydrate and CO2 hydrate predicted in this paper, and the black and blue dots are the reference values of the phase equilibrium of CH4 hydrate and CO2 hydrate respectively (De Roo et al., 1983; Ohgaki et al., 1993; Mei et al., 1996; Fan and Guo, 1999; Seo et al., 2001; Yang et al., 2001; Sun et al., 2002; Mohammadi et al., 2005; Mu and von Solms, 2018a). The figure shows 10 groups of phase equilibrium temperature and pressure measured in the formation and decomposition experiments of CH4 hydrate and CO2 hydrate in the high-pressure reactor. The standard deviation of experimental data is represented by error bars. Notably, the blue line shows a sudden change at 283.15K, which is due to the increased density of guest molecules as part of CO2 turns to liquid at higher pressures. The point at which hydrates, liquid water, liquid carbon dioxide and gaseous carbon dioxide coexist is known as the quadruple point, beyond which the pressure to hydrate increases. The temperature and pressure corresponding to the quadruple point have been straightened out in many literatures. Ohgaki et al. (Ohgaki et al., 1993) found this phenomenon and thought it is caused by liquid carbon dioxide. Figure 2 shows some of his experimental data. However, more studies lack the data and explanation on the right side of the quadruple point when calculating the phase equilibrium, and even ignore it.
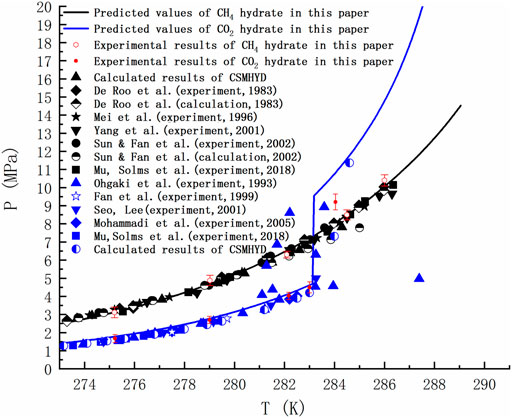
FIGURE 2. Comparison of predicted phase equilibrium curves of pure CH4 hydrate and CO2 hydrate with literature values (De Roo et al., 1983; Ohgaki et al., 1993; Mei et al., 1996; Fan and Guo, 1999; Seo et al., 2001; Yang et al., 2001; Sun et al., 2002; Mohammadi et al., 2005; Mu and von Solms, 2018a).
Figure 2 is of guiding significance to the exploitation of NGH by CO2 replacement method. Injecting CO2 into the hydrate layer can not only seal it in the hydrate cage, but also replace CH4. Many research groups around the world has been tempted by the possibility of this win-win situation. However, if only the temperature and pressure at equilibrium are observed, it is easy to form the misconception that the equilibrium curve of CO2 hydrate is discontinuous and that CO2 hydrate is only more stable than CH4 hydrate in a limited range of temperature and pressure. In fact, due to the Gibbs phase rule (F=C−P+2) and the limitation of heat and mass transfer, the hydrate in natural sediments can never reach the thermodynamic equilibrium. Taking the hydrate formed by the mixtures of methane, ethane and propane containing water as an example, the number of active components C is 4 and the actively coexisting phases P is 3 (water, alkane gas and hydrate) when the adsorption phase is ignored. Then the degree of freedom F is equal to 3, and the system still cannot reach equilibrium at a given temperature and pressure. For a system as simple as the reaction of methane and water to form hydrate (F = 2–3+2 = 1), even if we specify a thermodynamic variable, the nucleation of hydrates may be blocked due to heat and mass transfer restrictions, thus resulting in slow growth of hydrate. Therefore, the equilibrium curve is the limit of hydrate stability. Decomposition of hydrate occurs either below phase equilibrium pressure or above phase equilibrium temperature. There is a competitive phase transition in the formation and dissociation of hydrate. The formation of hydrate can only occur when the free energy of hydrate is lower than that of guest molecule and water, because the thermodynamic process strives to minimize the free energy. According to the data in Figure 3, the free energy of CO2 hydrate is about 2 kJ/mol lower than that of CH4 hydrate on the left side of the quadruple point, and about 1.83 kJ/mol lower than that of CH4 hydrate on the right side of the quadruple point. This indicates that CO2 hydrate is more stable than CH4 hydrate in a wide range of temperature and pressure.
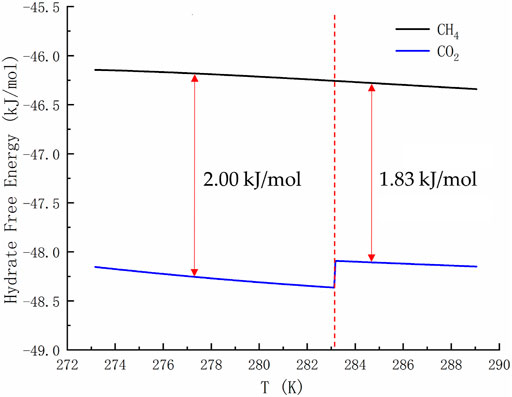
FIGURE 3. Free energy of pure CH4 hydrate and CO2 hydrate. The temperature range shown in the curve is 273.17–289.05 K.
Table 1 and Table 2 show the calculated phase transition data of pure CH4 hydrate and CO2 hydrate, where ΔHw and ΔHi respectively represent the contribution of water and guest molecules to the enthalpy change, and G is the Gibbs free energy. Table 3 is the decomposition enthalpy of methane hydrate reported by relevant scholars. The enthalpy of hydrate formation (or decomposition) is calculated by calculating the enthalpy change of structural water and guest molecules respectively. The enthalpy change value is negative, indicating formation, and positive, indicating decomposition. According to Table 1, the average enthalpy of decomposition (or formation) of methane hydrate is 53.32 kJ/mol and the average value of Gibbs energy is −46.26 kJ/mol within the range of 273.17–289.05 K. Similarly, as shown in Table 2, the average enthalpy of decomposition (or formation) of carbon dioxide hydrate is 63.48 kJ/mol, and the average value of Gibbs energy is −48.18 kJ/mol. Table 3 is the decomposition enthalpy of methane hydrate reported by relevant scholars. The enthalpy of hydrate formation (or decomposition) is calculated by calculating the enthalpy change of structural water and guest molecules respectively. The enthalpy change value is negative, indicating formation, and positive, indicating decomposition. According to Table 1, the average enthalpy of decomposition (or formation) of methane hydrate is 53.32 kJ/mol and the average value of Gibbs energy is −46.26 kJ/mol within the range of 273.17–289.05 K. Similarly, as shown in Table 2, the average enthalpy of decomposition (or formation) of carbon dioxide hydrate is 63.48 kJ/mol, and the average value of Gibbs energy is −48.18 kJ/mol.
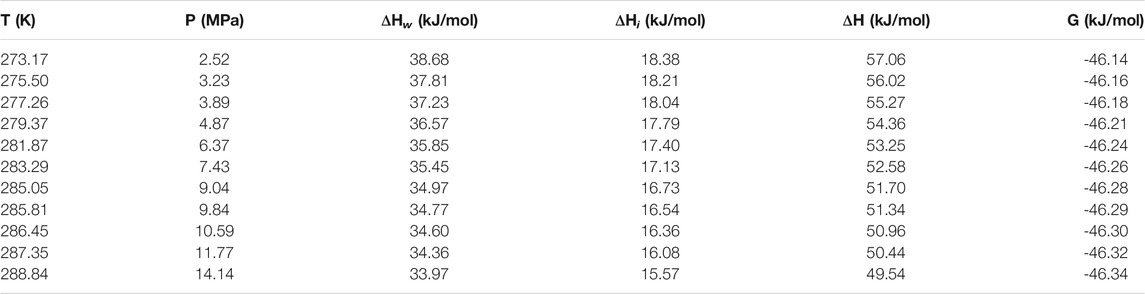
TABLE 1. Data of methane hydrate phase transition (partial).
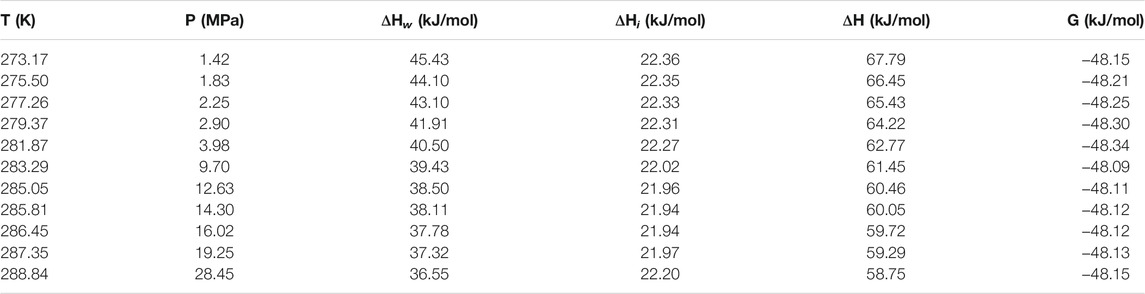
TABLE 2. Data of carbon dioxide hydrate phase transition (partial).
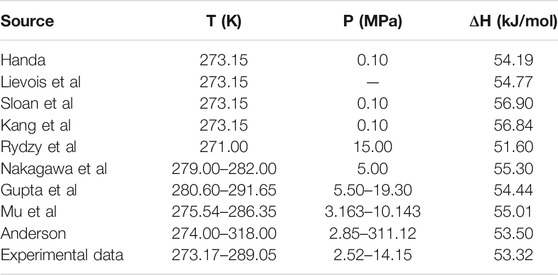
TABLE 3. Reported values of decomposition enthalpy of methane hydrate (Handa, 1986; Lievois et al., 1990; Sloan and Fleyfel, 1992; Kang et al., 2001; Anderson, 2004; Rydzy et al., 2007; Gupta et al., 2008; Nakagawa et al., 2008; Mu and von Solms, 2018b).
Eq. 16 is used to calculate the mean square error (MSE). The smaller the MSE, the higher the accuracy of the prediction model to describe the real data. The results show that the MSE of 5 methane hydrate phase equilibrium pressure points is 3.57% MPa2 and that of carbon dioxide hydrate phase equilibrium pressure on the left side of the quadruple point is 1.32% MPa2, which is lower than 5% MPa2. On the other hand, the relative error between the average decomposition enthalpy of methane hydrate calculated in this paper and the 9 average enthalpy data values reported in Table 3 is only 2.6% (Handa, 1986; Lievois et al., 1990; Sloan and Fleyfel, 1992; Kang et al., 2001; Anderson, 2004; Rydzy et al., 2007; Gupta et al., 2008; Nakagawa et al., 2008; Mu and von Solms, 2018b). It can be seen that the modified model by Kvamme and Tanaka is of high reliability, which can accurately predict the phase equilibrium of methane hydrate and carbon dioxide hydrate within a wide range of temperature and pressure.
where
Phase Equilibrium Diagram of Methane Containing Gas Hydrate
CH4 and common gases, such as C2H6, C3H8, N2, H2S, CO2, etc. are mixed to form multi-component gases which can react with water to form hydrate under low temperature and high pressure. The type of hydrate formed depends on gas composition, concentration and temperature and pressure conditions. Compared with pure gas hydrate, the formation mechanism of multi-component gas hydrates is more complex and there may be structural transformation of sI hydrate and sII hydrate. The main components of natural gas, such as CH4, C2H6, CO2 and H2S, are usually the object molecules of interest in the industrial field (Jamaluddin et al., 1991). The existence of CO2 and H2S, which are the strong hydrate forming components, is the key problem in flow assurance. Some gas fields in China, such as Puguang gas field and Yuanba gas field, have a high content of H2S and CO2 in the produced gas, and hydrate can be formed under relatively low pressure and relatively high temperature, which is easy to cause hydrate blockage in the production system. Consequently, there is a need to predict and draw the phase equilibrium curves of multi-component gases at different mole fraction ratio for engineers and researchers who want to consult the diagrams at any time. But before that happens, the validation of the theoretical model is very necessary. In Figure 4, we use the proposed method to compare the results with those obtained by classical techniques used in industry or academia, and some experimental data for hydrate equilibria involving multicomponent gas mixtures with CH4 in literature (Noaker and Katz, 1954; Sun and Chen, 2005). When comparing literature data and predictions, the perfect matching of our work with experimental data is not the ultimate goal. Because anyone who wants to use this model can make the prediction more accurate by adjusting the Langmuir constant and associated interaction parameters. To our delight, the comparison between the equilibrium pressures of methane containing gas mixture and the measured experimental data in Figure 4 shows good consistency and stability. Accordingly, it can be confirmed that the model systems is considered to be accurate enough within the scope of this work.
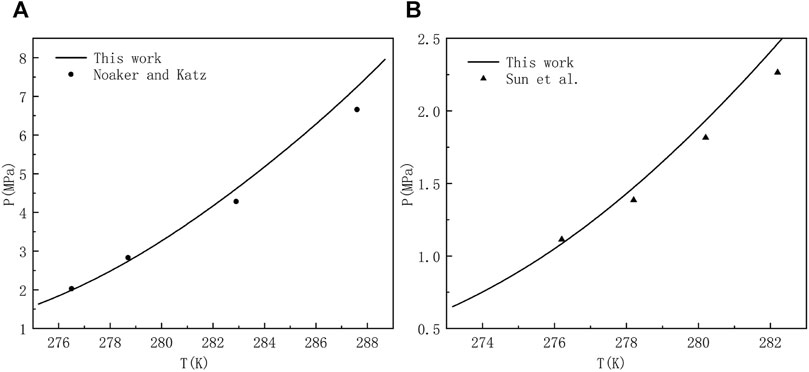
FIGURE 4. Estimated and experimental hydrate equilibrium pressures for a system of (A) 96.89 mol% methane and 3.11 mol% hydrogen sulfate (Noaker and Katz, 1954), and (B) 82.45 mol% methane, 10.77 mol% carbon dioxide, and 6.78 mol% hydrogen sulfate (Sun and Chen, 2005).
In this paper, taking CH4+CO2、CH4+C2H6、CH4+H2S、CH4+CO2+H2S as examples, the phase equilibria of methane mixed with CO2, C2H6 and H2S in different molar ratios were analyzed in the temperature range of 273.17–289.05 K. When calculating the phase equilibria of the methane containing system, the mole fraction of the gas component meets the normalization condition. As shown in Figure 5, the phase equilibrium curves of methane containing multicomponent gases at different mole fraction ratios were predicted. The uncertainty of the measurement is marked with error bars, and the pressure at the same temperature was tested twice to ensure that the measurement error is within an acceptable range. The curves of different line-types and colors show the phase equilibrium curves of different gas ratios, and the red dots are the experimental value. In the low temperature and high pressure environment, the molecules with the lowest free energy and the lowest pressure needed to fill the cavity participate in the nucleation to form a stable hydrate structure firstly based on the law of thermodynamics, and then other metastable gas molecules fill the cavity to continue to grow. CO2 molecules in sI hydrate mainly enter large cavities. Although it has been found that it can exist in small cavities, the conditions required are rather harsh. It is still unclear whether the structure of small cavity filled with CO2 molecule will be formed at the temperature above 0°C, which is beneficial to the structural stability of hydrate. Therefore, in this paper, CH4 mainly fills the small cavity of sI hydrate structure, C2H6 and CO2 fill the large cavity, while H2S can not only fill the large cavity, but also exist stably in the small cavity.
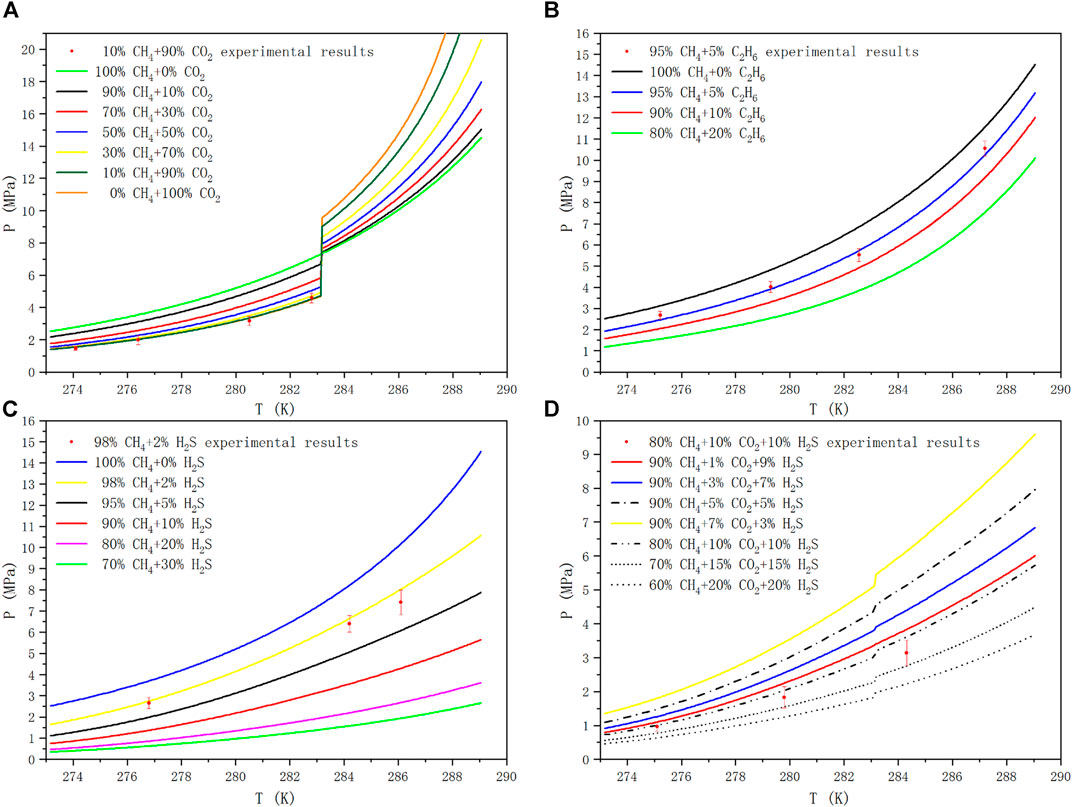
FIGURE 5. Hydrate Phase equilibrium diagram of methane containing gases at different mole fraction ratios.
One would have to investigate mixed hydrates with certain CO2 contents in order to determine what is stable and what is not. From only investigating pure methane and pure CO2 hydrates one cannot simply say that under certain conditions only methane or only CO2 would go into the hydrate structure, as always mixed hydrates would form if CO2 and CH4 are together in a mixture with water. Figure 5A is the phase equilibrium diagram of the hydrate formed by the mixtures of CH4 and CO2 at different mole fraction ratios. In the sI hydrate formed by CH4+CO2 binary gas, CH4 mainly occupies the small cavity, while CO2 occupies the large cavity, which is more stable than pure gas hydrate. The phase equilibrium pressure of gas mixture changes differently before and after the quadrupole point of CO2, and the phase splitting at the quadrupole affects the phase equilibrium conditions. It can be seen that when the temperature is lower than 283.15 K, with the increase of CO2 proportion in CH4 gas, the corresponding phase equilibrium pressure at the same temperature decreases, and with the accumulation of CO2 concentration in the mixtures, the pressure drop caused by increasing the same CO2 proportion becomes smaller and smaller. On the contrary, when the temperature is higher than 283.15 K, with the increase of CO2 ratio, the corresponding phase equilibrium pressure increases at the same temperature, and the increase of CO2 ratio leads to the increase of pressurization amplitude.
The hydrate formation mechanism of CH4+ C2H6 system is different from that of CH4+ H2S, but it shows similar trends in phase equilibrium curve. CH4 and C2H6 form sI hydrate with their pure gas, but their mixed gas can be transformed into sII structure when the composition of CH4 is in the range of 75–99 mol% (Kwon et al., 2014). The unit cell is composed of 16 12-hedral and 8 16-hedral cages of water molecules in sII hydrate, which is more stable than sI structure. More detailed studies related to structural transformation can be found in (Subramanian et al., 2000a; Subramanian et al., 2000b). Unlike ethane, hydrogen sulfide hydrolyzes in the presence of water, producing HS−, trace amounts of S2-, and positively charged hydrogen atoms. And under appropriate temperature and pressure, the stability of cage structure can be ensured by the action of dipole moment and Coulomb force. Figure 5B and Figure 5C are the phase equilibrium diagrams of sI hydrate formed by CH4+C2H6 binary gas system and CH4+H2S binary gas system at different mole fraction ratios, respectively. We can see from the figures that, compared with hydrate phase equilibrium of pure CH4, with the increase of C2H6 or H2S ratio in binary gas mixtures, the corresponding phase equilibrium pressure at the same temperature decreases, and with the accumulation of C2H6 or H2S in the mixtures, the pressure drop caused by increasing the same C2H6 or H2S ratio becomes smaller and smaller.
Figure 5D shows the phase equilibrium diagrams of hydrate formation from CH4, CO2 and H2S ternary mixtures at different mole fraction ratios. It can be seen from Figure 5D that in the temperature range of 273.17–289.05 K, if the CH4 content in the mixtures remains unchanged (90 mol%), the higher the CO2 content is, the lower the average value of Gibbs energy is, and the corresponding phase equilibrium pressure is higher at the same temperature. If the ratio of CO2 and H2S remains unchanged, the lower the content of CH4, the lower the mean free energy and the lower the corresponding phase equilibrium pressure at the same temperature. Compared with the CH4+CO2 binary mixtures system, H2S not only reduces the equilibrium pressure, but also reduces the influence of liquid CO2 on the equilibrium system to some extent. Therefore, the pressure mutation in the CH4+CO2+H2S ternary mixtures system is relatively moderate. The deviation of the predicted results may be due to the underestimated effect of small molecule gas adsorption into small pores on the reduction of the formation pressure of hydrogen sulfide hydrate. Our calculations show that the magnitudes of MSE are respectively 1.2, 4.8, 15.12 and 9.20% MPa2 for CH4+CO2, CH4+C2H6, CH4+H2S and CH4+CO2+H2S systems, in which 14 hydrate phase equilibrium pressure data are used. Even though remarkable deviations occur for the higher temperature regions in the presence of hydrogen sulfide, the agreement is sufficiently fair for analysis of hydrate formation and decomposition in reservoirs and pipelines.
H2S can enter both large and small cavities simultaneously. When it enters the cavity of the hydrate, the positive hydrogen atom and the negative oxygen atom in the inner wall of the cavity attract each other by Coulomb force, which increases the stability of the hydrate. Thus, the hydrate equilibrium conditions are shifted to areas where it is more likely to be generated or decomposed. Therefore, the phase equilibrium data of hydrate in the system of 90% CH4+10% C2H6 (also CO2 and H2S) were compared in this paper, and the free energy was calculated. The results are shown in Table 4. It can be seen from the table that the hydrate free energy of the binary system under the same conditions is CH4+H2S system < CH4+C2H6 system < CH4+CO2 system. These three values have little difference in within the uncertainties of their determination, so they are just a simple description of a small change here.
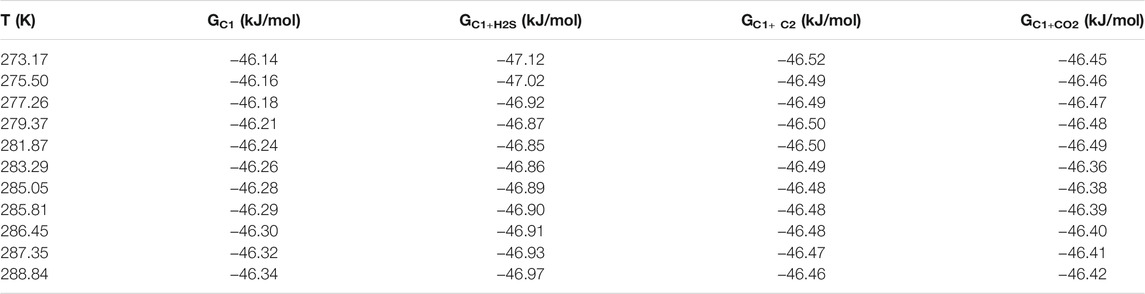
TABLE 4. Calculated results of free energy of hydrate in 90 mol% CH4+10 mol% C2H6/CO2/H2S system. G in the table represents Gibbs free energy.
Conclusion
In the present study, the effects of different mole fractions of CO2, C2H6 and H2S on the phase equilibrium of methane hydrate by the hydrate electroacoustic testing device were mainly investigated, and the thermodynamic parameters such as decomposition or formation enthalpy and free energy of hydrate were calculated and analyzed by using the modified Kvamme-Tanaka thermodynamic model. The thermodynamic process of hydrate decomposition and formation in methane containing system was analyzed and some new and accurate experimental data, calculated results and phase equilibrium curves of methane containing system have been obtained. Due to the consideration of the interaction between the motion of guest molecules and the vibration of crystal lattice, the model exhibits a good performance. The magnitudes of MSE percent are respectively 1.2, 4.8, 15.12 and 9.20 MPa2 for CH4+CO2, CH4+C2H6, CH4+H2S and CH4+CO2+H2S systems, and the values are as low as 3.57 and 1.32 MPa2 for pure methane and carbon dioxide, respectively. Accordingly, the model systems is considered to be accurate enough within the scope of this work. The results are discussed from three aspects: theoretical analysis, numerical calculation and laboratory experiment. In the range of 273.17–289.05 K, the average decomposition enthalpies of CH4 hydrate and CO2 hydrate are 53.32 kJ/mol and 63.48 kJ/mol, respectively, and the average value of Gibbs free energy is −46.26 kJ/mol and −48.18 kJ/mol, respectively. The free energy of CO2 hydrate is 2 kJ/mol lower than that of CH4 hydrate on the left side of the quadruple point, and 1.83 kJ/mol lower than that of CH4 hydrate after the quadruple point. CO2 hydrate is more stable than CH4 hydrate in a wide range of temperature and pressure. Additionally, with the increase of the mole ratio of C2H6 or H2S in the binary system containing methane, the equilibrium pressure of hydrate decreases at the same temperature. When the temperature is lower than 283.15 K, the corresponding phase equilibrium pressure decreases with the increase of the molar ratio of CO2 in CH4+CO2 binary system, but the reverse trend appears when the temperature is higher than 283.15 K. In the ternary system of CH4+CO2+H2S mixtures, the higher the CO2 content is, the lower the average value of Gibbs energy is, and the higher the phase equilibrium pressure is at the same temperature. The lower the CH4 content, the lower the average value of Gibbs energy and the lower the phase equilibrium pressure at the same temperature. This study is helpful for engineers and technicians to accurately and conveniently estimate the thermodynamic parameters of hydrate, which is of great significance to the safe production and efficient development of hydrate.
Data Availability Statement
The original contributions presented in the study are included in the article/Supplementary Material, further inquiries can be directed to the corresponding author.
Author Contributions
HL performed the experiments, simulations, thermodynamic calculations and wrote the manuscript. YD designed the study and revised the whole manuscript. JP organized the database, assisted in research design, manuscript writing and review. NW contributed in project management, experimental design and manuscript review process. All authors contributed to the article and approved the submitted version.
Funding
The research is supported by the 111 Project (D21025), National Key Research and Development Program (2019YFC0312300), National Natural Science Foundation Item of China (U20B6005-05, 51874252) and Open Fund of State Key Laboratory Of Oil and Gas Reservoir Geology and Exploitation (Southwest Petroleum University) (PLN 2021–02, PLN 2021–03, PLN201816).
Conflict of Interest
Author HL is employed by CNOOC (China) Co., Ltd. Hainan, Haikou.
The remaining authors declare that the research was conducted in the absence of any commercial or financial relationships that could be construed as a potential conflict of interest.
Publisher’s Note
All claims expressed in this article are solely those of the authors and do not necessarily represent those of their affiliated organizations, or those of the publisher, the editors and the reviewers. Any product that may be evaluated in this article, or claim that may be made by its manufacturer, is not guaranteed or endorsed by the publisher.
Acknowledgments
The authors would like to express their gratitude to the researchers of Southwest Petroleum University, especially professor Kvamme and his colleagues for their guidance.
References
Anderson, G. K. (2004). Enthalpy of Dissociation and Hydration Number of Methane Hydrate from the Clapeyron Equation. The J. Chem. Thermodynamics 36, 1119–1127. doi:10.1016/j.jct.2004.07.005
Anderson, R., Llamedo, M., Tohidi, B., and Burgass, R. W. (2003). Experimental Measurement of Methane and Carbon Dioxide Clathrate Hydrate Equilibria in Mesoporous Silica. J. Phys. Chem. B 107, 3507–3514. doi:10.1021/jp0263370
Anwar, M. N., Fayyaz, A., Sohail, N. F., Khokhar, M. F., Baqar, M., Khan, W. D., et al. (2018). CO2 Capture and Storage: A Way Forward for Sustainable Environment. J. Environ. Manage. 226, 131–144. doi:10.1016/j.jenvman.2018.08.009
Babu, P., Kumar, R., and Linga, P. (2013). Medium Pressure Hydrate Based Gas Separation (HBGS) Process for Pre-combustion Capture of Carbon Dioxide Employing a Novel Fixed Bed Reactor. Int. J. Greenhouse Gas Control. 17, 206–214. doi:10.1016/j.ijggc.2013.05.010
Babu, P., Kumar, R., and Linga, P. (2014). Unusual Behavior of Propane as a Co-guest during Hydrate Formation in Silica Sand: Potential Application to Seawater Desalination and Carbon Dioxide Capture. Chem. Eng. Sci. 117, 342–351. doi:10.1016/j.ces.2014.06.044
Chen, G., and Guo, T. (1996). Thermodynamic Modeling of Hydrate Formation Based on New Concepts. Fluid Phase Equilibria 122 (1-2), 43–65. doi:10.1016/0378-3812(96)03032-4
Collett, T. S. (2009). Natural Gas Hydrates: Energy Resource Potential and Associated Geologic Hazards. Tulsa, U.S.A: American Association of Petroleum Geologists.
Darbouret, M., Cournil, M., and Herri, J. M. (2005). Rheological Study of TBAB Hydrate Slurries as Secondary Two-phase Refrigerants. Int. J. Refrig. 28, 63–671. doi:10.1016/j.ijrefrig.2005.01.002
De Roo, J. L., Peters, C. J., Lichtenthaler, R. N., and Diepen, G. A. M. (1983). Occurrence of Methane Hydrate in Saturated and Unsaturated Solutions of Sodium Chloride and Water in Dependence of Temperature and Pressure. AIChE J. 29, 651–657. doi:10.1002/aic.690290420
Du, Y., and Guo, T.-M. (1990). Prediction of Hydrate Formation for Systems Containing Methanol. Chem. Eng. Sci. 45 (4), 893–900. doi:10.1016/0009-2509(90)85011-2
Fan, S.-S., and Guo, T.-M. (1999). Hydrate Formation of CO2-Rich Binary and Quaternary Gas Mixtures in Aqueous Sodium Chloride Solutions. J. Chem. Eng. Data 44, 829–832. doi:10.1021/je990011b
Gupta, A., Lachance, J., Sloan, E. D., and Koh, C. A. (2008). Measurements of Methane Hydrate Heat of Dissociation Using High Pressure Differential Scanning Calorimetry. Chem. Eng. Sci. 63, 5848–5853. doi:10.1016/j.ces.2008.09.002
Handa, Y. P. (1986). Compositions, Enthalpies of Dissociation, and Heat Capacities in the Range 85 to 270 K for Clathrate Hydrates of Methane, Ethane, and Propane, and Enthalpy of Dissociation of Isobutane Hydrate, as Determined by a Heat-Flow Calorimeter. J. Chem. Thermodynamics 18, 915–921. doi:10.1016/0021-9614(86)90149-7
Huang, Q., Sun, C., Chen, G., and Yang, L. (2005). Experiment and Calculation of Hydrate Formation Conditions of Sour Natural Gas Containing Methane, Carbon Dioxide and Hydrogen Sulfide (In Chinese). J. Chem. Eng. 07, 1159–1163.
Jamaluddin, A. K. M., Kalogerakis, N., and Bishnoi, P. R. (1991). Hydrate Plugging Problems in Undersea Natural Gas Pipelines under Shutdown Conditions. J. Pet. Sci. Eng. 5, 323–335. doi:10.1016/0920-4105(91)90051-n
John, V. T., Papadopoulos, K. D., and Holder, G. D. (1985). A Generalized Model for Predicting Equilibrium Conditions for Gas Hydrates. AIChE J. 31 (2), 252–259. doi:10.1002/aic.690310212
Kang, S.-P., Lee, H., and Ryu, B.-J. (2001). Enthalpies of Dissociation of Clathrate Hydrates of Carbon Dioxide, Nitrogen, (Carbon Dioxide+ Nitrogen), and (Carbon Dioxide + Nitrogen+ Tetrahydrofuran). J. Chem. Thermodynamics 33, 513–521. doi:10.1006/jcht.2000.0765
Kvamme, B., Coffin, R. B., Zhao, J., Wei, N., Zhou, S., Li, Q., et al. (2019). Stages in the Dynamics of Hydrate Formation and Consequences for Design of Experiments for Hydrate Formation in Sediments. Energies 12, 3399. doi:10.3390/en12173399
Kvamme, B. (2019). Environmentally Friendly Production of Methane from Natural Gas Hydrate Using Carbon Dioxide. Sustainability 11 (7), 1964. doi:10.3390/su11071964
Kvamme, B., and Tanaka, H. (1995). Thermodynamic Stability of Hydrates for Ethane, Ethylene, and Carbon Dioxide. J. Phys. Chem. 99, 7114–7119. doi:10.1021/j100018a052
Kwon, M., Lee, J.-W., and Lee, H. (2014). Temperature-Dependent Structural Transitions in Methane-Ethane Mixed Gas Hydrates. J. Phys. Chem. C 118 (49), 28906–28913. doi:10.1021/jp5102219
Lievois, J. S., Perkins, R., Martin, R. J., and Kobayashi, R. (1990). Development of an Automated, High Pressure Heat Flux Calorimeter and its Application to Measure the Heat of Dissociation and Hydrate Numbers of Methane Hydrate. Fluid Phase Equilibria 59, 73–97. doi:10.1016/0378-3812(90)85147-3
Liu, L., Sun, Z., Zhang, L., Wu, N., Qin, Y., Jiang, Z., et al. (2019). Progress in Global Gas Hydrate Development and Production as a New Energy Resource. Acta Geologica Sinica 93 (03), 731–755. doi:10.1111/1755-6724.13876
Makogon, Y. F. (2010). Natural Gas Hydrates - A Promising Source of Energy. J. Nat. Gas Sci. Eng. 2, 49–59. doi:10.1016/j.jngse.2009.12.004
Mei, D.-H., Liao, J., Yang, J.-T., and Guo, T.-M. (1996). Experimental and Modeling Studies on the Hydrate Formation of a Methane + Nitrogen Gas Mixture in the Presence of Aqueous Electrolyte Solutions. Ind. Eng. Chem. Res. 35, 4342–4347. doi:10.1021/ie9601662
Mohammadi, A. H., Anderson, R., and Tohidi, B. (2005). Carbon Monoxide Clathrate Hydrates: Equilibrium Data and Thermodynamic Modeling. AIChE J. 51 (10), 2825–2833. doi:10.1002/aic.10526
Moradi, G., and Khosravani, E. (2012). Application of PRSV2 Equation of State to Predict Hydrate Formation Temperature in the Presence of Inhibitors. Fluid Phase Equilibria 333, 18–26. doi:10.1016/j.fluid.2012.07.019
Mu, L., and von Solms, N. (2018). Hydrate thermal Dissociation Behavior and Dissociation Enthalpies in Methane-Carbon Dioxide Swapping Process. J. Chem. Thermodynamics 117, 33–42. doi:10.1016/j.jct.2017.08.018
Mu, L., and von Solms, N. (2018). Hydrate thermal Dissociation Behavior and Dissociation Enthalpies in Methane-Carbon Dioxide Swapping Process. J. Chem. Thermodynamics 117, 33–42. doi:10.1016/j.jct.2017.08.018
Nakagawa, R., Hachikubo, A., and Shoji, H. (2008). “Dissociation and Specific Heats of Gas Hydrates under Submarine and Sublacustrine Environments,” in The 6th International Conference on Gas Hydrates (ICGH 2008), July 6-10, 2008, Vancouver, Canada.
Ng, H.-J., and Robinson, D. B. (1976). The Measurement and Prediction of Hydrate Formation in Liquid Hydrocarbon-Water Systems. Ind. Eng. Chem. Fund. 15 (4), 293–298. doi:10.1021/i160060a012
Noaker, L. J., and Katz, D. L. (1954). Gas Hydrates of Hydrogen Sulfide-Methane Mixtures. J. Petrol. Technol. 6, 135–137. doi:10.2118/367-g
Ohgaki, K., Makihara, Y., and Takano, K. (1993). Formation of CO2 Hydrate in Pure and Sea Waters. J. Chem. Eng. Jpn. 26, 558–564. doi:10.1252/jcej.26.558
Parrish, W. R., and Prausnitz, J. M. (1972). Dissociation Pressures of Gas Hydrates Formed by Gas Mixtures. Ind. Eng. Chem. Proc. Des. Dev. 11 (1), 26–35. doi:10.1021/i260041a006
Qorbani, K. (2017). “Non-equilibrium Modelling of Hydrate Phase Transition Kinetics in Sediments,” (Bergen: University of Bergen). Doctoral Dissertation.
Rydzy, M. B., Schicks, J. M., Naumann, R., and Erzinger, J. (2007). Dissociation Enthalpies of Synthesized Multicomponent Gas Hydrates with Respect to the Guest Composition and Cage Occupancy. J. Phys. Chem. B 111, 9539–9545. doi:10.1021/jp0712755
Seo, Y.-T., Lee, H., and Yoon, J.-H. (2001). Hydrate Phase Equilibria of the Carbon Dioxide, Methane, and Water System. J. Chem. Eng. Data 46, 381–384. doi:10.1021/je000237a
Sloan, E. D., and Fleyfel, F. (1992). Hydrate Dissociation Enthalpy and Guest Size. Fluid Phase Equilibria 76, 123–140. doi:10.1016/0378-3812(92)85082-j
Soave, G. (1972). Equilibrium Constants from a Modified Redlich-Kwong Equation of State. Chem. Eng. Sci. 27, 1197–1203. doi:10.1016/0009-2509(72)80096-4
Subramanian, S., Ballard, A. L., Kini, R. A., Dec, S. F., and Sloan, E. D. (2000). Structural Transitions in Methane+ethane Gas Hydrates - Part I: Upper Transition point and Applications. Chem. Eng. Sci. 55 (23), 5763–5771. doi:10.1016/s0009-2509(00)00162-7
Subramanian, S., Kini, R. A., Dec, S. F., and Sloan, E. D. (2000). Evidence of Structure II Hydrate Formation from Methane+ethane Mixtures. Chem. Eng. Sci. 55, 1981–1999. doi:10.1016/s0009-2509(99)00389-9
Sun, C.-Y., and Chen, G.-J. (2005). Modelling the Hydrate Formation Condition for Sour Gas and Mixtures. Chem. Eng. Sci. 60 (17), 4879–4885. doi:10.1016/j.ces.2005.04.013
Sun, W., Wei, Na., Zhao, J., Kvamme, B., Zhou, S., Zhang, L., et al. (2021). Imitating Possible Consequences of Drilling through marine Hydrate Reservoir. Energy 239, 121802. doi:10.1016/j.energy.2021.121802
Sun, W., Wei, N., Zhao, J., Zhou, S., Zhang, L., Li, Q., et al. (2021). Wellbore Temperature and Pressure Field in Deep-Water Drilling and the Applications in Prediction of Hydrate Formation Region. Front. Energ. Res. 9, 696392. doi:10.3389/fenrg.2021.696392
Sun, Z., Fan, S., Guo, K., Shi, L., and Wang, R. (2002). Experimental Study and Theoretical Prediction on the Formation Conditions of Natural Gas Hydrate (In Chinese). J. Xi'an Jiaotong Univ. 01, 16–19.
Tsimpanogiannis, I. N., Michalis, V. K., and Economou, I. G. (2019). Enthalpy of Dissociation of Methane Hydrates at a Wide Pressure and Temperature Range. Fluid Phase Equilibria 489, 30–40. doi:10.1016/j.fluid.2019.01.024
van der Waals, J. H., and Platteeuw, J. C. (1959). Clathrate Solutions. Adv. Chem. Phys. 2 (1), 1–57.
Vedachalam, N., Srinivasalu, S., Rajendran, G., Ramadass, G. A., and Atmanand, M. A. (2015). Review of Unconventional Hydrocarbon Resources in Major Energy Consuming Countries and Efforts in Realizing Natural Gas Hydrates as a Future Source of Energy. J. Nat. Gas Sci. Eng. 26, 163–175. doi:10.1016/j.jngse.2015.06.008
Veluswamy, H. P., Wong, A. J. H., Babu, P., Kumar, R., Kulprathipanja, S., Rangsunvigit, P., et al. (2016). Rapid Methane Hydrate Formation to Develop a Cost Effective Large Scale Energy Storage System. Chem. Eng. J. 290, 161–173. doi:10.1016/j.cej.2016.01.026
Wei, N., Zhao, J., Liu, A., Zhou, S., Zhang, L., and Jiang, L. (2021). Evaluation of Physical Parameters and Construction of the Classification System of Natural Gas Hydrate in the Northern South China Sea. Energy Fuels 35, 7637–7645. doi:10.1021/acs.energyfuels.0c04043
Yang, S. O., Cho, S. H., Lee, H., and Lee, C. S. (2001). Measurement and Prediction of Phase Equilibria for Water + Methane in Hydrate Forming Conditions. Fluid Phase Equilibria 185, 53–63. doi:10.1016/s0378-3812(01)00456-3
Ye, J., Qin, X., Xie, W., Ma, B., Qiu, H., Liang, J., et al. (2020). The Second Natural Gas Hydrate Production Test in the South China Sea. China Geology. 3 (2), 197–209.
ZareNezhad, B., and Ziaee, M. (2013). Accurate Prediction of H2S and CO2 Containing Sour Gas Hydrates Formation Conditions Considering Hydrolytic and Hydrogen Bonding Association Effects. Fluid Phase Equilibria 356, 321–328. doi:10.1016/j.fluid.2013.07.055
Zhao, J., Zhang, L., Wei, N., Zhou, S., and Li, Q. (2019). “New Development of Gas Hydrate Exploitation in the World—China Has Led the Test Production Level of Other Countries,” in Proceedings of the International Field Exploration and Development Conference 2019, Xi’an, China,, October 16-18, 2020, Springer Nature Singapore Pte Ltd.
Keywords: hydrate, methane, thermodynamics, phase equilibrium, enthalpy, free energy
Citation: Liang H, Duan Y, Pei J and Wei N (2021) Study on Hydrate Phase Equilibrium Diagram of Methane Containing System Based on Thermodynamic Model. Front. Energy Res. 9:743296. doi: 10.3389/fenrg.2021.743296
Received: 18 July 2021; Accepted: 21 September 2021;
Published: 06 October 2021.
Edited by:
Bamidele Victor Ayodele, Universiti Tenaga Nasional, MalaysiaReviewed by:
Chang-Yu Sun, China University of Petroleum, ChinaMay Ali Alsaffar, University of Technology, Iraq
Copyright © 2021 Liang, Duan, Pei and Wei. This is an open-access article distributed under the terms of the Creative Commons Attribution License (CC BY). The use, distribution or reproduction in other forums is permitted, provided the original author(s) and the copyright owner(s) are credited and that the original publication in this journal is cited, in accordance with accepted academic practice. No use, distribution or reproduction is permitted which does not comply with these terms.
*Correspondence: Jun Pei, YXNoYXJleUB5ZWFoLm5ldA==