 Jie He1
 Xiaobing Niu2Qingchun Meng3Fajun Guo4Hongmei Wang4Yicang Liu2Lianguo Wang2Yongmei Kang2Kelai Hu2
 Yushuang Zhu1*
- 1State Key Laboratory of Continental Dynamics/Department of Geology, Northwest University, Xi’an, China
- 2No. 11 Oil Production Plant, PetroChina Changqing Oilfield Company, Xifeng, China
- 3Development Department of Huabei Oilfield Company, Renqiu, China
- 4Research Institute of Exploration and Development of Huabei Oilfield Company, Renqiu, China
Compared with conventional reservoirs, shale gas reservoirs usually have no natural productivity or lower productivity, and the rate of production decline is high in the later stage. The production of shale gas can be effectively improved by designing reasonably or fracturing. Therefore, it is critical for shale gas reservoir to study how to design proper parameters to make it effectively developed. Based on data of block-A region of the Zhejiang gas field, considering the contribution of rock compression to the production, the productivity formula of horizontal well at different seepage stages is deduced. Data from block-A are verified by orthogonal experiment, including gas reservoir parameters and engineering parameters. The results show that the order of reservoir parameters that affect the development of shale gas is as follows: Langmuir pressure, diffusion coefficient, cross flow coefficient, and Langmuir volume; the order of engineering parameters that affect the development of shale gas is as follows: number of fractures, horizontal section length, production pressure, fractures length, row spacing, and well spacing. The research results have been applied to the Zhejiang gas field. The initial rate of decline after adjustment is reduced by 26.08% and production increases by 17.06% after stabilization compared to wells without adjustment parameters. The research has important reference significance for the efficient development of similar gas reservoirs.
Introduction
With the continuous development of economy at home and abroad, the demand for coal, oil, and natural gas resources is increasing (Ma et al., 2020a; Ma et al., 2020b; Milkov et al., 2020). Shale gas is rich in resources. As a representative of clean energy, shale gas has been widely paid attention to all over the world and plays an irreplaceable role in solving the current energy problems (Szolucha, 2019; Shu et al., 2020; Solarin et al., 2020; He et al., 2020).
The past 2 decades have borne remarkable progress in our understanding of flow mechanisms and numerical simulation approaches of shale gas reservoir, and Tao Zhang reviews the flow mechanism and numerical simulation approaches of shale gas reservoirs in 2018 according to a much larger number of publications in recent years (Zhang et al., 2018). Within the framework of pore network models, it is easy to highlight the effects of wettability conditions on the transport of two-phase systems. Tao Zhang conducted a preliminary investigation on the role of wettability conditions on the flow of a two-phase system in porous media in 2015 (Zhang et al., 2015). Tao Zhang presented two Lattice Boltzmann schemes to model corresponding flow in conventional channels and tight matrix with very small pores considering gas sorption in shale reservoirs for the first time in 2019, proved to be efficient and accurate by reasonable results (Zhang and Sun, 2019). Tao Zhang proposed a deep learning algorithm to accelerate NVT flash calculations with capillary pressure for phase behavior modeling in nanopores and tested it by two reservoir fluid examples in 2020, driving multiphase flow simulation (Zhang et al., 2020). Wan and Wang et al. found that horizontal wells can increase shale gas production to a large extent (Wang and Guo, 2019; Wan et al., 2020). Ajayi and Tan et al. found that horizontal well distance can influence the stress interference effect between wells that optimal development parameters exist (Ajayi and Schatzel, 2020; Tan et al., 2020; Tavakkoli et al., 2020).
Horizontal well can increase the surface of gas desorption by setting the parameters reasonably through using the mutual interference between the horizontal sections. At present, the theory is still in the research stage at home and abroad. In this research, the productivity equations of shale gas horizontal wells are derived in different percolation stages based on block-A of the Zhejiang gas field in Sichuan Basin.
Geological Setting
Block-A in the Zhejiang gas field of Lower Yangzi area is selected in this study. Wang and Guo found that the distribution of Longtan formation in the Permian period is stable (Wang and Guo, 2019). It is located in the deep-water shelf sedimentary zone belt of hydrostatic water and anoxic and reducing environment. Due to the large reservoir thickness, high TOC, content, large porosity, high brittle mineral content, large brittleness index, and high gas content, a set of nearly 90 m black organic-rich shale reservoirs was formed (Ye et al., 2018; Yang et al., 2020; Yin et al., 2020), as shown in Table 1, and more information about the region is shown in Supplementary Material.
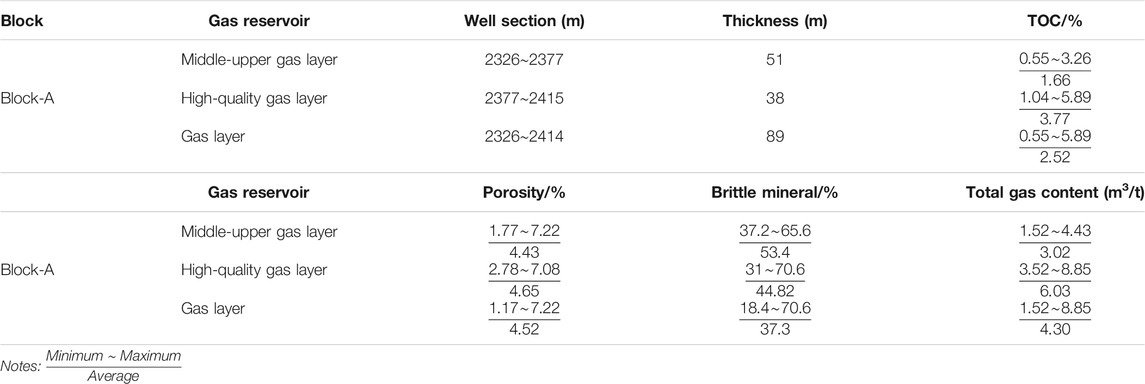
TABLE 1. Table of A shale gas evaluation parameters in Longtan formation.
Methods
In the process of establishing a productivity model, the assumed conditions are as follows: ①Shale gas reservoir belongs to dual media, which contains two kinds of fluids: gas and water phase. ②The water, matrix, fracture, and gas in the reservoir can be compressed, and they are all constant, without considering the influence of gravity. ③Due to the decrease of reservoir pressure, natural gas is desorbed from the matrix at first, then enters the fracture in the form of diffusion under the action of concentration difference, and finally enters the wellbore as Darcy flow. ④In the process of exploitation, the free state and adsorption state of shale gas are in dynamic equilibrium, and the temperature of the reservoir keeps invariant.
Sectional Fracturing Flow Characteristics of Shale Gas Horizontal Wells
Early linear flow: early linear outflow is the early stage of segmented fracturing, which means that the gas flows to the wellbore perpendicular to the direction of the fracture (Figure 1).
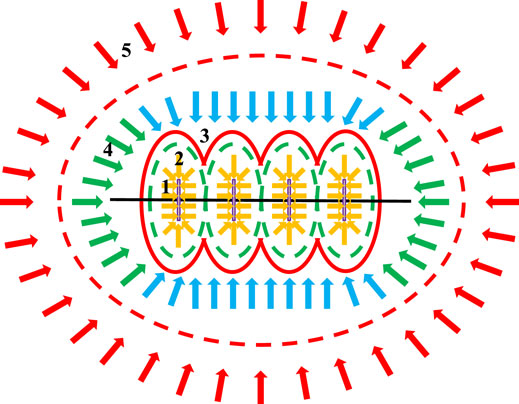
FIGURE 1. Sectional fracturing flow of shale gas horizontal well.
Early radial flow: the radial flow of a single fracture is similar to the radial flow of the unfractured horizontal well, and the fracture is equivalent to the horizontal section.
The radial flow front of a single crack continues to advance, resulting in interfracture interference effect and the emergence of fracture boundary flow.
Compound linear flow: after the interference of the fracture boundary, the compound linear flow appears, which is dominated by the linear flow perpendicular to the horizontal section and supplemented by the elliptical seepage at both ends of well.
System radial flow: with the production, when the two flow scales in the compound linear flow reach the same, the system radial flow will appear at a distance from the horizontal well.
Steady-State Productivity Formula of Fractured Horizontal Wells
Single Fracture Productivity Model
Assuming that the length of a horizontal well is L, there are n clusters of fractures uniformly distributed around the production well on each fracture. As shown in Figure 2, the height of the fracture is equal to the thickness of the formation, and the reservoir is divided into 2n sectors vertically and around the wellbore. The flow network of each fan is the same (Zheng H. et al., 2020; Zheng S. et al., 2020; Zheng Y. et al., 2020).
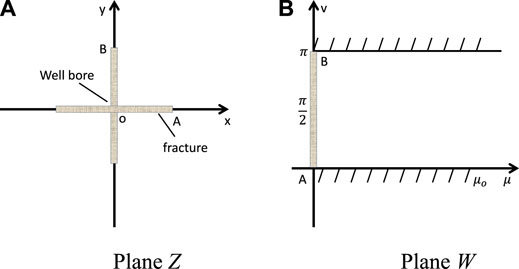
FIGURE 2. Distribution map of 2 vertical fractures. (A) Plane Z. (B) Plane W.
Uo denotes the distance between the constant pressure boundary and the π line source in the W plane; qi denotes the output of cracks in No.i of Z plane, m3/s; Pe denotes the pressure at the supply boundary, MPa; Pw denotes the production pressure, MPa.
When the number of fracture clusters is 1 (because the fracture runs through the entire wellbore, so n = 2), the output of a fracture is (Guo et al., 2019).
Suppose that the stimulation ratio of n-cluster cracks is m, re/rw = 104, re/Lf = 50, 20, 10, and n = 4, 6, 8, 12; the calculation results are as shown in Table 2. It can be seen that when the number of clusters in each fracture is doubled, the average output increases by 1.22–1.74%, while when the length of the fracture is doubled, the average output increases by 2.29–3.13%.
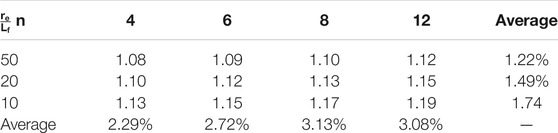
TABLE 2. The stimulation ratio of fractures.
Productivity Model of Fractured Horizontal Well
With the progress of mining, in the process of fracture boundary flow, when the discharge area between two fractures overlaps, the seepage field in this area will interfere with each other and reduce the seepage resistance. Suppose that, in a horizontal well with length L, there are Nf artificial fractures, the thickness of the reservoir is h, the length of the fracture is 2Lf, the permeability is K, and the height of the fracture is equal to the thickness of the reservoir (Figure 3).
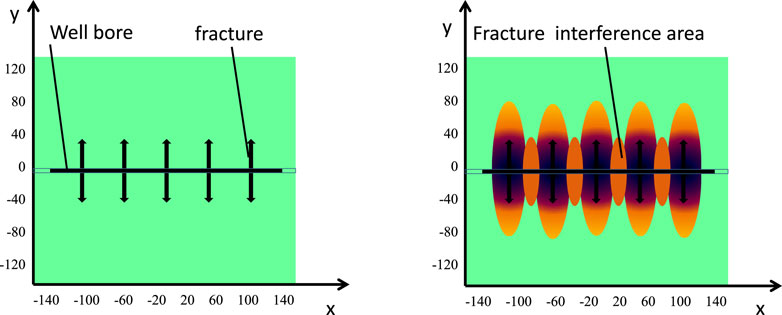
FIGURE 3. Diagram of interfracture interference in horizontal wells.
When the number of fractures Nf is odd, taking the intermediate fracture as the x-axis and the wellbore direction of the horizontal well as the y-axis, the rest of the fractures are symmetrically distributed on both sides of the x-axis (Figure 4). Assuming that the distance between the fractures is d, the longitudinal coordinates of the fractures are 0, ±d, and ±d.
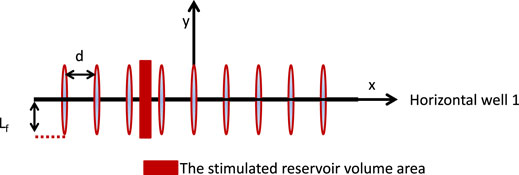
FIGURE 4. Schematic diagram of interference zone between fractures by synchronous pressure of shale gas.
According to the potential theory, an n-cluster crack is parallel to the x-axis, the ordinate is y0, and the yield is qf. The potential generated by an arbitrary point on the x-y plane (x,y) is φ(x,y).
When the number of cracks is Nf, these cracks will interfere with each other on the x-y plane. The potential generated is Φ(x,y) at the point M(x,y).
Therefore, when the flow between cracks interferes with each other, the output of a crack is
Simultaneous Fracturing Productivity Model
In the process of shale gas, synchronous fracturing or zipper fracturing is usually used. By using the interaction of fracture tip stress and maximizing the opening of fractures, complex fracture grids can be formed in the reservoir, which corresponds to the third to fifth stages of the shale gas reservoir percolation stage, as shown in Figures 1, 5.
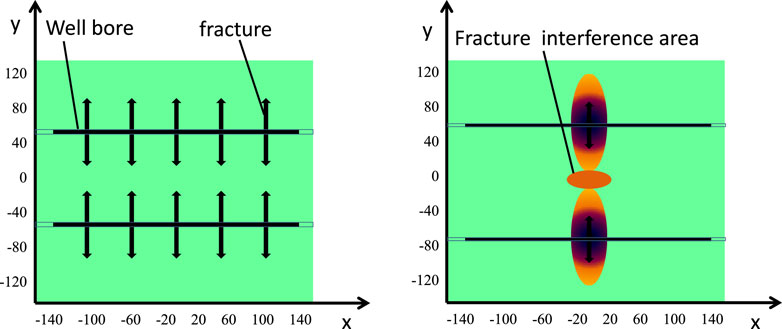
FIGURE 5. Schematic diagram of synchronous fracture tip interference in horizontal well.
Crack Tip Stress Interference
As shown in Figure 6, three horizontal wells are uniformly distributed in the reservoir, forming a synchronous fracturing well group. During fracturing, the operation is carried out on three wells at the same time, making use of the interference effect caused by fracture tip stress, thus forming a complex fracture grid in the reservoir, increasing the effect of reconstruction volume.
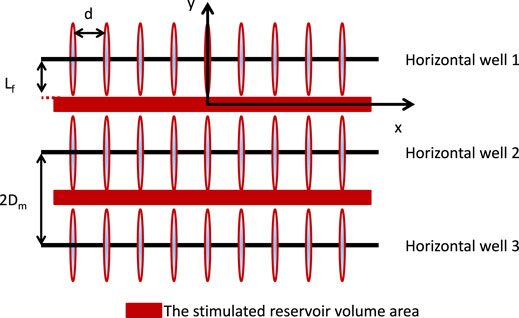
FIGURE 6. Schematic diagram of crack tip interference.
According to the above physical model, assuming that the number of fractures in each horizontal well is Nf and the output of each fracture is qf, each fracture is regarded as a point-converge, the No.i fracture of well-2 is taken as the object, and the stress interference is caused by the No.i fracture of well-1. The potential of any point M(x,y) in the formation is
When the number of fractures in well-1 is Nf, the production caused by stress interference at the location of fracture No.i in well-2 is as follows:
From the above equation, it can be concluded that, with the increase of distance between two rows, the production increases gradually and the increment decreases. Therefore, there is an optimal distance between horizontal wells in the factory operation.
Stress Interference at Seam End
As shown in Figure 7, the factory diagram of a group of wells shows that the distance between the fracture ends of two horizontal wells is 2Dn, and the end of each production well is regarded as a particle. The x-axis is established by the extension line of the horizontal section of well-2 and well-5, and the y-axis is established by the middle vertical line between the fracture ends. The potential of any point N (x,y) caused by the stress interference of well −4 to well −1 is Φ(x,y).
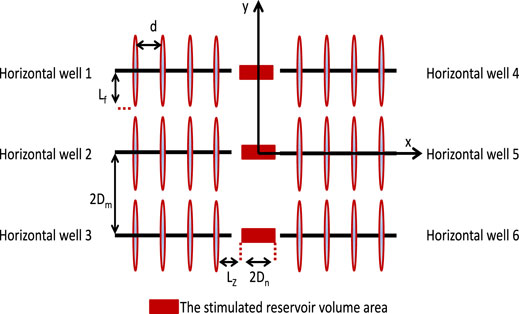
FIGURE 7. Schematic diagram of interference effect at fracture end.
To sum up, in the factory of a group of wells, the production of any horizontal well caused by the stress interference of symmetrical wells is (take the intermediate well as an example)
It can be seen from the above formula that, under the condition that other reservoir parameters remain unchanged, with the increase of well spacing, the cumulative production of shale gas increases, while the increment decreases. Therefore, in the design process of shale gas well spacing, the fracture length and the distance between fractures in fracturing should be considered.
Data and Experimental Measurements
According to the productivity model established in this paper, the following shale gas fields in block-A of Sichuan Basin are taken as an example to analyze the factors affecting productivity. The geological parameters are set in Table 3.
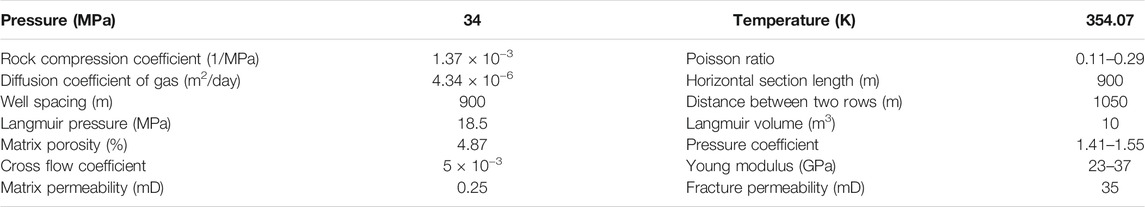
TABLE 3. Model parameters.
Model Verification
When the effects of matrix compression and interwell interference are not considered, the daily production and cumulative production of shale gas horizontal well are calculated by using the Eclipse and the mathematical model established in this paper, respectively. From the model comparison curve shown in Figure 8, it can be seen that the simulation errors of the model established in this paper are lower than those of the Eclipse, indicating that the model established is reliable for the simulation of shale gas. Meanwhile, validation was conducted using data from two other gas fields, and the data and results are shown in Supplementary Material.
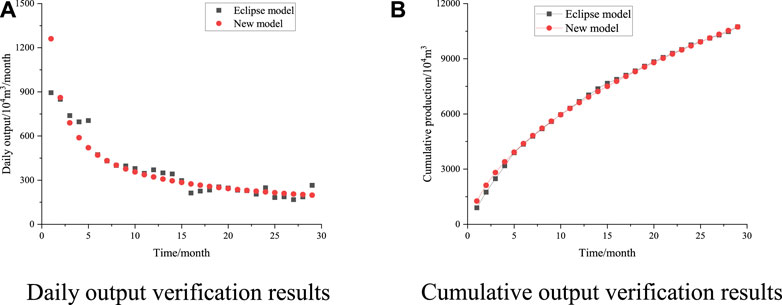
FIGURE 8. Model contrast curve. (A) Daily output verification results. (B) Cumulative output verification results.
Sensitivity Analysis of Geological Parameters
Simulate the influence of Langmuir pressure 8.5–58.5 MPa, Langmuir volume 0.1–20 m3, diffusion coefficient, and cross flow coefficient on the production.
It can be seen from Figure 9 that the cumulative gas production of shale gas increases rapidly when the Langmuir pressure is 8.5–28.5 MPa, the volume is 0.1–5 m3, and the diffusion coefficient and cross flow coefficient change in different orders of magnitude, while with the Langmuir pressure, the volume of Langmuir continues to increase, and when the diffusion coefficient and cross flow coefficient change in the same order of magnitude, the increment of shale gas is small.
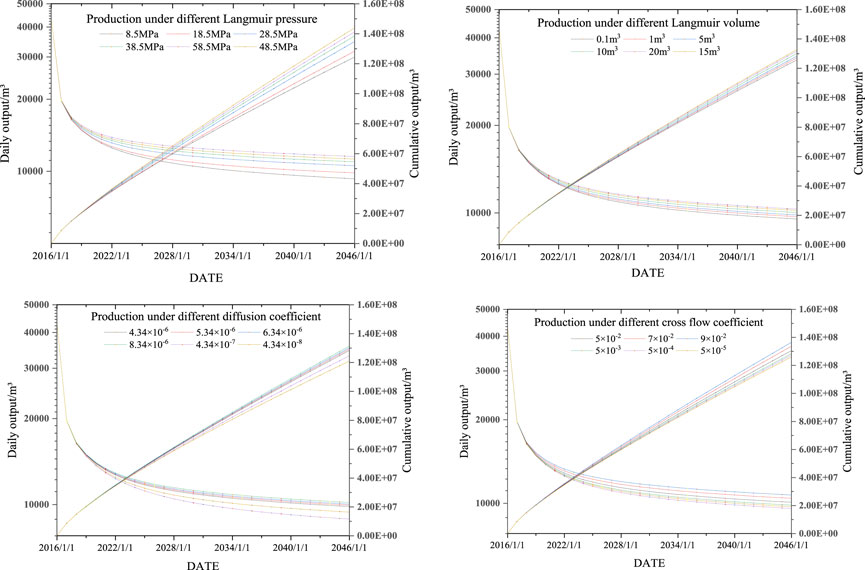
FIGURE 9. Production of a well under diffusion conditions.
Three levels of each factor which have an obvious influence on the development effect of shale gas reservoir are selected, and nine schemes are designed by using orthogonal experimental L9 (34), as shown in supplementary information. It can be seen from Figure 10 that the influence weight of geological parameters on production is in the following order: Langmuir pressure, cross flow coefficient, diffusion coefficient, and Langmuir volume. As the main factor affecting the production of shale gas, the percentage of the range of Langmuir pressure is the largest, accounting for 47.85%, and the smallest impact is the volume of Langmuir, accounting for 6.13%.
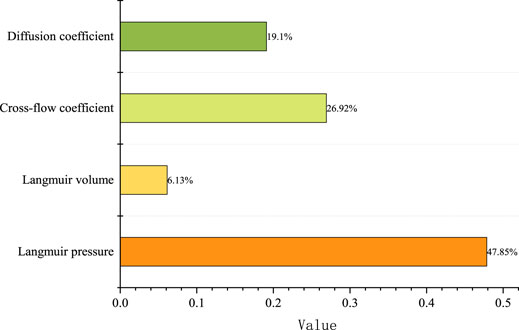
FIGURE 10. Range analysis of geological sensitivity parameters.
Sensitivity Analysis of Engineering Parameters
By simulating the influence of horizontal length 600∼1800 m, row spacing and well spacing 300∼1050 m, production pressure 2∼25 MPa, the order of parameters affecting development is analyzed (Figure 11).
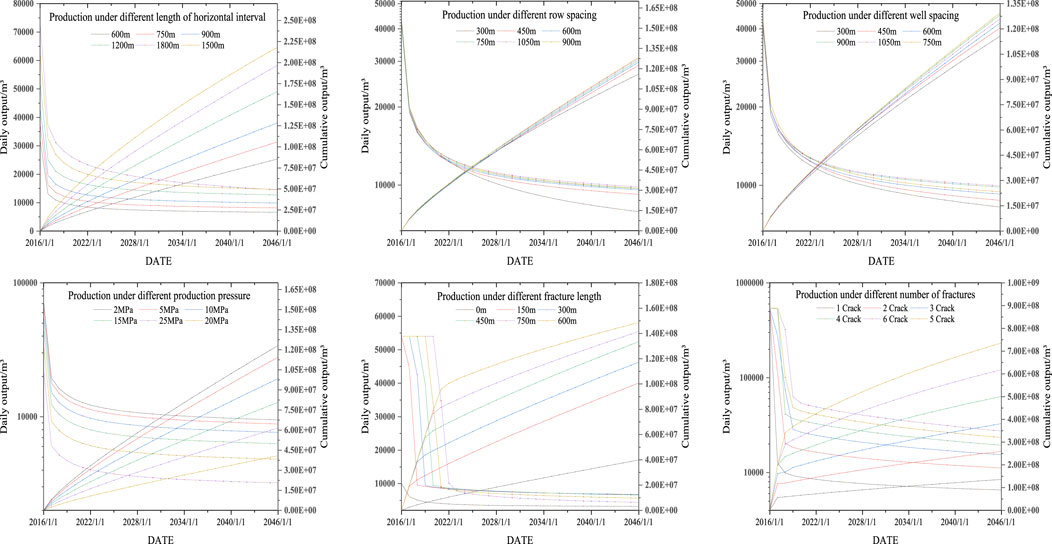
FIGURE 11. Production of a well under diffusion conditions.
Three levels of each factor which have an obvious influence on the development effect of shale gas reservoir are selected, and eighteen schemes are designed by using orthogonal experimental L18 (37), as shown in supplementary information. It can be seen from Figure 12 that the influence of engineering parameters on production is in the following order: number of fractures, length of horizontal section, production pressure, fracture length, row spacing, and well spacing. The most influential factor is the number of cracks, accounting for 63.06%, and the engineering factors with the least impact are row and well spacing, accounting for 3.18 and 1.08%, respectively.
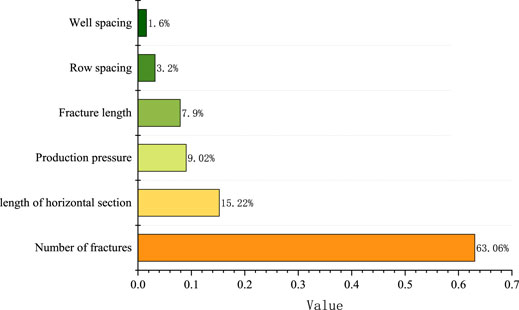
FIGURE 12. Range analysis diagram of engineering sensitivity parameters results.
The research has been applied to the Zhejiang oilfield. Block-A is put into production and synchronous fracturing is adopted. At the initial stage of exploitation, the output decreases rapidly, as shown in Figure 13. According to the research, a test was carried out in the northern part of the reservoir in 2017. Twelve horizontal wells were deployed. By the beginning of 2019, the Duong decline method was used to fit, the initial rate of decline after adjustment is reduced by 26.08%, and production increases by 17.06% after stabilization compared to wells without adjustment parameters, which reached the expectation of the scheme, as shown in Figure 14.
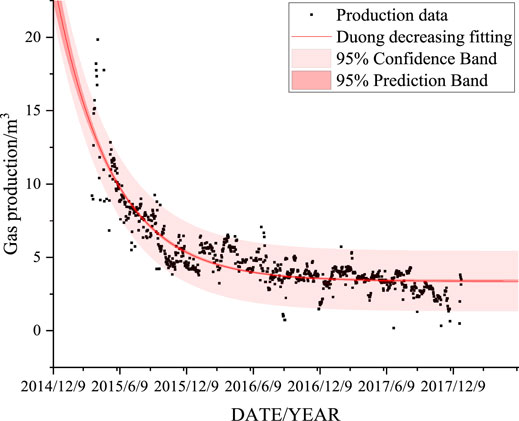
FIGURE 13. Well production in block-A before application.
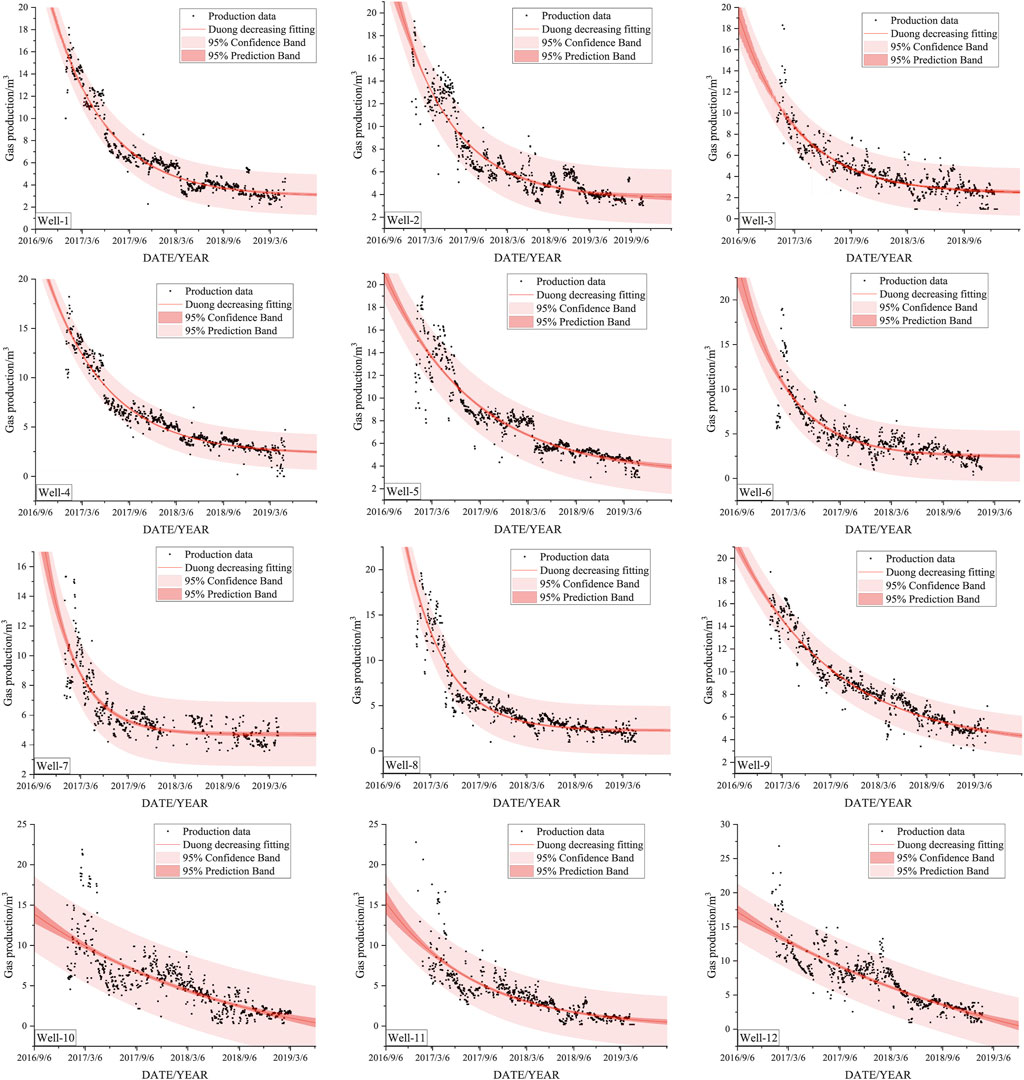
FIGURE 14. Well production in block-A after application.
To sum up, based on the geological parameters, combined with the numerical simulation technology, the parameter optimization scheme is formulated, which maintains the stable production of the area, improves the production decline, improves the gas recovery, and realizes the efficient development of the field.
Discussion
Different from the production of horizontal wells in conventional reservoirs, the flow mechanism of shale gas is complex. Through the numerical simulation, it can be divided into five flow processes: early linear flow, early radial flow, fracture boundary flow, compound linear flow, and radial flow.
When the number of fracture clusters is doubled, the average output increases 1.22–1.74%; the average output increases 2.29–3.13% when the fracture length is doubled. It can be seen that, compared with the number of fracture clusters, fracture length has a greater impact on the development of shale gas.
Combined with orthogonal experiment, the geological parameters affecting the development effect of shale gas reservoir are designed with field data, and the influence order of various factors is obtained, which is as follows: Langmuir pressure, cross flow coefficient, fluid diffusion coefficient, and Langmuir volume.
Combined with orthogonal experiment, the engineering parameters affecting the development effect of shale gas reservoir are designed with field data, and the influence order of various factors is obtained, which is as follows: the number of fractures, the length of horizontal section, production pressure, fracture length, row spacing, and well spacing.
Conclusion
The study area is located in the southwest of China, where the structure is gentle, the margin is supported by faults, and the direction of the fault anticline is northeast. The dark carbonaceous mud shale in the lower gas-bearing mud shale section of the section is mainly deposited in deep-water shelf, with a low deposition rate, which is conducive to organic matter enrichment and has a trend of gradually increasing organic carbon content from top to bottom. The pore types include inorganic pores, organic pores, lamellation cracks, and tectonic cracks. The organic pores tend to develop from top to bottom due to the abundance of organic matter; the gas content gradually decreases from bottom to top.
Considering the characteristics of shale gas desorption, diffusion, and rock compression, the productivity model of synchronous fracturing horizontal well in shale gas reservoir is established and its influencing factors are analyzed in this study. The model was tested with production data from three reservoirs, the results of calculations without interwell interference were compared with those of Eclipse, and the mathematical model developed in the paper showed good accuracy. If the interwell interference effect between horizontal wells is considered, the number of artificial fractures in the early and middle stages of production has a great influence on the production. The more the number of artificial fractures, the higher the production of gas wells. The smaller the crack spacing is, the earlier the interference between artificial cracks appears and the faster the medium-term production decline rate is.
In addition, the model has good accuracy in predicting single well production of shale gas. It is believed that the mathematical model is a good starting for future research on dual-media theory in the field of unconventional reservoir, and this theoretical design is expected to be applied in other simulation methods for multiphase flow (oil, gas, and water) and multimedia (matrix, fracture, and cavity) reservoirs.
Data Availability Statement
The original contributions presented in the study are included in the article/Supplementary Material; further inquiries can be directed to the corresponding author.
Author Contributions
YL, LW, YK, and KH performed the experiments. JH, XN, HW, and FG wrote the main manuscript. YZ and QM advised the students and corrected the manuscript. All authors reviewed the manuscript.
Funding
This study was supported by the National Major Project (2016ZX05037003-004), the National Natural Science Foundation of China (NSFC) (No. 51704235), and the Young Talent Fund of the University Association for Science and Technology in Shaanxi, China (No. 20180417).
Conflict of Interest
XN, YL, LW, YK, and KH were employed by the PetroChina Changqing Oilfield Company. QM was employed by the Development Department of Huabei Oilfield of Huabei Oilfield Company. FG and HW were employed by the Research Institute of Exploration and Development of Huabei Oilfield Company.
The remaining authors declare that the research was conducted in the absence of any commercial or financial relationships that could be construed as a potential conflict of interest.
Publisher’s Note
All claims expressed in this article are solely those of the authors and do not necessarily represent those of their affiliated organizations or those of the publisher, the editors, and the reviewers. Any product that may be evaluated in this article or claim that may be made by its manufacturer is not guaranteed or endorsed by the publisher.
Supplementary Material
The Supplementary Material for this article can be found online at: https://www.frontiersin.org/articles/10.3389/fenrg.2021.749339/full#supplementary-material
References
Ajayi, K. M., and Schatzel, S. J. (2020). Transport Model for Shale Gas Well Leakage through the Surrounding Fractured Zones of a Longwall Mine. Int. J. Mining Sci. Tech. 30 (5), 635–641. doi:10.1016/j.ijmst.2020.05.012
Guo, T., Wang, X., Li, Z., Gong, F., Lin, Q., Qu, Z., et al. (2019). Numerical Simulation Study on Fracture Propagation of Zipper and Synchronous Fracturing in Hydrogen Energy Development. Int. J. Hydrogen Energ. 44 (11), 5270–5285. doi:10.1016/j.ijhydene.2018.08.072
He, J., Liu, X., Zhu, X., Jiang, T., He, H., Zhou, L., et al. (2021). Water-Flooding Characteristics of Lithologic Reservoir in Ordos Basin. Sci. Rep. 11 (1), 2503. doi:10.1038/s41598-021-82035-4
Ma, Y., Ardakani, O. H., Zhong, N., Liu, H., Huang, H., Larter, S., et al. (2020a). Possible Pore Structure Deformation Effects on the Shale Gas Enrichment: An Example from the Lower Cambrian Shales of the Eastern Upper Yangtze Platform, South China. Int. J. Coal Geology. 217, 103349. doi:10.1016/j.coal.2019.103349
Ma, Y., Zhong, N., Yao, L., Huang, H., Larter, S., and Jiao, W. (2020b). Shale Gas Desorption Behavior and Carbon Isotopic Variations of Gases from Canister Desorption of Two Sets of Gas Shales in south China. Mar. Pet. Geology. 113, 104127. doi:10.1016/j.marpetgeo.2019.104127
Milkov, A. V., Faiz, M., and Etiope, G. (2020). Geochemistry of Shale Gases from Around the World: Composition, Origins, Isotope Reversals and Rollovers, and Implications for the Exploration of Shale Plays. Org. Geochem. 143, 103997. doi:10.1016/j.orggeochem.2020.103997
Shu, Y., Lu, Y., Chen, L., Wang, C., and Zhang, B. (2020). Factors Influencing Shale Gas Accumulation in the Lower Silurian Longmaxi Formation between the north and South Jiaoshiba Area, Southeast Sichuan Basin, China. Mar. Pet. Geology. 111, 905–917. doi:10.1016/j.marpetgeo.2019.06.029
Solarin, S. A., Gil-Alana, L. A., and Lafuente, C. (2020). An Investigation of Long Range reliance on Shale Oil and Shale Gas Production in the U.S. Market. Energy 195, 116933. doi:10.1016/j.energy.2020.116933
Szolucha, A. (2019). A Social Take on Unconventional Resources: Materiality, Alienation and the Making of Shale Gas in Poland and the United Kingdom. Energ. Res. Soc. Sci. 57, 101254. doi:10.1016/j.erss.2019.101254
Tan, J., Hu, R., Wang, W., and Dick, J. (2020). Palynological Analysis of the Late Ordovician - Early Silurian Black Shales in South China Provides New Insights for the Investigation of Pore Systems in Shale Gas Reservoirs. Mar. Pet. Geology. 116, 104145. doi:10.1016/j.marpetgeo.2019.104145
Tavakkoli, S., Lokare, O., Vidic, R., and Khanna, V. (2020). Shale Gas Produced Water Management Using Membrane Distillation: An Optimization-Based Approach. Resour. Conservation Recycling 158, 104803. doi:10.1016/j.resconrec.2020.104803
Wan, X., Rasouli, V., Damjanac, B., Yu, W., Xie, H., Li, N., et al. (2020). Coupling of Fracture Model with Reservoir Simulation to Simulate Shale Gas Production with Complex Fractures and Nanopores. J. Pet. Sci. Eng. 193, 107422. doi:10.1016/j.petrol.2020.107422
Wang, F., and Guo, S. (2019). Shale Gas Content Evolution in the Ordos Basin. Int. J. Coal Geology. 211, 103231. doi:10.1016/j.coal.2019.103231
Yang, Z., Bryant, S., and Dong, M. (2020). A Method of Determining Adsorptive-Gas Permeability in Shale Cores with Considering Effect of Dynamic Adsorption on Flow. Fuel 268, 117340. doi:10.1016/j.fuel.2020.117340
Ye, J., Yang, Z., Xia, R., Zhang, J., and Li, X. (2018). Multi-well Synchronous Hydraulic Conformance Fracturing Technology Used for Deep Coal Beds and its Field Application in the Southern Qinshui Basin. Nat. Gas Industry B. 5 (3), 193–203. doi:10.1016/j.ngib.2018.04.006
Yin, Y., Qu, Z. G., Zhang, T., Zhang, J. F., and Wang, Q. Q. (2020). Three-dimensional Pore-Scale Study of Methane Gas Mass Diffusion in Shale with Spatially Heterogeneous and Anisotropic Features. Fuel 273, 117750. doi:10.1016/j.fuel.2020.117750
Zhang, H., Yang, S., Liu, D., Li, Y., Luo, W., and Li, J. (2020). Wellbore Cleaning Technologies for Shale-Gas Horizontal wells: Difficulties and Countermeasures. Nat. Gas Industry B. 7 (2), 190–195. doi:10.1016/j.ngib.2020.03.003
Zhang, T., Salama, A., Sun, S., and El-Amin, M. F. (2015). Pore Network Modeling of Drainage Process in Patterned Porous media: A Quasi-Static Study. J. Comput. Sci. 9, 64–69. doi:10.1016/j.jocs.2015.04.010
Zhang, T., and Sun, S. (2019). A Coupled Lattice Boltzmann Approach to Simulate Gas Flow and Transport in Shale Reservoirs with Dynamic Sorption. Fuel 246, 196–203. doi:10.1016/j.fuel.2019.02.117
Zhang, T., Sun, S., and Song, H. (2018). Flow Mechanism and Simulation Approaches for Shale Gas Reservoirs: A Review. Transp Porous Med. 126 (3), 655–681. doi:10.1007/s11242-018-1148-5
Zheng, H., Zhang, J., and Qi, Y. (2020a). Geology and Geomechanics of Hydraulic Fracturing in the Marcellus Shale Gas Play and Their Potential Applications to the Fuling Shale Gas Development. Energ. Geosci. 1 (1-2), 36–46. doi:10.1016/j.engeos.2020.05.002
Zheng, S., Kang, Z., Cui, M., Nie, Y., and Zhang, A. (2020b). Improvement of Shale Gas Reservoir Based on Plasma Pulse Shock and Frequency Resonance Technology. J. Nat. Gas Sci. Eng. 80, 103403. doi:10.1016/j.jngse.2020.103403
Keywords: shale gas, percolation mechanism, simultaneous fracturing, Zhejiang shale gas field, key factors
Citation: He J, Niu X, Meng Q, Guo F, Wang H, Liu Y, Wang L, Kang Y, Hu K and Zhu Y (2021) Research on the Percolation Mechanism of Perturbation Under Simultaneous Fracturing in Shale Reservoirs. Front. Energy Res. 9:749339. doi: 10.3389/fenrg.2021.749339
Received: 29 July 2021; Accepted: 27 September 2021;
Published: 08 November 2021.
Edited by:
Muhammad Zubair, University of Sharjah, United Arab EmiratesReviewed by:
Shuyu Sun, King Abdullah University of Science and Technology, Saudi ArabiaHaochun Zhang, Harbin Institute of Technology, China
Copyright © 2021 He, Niu, Meng, Guo, Wang, Liu, Wang, Kang, Hu and Zhu. This is an open-access article distributed under the terms of the Creative Commons Attribution License (CC BY). The use, distribution or reproduction in other forums is permitted, provided the original author(s) and the copyright owner(s) are credited and that the original publication in this journal is cited, in accordance with accepted academic practice. No use, distribution or reproduction is permitted which does not comply with these terms.
*Correspondence: Yushuang Zhu, cGV0cm9sZXVtX2dhc0AxNjMuY29t