 Z. Juju Wang1
 Mark D. Staples1*Wallace E. Tyner2
 Xin Zhao2
 Robert Malina3Hakan Olcay3
 Florian Allroggen1Steven R. H. Barrett1
- 1Laboratory for Aviation and the Environment, Massachusetts Institute of Technology, Cambridge, MA, United States
- 2Department of Agricultural Economics, Purdue University, West Lafayette, IN, United States
- 3Centre for Environmental Sciences, Hasselt University Campus Diepenbeek, Diepenbeek, Belgium
This paper quantifies the impact of different policy options on the economic viability of sustainable aviation fuel (SAF) production technologies. The pathways considered include isobutanol to jet from corn grain, hydroprocessed esters and fatty acids (HEFA) from inedible fats and oils, HEFA from palm fatty acid distillate, synthesized iso-paraffins from sugarcane, Fischer-Tropsch (FT) gasification and synthesis from municipal solid waste, and micro FT from wood residues. The policies considered include feedstock subsidies, capital grants, output based incentives, and two policies intended to reduce project risk. Stochastic techno-economic analysis models are used to quantify the policies’ impact on project net present value and minimum selling price of the middle distillate fuel products. None of the technology pathways studied are found to be financially viable without policy aid. The median total policy costs required for economic viability range from 35 to 337 million USD per production facility, or 0.07–0.71 USD/liter. Our results indicate that the cumulative impact of multiple policies, similar in magnitude to analogous real-world fuel policies, could result in economically viable SAF production.
1 Introduction
Prior to the COVID-19 pandemic, commercial aviation accounted for approximately 2% of total anthropogenic greenhouse gas (GHG) emissions. Assuming a recovery in the sector, and in the absence of mitigation measures, this is expected to grow to 5% by 2035 due to air traffic growth. At the same time, regional, national, and international policies are taking shape to address the challenge of mitigating the climate impacts of aviation (Seber et al., 2014). For example, the International Civil Aviation Organization (ICAO) Carbon Offset and Reduction Scheme for International Aviation (CORSIA) policy aims to have carbon neutral growth of international aviation from 2020 onwards. CORSIA includes mechanisms to enable sustainable aviation fuels (SAF) to play a role in achieving the goals of the policy.
SAF, with lower life cycle GHG emissions than conventional petroleum derived jet, can be produced from a variety of biomass and waste feedstocks. At the time of writing, five technology pathways for sustainable aviation fuel production have been certified by the American Society for Testing and Materials International (ASTM) for use in aviation turbine engines (Christensen et al., 2014). These fuels have been approved as drop-in fuels, which can be used at blends up to 50% without any changes made to commercial aircraft (Staples et al., 2014). A number of private firms are targeting commercial-scale production and delivery of SAF such as AirBP and Neste. In addition, many airlines are investing in SAF, for example United Airlines, who entered an offtake agreement with Fulcrum BioEnergy in 2015.
However, the production cost premium of these fuels remains a significant barrier to large scale SAF uptake. Consequently, a number of policy incentives exist to economically support the production of SAF. Examples include the US Renewable Fuels Standard 2 (RFS2), the California Low Carbon Fuel Standard (LCFS), and CORSIA.
In this analysis, we quantify the economic impacts of various policy options on a set of SAF production pathways (Zhao et al., 2016). Six pathways, isobutanol to jet (ATJ) from corn grain, hydroprocessed esters and fatty acids (HEFA) from inedible fats and oils (IFO), HEFA from palm fatty acid distillate (PFAD), synthesized iso-paraffins (SIP) from sugarcane, Fischer-Tropsch (FT) gasification and synthesis from municipal solid waste (MSW), and micro FT from wood residues, are modeled as individual refineries using harmonized financial assumptions. The economic performance of these facilities is quantified in terms of their project net present value (NPV) and the fuel product minimum selling price (MSP). The MSP is calculated as the breakeven output price at which NPV reaches zero. The analysis is carried out stochastically to quantify uncertainty. Next, the impact of policy options including output based incentives, feedstock subsidies, capital grants, loan guarantees, and off-take agreements, on MSP and NPV are quantified. While previous studies have performed techno-economic analysis (TEA) on SAF pathways and take into account policy considerations, individual pathway studies have mostly been carried out in isolation. Differing financial, operational, and policy assumptions have meant that the findings are not directly comparable between studies and pathways. Although a number of previous analyses have quantified the MSP or production costs of various SAF pathways, few have addressed the impact of various policy supports on economic viability in a consistent manner across a number of SAF pathways (Weibel, 2018). To the best of our knowledge at the time of publication, this analysis is the first quantitative, stochastic assessment of the impacts of various policy instruments on this scope of SAF production pathways, using a harmonized set of assumptions to enable consistent and meaningful comparison of results.
2 Materials and Methods
2.1 Sustainable Aviation Fuel Pathways
Six techno-economic models of SAF refineries are developed for the following pathways: corn grain ATJ (via iso-butanol), IFO HEFA, PFAD HEFA, sugarcane SIP, MSW FT, and forestry residue micro FT. All pathways produce a slate of drop-in hydrocarbon fuels, including fuels suitable for use in aviation. We have selected this scope of analysis because these pathways represent relatively mature technologies in the nascent SAF industry, and they represent all of the fuel production pathways currently certified by ASTM to produce fuels suitable for use in aircraft engines. All facilities are assumed to be commercial-scale “nth-of-a-kind” plants, as opposed to demonstration scale or first-of-a-kind. Although minor differences in the physical properties of the SAF produced from these facilities would exist in practice, for the purposes of this analysis we assume each of these pathways produce an identical SAF product. Furthermore, we compare the costs of SAF to petroleum jet fuel on a per liter fuel basis, neglecting small differences in the density and specific energy of these fuels, in order to stay consistent with units commonly used to describe fuel volumes and costs. The pathway mass and energy balances and techno-economics are modeled stochastically using MATLAB 2017b. We take a calculated NPV greater than zero to indicate that a project is financially viable. The MSP is defined in this study as the minimum price at which the middle distillate fuel fractions - diesel and jet - must be sold in order to achieve a project NPV of zero.
Table 1 shows the mass and energy balances associated with each pathway. All of the technologies considered in this analysis are nascent and there is uncertainty associated with the mass and energy balances used to represent their performance. As a result, material quantities for inputs of natural gas, hydrogen, and electricity, as well as output fuel yield are modeled as stochastic distributions. Common inputs such as natural gas, electricity, and water have consistent costs across pathways. Inputs such as catalysts and other treatment chemicals are not listed but are included in the financial model. The input feedstock quantity is set to a constant value for each pathway, such that average total fuel yield is 2,000 bpd (111.3 million liters/year). Note that while total average fuel yield is equivalent across the different pathways considered here, the SAF proportion of fuel yield varies between production technologies. 2,000 bpd of total fuel yield is considered here in keeping with previously published analyses, such as (Pearlson et al., 2013), (Staples et al., 2018), and Bann et al. (2017).
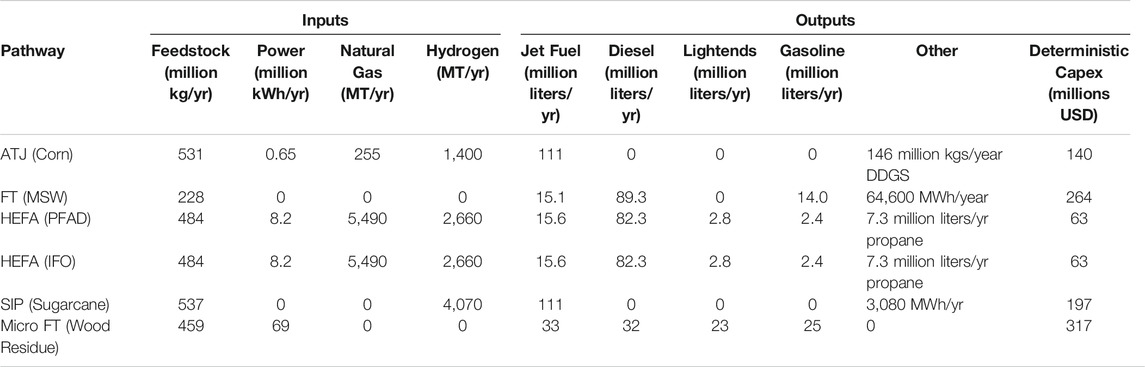
TABLE 1. Pathway average input and outputs.
2.1.1 Financial Assumptions
Each SAF production pathway is modeled as a refinery with a 20-years operating lifetime, and an average total fuel production capacity of 2000 bpd. The fixed capital investment (FCI) of each plant is modeled employing the same method used in Bann et al. (2017). A positively skewed beta pert distribution is drawn around the deterministic FCI that varied between 80 and 150% of the deterministic FCI, based on the work of Brown, 2015.
The financial modeling assumptions in Bann et al. (2017) and Zhao et al. (2015) are used to guide assumptions in this study. Capital financing is assumed to be 40% equity and the remainder is financed through a 10-years loan with 8% interest. The cost of equity is set at 15%. It is assumed that the refinery takes 3 years to build, and startup costs are split among the first 3 years by 8, 60 and 32%, respectively. Depreciation is assumed to take place on a 10-years schedule, using a double declining balance, and then switching to straight line in year 10 until the asset value is zero. Working capital is 5% of the FCI and direct operating costs such as maintenance and overhead are assumed to be 7.7% of the FCI. Each year is assumed to include 350 operational days, with the first year at 75% capacity. The income tax rate is set at 16.9% which was the average effective US tax rate prior to the 2018 tax law, and inflation is set to 2%. All costs are calculated in 2018 dollars. The NPV of the facility is calculated using a discounted cash flow rate of return (DCFROR) analysis, and the MSP for middle distillates is calculated by iteratively adding a price premium for both jet and diesel fuels until the NPV of the facility is zero.
2.1.2 Time Series Data
A time series of future prices for natural gas, electricity, gasoline and various feedstocks are estimated using an autoregressive integrated moving average (ARIMA) model. Historical pricing data is gathered for natural gas, electricity, gasoline, corn grain, yellow grease, PFAD, and sugarcane, and an ARIMA model is generated for each commodity price trend. Commodity prices are limited to be no greater than 125%, and no less than 75%, of the highest and lowest historically observed values for that commodity. This is an approach taken from previous TEA studies to avoid historically unprecedented or unrealistic results. Aside from fuel products, all commodity prices are assumed to vary independently. This means that, all else being equal, the contribution of commodity price to variance in the results may be over-represented in this analysis.
2.2 Policy Types
Four different policy types have been identified to be considered in this study, based on biofuel policies implemented in different jurisdications around the world. The way each policy is modeled is noted in the following sections, along with real-world examples of these policy types’ implementation. It is important to note that a number of the example policies discussed here are applicable to biofuels in general, and not necessarily SAF specifically.
2.2.1 Output Based Incentives
For the purposes of this study, an output based incentive is a policy for which the fuel producer receives some monetary benefit tied to the quantity or type of fuels produced and sold. For example, the value of the benefit could be a function of production volumes, which is the case for Renewable Identification Numbers (RINs) generated under the US RFS2. It could also depend on the life cycle emissions reductions compared to a petroleum fuel, which is the case for the California LCFS and ICAO CORSIA policies. We model both of these types of output based incentives. In the case of the GHG-reduction dependent incentive, emissions reductions are estimated based on the default core life cycle analysis values agreed upon for use under CORSIA.
In reality, incentives of this kind may be uncertain, as the size of the credit depends on the market or mandate for sustainable fuels or emissions reductions. However, the magnitude of the credit is assumed here to be deterministic and constant. In the DCFROR model, the monetary value of this incentive is modeled as annual revenue that is not taxed, and is only applicable to middle distillate products. The total cost of the policy can be evaluated using the DCFROR model.
2.2.2 Feedstock Subsidies
A feedstock subsidy is a monetary benefit to reduce a facility’s operating costs for feedstock. It may also have the benefit of supporting feedstock producers, by providing agricultural incentives to establish the supply chain. A feedstock subsidy could also take the form of a monetary credit or avoided cost for using waste products such as MSW that would otherwise take up landfill capacity. Some examples of feedstock subsidies include the Brazil Social Fuel Seal and the 2014 US Biomass Crop Assistance Program (BCAP). The Brazil Social Fuel Seal gives fuel producers tax breaks when using fuel produced in rural farming regions, and the US BCAP program, provides a 1:1 matching subsidy for eligible feedstocks, up to 20 $/short ton.
In this analysis, we model feedstock subsidies as a reduction in feedstock costs. The reduced feedstock cost is then used in the DCFROR model to obtain MSP and NPV. To calculate the total cost of the policy, the subsidy per quantity of feedstock is multiplied by feedstock quantity per year. The total cost over the lifetime of the facility is then found using a DCFROR calculation for the 20 years of refinery operation.
2.2.3 Capital Grants
A capital grant is typically a one-time monetary benefit, granted by the government to cover or reduce facility construction costs. Two examples of implemented capital grant policies are the 2018 Calrecylce Organics recycling projects and the Rural Energy for America Program (REAP). The Calrecycle program distributed $25 million to organics recycling projects, including biofuel refineries. REAP started in 2003 and in 2018 had a budget of $600 million for FY2018 for both grants and loans. We model capital grants policies as a lump sum received in the first year of refinery construction.
2.2.4 Risk Reduction Policies
Two additional policies, loan guarantees and offtake agreements, are modeled to quantify the impact of risk reduction policies on project economics. A loan guarantee is an agreement between the guarantor and the bank, that states if a refinery defaults on a loan, the guarantor will pay the bank in its stead. This results in a lower cost of debt, as some risk associated with the project has been borne by the guarantor (usually the government), rather than the bank. REAP also provides loan guarantees up to $25 million. A loan guarantee is modeled here as a reduction in the cost of debt.
An offtake agreement occurs when a fuel purchaser agrees to purchase fuel quantities at a pre-negotiated price at some future date rather than the prevailing market price. A number of airlines have established offtake agreements with SAF producers, such as Lufthansa and Gevo, and United Airlines and Fulcrum bioenergy. This is modeled as a percentage of total fuel production (subject to the agreement), and a fixed price for the lifetime of the agreement.
Note that, in this study we do not calculate the cost of the loan guarantee or the offtake agreement policies, as the primary purpose of these policies are to reduce risk, rather than a monetary transfer. The valuation of risk or risk reduction is beyond the scope of this analysis, but has been covered previously by Bittner et al., 2015.
2.3 Policy Simulation
The policy types described above are analyzed in three different ways. First, a “breakeven” analysis is carried out to quantify the magnitude of each policy type required, in isolation, to achieve a project NPV of zero. The total policy cost of each of the policy alternatives is also calculated.
Next, we assess the impact of policies of the magnitude of examples seen in the real world on the pathways’ economic viability. We consider a feedstock subsidy of $20/short ton, with a maximum value of $12.5 million per year, based on BCAP. An output subsidy of $0.25/L is assumed which is similar in magnitude to 2018 RIN values from the US RFS2. A capital grant of $5 million is assumed, similar to grants given to biofuel refineries under the Calrecycle program. Finally, CO2 offset costs expected under the CORSIA policy are used to estimate a GHG emission reduction-defined output incentive, ranging from 20–47 $ per metric tonne of CO2 equivalent ($/tCO2e) abated.
In addition to analyzing the impact of individual policies on various pathways, we also compare the differing impacts of equal-cost policies (policies with equal total monetary cost to the funder of the policy, typically the government) on economic viability. To do this, the total cost of the policy to the government is calculated for a single output based incentive value. Using that total cost, the magnitudes of equal-cost policies are calculated for the feedstock subsidy, GHG emissions based reduction subsidy, and capital grant policies. These equal-cost policy cases are then assessed to determine their impact on median NPV and MSP, as well as the distribution of these indicators. This is done for a range of output-based incentive values from 0.01–0.75$/L.
Finally, we model a number of policies to reduce financial risk. The loan guarantee is modeled as a decrease in cost of debt from 8 to 3%, and the offtake agreement is modeled as a percentage of fuel produced and purchased at the MSP varying from 0 to 100%. We also model the feedstock subsidy as a percentage reduction in feedstock cost rather than a fixed $/short ton, for consistency across disparate feedstock types.
3 Results and Discussion
3.1 Baseline, “No Policy” Results
Figure 1 shows NPV and MSP results for each of the six pathways, in the absence of policy support. In both plots, the red line indicates the median value, the box indicates the 25th and 75th percentile, and the black dotted lines indicate the entire range of values. The MSP of middle distillate fuel products (jet and diesel) from each pathway are shown on the right. For reference, the market price of jet fuel at the time of writing is 0.50 $/L shown by the blue dotted line. The MSW FT and IFO HEFA pathways have the lowest median MSP at 0.60 and 0.90 $/L, respectively, while the corn grain ATJ and forestry residue micro FT pathways have the highest median MSPs at 1.16 and 1.33 $/L, respectively. The differences in MSP variance between pathways is due, in large part, to uncertainty and variance in the costs of different feedstock types.
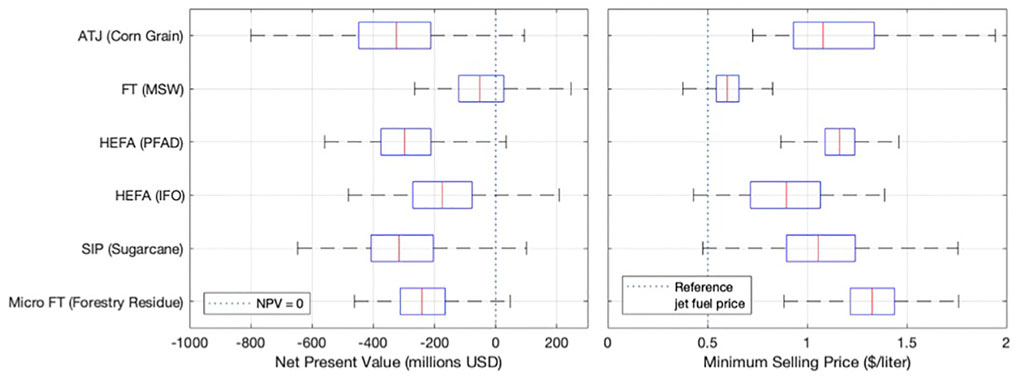
FIGURE 1. Box and whisker plots of NPV and MSP values for all pathways with no policy added. Dotted lines indicate either an NPV of zero, or the current market price of jet fuel (March 2019).
The NPV of each pathway is shown on the left of Figure 1, and the dotted line represents an NPV of zero, meaning that the region to the right of the line indicates financial viability. The median NPV for each pathway is below zero indicating that at the mean level, none of these pathways are financially viable in the absence of policy support. All pathways do have some fraction of stochastic results where the NPV goes above zero. In particular, the FT from MSW and IFO HEFA cases have the greatest probability of a positive NPV, at 40 and 11% with no policy support, respectively. The differences in variance between pathways is smaller for the NPV results than it is for MSP. This is because variance in NPV, while still correlated to feedstock cost, is attributable in large part to fuel price variability. In contrast, fuel price uncertainty is not factored in MSP distributions as it represents an estimate of levelized cost in our study. Therefore, although a higher MSP is generally correlated to a lower NPV, this is not always the case. The micro FT from forestry residue pathway has a higher MSP, but lower NPV relative to ATJ from corn grain. This is due to differences in middle distillate output quantities, relative to non-middle distillate fuel quantities.
In the FT MSW pathway, the median MSP value is lower than previous findings in (Suresh et al., 2018) and Bann et al. (2017), which estimated the MSP of MSW-derived FT fuels to be approximately 1.10 $/L. However, our findings agree with work by Niziolek et al., 2015 with a median MSP of approximately 0.60 $/L. It is important to note that this result is contingent on the assumption of a zero-cost MSW feedstock, delivered to the plant gate.
3.2 Breakeven Results
Table 2 shows the median breakeven policy values required for an NPV of zero for each pathway, as well as the total cost of the policy. The 25th and 75th percentile values are included in the brackets.
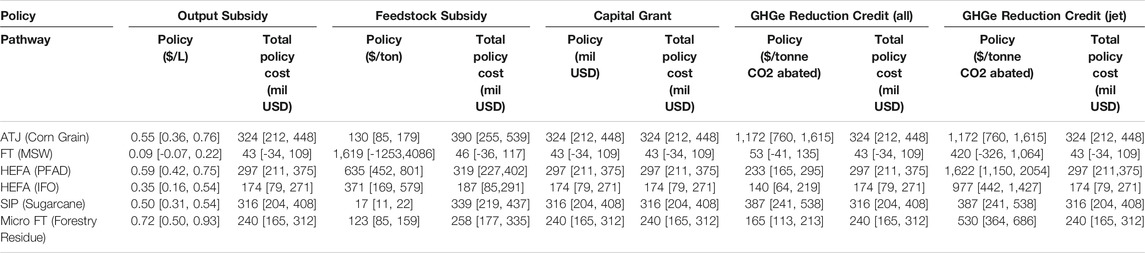
TABLE 2. Median breakeven policies values and total policy cost required for a pathway NPV of zero. 25th and 75th percentile values are included within brackets.
The results in columns 2 and 3 show that the magnitude and total cost of a quantity-based output subsidy for breakeven is proportional to the MSP for each pathway. However, the variance of the magnitude of the required policy reflects the differences in fuel yield between pathways. For example, in the no-policy case shown in Figure 1, variance in MSP for the forestry residue micro FT pathway is less than that of sugarcane SIP. However, column 2 of Table 2 shows that the variance of forestry residue micro FT under the volume-based output subsidy is greater than that of sugarcane SIP. This is because the forestry residue micro FT pathway produces a smaller proportion of middle distillates that benefit from this policy, relative to the other pathways. Therefore, variance in the breakeven policy increases, reflecting the smaller quantity of qualifying fuel. The breakeven output subsidies required for the MSW FT and IFO HEFA pathways are 0.09 and 0.35 $/L respectively, which is within the 0.01–2.00 range of available RFS2 RIN prices at the time of writing. Column 3 in Table 2 shows the total policy costs for a breakeven output subsidy. As anticipated, the total policy cost is equivalent to the negative NPV of each pathway in the absence of policy support.
Column 4 shows the values for a breakeven feedstock subsidy. These range from 17 $/short ton for sugarcane SIP to 1,619 $/short ton for MSW FT pathways. This discrepancy exists due to the variation in feedstock input quantities. FT from MSW has a high $/short ton value because of a relatively lower quantity of feedstock input required, and SIP has a low $/short ton value because of a relatively larger quantity of feedstock required.
The total policy cost for feedstock subsidies (column 5) is proportional to the no-policy NPV of each pathway, although greater than that of the output-based incentives. This is a result of how feedstock subsidies are modeled in this analysis, as a reduction in feedstock cost, which increases the cash flow that is taxed.
Column 6 of Table 2 shows the magnitude of a capital grant required to achieve a NPV of zero for each pathway. The size of the capital grant is equivalent to the negative NPV of each pathway in the absence of any policy, as expected. The smallest capital grants needed for financial viability are for the FT MSW and HEFA pathways, with values of 43 and 174 million USD, respectively. Note that the manner in which the capital grant is modeled does not account for changes in the project capital structure, such as a decrease in the loan amount, which could also impact project NPV. A change in financial structure could change debt and equity costs, and in this case the cost of a breakeven policy required would no longer be equal in absolute value to the NPV of the pathway.
The last four columns show the magnitude of life cycle emissions reduction-based output subsidies, in US$/tCO2e, in order to achieve a project NPV of zero. Column 8 gives the results when the policy is applied to all fuels in the product slate, and column 10 gives results if the policy were applicable only to the SAF fraction. The magnitude of the subsidy for the corn grain ATJ and sugarcane SIP pathways are the same in both columns, as both pathways are assumed to produce 100% SAF. These results can be compared to the size of the incentive anticipated under CORSIA, of 20–47 $/tCO2e, which is applied only to the jet fuel fraction. CORSIA values are up to 277 $/tCO2e, lower than what is required for a project NPV of zero, if this policy is considered in isolation. However, similar incentives are available under other policy schemes, such as California LCFS, and would apply to all fuel products. The LCFS credit is 180 $/tCO2e abated (April 2019) which is above the policy values required for breakeven for MSW FT, IFO HEFA, and forestry residue micro FT. The total policy cost for GHG emission reduction based incentive and capital grants are equal.
Determining the breakeven value of policies is helpful for current policymakers and producers to better understand the effectiveness of current policies. We show here that the magnitude of a policy required for breakeven is greater than what can be expected from similar existing policy schemes. This means that it is unlikely a single policy, in isolation, will push the pathways assessed to financial viability.
3.3 Real-World Policy Case Results
Figure 2 shows the MSP for each pathway, and the no-policy case is represented by the right-most extent of the bar for each pathway. The colored bars indicate the cumulative decrease in MSP due to each real-world policy. The blue bar represents MSP remaining when all policies are applied to the pathway in combination. The results show that the cumulative impact of the policies reduce the mean MSP of MSW FT below the current market price of petroleum jet fuel. The sugarcane SIP and IFO HEFA pathway are also within 0.10$/L to the current selling price of conventional jet fuel.
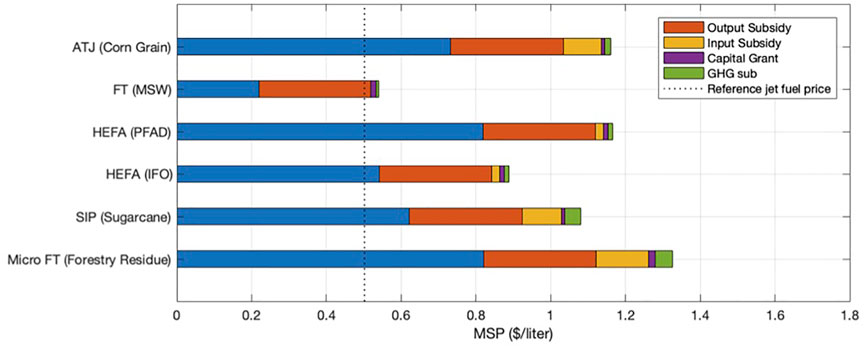
FIGURE 2. Real-world policy effects on MSPs for pathways. Details on the individual policies are listed in the Methods and Materials Section.
Although the same policies are applied to all pathways, their impacts for each pathway vary. For example, the output subsidy has a smaller impact on forestry residue micro FT than any of the other pathways considered. This is because the subsidy is only applied to middle distillates, and although each facility produces 2000 bpd of total product, middle distillates only account for 62% of the micro-FT refinery production. In contrast, middle distillates account for at least 91% of total fuel products from all other pathways.
The feedstock subsidy also has different impacts between pathways. Each pathway requires a different feedstock type and quantity, and at different market prices. For the MSW FT pathway, feedstock costs are assumed to be zero (as a waste feedstock) and the input subsidy has no effect, whereas the corn grain ATJ, sugarcane SIP, and forestry residue micro FT pathways were able to take full advantage of the input subsidy up to the $12.5 million per year limit of the BCAP program.
Similarly, the life cycle GHG emissions of each pathway are unique. Therefore, the pathways with greater reduction potential relative to petroleum fuels, such as forestry residue micro FT and sugarcane SIP, benefit more from the GHG subsidy policy.
Two conclusions may be drawn from this analysis. First, when considering the cumulative impacts of policies of the magnitude that can be found today, a number of pathways, such as MSW FT and IFO HEFA, have MSPs approaching parity with current market prices for petroleum fuels. Second, the results show that the impacts of the policies considered are independent of one another, and that the cumulative impact of the policies is equal the sum of their impacts in isolation.
3.4 Equal Policy Results
We also quantified the impact of equal-cost policies of each policy type, equivalent to volume-based output subsidies of 0.01, 0.02, 0.05, 0.10, 0.25, 0.50 and 0.75 $/L.
Figure 3 shows the NPV change of each pathway as a function of the total policy cost for different policies. This shows that the total cost of the policy has a linear relationship with the NPV. With the exception of the feedstock subsidy case, there is a 1:1 correspondence between the increase in NPV and the total policy cost. The feedstock subsidy is unique from the other policy types, because the benefit of the feedstock subsidy is taxed in our model. The ratio between the increase in refinery NPV to total policy cost is 0.831:1 which correlates with the 16.9% tax rate. Therefore, the feedstock subsidy has a smaller impact on NPV than an output subsidy of the same total cost.
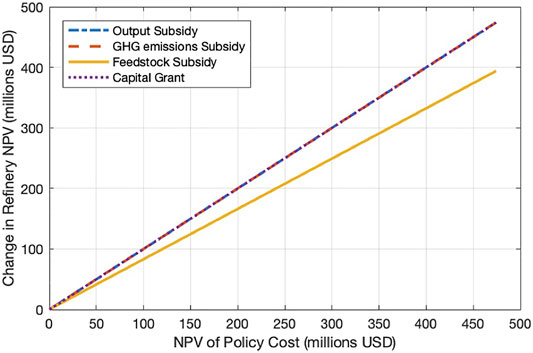
FIGURE 3. Change in refinery NPV vs. total cost of policy for all pathways (lines for output subsidy, GHG emissions subsidy, and capital grant overlap).
3.5 Policies to Reduce Risk
The loan guarantee policy decreases the MSP, and increases NPV of the all of the pathways considered as seen in Table 3. The magnitude change in NPV correlates directly with the FCI of each facility. The forestry residue micro FT pathway has the highest deterministic FCI cost of 318 million USD which results in a 36 million USD increase in mean NPV. The PFAD HEFA pathway, with an FCI of 62 million USD, shows an NPV increase of 9 million USD. The results of a loan guarantee change when combined with a capital grant, as the capital structure of the refinery may change.
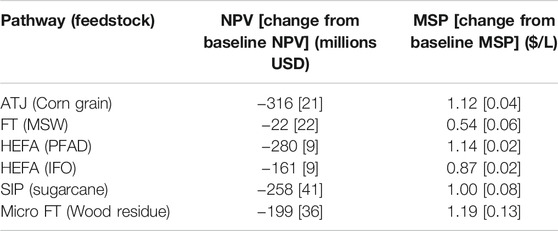
TABLE 3. Changes in NPV and MSP values and variances due to a loan guarantee debt reduction from 8 to 3%.
To quantify the impact of an offtake agreement, we present only the corn grain ATJ pathway here. This is because the impact of offtake agreements and feedstock subsidies on variance in the results follow the same trends across all pathways considered. The results in Table 4 show that the offtake agreement has different impacts on the variance of MSP and NPV. Variance in NPV decreases because the price for the fuel in the offtake agreement is static. However, variance in the MSP of fuel volumes not included in the offtake agreement increases, because the non-offtake volumes bare all of the variance required to achieve an NPV of zero.

TABLE 4. Changes in NPV and MSP values and standard deviations due to offtake agreements.
3.5.1 Alternative Policy Implementations
Results were also generated for the case where feedstock subsidies were defined as a percentage of feedstock cost, rather than a fixed monetary amount. With this assumption, risk associated with commodity price uncertainty is shifted from the project developer on to the entity paying for the policy (e.g., the government). This is also true if output subsidy and capital grant type policies are defined in terms of percentage of costs or revenues.
Figure 4 shows feedstock subsidies at 0, 25, 50, 75, and 100 percent of feedstock cost for the corn grain ATJ pathway in blue, along with the equivalent average total cost (in $/short ton) feedstock subsidy in red. The average increase in NPV and decrease in MSP remains the same for both cases. However, in the percentage reduction case, the variance in MSP decreases as the magnitude of the policy increases. Similarly for NPV, as feedstock subsidy increases, NPV variance decreases. At 100%, feedstock cost is zero and does not contribute to variance.
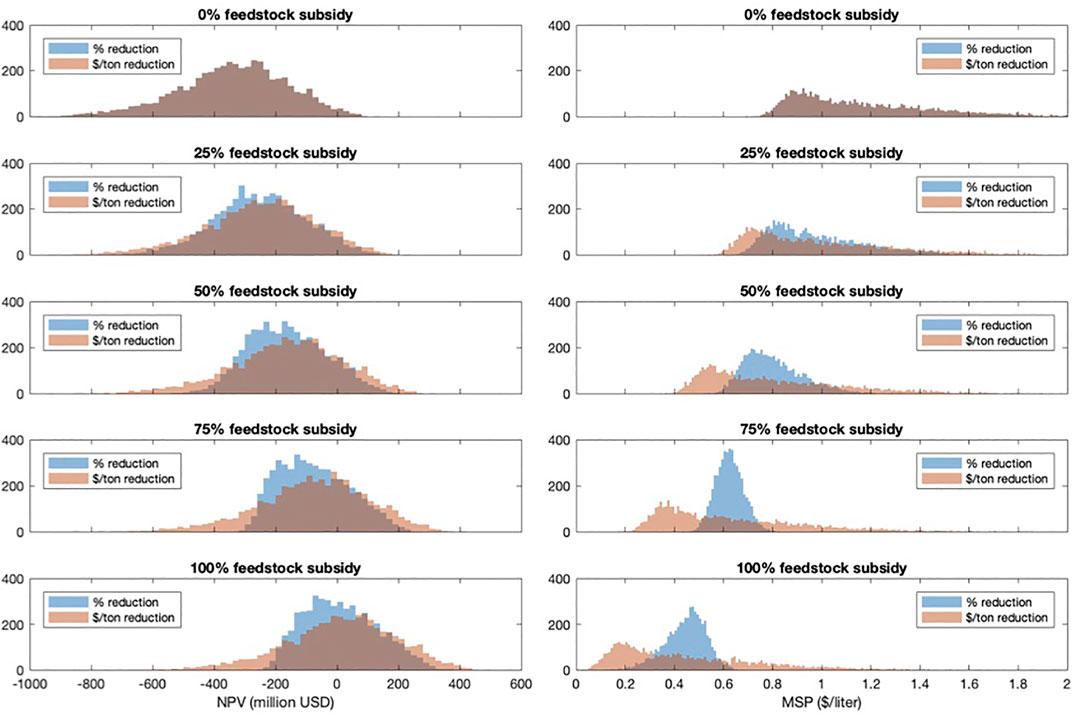
FIGURE 4. Histograms of feedstock subsidy as a percentage subsidy from 0–100% compared to an equivalent fixed $/short ton value.
The variance increases at the highest percentages here in the corn grain ATJ case as we shift from a 75–100% feedstock subsidy. A co-product of this pathway is distillers dried grain with solubles (DDGS), the market price of which is modeled as a percentage of corn grain prices. Because DDGS sales prices and feedstock costs are directly correlated, variance in the two stochastic variables (one a cost, the other a source of revenue) have a mitigating impact on overall variance in the results. When corn grain feedstock costs are reduced to zero, we see variance increase from DDGS sales. Note that, while variance is decreasing, the number of stochastic runs that are above an NPV of zero is decreasing, decreasing the probability of financial viability.
3.6 Limitations and Areas for Future Work
A number of limitations of the analysis and results presented here warrant discussion. Although this study is an “nth” plant analysis, the technologies assessed are relatively nascent at a commercial scale. This means significant uncertainty exists around the technology performance represented here. The mass and energy balances and distributions used for each pathway are based on the best data available to the authors at the time of writing, however higher fidelity empirical data for these fuel production pathways would improve the accuracy of our results. Another significant source of uncertainty lies in the prediction of future costs for inputs and fuels. Further work could focus on augmenting the future cost estimates of commodity inputs, and the associated uncertainty.
In addition, our analysis assumes that all of the modeled facilities are located in the US, and uses US-centric financial assumptions. Refinery siting and location is not accounted for in terms of the costs of permitting, or feedstock availability and pricing. We consider only a single scale bio-refinery (2000 bpd) for ease of comparison across pathways. In reality, we recognize that facility scale would likely be optimized to improve financial performance according to the specific fuel production pathway and local context. These also represent interesting areas for further study.
Finally, this analysis does not account for uncertainty in the policies themselves, such as volatility in the value of output subsidies (RIN values, CORSIA carbon credits). We assume that policies are in place for the entire operating lifetime of a facility which may not be the case. In addition, the policy types assessed here may interact with the financial structure and taxation of a given project, but this feedback is not represented in our models.
4 Conclusion
This study compares the impact of five different policy types on six SAF pathways. In all the pathways modeled, the median NPV is below zero, indicating the need of policy support for financial viability. The breakeven analysis shows that a pathway is unlikely to achieve financial viability through the impact of a single policy. However, the cumulative impact of multiple policies, similar in magnitude to policies operating today, brings all pathways to financial viability. In addition, impacts on pathways for the policies modeled are independent. Finally, policies can be implemented in a way to impact variance of pathway NPV and MSP, effectively reducing investment risk.
Data Availability Statement
The original contributions presented in the study are included in the article/Supplementary Material, further inquiries can be directed to the corresponding author.
Author Contributions
ZJW collected data, created and ran simulations, analyzed results, and wrote the first draft of the manuscript. MDS guided the methodology of the work and revised the manuscript for the final version. WET, XZ, RM, HO, FA, SRHB supported the research technically, provided data, and made edits to the manuscript.
Funding
This research was funded by the U.S. Federal Aviation Administration Office of Environment and Energy through ASCENT, the FAA Center of Excellence for Alternative Jet Fuels and the Environment, project 1 through FAA Award Number 13-C-AJFE-MIT under the supervision of James Hileman and Daniel Williams. Any opinions, findings, conclusions or recommendations expressed in this material are those of the authors and do not necessarily reflect the views of the FAA.
Conflict of Interest
The authors declare that the research was conducted in the absence of any commercial or financial relationships that could be construed as a potential conflict of interest.
Publisher’s Note
All claims expressed in this article are solely those of the authors and do not necessarily represent those of their affiliated organizations, or those of the publisher, the editors and the reviewers. Any product that may be evaluated in this article, or claim that may be made by its manufacturer, is not guaranteed or endorsed by the publisher.
Supplementary Material
The Supplementary Material for this article can be found online at: https://www.frontiersin.org/articles/10.3389/fenrg.2021.751722/full#supplementary-material
References
Bann, S. J., Malina, R., Staples, M. D., Suresh, P., Pearlson, M., Tyner, W. E., et al. (2017). The Costs of Production of Alternative Jet Fuel: A Harmonized Stochastic Assessment. Bioresour. Tech. 227, 179–187. doi:10.1016/j.biortech.2016.12.032
Bittner, A., Tyner, W. E., and Zhao, X. (2015). Field to Flight: A Techno-Economic Analysis of the Corn stover to Aviation Biofuels Supply Chain. Biofuels, Bioprod. Bioref. 9, 201–210. doi:10.1002/bbb.1536
Brown, T. R. (2015). A Critical Analysis of Thermochemical Cellulosic Biorefinery Capital Cost Estimates. Biofuels, Bioprod. Bioref. 9, 412–421. doi:10.1002/bbb.1546
Christensen, A., Searle, S., and Malins, C. (2014). A Conversational Guide to Renewable Identification Numbers (RINs) in the U.S. Renewable Fuel Standard (Accessed: : 2019-05-26).
Niziolek, A. M., Onel, O., Hasan, M. M. F., and Floudas, C. A. (2015). Municipal Solid Waste to Liquid Transportation Fuels - Part II: Process Synthesis and Global Optimization Strategies. Comput. Chem. Eng. 74, 184–203. doi:10.1016/j.compchemeng.2014.10.007
Pearlson, M., Wollersheim, C., and Hileman, J. (2013). A Techno-Economic Review of Hydroprocessed Renewable Esters and Fatty Acids for Jet Fuel Production. Biofuels, Bioprod. Bioref. 7, 89–96. doi:10.1002/bbb.1378
Seber, G., Malina, R., Pearlson, M. N., Olcay, H., Hileman, J. I., and Barrett, S. R. H. (2014). Environmental and Economic Assessment of Producing Hydroprocessed Jet and Diesel Fuel from Waste Oils and Tallow. Biomass and Bioenergy 67, 108–118. doi:10.1016/j.biombioe.2014.04.024
Staples, M. D., Malina, R., Olcay, H., Pearlson, M. N., Hileman, J. I., Boies, A., et al. (2014). Lifecycle Greenhouse Gas Footprint and Minimum Selling price of Renewable Diesel and Jet Fuel from Fermentation and Advanced Fermentation Production Technologies. Energy Environ. Sci. 7, 1545–1554. doi:10.1039/c3ee43655a
Staples, M. D., Malina, R., Suresh, P., Hileman, J. I., and Barrett, S. R. H. (2018). Aviation Co2 Emissions Reductions from the Use of Alternative Jet Fuels. Energy Policy 114, 342–354. doi:10.1016/j.enpol.2017.12.007
Suresh, P., Malina, R., Staples, M. D., Lizin, S., Olcay, H., Blazy, D., et al. (2018). Life Cycle Greenhouse Gas Emissions and Costs of Production of Diesel and Jet Fuel from Municipal Solid Waste. Environ. Sci. Technol. 52, 12055–12065. doi:10.1021/acs.est.7b04277
Weibel, D. (2018). Techno-economic Assessment of Jet Fuel Naphthalene Removal to Reduce Non-volatile Particulate Matter Emissions. Cambridge, MA: Master’s thesis, Massachusetts Institute of Technology.
Zhao, X., Brown, T. R., and Tyner, W. E. (2015). Stochastic Techno-Economic Evaluation of Cellulosic Biofuel Pathways. Bioresour. Tech. 198, 755–763. doi:10.1016/j.biortech.2015.09.056
Keywords: sustainable aviation fuel, monte-carlo simulation, environmental policy, biofuels, techno-economic analysis
Citation: Wang ZJ, Staples MD, Tyner WE, Zhao X, Malina R, Olcay H, Allroggen F and Barrett SRH (2021) Quantitative Policy Analysis for Sustainable Aviation Fuel Production Technologies. Front. Energy Res. 9:751722. doi: 10.3389/fenrg.2021.751722
Received: 01 August 2021; Accepted: 05 November 2021;
Published: 08 December 2021.
Edited by:
Season Hoard, Washington State University, United StatesReviewed by:
Christopher Michael Saffron, Michigan State University, United StatesBenyamin Khoshnevisan, Chinese Academy of Agricultural Sciences (CAAS), China
Copyright © 2021 Wang, Staples, Tyner, Zhao, Malina, Olcay, Allroggen and Barrett. This is an open-access article distributed under the terms of the Creative Commons Attribution License (CC BY). The use, distribution or reproduction in other forums is permitted, provided the original author(s) and the copyright owner(s) are credited and that the original publication in this journal is cited, in accordance with accepted academic practice. No use, distribution or reproduction is permitted which does not comply with these terms.
*Correspondence: Mark D. Staples, bXN0YXBsZXNAYWx1bS5taXQuZWR1