 Tao Zhang
 Hua Bai2
 Shuyu Sun
- 1Computational Transport Phenomena Laboratory (CTPL), Physical Science and Engineering Division, King Abdullah University of Science and Technology, Thuwal, Saudi Arabia
- 2PipeChina, Beijing, China
Natural gas has been attracting increasing attentions all around the world as a relatively cleaner energy resource compared with coal and crude oil. Except for the direct consumption as fuel, electricity generation is now another environmentally-friendly utilization of natural gas, which makes it more favorable as the energy supply for urban areas. Pipeline transportation is the main approach connecting the natural gas production field and urban areas thanks to the safety and economic reasons. In this paper, an intelligent pipeline dispatch technique is proposed using deep learning methods to predict the change of energy supply to the urban areas as a consequence of compressor operations. Practical operation data is collected and prepared for the training and validation of deep learning models, and the accelerated predictions can help make controlling plans regarding compressor operations to meet the requirement in urban natural gas supply. The proposed deep neutral network is equipped with self-adaptability, which enables the general adaption on various temporal compressor conditions including failure and maintenance.
Introduction
Natural gas has been recognized as an important energy source for urban energy supply and industry fuel. Thanks to the high-quality, efficient and low-carbon advantages, increasing the consumption proportion of natural gas in primary energy will help to control air pollution and improve the quality of ecological environment (Wood, 2020). According to the BP Statistical Review of World Energy 2021 (Statistical Review of World Energy, 2021), global energy consumption in the year 2020 decreased by 4.5% compared with the previous year, which is also the largest decline since the end of World War II. The main reason for the decline in energy consumption is the unprecedented reduction in oil demand. In order to control the spread of the epidemic, different levels of blockade measures have been taken all over the world, resulting in a sharp decline in energy demand related to transportation. The decline in oil consumption accounted for about three-quarters of the total decline in energy demand. Thanks to China’s continued strong growth, natural gas consumption has shown greater flexibility (Qin et al., 2018). In 2020, global natural gas consumption decreased by 81 billion cubic meters year-on-year, a decrease of 2.3%. Nevertheless, the proportion of natural gas in primary energy consumption continued to rise, reaching a record high of 24.7% (Che et al., 2021). The largest year-on-year growth in consumption was China and Iran, with an increase of 22 billion cubic meters and 10 billion cubic meters respectively. Except for the direct consumption as fuel, natural gas can also be used for combined heat and power generation. It has been reported that in terms of NOx emissions (average), gas-fired power plants are 55% lower than coal-fired power plants, and in terms of smoke emission (average value), gas-fired power plants are 70% lower than coal-fired power plants. Thus, considering the smaller pollutant emission, emission reduction cost, energy consumption and water consumption of gas-fired power generation compared with those of coal-fired power generation, natural gas has been welcomed as the electricity supply to urban areas with more economic and environmental benefits (Rey et al., 2021).
The natural gas industry chain is usually divided into three parts: upstream exploration and production, midstream transportation and downstream distribution. As the bridge connecting upstream and downstream areas, transportation plays an important role in ensuring both the economic production and safe supply for urban consumption (Zhang et al., 2019). Pipeline transportation takes the pipeline as the carrier and uses pressurized facilities to pressurize natural gas, so that it flows from high pressure to low pressure and thus transported to the destination. Compared with other transportation carriers, pipeline has the advantages of low transportation cost, large transportation volume, high safety performance and low transportation loss. Especially, the less land occupation using buried pipelines and less impact from the bad weather/traffic conditions makes pipeline transportation more suitable for urban energy supplies (Li et al., 2020). The huge natural gas pipeline system constitutes the main artery of urban operation. Because natural gas has the characteristics of flammability and explosion, whether the pressure and flux in the pipeline are always maintained in a reasonable range during its transmission and consumption is the key consideration for safe, stable and continuous gas supply to urban users. Therefore, the accurate monitoring and regulation of the flow and pressure values in the gas pipeline is the key approach to reduce the safety risk of the natural gas pipeline network system and improve the management and regulation efficiency.
The urban energy supply through natural gas pipelines is usually carried out by contracts, plans and assignment (Lv and Ding, 2020). The contract is the annual purchase and sales volume and price agreement signed between the sales company and the user, which is more the determination of macro resources. Monthly plan is the specific plan and arrangement for the user’s gas consumption in the next month, which is clearer and more instructive. Daily assignment is the basis for the user to extract the gas consumption of the next day. After the sales company agrees and is approved by the dispatching center, it will be transported according to the daily designated quantity as the basis for measurement and handover. It is the direct voucher for the transfer of property rights between the buyer and the seller and the main content of daily production of the user and the sales company. Thanks to the complex station systems in urban natural gas supply networks, the control center should learn the information of important stations in time and accurately, and the dispatching personnel should make correct evaluation and decisions of the overall operation to issue accurate guidance instructions. Therefore, building a pipeline dispatch scheme with rapid response and intelligent regulation is conducive to the long-term, effective, economic and stable operation of urban natural gas supply system.
Pipeline dispatching systems are usually suggested by numerical modeling and simulation of flow and transport behaviors in the pipeline flow, by which the computed pressure and flux information is essentially required in the decision makings (Ahmadian Behrooz and Boozarjomehry, 2015; Madoliat et al., 2016; Sundar and Zlotnik, 2018). Due to the complex topological structure and hydrodynamic mechanisms of natural gas pipeline network, researchers have been focusing on the accelerated numerical methods to quickly predict the key operation features (Steinbach, 2007; Liu et al., 2020). A reduction technique was proposed in (Grundel et al., 2013) using proper orthogonal decomposition and radial basis function surrogates to reduce the pipeline network complexity as well as the CPU time used for computations. Similarly, orthogonal collocation technique was used in (Ahmadian Behrooz and Boozarjomehry, 2015) to solve the governing equations considering energy balance properties. The electronic circuit concepts of resistance, capacitance, and inductance were proposed in (Ke and Ti, 2000) to construct ordinary differential equations (ODEs) with the first order accuracy, which significantly reduces the computational cost compared with conventional governing equations. Meanwhile, the conventional governing equations were linearized in (Zhou et al., 2017) and the Laplace transform was carried out to implement the temporal problems, for which the explicit finite difference method was adapted to solve the discretized formulations. On the contrary, the fully implicit discretization was carried out in (Madoliat et al., 2016), in which the particle-swarm optimization method was adapted to accelerate the flow rate calculations. Implicit solvers were also developed in (Behbahani-Nejad et al., 2019; Bermúdez and Shabani, 2019), where the high-order Finite Element (FE) method was used to implement the discretization. The implicit Euler method was adapted in (Steinbach, 2007; Liu et al., 2020) to implement pipeline simulation considering temporal conditions, which was then further used to suggest energy supply with uncertainties of gas components and energy demand. Pipe inclinations were incorporated in the governing equations in (Herrán-González et al., 2009), in which the Crank–Nicolson scheme was used to implement the numerical discretization. Practical natural gas mixing phenomena with different components was investigated in (Guandalini et al., 2017), and the conventional volume-based approach was used to solve the governing equations incorporating the energy formulation considering calorific value. The effect of simplifying assumptions and comparisons among isothermal and non-isothermal models were carried out in (Brouwer et al., 2011), as well as a thorough investigation on different gas pipeline models.
The recent popularity on deep learning methods has opened a new window for fast and accurate gas pipeline simulations. A breakthrough study was reported in (Zhang et al., 2021), using deep learning technique to predict the transportation flux at certain key stations as a consequence of compressor operations. The simplified engineering scenario, as well as the self-adaptive deep neural network, was proved to be effective in the flux estimations. Other applications of data-driven techniques and deep learning algorithms in energy transportation systems have been reported in (Zheng et al., 2021) and (Su et al., 2021). In this paper, a more realistic engineering scenario will be proposed to mimic the practical dispatching process so as to suggest on the proper dispatching plans for maintaining or changing natural gas supply to the urban area. We will concentrate on the consideration of compressor failures and offline status, and generate a possible dispatching plan involving the controllable compressors to meet certain goal. The remainder of this paper is organized as follows. In Engineering Scenario Section, the engineering scenario is described with details on the decision making process, and explanations on the dispatching diagram is presented. The deep learning technique for energy supply prediction is introduced in Deep Learning Method Section with self-adaptability, followed by an example case in Results and Discussion Section, showing the detailed implementation of making pipeline dispatching plans assisted by the proposed self-adaptive deep learning techniques. Remarkable conclusions are provided in the end, with expectations on the further investigations in the future based on the authors’ working and research experience.
Engineering Scenario
In the modern natural gas pipeline dispatching systems, the dispatchers working in the controlling center may work on the intelligent system to release instructions of opening or closing certain compressors along the pipeline. The working status of all the compressors are reflected on the central system, and the transportation flux and pressure are monitored to ensure a safe and economic energy supply. In order to maintain, increase or decrease the energy supply to the urban area according to the demand change and policy issues, the dispatchers need the flux prediction as the consequence of possible compressor operations to make decisions regarding the dispatching plans. Thus, an intelligent dispatching process is proposed in this paper to assist the practical plan decisions using deep learning methods. As shown in Figure 1, the system will first check the compressor status along the whole pipeline and convert it to compressor Boolean values (CB). The open compressors will be marked as “1” and the closed compressors will be marked as “0”. Specifically, the compressors that cannot be accessed remotely or controlled immediately will be noticed and exclude in the further plan making process. Besides, the aimed energy supply to the urban area should be determined as the dispatching goal, and an error tolerance is also needed to check the performance of suggested operation plans in the following steps. Based on that, possible compressor operation plans can be generated as a combination of all the proper opening/closing operations on all the accessible and controllable compressors. Such constrains on the uncontrollable compressors can significantly reduce the number of generated plans. The deep learning model trained from practical operation data will then be used to predict the transportation flux for each plan, which holds the self-adaptability for general working conditions. Afterwards, the predicted transportation flux will be compared with the energy supply demand of the urban area. The trial will end if the prediction variance reaches within the acceptance criteria, and the best operation plan will be determined with the least variation from the dispatching goal, i.e., energy demand. This operation plan as well as the prediction variation will be suggested to the pipeline dispatcher to make decisions accordingly.
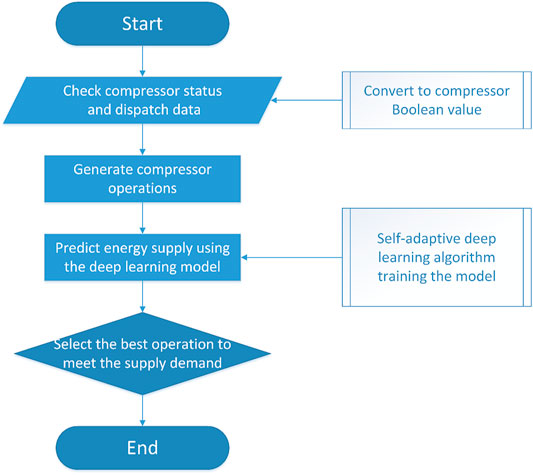
FIGURE 1. Flowchart of the intelligent dispatch process.
The digitalization of compressor working status and the operations is carried out by introducing the concept of compressor Boolean values. Furthermore, the compressor working status is illustrated according to the Boolean values to draw the schematic diagram of the pipeline dispatch scenarios to benefit the dispatcher to quickly understand the compressor operations. As shown in Figure 2, the compressor stations along the pipeline is plotted as small houses and the compressors are plotted as trapezoids. The working status of each station is marked by the color of the corresponding flag. The red flag means that this station is offline, which could be neither accessible in the central monitoring system nor controllable by the dispatchers. These stations may be under maintenance or there could be failure in the data transmissions between stations and controlling center. On the country, the online stations are marked by green flags, which means that they are under normal working conditions and the dispatchers can directly control the inside facilities with an immediate response. Similarly, the compressors in all the stations are marked as offline and online by the color of red and green respectively, to illustrate the accessibility and working status. Such information is required after the first step of compressor status check, and can help the dispatcher get a preliminary impression of the current pipeline working status.
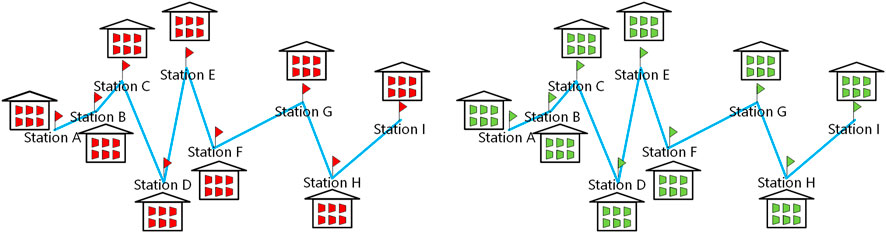
FIGURE 2. Schematic diagram of pipeline dispatch scenarios Left: All the compressors along the pipeline is offline (marked as red). Right: All the compressors along the pipeline is online (marked as green).
In general pipeline dispatch scenarios, compressors can be either open or closed in the daily operations, and the color of orange is defined in this paper to mark the closed compressors along the pipeline. Compared with red compressors, the orange ones are currently closed, but can be opened immediately as a consequence of dispatcher’s command from the controlling center. As shown in Figure 3, there could be online stations and offline stations along the certain pipeline at the certain moment, and there could be open compressors and closed compressors in the online stations. It should also be noted that in real pipeline operations, there might be offline compressors in online stations due to the compressor failures or maintenance. Such a three-color diagram of general pipeline dispatch scenarios can help the dispatchers catch up with the current working status of all the compressors and stations along the pipeline, and make clear which compressors can be opened/closed to reach the certain dispatching goal.
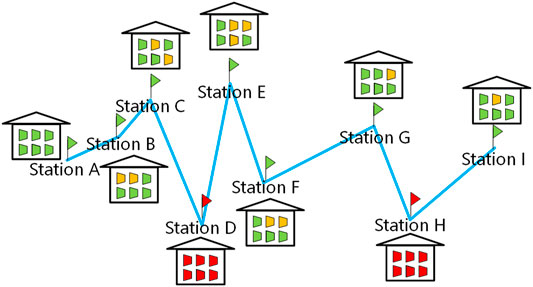
FIGURE 3. Schematic diagram of general pipeline dispatch scenarios.
Deep Learning Method
Data Preparation
One real natural gas pipeline is investigated in this paper, with 9 compressor stations along it and the number of compressors in each station is listed in Table 1. The operation data of this pipeline is collected in the period during 2017–2020, where the compressor working status and transportation flux is focused. In practical operations, the data collected in the central controlling system may contain various labels including “offline” and “no data”. Both the two labels indicate either the non-accessibility or failure of corresponding compressors, where maintenance may be carried out or there is error in data transmission. An example of pipeline dispatching diagram is illustrated in Figure 4, showing the offline stations A, E and H on the date 2018.06.11. The transportation flux outputted from Station I is the energy supply to one certain urban area. An implicit assumption of the designed intelligent natural gas pipeline dispatch system and the proposed deep learning algorithm in this paper is the constant gas properties in both thermodynamics and fluid dynamics. This assumption is accepted by our industrial partner as the transported gas is always resourced from certain production field for one certain pipeline, and the dispatching system should be thoroughly renewed if the transported gas is changed, which requires an additional data collection and deep learning work. There might be temporal environmental changes along the pipeline like flooding or frozen soil that may affect the transportation capabilities, and these temporal impacts are expected to be eliminated if the deep learning model is trained using a large-enough data set.

TABLE 1. Compressor information along the pipeline.
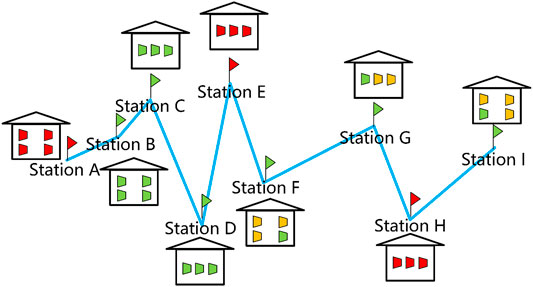
FIGURE 4. Schematic diagram of compressor working status on 2018.06.01.
The main purpose of the proposed intelligent natural gas pipeline dispatching system is to predict the transportation flux at certain key stations as a consequence of compressor operations. Suggestions on opening or closing the compressors will be made after comparisons between the estimated transportation capability and the notified energy demand in the urban destinations. Dispatching plans will be decided if the predicted variance is less than the error tolerance, and the compressors operations as well as predicted flux and variance will all be informed to the dispatchers in the central controlling center. Thus, we need to first identify the direct relevance between compressor operations and the transportation flux. The idea was first proposed and verified in (Zhang et al., 2021), in which a simplified engineering scenario was designed to describe this relevance, and a deep learning model is trained to calculate the implicit relevance by introducing the concept of compressor Boolean values. Based on that, the proposed intelligent dispatching system in this paper is expected to illustrate the compressor working status and the corresponding energy supply via this pipeline, to help the dispatchers quickly get the information they need. As shown in Figure 5, the station and compressor working status along the pipeline during the period 2018.06.01-2018.06.11 is plotted in the left, and the change of energy supply via this pipeline during the period is plotted in the right. It can be referred from the illustration that Station A is offline during the whole period, which corresponds to the maintenance in the station at that time in the recordings. Station C and H were offline on the first day, and then back to normal status in the following days, which indicates that the maintenance was completed or the error in data transmission was fixed. Meanwhile, Station I was offline on the last day, which might indicate the beginning of maintenance. Besides, there were other offline compressors in normal-working stations, and they should also be eliminated in making the dispatching plan. With the different compressor working status, the energy supply to the urban area, represented by the transportation flux at Station I, had been changed during that period. All the information illustrated in this image will be fed into the deep learning step to train the model, in which the network structure and deep learning techniques will be introduced in the following sections. Finally, a similar illustration is expected to be provided to the dispatchers, with both compressor operations and predicted transportation flux as energy supply. This scenario has also been accepted by our industrial partner.
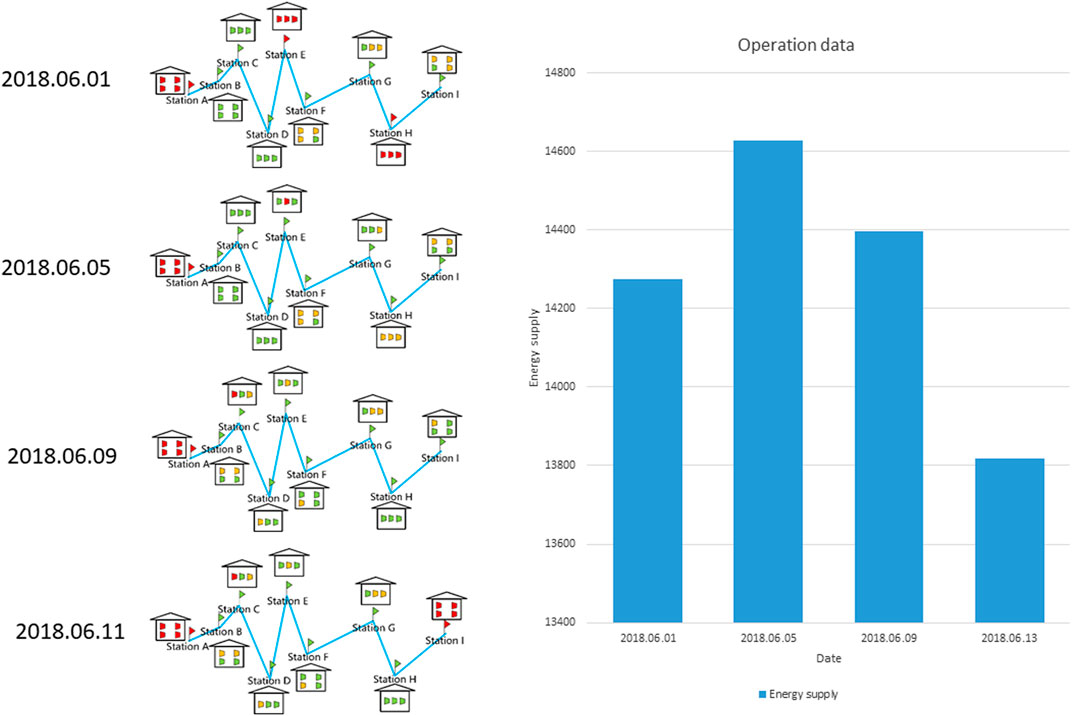
FIGURE 5. Compressor operations and the corresponding energy supply via the pipeline.
Network Structure
One highlight of the proposed intelligent system is the self-adaptability, which means that we can use one trained model to predict the transportation flux under different working status. For example, Station A, E and H were offline on 2018.06.01, which caused the 10 corresponding compressors eliminated from the data on that day. Meanwhile, Station A and Station I were offline on 2018.06.11, and the first compressor in Station C was also offline, which caused 9 corresponding compressors eliminated from the data on that day. Thus, the effective data size of compressor Boolean values are different, which challenges the general adaption of the deep neural network designed for this pipeline. In order to resolve the difference in data size, the concept of “ghost compressors” is introduced to fulfill the input data according to the pipeline information. If one certain pipeline is constructed with M compressors located in S stations, M-N ghost compressors will be padded into the data point after the compressor check step is finished with N reported normal working compressors. As shown in Figure 6, all the compressor Boolean values are marked as
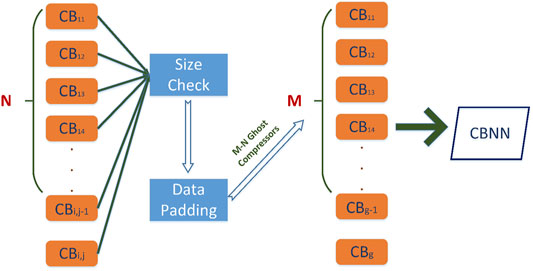
FIGURE 6. Self-adaptive compressor padding network (SCPN).
The structure of CBNN is illustrated in Figure 7. The compressor Boolean values as well as dispatch conditions are inputs in the first layer, and the output layer will inform us the output flux (
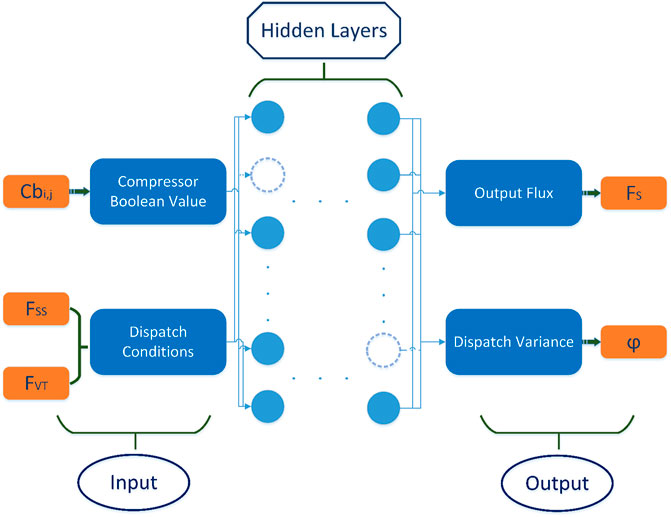
FIGURE 7. Compressor boolean neural network (CBNN).
Deep Learning Technique
The neural network mimics the information transmission in human brains to make decisions, while the computation in each node is carried out according to the following equation:
where
where
One typical difficulty in the dispatch of long-distance natural gas pipeline is to use the large-scale coefficient matrix to evaluate the work of alongside compressors, which requires us to reasonably give the initialization coefficient to improve the convergence speed in training, so as to improve the performance and reliability of the deep learning algorithm. If the coefficient parameters are overestimated during initialization, a rapid increase in variance will be observed during training, which may further lead to gradient explosion or disappearance. In this case, the training will never converge. On the contrary, if the coefficient parameters are underestimated during initialization, the variance may quickly decline to a very small value, which will lead to damage to the complexity of the model and even the performance of the final evaluation. The commonly used initialization method is to initialize the coefficient parameters with a certain variance according to the Gaussian distribution to ensure that the input and output variance of each layer will remain unchanged. This is the commonly used Xavier initialization technology, which is also applied to the design of deep learning algorithm for the purpose of pipeline transportation prediction in this paper. Dropout is another technique often used to improve the training speed and learning performance, by which some nodes in the network is discarded to eliminate the corresponding connection relationship, so as to significantly reduce the degree of freedom of the model. As shown in Figure 7, the dotted circle in the hidden layer represents the node deleted by dropout, and the corresponding training model is changed to:
where
Due to the complexity of pipeline transportation prediction model containing a large number of compressors and the huge amount of training data, the training of deep learning model is very time-consuming. In addition, the gradient descent process will change the weight parameters and dropout nodes of each layer, which will further affect the distribution of linear and nonlinear calculation results in each layer. The next layer keeps adapting to this distribution change, which slows down the learning rate of the whole network. In addition, when we use certain activation functions such as sigmoid and tanh, it is common to make the model training fall into the gradient saturation region, where the gradient will become very small or even close to 0. As a result, the update speed of parameters will be slowed down, which may further affect the convergence speed of the network. Such phenomena is called internal covariate shift (ICS) problem, a common seen challenge in machine learning. The popular solution is whitening, even if the input feature distribution has the same mean and variance, so as to slow down the impact of ICS problem. However, the computational cost of whitening technology is too high, especially for each layer in each round of training, which is not preferred for the training efficiency. In addition, the whitening process changes the distribution of each layer of the network, thus changing the expression capability of the own data in the network. The parameter information learned by the underlying network will be lost by whitening operation. Therefore, this paper adopts the more advanced batch normalization (BN) method to calculate the mean for each batch of data samples, and then standardize. Learning parameters are introduced to linearly transform the normalized data to recover the information expressed by the data itself.
Results and Discussion
Scheme Verification
The complex nonlinear correlations among the compressor operations and transportation flux is modeled by the combination of computations in each node. Nonlinear hydrodynamic and thermodynamic analysis is often required in conventional numerical studies of pipeline transportations, while a elaborate discretization and matrix solver is needed to get accurate and reliable results, especially when temporal compressor failure or error occurred. Thus, hyperparameters in the neural network structure should be carefully tuned to better describe the physical rules underneath the correlations among input and output features. The changing curve of loss function with respect to different number of nodes in hidden layers is plotted in Figure 8. It can be easily referred from the plot that generally more nodes in the hidden layers can accelerate the convergence of loss function, but there remains a threshold number of nodes, above which the loss function converges much slower with more training time. Thus, 300 nodes in the hidden layers is enough for a quick training convergence and acceptable CPU time.
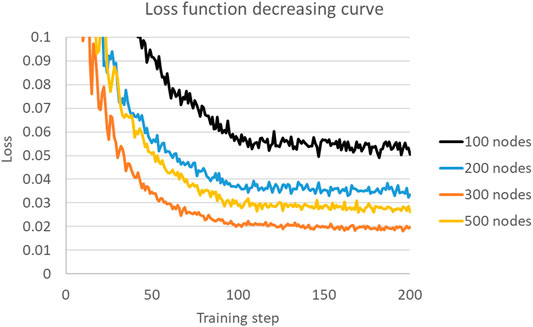
FIGURE 8. Loss function decreasing curve with different number of nodes.
The choice of activation function used in the hidden layers is also of critical importance to the accurate representation of the underneath physical rules within the deep neural network. Especially, the nonlinear correlations among the input compressor operations and the output transportation flux should be recovered by the usage of activation functions. The convergence of loss function using different activation functions is compared in Figure 9. The mathematical models of the four common-used activation functions, namely ReLU, Sigmoid, Softplus and Softsign (Ramachandran et al., 2017; Dubowski, 2020) are formulated as follows:
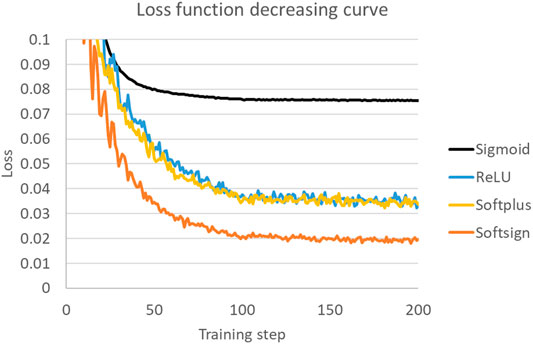
FIGURE 9. Loss function decreasing curve with different activation functions.
It can be referred from Figure 9 that the convergence performance of Sigmoid function performs the worst in representing the physical rules, while the performance of ReLU and Softplus functions looks similar. The Softsign function performs the best in the training of deep learning models predicting natural gas pipeline transportation, with respect to both the convergence rate and prediction accuracy, that is represented by the least converged loss. It is interesting to note that the performance of activation functions varies in different problems, after comparisons with the hypaerparameters tuning in phase equilibrium calculation problems presented in (Zhang et al., 2020).
The optimized network structure after hyperparameters tuning is then verified to check the prediction performance in realistic operation conditions. As shown in Figure 10, operations are conducted on compressors along the pipeline in the daily dispatching, while certain stations and compressors are not controllable. All the compressors in Station A, E and H were offline on 2018.06.01, and all the compressors in Station A remained offline on 2018.06.05, but the compressors in Station H were back to normal online operations. Meanwhile, the second compressor in Station E was still offline on that day, but both the two other compressors were marked as online. Besides, the second compressor in Station G was opened, as well as the fourth compressor in Station I. On 2018.06.09, all the compressors in Station A remained offline, but the second compressor in Station E was back to normal online operations. Meanwhile, the status of the first compressor in Station C was changed to offline, and the open/close operations can be captured on many other compressors along the pipeline. On 2018.06.13, all the compressors in Station A and the first compressor in Station C were still offline, and all the compressors in Station I were also changed to offline. The open/close operations can also be detected in other compressors. The change of corresponding transportation flux via this pipeline during this period can be referred from the right figure, where the real operation data and deep learning prediction on each day are both plotted. It can be easily referred from the plots that the transportation flux as the energy supply to certain urban areas changes significantly with the different compressor working status and operations. The deep learning prediction results, marked as orange, meet well with the practical operation data, marked as blue. The training and testing procedures are verified to be effective to generate and optimize a model that successfully describes the correlations among the input and output features, namely, the complex physical rules among compressor operations and the transportation flux. Compared with conventional numerical simulation methods with discretizing governing equations and iterative solvers, the trained deep learning model can significantly reduce the CPU time. Only a few seconds are needed for this forwarding model, and we can always expect a robust result without worrying about divergence. Another shortcoming of conventional iterative solvers is the variance between the current numerical model and the practical physical rules. The developing models are continuously approaching real conditions including multi-component, multi-phase fluid flows under various environmental conditions. The pipeline corrosion and temporal compressor failures are also challenging the accurate and complete modeling, while the long distance brings more difficulties. However, the developed deep learning model is directly trained from the operation data, thus the simplifications of the current numerical models can be avoided. Furthermore, many more parameters are involved in the deep learning model, enabled by the hundreds of nodes in hidden layers, compared with the limited number of parameters involved in the conventional numerical models. As a result, it is easier to approach the real data by adjusting the parameters.
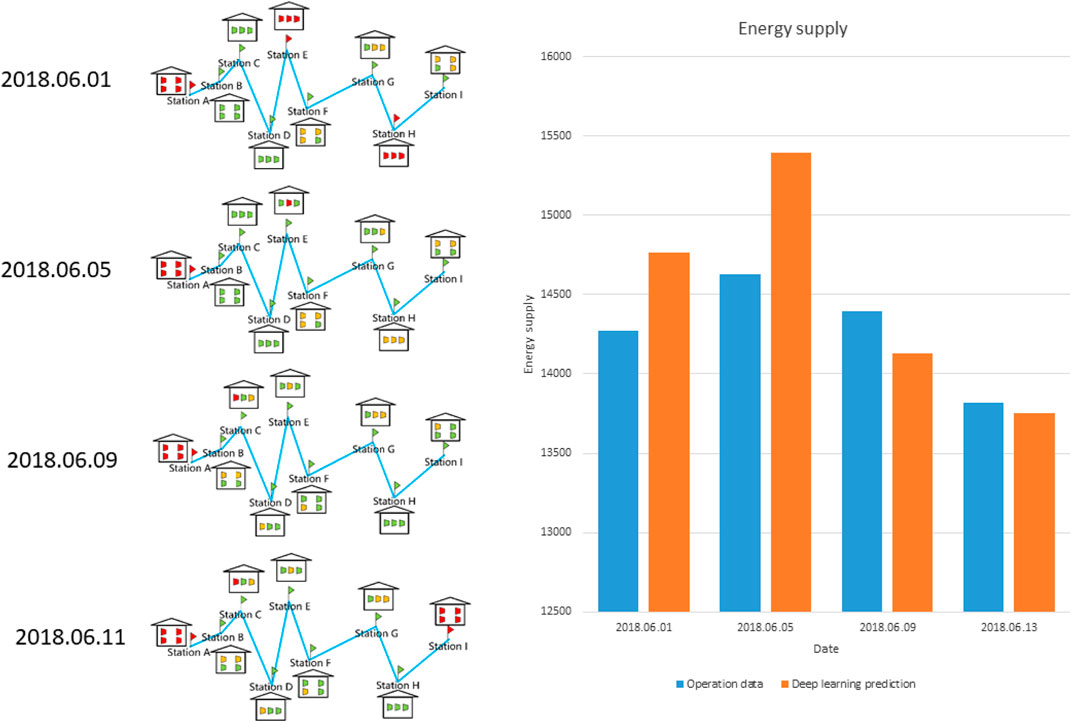
FIGURE 10. Prediction performance in realistic operation conditions.
Plan Decision
The fast prediction of pipeline transportation flux at certain key station as the consequence of compressor operations makes it possible to go through the many potential operation options for each compressor and then select the best combination to meet the dispatching goal. As shown in Figure 1, compressor working status is first checked to eliminate the offline compressors, and dispatching plans are generated to control the online ones. An example is provided as follows.
On 2020.06.01, the compressor check reported that all the compressors are working in normal online conditions. Meanwhile, the dispatching conditions were collected, including the energy supply that was expected to be
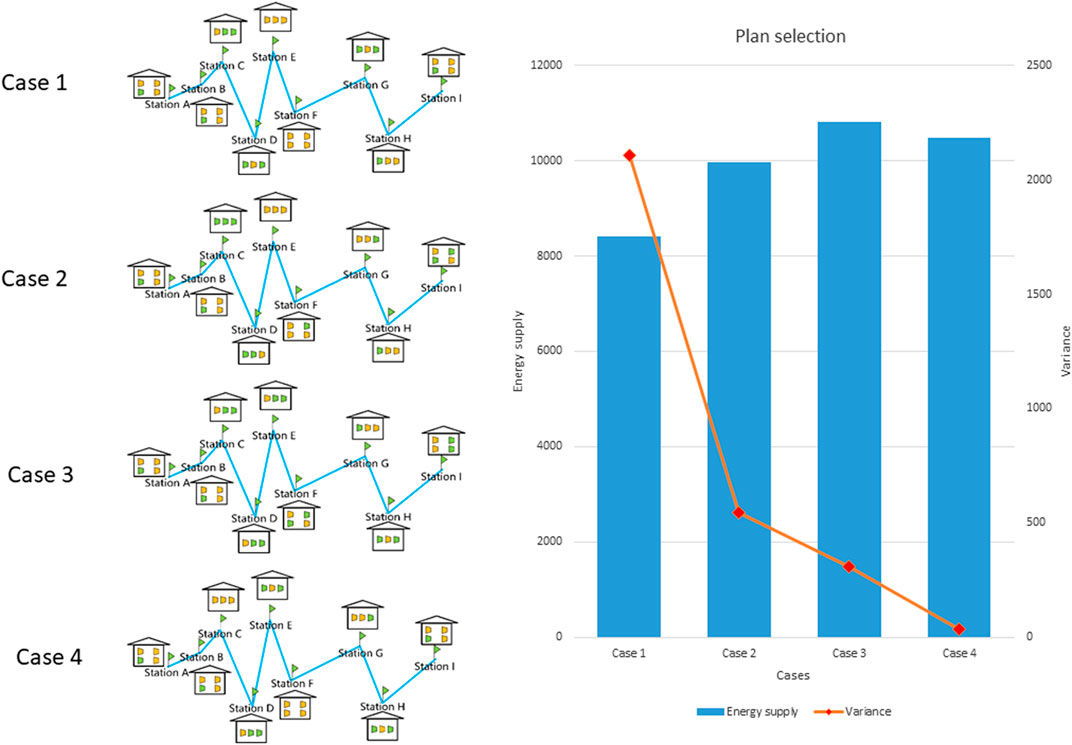
FIGURE 11. Plan selection on 2020.06.01.
Concluding Remarks
An intelligent natural gas pipeline dispatch system is proposed in this paper, using deep learning techniques to train a model that can quickly predict the transportation flux via the pipeline as a consequence of compressor operations along this pipeline. A clear engineering scenario is presented with a flowchart, where the compressor working status is illustrated by different colors in the schematic diagram showing the stations and compressors along the pipeline. The information regarding compressor working status can be quickly captured by the dispatchers in this way, while the digitalized compressor Boolean values are collected to be further analyzed. A self-adaptive pipeline network is designed to uniform the dimension of data by adding “ghost compressors” to replace the offline ones, so that the trained deep learning model can be widely adapted to general scenarios where temporal compressor failures or error in data transmission may occur. A compressor Boolean neural network is also designed to train the model predicting transportation flux as a consequence of compressor operations. Except for the compressor Boolean values, the dispatching conditions including dispatching goal and variance tolerance are also chosen to be the input features, by which the dispatching variance is outputted besides the transportation flux as an index showing dispatching performance. Network hyperparameters are carefully tuned for a better training convergence and prediction accuracy. The optimized network structure is then utilized to train the model, and further verified to recover the realistic data in practical working conditions. The verified model with both good accuracy and efficiency can help the fast prediction of transportation flux under various trial operations, which may suggest the most suitable dispatching plan to the pipeline dispatchers in the controlling center with the corresponding dispatching variance.
Compared with conventional dispatching systems using iterative numerical simulations, the proposed intelligent dispatching system can significantly reduce the computational cost of predicting the transportation flux via certain pipeline. Only seconds of CPU time needed for the prediction of one combination of the operations on all the compressors, which enables the generation and selection of many trials. Without the risk of divergence during the iterations and with less simplifications on the numerical model, the trained deep learning model is believed to better reflect the correlations among compressor operations and transportation flux. The operation data is directly utilized in the training, and there are hundreds of parameters that can be tuned to approach the realistic data. Certain deep learning techniques are used to overcome the problem of overfitting. The self-adaptability on general pipeline working status is more preferred by our industrial partners who are working on the pipeline dispatching decisions, where the challenge of temporal compressor failures is a big problem. Moreover, no specific knowledge regarding thermodynamics or fluid dynamics is required in the system construction and model generation, which can benefit a large of pipeline dispatching engineers.
Data Availability Statement
The raw data supporting the conclusions of this article will be made available by the authors, without undue reservation.
Author Contributions
TZ: Conceptualization, Methodology, Writing HB: Data, Methodology SS: Supervision, Writing - review andamp; editing.
Funding
This work was supported by funding from King Abdullah University of Science and Technology (KAUST) through the grants BAS/1/1351-01-01.
Conflict of Interest
HB was employed by the Company PipeChina.
The remaining authors declare that the research was conducted in the absence of any commercial or financial relationships that could be construed as a potential conflict of interest.
Publisher’s Note
All claims expressed in this article are solely those of the authors and do not necessarily represent those of their affiliated organizations, or those of the publisher, the editors and the reviewers. Any product that may be evaluated in this article, orclaim that may be made by its manufacturer, is not guaranteed or endorsed by the publisher.
References
Ahmadian Behrooz, H., and Boozarjomehry, R. B. (2015). Modeling and State Estimation for Gas Transmission Networks. J. Nat. Gas Sci. Eng. 22, 551–570. doi:10.1016/j.jngse.2015.01.002
Behbahani-Nejad, M., Bermúdez, A., and Shabani, M. (2019). Finite Element Solution of a New Formulation for Gas Flow in a Pipe with Source Terms. J. Nat. Gas Sci. Eng. 61, 237–250. doi:10.1016/j.jngse.2018.11.019
Bermúdez, A., and Shabani, M. (2019). Finite Element Solution of Isothermal Gas Flow in a Network. J. Comput. Phys. 3, 349–355.
Brouwer, J., Gasser, I., and Herty, M. (2011). Gas Pipeline Models Revisited: Model Hierarchies, Nonisothermal Models, and Simulations of Networks. Multiscale Model. Simul. 9 (2), 601–623. doi:10.1137/100813580
Che, X., Zhu, B., and Wang, P. (2021). Assessing Global Energy Poverty: An Integrated Approach. Energy Policy 149, 112099. doi:10.1016/j.enpol.2020.112099
Dubowski, A. (2020). Activation Function Impact on Sparse Neural Networks. arXiv preprint arXiv:2010.05943.
Grundel, S., Hornung, N., Klaassen, B., Benner, P., and Clees, T. (2013). “Computing Surrogates for Gas Network Simulation Using Model Order Reduction,” in Surrogate-Based Modeling and Optimization (New York: Springer), 189–212. doi:10.1007/978-1-4614-7551-4_9
Guandalini, G., Colbertaldo, P., and Campanari, S. (2017). Dynamic Modeling of Natural Gas Quality within Transport Pipelines in Presence of Hydrogen Injections. Appl. Energ. 185, 1712–1723. doi:10.1016/j.apenergy.2016.03.006
Herrán-González, A., De La Cruz, J. M., De Andrés-Toro, B., and Risco-Martín, J. L. (2009). Modeling and Simulation of a Gas Distribution Pipeline Network. Appl. Math. Model. 33 (3), 1584–1600. doi:10.1016/j.apm.2008.02.012
Ke, S., and Ti, H. C. (2000). Transient Analysis of Isothermal Gas Flow in Pipeline Network. Chem. Eng. J. 76 (2), 169–177. doi:10.1016/s1385-8947(99)00122-9
Li, Z., Zhang, H., Meng, J., Long, Y., Yan, Y., Li, M., et al. (2020). Reducing Carbon Footprint of Deep-Sea Oil and Gas Field Exploitation by Optimization for Floating Production Storage and Offloading. Appl. Energ. 261, 114398. doi:10.1016/j.apenergy.2019.114398
Liu, K., Biegler, L. T., Zhang, B., and Chen, Q. (2020). Dynamic Optimization of Natural Gas Pipeline Networks with Demand and Composition Uncertainty. Chem. Eng. Sci. 215, 115449. doi:10.1016/j.ces.2019.115449
Lv, X., and Ding, H. (2020). A Method of Optimal Malfunction Management in Urban Natural Gas Transmission and Distribution Systems. IOP Conf. Ser. Earth Environ. Sci., 510 (2), 022028. IOP Publishing. doi:10.1088/1755-1315/510/2/022028
Madoliat, R., Khanmirza, E., and Moetamedzadeh, H. R. (2016). Transient Simulation of Gas Pipeline Networks Using Intelligent Methods. J. Nat. Gas Sci. Eng. 29, 517–529. doi:10.1016/j.jngse.2016.01.018
Qin, Y., Tong, F., Yang, G., and Mauzerall, D. L. (2018). Challenges of Using Natural Gas as a Carbon Mitigation Option in China. Energy Policy 117, 457–462. doi:10.1016/j.enpol.2018.03.004
Ramachandran, P., Zoph, B., and Quoc, V. L. (2017). Searching for Activation Functions. arXiv preprint arXiv:1710.05941.
Rey, J. R. C., Pio, D. T., and Tarelho, L. A. C. (2021). Biomass Direct Gasification for Electricity Generation and Natural Gas Replacement in the Lime Kilns of the Pulp and Paper Industry: A Techno-Economic Analysis. Energy 237, 121562. doi:10.1016/j.energy.2021.121562
Statistical Review of World Energy (2021). Statistical Review of World Energy. London: BP p.l.c. Available from: https://www.bp.com/content/dam/bp/business-sites/en/global/corporate/pdfs/energy-economics/statistical-review/bp-stats-review-2021-full-report.pdf.
Steinbach, M. C. (2007). On PDE Solution in Transient Optimization of Gas Networks. J. Comput. Appl. Mathematics 203 (2), 345–361. doi:10.1016/j.cam.2006.04.018
Su, H., Chi, L., Zio, E., Li, Z., Fan, L., Yang, Z., et al. (2021). An Integrated, Systematic Data-Driven Supply-Demand Side Management Method for Smart Integrated Energy Systems. Energy 235, 121416. doi:10.1016/j.energy.2021.121416
Sundar, K., and Zlotnik, A. (2018). State and Parameter Estimation for Natural Gas Pipeline Networks Using Transient State Data. IEEE Trans. Control. Syst. Technology 27 (5), 2110–2124. doi:10.1109/TCST.2018.2851507
Wood, D. A. (2020). The Natural Gas Sector Needs to Be Mindful of its Sustainability Credentials. Adv. Geo-energy Res. 43, 229–232. doi:10.46690/ager.2020.03.01
Zhang, H., Liang, Y., Liao, Q., Chen, J., Zhang, W., Long, Y., et al. (2019). Optimal Design and Operation for Supply Chain System of Multi-State Natural Gas under Uncertainties of Demand and purchase price. Comput. Ind. Eng. 131, 115–130. doi:10.1016/j.cie.2019.03.041
Zhang, T., Bai, H., and Sun, S. (2021). A Self-Adaptive Deep Learning Algorithm for Intelligent Natural Gas Pipeline Control. Energ. Rep. 7, 3488–3496. doi:10.1016/j.egyr.2021.06.011
Zhang, T., Li, Y., Li, Y., Sun, S., and Gao, X. (2020). A Self-Adaptive Deep Learning Algorithm for Accelerating Multi-Component Flash Calculation. Computer Methods Appl. Mech. Eng. 369, 113207. doi:10.1016/j.cma.2020.113207
Zheng, J., Du, J., Liang, Y., Liao, Q., Li, Z., Zhang, H., et al. (2021). Deeppipe: A Semi-supervised Learning for Operating Condition Recognition of Multi-Product Pipelines. Process Saf. Environ. Prot. 150, 510–521. doi:10.1016/j.psep.2021.04.031
Keywords: natural gas, pipeline control, urban energy supply, deep learning, compressor operation
Citation: Zhang T, Bai H and Sun S (2022) Intelligent Control on Urban Natural Gas Supply Using a Deep-Learning-Assisted Pipeline Dispatch Technique. Front. Energy Res. 9:759498. doi: 10.3389/fenrg.2021.759498
Received: 16 August 2021; Accepted: 17 December 2021;
Published: 13 January 2022.
Edited by:
Haoran Zhang, The University of Tokyo, JapanReviewed by:
Jianqin Zheng, China University of Petroleum, Beijing, ChinaHuai Su, China University of Petroleum, Beijing, China
Copyright © 2022 Zhang, Bai and Sun. This is an open-access article distributed under the terms of the Creative Commons Attribution License (CC BY). The use, distribution or reproduction in other forums is permitted, provided the original author(s) and the copyright owner(s) are credited and that the original publication in this journal is cited, in accordance with accepted academic practice. No use, distribution or reproduction is permitted which does not comply with these terms.
*Correspondence: Shuyu Sun, c2h1eXUuc3VuQGthdXN0LmVkdS5zYQ==