 Bin Zhang
 Yunzhao Li
 Hongchun Wu2
- 1Science and Technology on Reactor System Design Technology Laboratory, Nuclear Power Institute of China, Chengdu, Sichuan
- 2School of Nuclear Science and Technology, Xi’an Jiaotong University, Xi’an, China
The environment effect arises when pin-cell homogenized parameters are generated with reflective boundary conditions. To treat it in whore-core pin-by-pin calculation, two works are summarized in this article. Firstly, by analyzing the relative errors of pin-cell homogenized group constants and the relative importance of pin-cell discontinuity factors (PDF) in each group, the importance of correcting the PDF of the thermal group is recognized. Secondly, the least-squares method for a multivariate polynomial is utilized to functionalize the relation of the thermal group PDF and the core parameters, including diffusion coefficient, removal cross-section, neutron source, and normalized surface flux. The C5G7 and KAIST benchmarks are employed to evaluate the performance of the PDF predication. Numerical results indicate its effectiveness in reducing the errors of eigenvalue and pin power, especially for the cases with the fuel pins located near the interface between different assemblies.
Introduction
For Pressurized Water Reactor (PWR) simulation, the computational cost of one-step calculation with fully detailed description is still too expensive for routine calculation using either stochastic or deterministic methods, even with the currently most advanced computing powers. Therefore, approximations in spatial, energy, and angular spaces have been developed to provide efficient solutions with acceptable accuracy. With the advantages of small storage and high computing speed, the two-step calculation schemes have successfully been applied to PWR analysis for decades.
In the last few decades, the nodal diffusion calculation accompanied by assembly homogenization has been widely employed (Smith, 1986). It contains 2D lattice neutron-transport calculation and 3D whole-core neutron diffusion calculation. The 2D lattice neutron-transport calculations are carried out for each type of assemblies with reflective boundary conditions to provide assembly-homogenized parameters (including cross-sections, diffusion coefficients, and discontinuity factors) and pin-power form functions. The whole-core diffusion solver determines the nodal power shape and then reconstructs the 3D pin-power distribution (Smith, 1980). One of the most important error sources in the scheme is applying the reflective boundary condition in the lattice calculation. For most large-scale PWRs, the neutron leakage model applied in the assembly homogenization can lead to an accurate result without any other corrections for the reflective boundary condition. There are several reasons. First, the environmental effect is not so strong for large-scale commercial PWRs. Second, fuel assemblies are optically thick which contain more than five neutron-free paths.
With the development of computing technology, an improved scheme named pin-by-pin calculation has become popular in recent years (Park and Park, 2001; Sugimura and Ushio, 2006). Different from the traditional two-step calculation, only the heterogeneous structure within each pin is homogenized, leaving the assembly heterogeneous during the three-dimensional whole-core calculation. It eliminates the assembly homogenization and the pin-power reconstruction. Alone with the development of the pin-cell homogenization technology (Kozlowski et al., 2011; Zhang et al., 2017), the reflective boundary condition used in the process of the pin-cell homogenized parameters becomes the main error source. In principle, the homogenized cross-sections, diffusion coefficients, and the pin-cell discontinuity factors can preserve the neutron leakage and reaction rates only for the boundary conditions at which they were created, i.e., for the reflective boundary condition. However, the exact boundary condition of an assembly in the active core cannot be known a priori for the two-step scheme. What is more, the size of the homogenization region in the pin-by-pin calculation is almost equal to the averaged neutron-free path, making the pin-cell homogenized parameters more dependent on the assembly environment compared with the assembly-homogenized parameters.
In order to achieve further accuracy of the pin-by-pin calculation, several embedding homogenization methods have been estimated (Yamaji et al., 2006; Zhang et al., 2008). These methods usually utilize the embedded heterogeneous assembly calculations to update the group constants on-line. The artificial neural network (ANN) method has also been developed to fit the group constants (Kozlowski et al., 2004; Yu et al., 2017). However, the methods are unstable because of the unpredictable ANN training and uncertainty in the quality of the fitted function. Focused on the environment effect, first in Analysis of Pin-Cell Homogenized Parameters, this article analyzed the errors of the pin-cell homogenized parameters and the relative importance of pin-cell discontinuity factors in each group (Kozlowski, 2005). Secondly, the least-squares method (LSM) utilized for the functionalization of PDF (Kozlowski, 2004) is introduced in the Method for the PDF Predication section. In order to numerically analyze the performance of the method, C5G7 (Smith et al., 2003) and KAIST (Cho, 2000) benchmarks are evaluated in this summary.
Analysis of Pin-Cell Homogenized Parameters
A typical checkerboard assembly problem based on the KAIST benchmark (Cho, 2000), as shown in Figure 1, is utilized to analyze the pin-cell homogenized data. In the pin-cell homogenization, the flux-volume-weight method is used to generate the homogenized cross-sections:
where h, g stands for the energy group and
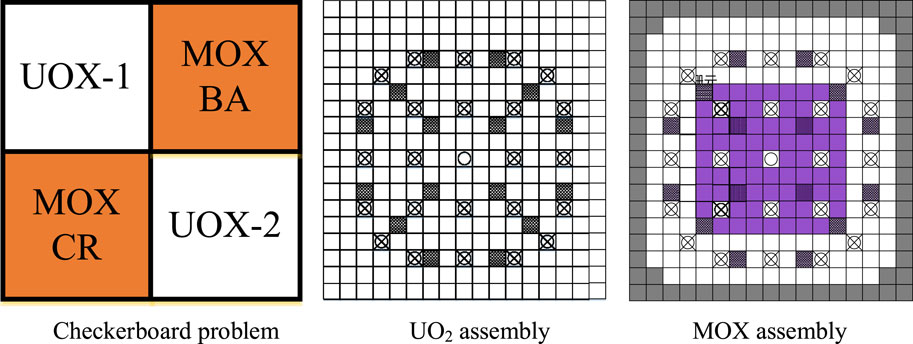
FIGURE 1. Configuration of the checkerboard problem.
Because of the reflective boundary condition performed in the assembly calculations, neither the axial nor radial leakage rate is considered within the heterogeneous assembly calculation. The heterogeneous leakage model (Li et al., 2017) is applied in this work; the heterogeneous leakage equations are shown as follows:
The pin-cell diffusion coefficient for core pin-by-pin calculation would be determined by the space-dependent leakage coefficient from the heterogeneous leakage model.
The GET method was applied in this work. For single-assembly calculation with a specific boundary condition (zero current), the heterogeneous information can be provided by lattice code, while the homogeneous information is supposed to be obtained from the homogeneous neutron diffusion calculation. To get rid of the nonlinear relationship between the homogeneous surface flux and the PDF, a procedure is used to estimate the homogeneous surface flux accurately for the SP3 method using the heterogeneous information (Zhang et al., 2017). The discontinuity factor is defined as the ratio of the heterogeneous over the homogeneous surface fluxes:
where
Two sets of 7-group pin-cell homogenized parameters are generated for the colorset problem:
• The first set is obtained from the whole-core checkerboard calculation in order to eliminate the single-assembly zero net current boundary conditions assumption and incorporate the correct interface spectrum effect between UO2 and MOX assemblies into the homogenized parameters.
• The pin-cell homogenized parameters in the second case are determined by single-assembly calculations with reflective boundary conditions.
Pin-Power Distribution
Figure 2 shows the pin-power relative error distribution of the pin-by-pin SP3 calculation utilized in the second library set. The reference solution is provided by the 2D whole-core one-step transport calculation. It can be found that large pin-power errors always occur in the pins close to the interface between two assemblies due to the large spectral mismatch between the single-assembly and full-core conditions in those locations. The maximum of the relative errors is more than 4% at the interface, while that of other locations would be about 1%.
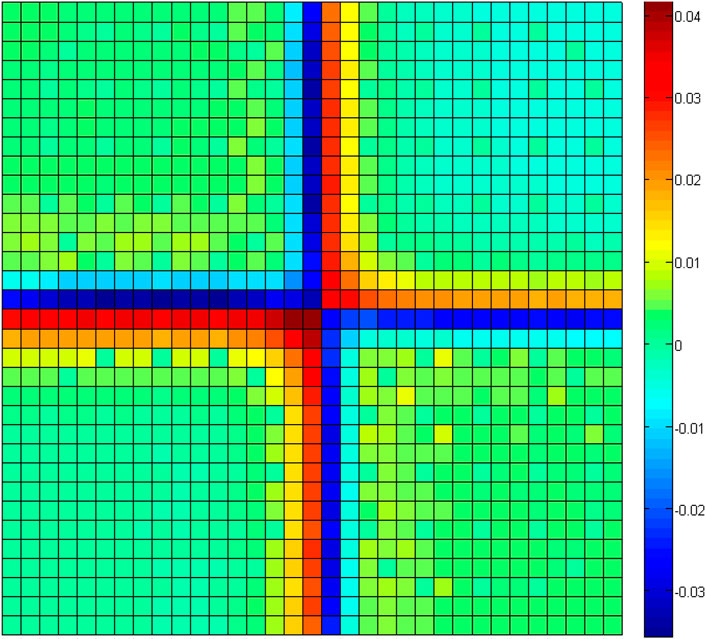
FIGURE 2. Distribution of the pin-power relative error.
Pin-Cell Homogenized Parameters
Figure 3 shows the neutron flux profile between the UO2 and MOX assemblies. Dramatic changes can be found close to the interface of the thermal energy group. The spectrum interference effect between UO2 and MOX is very strong for the fast groups (5–7 groups) while being weak for the thermal group (1–4 groups).
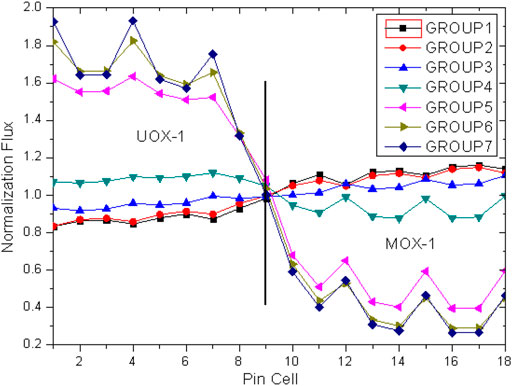
FIGURE 3. The normalization neutron flux distribution.
Part of the relative error distributions of the cross-sections is shown in Figure 4. It can be found that the errors of the pin-cell homogenized cross-sections are small, and the spectrum interference effect of the thermal group is so strong. The maximum error is less than 1.5%.
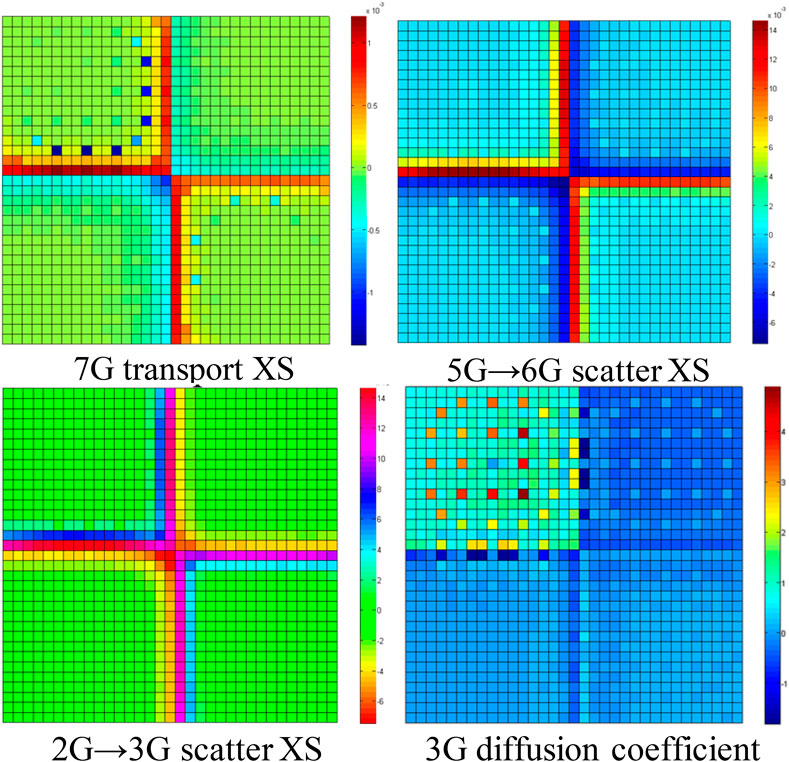
FIGURE 4. Relative error distributions of the cross-sections.
The relative error distributions of the PDF ratio of the first and seventh energy groups are shown in Figure 5. It can be found that the errors of the PDF ratios of fast groups are negligible. It is because that the spectrum interference effect of the fast groups is very weak. In contrast, the errors of the PDF ratios of the thermal groups are very large because of the strong spectrum interference effect between different assemblies. The maximum PDF error of the thermal groups would be more than 10%.
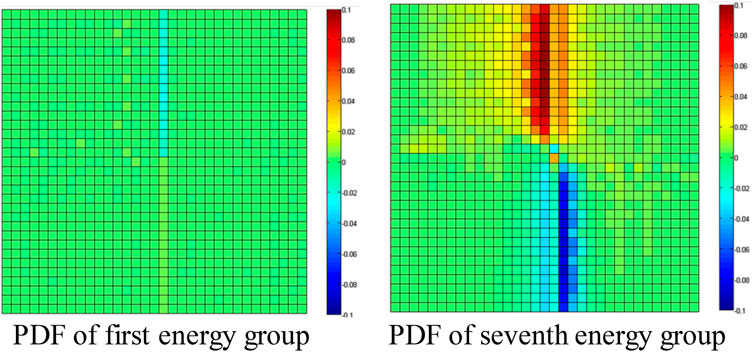
FIGURE 5. Error distributions of the PDF ratio.
Relative Importance of PDF in Each Group
Single-assembly calculations of four different assemblies mentioned in the checkerboard problem were carried out to determine the relative importance of PDF in each group and analyze the interaction effect of the PDF between different energy groups.
Several calculations are carried out as follows:
• The reference solutions are obtained from the transport calculation by the house-developed Bamboo lattice code, which uses the MOC method as the transport solver (Chen et al., 2008; He et al., 2014; Li et al., 2015; Huang et al., 2016).
• The second one is the pin-by-pin SP3 calculation without PDF (Yang et al., 2013; Li et al., 2013; Li et al., 2014; Yang et al., 2016).
• The third results come from the calculation with exact PDF in fast groups or thermal groups and then turned off (set to 1.0) in all other groups.
From the results presented in Table 1, several important conclusions can be made. First, the results with the correct PDF of the thermal group are more accurate than the calculation with the correct PDF of the fast group. It is indicated that the PDF of the thermal group are more important and contribute more to the error than the fast group ones. Secondly, the sum of the eigenvalue differences of each exact PDF equals the calculation results without PDF. It is indicated that the PDF satisfy the neutron balance equation in a group-by-group way. Thirdly, correct PDF in one group with those of other groups set as 1.0 might not improve the solution accuracy; however, they do not make the results worse.
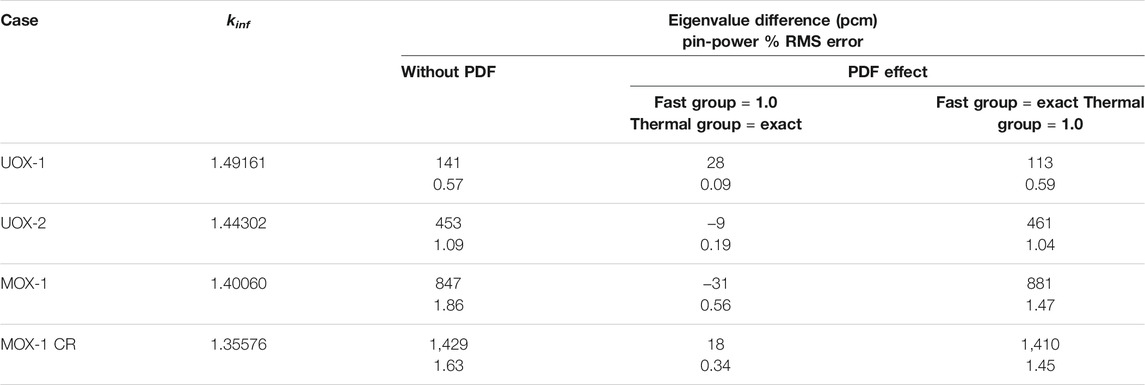
TABLE 1. Single-assembly calculation results.
Method for the PDF Predication
The thermal group PDF have the largest relative errors and the thermal group is more important. Thus, attention should be paid to the correction of the thermal group PDF. In this work, the least-squares method (LSM) for multivariate polynomial is utilized to functionalize the relation of the thermal group PDF and the core parameters. The PDF predication function would be created with heterogeneous solutions obtained from several single-assembly calculations and several spectral geometry calculations. It is expected to predicate PDF with a whole-core homogeneous solution.
The least-squares method (LSM) for multivariate polynomial is written in the way by assuming that x is a vector variable with two or more components:
where
The selection of the core parameters for the function of PDF predication plays an important role in the accuracy of the solutions. In this article, several elements are taken into consideration to pick up the core parameters. First, neutron behaviors are different in different energy groups. Therefore, the core parameters should be selected in a group-by-group manner. Second, the parameters should be associated with the method used in the core nodal solver. Different core methods would lead to different PDF. Third, the parameters should be suitable for any case that appeared in the problem.
In this article, the choice of core parameters is based on the physics underlying core neutronics behavior: neutron leakage, removal, and generation. Thus, there are seven core parameters as follows:
where subscripts i and g stand for the node and the energy group;
Based on the selected seven inputs, the coefficient
In order to determine the order of the PDF predication function, several calculations of different orders are carried out. The relative fitting errors of the PDF predication function are presented in Table 2. It can be found that when the polynomial order of the function is three, the maximum root-mean-square (RMS) error is less than 1%.
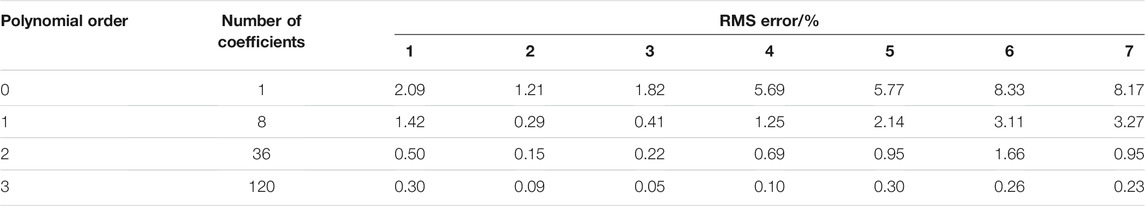
TABLE 2. Relative fitting errors of the different energy-group PDF by different predication function.
In this work, the function of PDF predication is selected as follows:
Taking into consideration the different neutron behaviors between the internal and peripheral locations of the core, two different functions of PDF predication were established for the internal fuel pins and the peripheral fuel, respectively. The PDF predication of reflector pins is considered separately.
Numerical Results
The 2D C5G7 benchmark (Smith et al., 2003) shown in Figure 6 is carried out and the results are summarized in Table 3. The pin-power error distributions are shown in Figure 7. The “MC” in Table 3 represents the reference solutions of Monte Carlo calculation obtained from the benchmark. The “SA” represents that the whole-core SP3 calculation is carried out with the cross-sections and the PDF generated by the single-assembly calculation. The “LSM” represents the PDF of thermal groups obtained by the predication function and the other parameters are just the same as the “SA.” The reference keff is 1.18655 ± 0.00006 within the confidence interval of 98%.
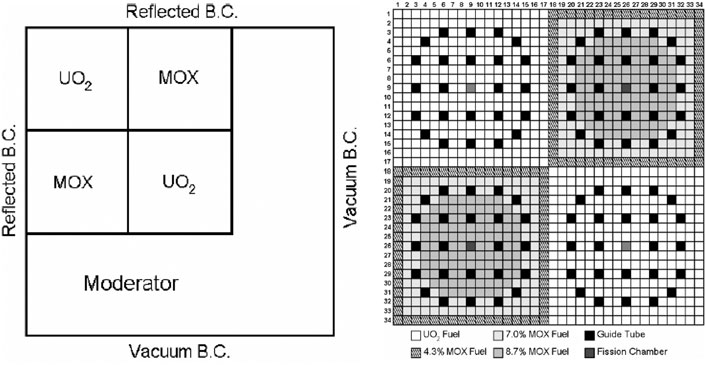
FIGURE 6. 2D C5G7 benchmark.
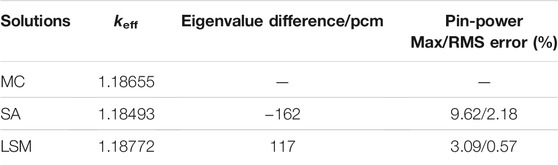
TABLE 3. Summary of the results.
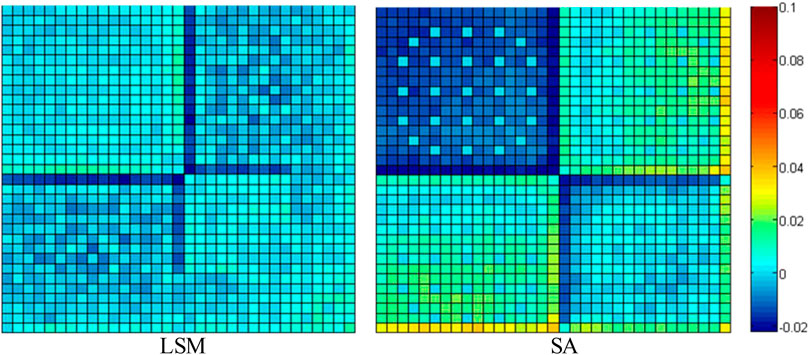
FIGURE 7. Pin-power relative error distributions.
Takingg into consideration the different neutron behaviors between the internal and peripheral locations of the core, two functions of PDF predication were established for the internal fuel pins and the peripheral fuel or reflector pins, respectively. Numerical results indicate that the application of LSM can accurately predicate the PDF of the thermal group and reduce the error of eigenvalue and pin power effectively. Compared with the “SA” calculation, which causes about −162 pcm error in keff and 9.62% maximum pin-power error, the “LSM” calculation reduces these errors, respectively, to 117 pcm and 3.09%. The root-mean-square (RMS) pin-power error is also reduced from 2.18 to 0.57%.
The 2D whole-core problem of the KAIST benchmark (Cho, 2000) shown in Figure 8A is also carried out to analyze the performance of the method. Figure 8B is the pin-power distribution of the reference solution, which comes from the one-step transport calculation. The “SA” and “LSM” have the same meaning as those in the C5G7 benchmark problem. Results are summarized in Table 4. The pin-power error distributions are shown in Figure 9. It leads to the same conclusion. The function of thermal PDF predication works effectively. It can reduce the error and improve the accuracy of the pin-power distribution, especially for the interface locations between different assemblies.
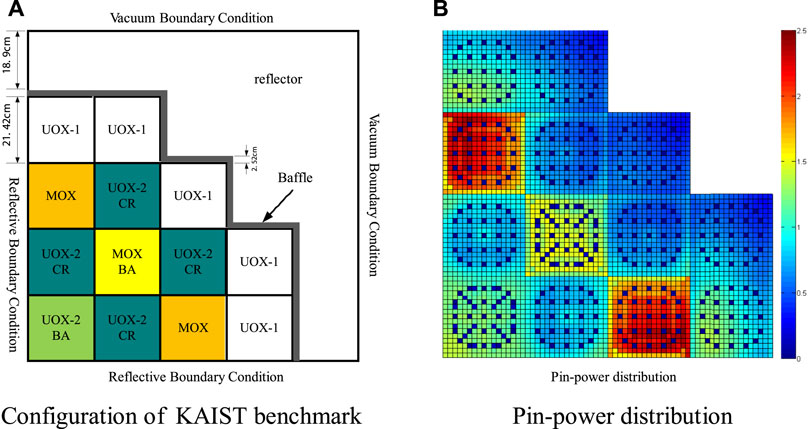
FIGURE 8. 2D whole-core problem of KAIST benchmark. (A) Configuration of KAIST benchmark. (B) Pin-power distribution.
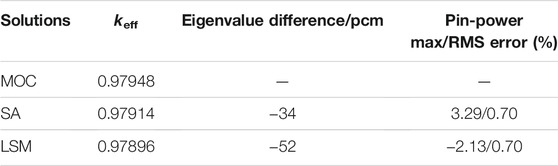
TABLE 4. Summary of the results.
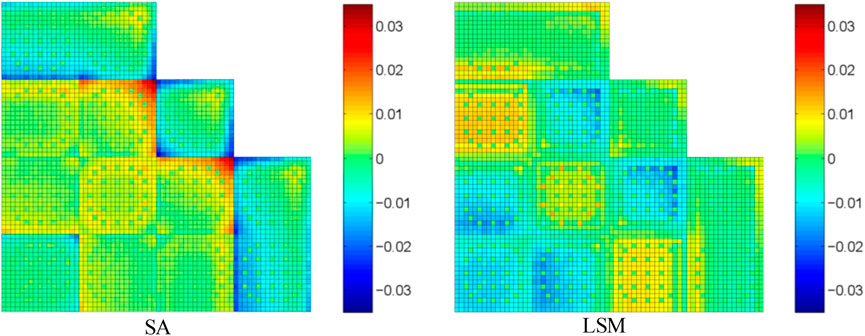
FIGURE 9. Pin-power relative error distributions.
Conclusion
All the pin-cell homogenized parameters are analyzed based on a checkerboard problem. It can be found that the errors of the PDF ratios of the thermal groups are very large, while others are negligible. What is more, the relative importance of the PDF of thermal groups is larger than that of other parameters. Attention would be paid to the correction of the thermal group PDF.
The PDF of the thermal group is functionalized using the least-squares method. The PDF predication function is created with given solutions. It has been proved that the predicated PDF of thermal groups can lead to a more accurate core solution.
Results of the C5G7 and KAIST benchmarks indicate that the PDF predication of the thermal group works effectively in reducing the error of eigenvalue and pin power, especially for the pins located near the interface between different assemblies.
Data Availability Statement
The original contributions presented in the study are included in the article/Supplementary Material; further inquiries can be directed to the corresponding author.
Author Contributions
YL contributed significantly to analysis and manuscript preparation; HW helped perform the analysis with constructive discussions.
Funding
This research was carried out under financial support by the National Natural Science Foundation of China (No.11775171).
Conflict of Interest
The authors declare that the research was conducted in the absence of any commercial or financial relationships that could be construed as a potential conflict of interest.
Publisher’s Note
All claims expressed in this article are solely those of the authors and do not necessarily represent those of their affiliated organizations, or those of the publisher, the editors and the reviewers. Any product that may be evaluated in this article, or claim that may be made by its manufacturer, is not guaranteed or endorsed by the publisher.
References
Smith, M. A., Lewis, L. L., and Na, B-C. (2004). Benchmark on Deterministic 2-D MOX Fuel Assembly Transport Calculations Without Spatial Homogenization. Progress Nuclear Energy 45, 107–118. doi:10.1016/j.pnueene.2004.09.003
Chen, Q., Wu, H., and Cao, L. (2008). Auto MOC-A 2D Neutron Transport Code for Arbitrary Geometry Based on the Method of Characteristics and Customization of AutoCAD. Nucl. Eng. Des. 238, 2828–2833. doi:10.1016/j.nucengdes.2008.04.014
Cho, N. Z. (2000). Benchmark Problem in Reactor and Particle Transport Physics. Daejeon, Korea. Korea Advanced Institute of Science and Technology.
He, L., Wu, H., and Cao, L. (2014). Improvements of the Subgroup Resonance Calculation Code SUGAR. Ann. Nucl. Energ. 66, 5–12. doi:10.1016/j.anucene.2013.11.029
Huang, Kai., Wu, H. C., and Cao, L. Z. (2016). Improvements to the Transmutation Trajectory Analysis of Depletion Evaluation. Ann. Nucl. Energ. 87, 637–647. doi:10.1016/j.anucene.2015.10.013
Kozlowski, T., Lee, D. J., and Downer, T. (2004). The Use of an Artificial Neural Network for On-Line Predication of Pin-Cell Discontinuity Factors in PARCS. Chicago, Illinois, USA: PHYSOR2004.
Kozlowski, T. (2005). Spatial Homogenization Methods for Pin-By-Pin Neutron Transport Calculations, PhD Thesis. Westville, USA: Purdue University.
Kozlowski, T. (2004). The Use of an Artificial Neural Network for On-Line Prediction of Pin-Cell Discontinuity Factors in PARCS. Chicago, Illinois, USA: PHYSOR2004.
Kozlowski, T., Xu, Y., Downar, T. J., and Lee, D. (2011). Cell Homogenization Method for Pin-By-Pin Neutron Transport Calculations. Nucl. Sci. Eng. 169, 1–18. doi:10.13182/nse08-85
Li, Y. Z., Cao, L. Z., and Yuan, X. B. (2014). High Order Source Approximation for the EFEN Method. Japan: PHYSOR.
Li, Y., Zhang, B., Wu, H., and Shen, W. (2017). Heterogeneous Neutron-Leakage Model for PWR Pin-By-Pin Calculation. Ann. Nucl. Energ. 110, 443–452. doi:10.1016/j.anucene.2017.07.002
Li, Y. Z., Wu, H. C., and Cao, L. Z. (2013). Unstructured Triangular Nodal-SP3 Method Based on an Exponential Function Expansion. Nucl. Sci. Eng. 174 (2), 163–171. doi:10.13182/nse11-111
Li, Y. Z., Zhang, B., and Tian, C. (2015). NECP-CACTI: Pressurized Water Reactor Lattice Code Development. Tran. Nucl. Soc. 112, 814–816.
Park, K., and Park, C. (2001). Pin-cell Homogenization via Generalized Equivalence Theory and Embedding Assembly Calculation. Trans. Am. Nucl. Soc. 85, 334.
Smith, K. S. (1986). Assembly Homogenization Techniques for Light Water Reactor Analysis. Prog. Nucl. Energ. 17, 303–335. doi:10.1016/0149-1970(86)90035-1
Sugimura, N., and Ushio, T. (2006). Calculation Models of AEGIS/SCOPE2, A Core Calculation System of Next Generation. Vancouver, BC, Canada: PHYSOR2006.
Yamaji, K., Matsumoto, H., and Nakano, M. (2006). Development of the New Pin-By-Pin Core Calculation Method with Embedded Heterogeneous Assembly Calculation. Vancouver, BC, Canada: PHYSOR2006.
Yang, W., Zheng, Y. Q., Wu, H. C., Cao, L. Z., and Li, Y. Z. (2014). High-Performance Whole Core Pin-by-Pin Calculation Based on EFEN-SP3 Method. Nucl. Power Eng. 35, 164–167. doi:10.13832/j.jnpe.2014.05.0164
Yang, W., Li, Y. Z., and Wu, H. C. (2016). Multi-group GMRES Algorithm for the Exponential Function Expansion Nodal SP3 Method. Idaho, USA: PHYSOR 2016, Sun Valley.
Yu, H., Rehman, H., and Kim, Y. H. (2017). Artificial Neural Network Modeling for 2-group Pin-wise Group Constants. San Francisco, CA, USA: ANS Annual Meeting.
Keywords: PWR, pin-by-pin, environment effect, least-squares method, functionalization
Citation: Zhang B, Li Y and Wu H (2021) Environment Effect Treatments in PWR Whole-Core Pin-by-Pin Calculation. Front. Energy Res. 9:760339. doi: 10.3389/fenrg.2021.760339
Received: 18 August 2021; Accepted: 07 September 2021;
Published: 01 October 2021.
Edited by:
Tengfei Zhang, Shanghai Jiao Tong University, ChinaReviewed by:
Kun Zhuang, Nanjing University of Aeronautics and Astronautics, ChinaXubo Ma, North China Electric Power University, China
Zhuo Li, Sun Yat-sen University, China
Copyright © 2021 Zhang, Li and Wu. This is an open-access article distributed under the terms of the Creative Commons Attribution License (CC BY). The use, distribution or reproduction in other forums is permitted, provided the original author(s) and the copyright owner(s) are credited and that the original publication in this journal is cited, in accordance with accepted academic practice. No use, distribution or reproduction is permitted which does not comply with these terms.
*Correspondence: Bin Zhang, anNzend0emJAMTYzLmNvbQ==