 Yu-Jin Kim
 Libing Yang2
 Soolyeon Cho
 Euy-Joon Lee
- 1Renewable Energy Engineering Department, University of Science and Technology, Daejeon, South Korea
- 2Natural Resources Canada, CanmetENERGY, Ottawa, ON, Canada
- 3Building Energy Technology Lab, North Carolina State University, Raleigh, NC, United States
- 4Energy Effciency and Materials Research Department, Korea Institute of Energy Research, Daejeon, South Korea
In this paper, the development and demonstration of a hybrid solar geothermal heat pump polygeneration system is presented. The poly-generation system has been designed, modeled, and simulated in TRNSYS software environment. Its performance was assessed followed by installation and demonstration at a demo site in Cheongju, Korea. The space heating and cooling load of the building is 13.8 kW in heating mode at an ambient temperature of −10.3°C and 10.6 kW in cooling mode at an ambient temperature of 32.3°C. The simulation data were compared with the field demo data using ISO 13256. The results showed that the model data compare well with the demo data both in heating and cooling modes of operation. At a source temperature of 16.7°C, the heat pump lab performance data-based COPc shows 9.9, while demonstration COPc shows 10.3, thus, representing 4.3% relative error. The heat pump source temperature decreased by 4.0°C from 20.9°C to 16.9°C due to ground heat exchanger coupling and resulted in a COPc increase by 13.3% from 8.5 to 9.8. When compared at the design conditions (outside temperature of 32.3°C), the TRSNYS model overestimated the demonstration site data by 12%, 9.3 vs. 8.1 kW with power consumption of 3.1 vs. 2.2 kW. The hybrid polygeneration system power consumption decreased by 1.2 kW when ambient temperature decreased from 35°C to 25°C.
Introduction
The 21st Conference of Parties (COP 21) was held to reduce greenhouse gas emission for global warming and climate changes (UNFCCC, 2015). The Korean government announced energy policies to reduce greenhouse gases emissions by 37% by 2030, a 20% electricity implementation with renewable energy by 2030, and introduced zero-energy building obligation for public building from 2020 and for private building from 2025 (Korea Ministry of Land, 2019; Kim et al., 2020a; Kim and Yu, 2020). To reach these goals in Korea, a variety of renewable technologies need to be introduced and employed. The future building energy technologies are expected to replace the conventional fossil fuel with clean and renewable options, such as decentralized microgeneration technologies. The developed hybrid solar geothermal technology is an attempt to respond to these major changes in Korean and other international government energy policies. Relatedly, the zero-energy building with the hybrid solar–geothermal heat pump system will accelerate the adoption of hybrid renewable technologies to meet the national renewable energy policy targets.
Photovoltaic–thermal (PVT) is one of these technologies that are able to generate electricity and heat simultaneously. The PVT electricity could be used on-site or exported to the grid. Meanwhile, the PVT energy could be utilized for space and water heating. The PVT research started in the 1970s with a primary aim to increase PV panel power generation by fluid flow cooling. PVT has the advantage of generating not only power but hot water as well, thus, reducing building energy consumption. The Web, Direct, and Spiral are three different types of PVT water collector performance studied based on the ISO 9806 test method that was presented. Under 800 W/ m2 radiation conditions, the maximum thermal and electric performance were indicated, respectively, as 53.5% and 12.4% for Web type, 53.6% and 12.7% for Direct type, and 53.4% and 13.8% for Spiral type (Fudholi et al., 2013). The v-shaped rib effect on solar air collector performance by different rib geometries, pitch and angle to enhance average Nusselt number, and thermal–hydraulic performance that indicated 26% and 18%, respectively (Jin et al., 2017) was studied. The PV surface temperature characteristics with a 50-kW PV system experiment were studied. It was found that annual PV system electricity generation increased by 1% when the temperature characteristic was improved by 0.1%/°C (Khelifa et al., 2015). A comparison of PV and PVT twin system tests for the investigation of PV cell temperature characteristic effect on electricity production (Tina et al., 2015) was studied. A comparison of the PVT water heating system experiment and TRNSYS simulation, which indicated 12.04% and 5.29% error for thermal and electrical energy, respectively (Gagliano et al., 2019), was studied. A numerical PVT model with −30°, 0°, and +30° three different baffle slope angles. The study results were analyzed by the ratio of inlet–outlet temperature and pressure drop that indicated 0.007°C/Pa, 0.005°C/Pa, and 0.006 °C/Pa for −30°, 0°, and + 30°baffle slope angle, respectively (Kim et al., 2020b).
Ground heat exchanger (GHX) can capture or dissipate thermal energy into the ground at a certain depth where the temperature is nearly constant. Therefore, when water or air flows through it, the extracted energy can dissipate to the heat pump increasing its performance (Gao et al., 2008; Luo et al., 2016). Lee et al. studied ground air heat exchanger with a spirally corrugated plate. The study results indicated inlet–outlet temperature and pressure difference, respectively, of 4.02°C and 14.43 Pa for 0 plates, 4.21°C and 248.6 Pa for four plates, 5.28°C and 469.23 Pa for six plates, and 5.81°C and 723.02 Pa for eight plates (Lee et al., 2019). Liu et al. studied the feasibility and performance of ground source heat pump under three different climate cities in China with TRNSYS simulation. The TRSNSY ground source heat pump system presented the most suitable performance in Beijing climate condition and worst performance in Qiqihaer climate condition (Liu et al., 2015). The ground source heat pump food drying system performance (Erbay and Hepbasli, 2014) was studied.
The hybrid solar–geothermal heat pump polygeneration system is a combined system with PVT and GHX technologies to generate heating, cooling thermal energy, and electricity to reduce building energy consumption. (Kim et al., 2013). When the GHX increases the source temperature from 11°C to 19°C, the compressor pressure ratio decreases from 3 to 2.5. Thus, the elevation of the source temperature by GHX can significantly reduce heat pump compressor work. As the daily solar radiation increases, the heat pump operating time can be reduced by 5 h due to the heat pump source temperature that reduces the heat pump compressor work. Choi J et al. studied the comparison of the R22 and R744 hybrid solar geothermal heat pumps system numerically (Choi et al., 2014). As a result, when the heat pump load temperature was increased from 40°C to 48°C, the heat pump performance of the R22 and R744 decreased by 20.1% and 9.0%, respectively. Mehrpooya et al. studied the TRNSYS simulation hybrid solar geothermal system optimization model for a greenhouse that indicated a maximum mean COP of 4.14 to 4.33. Also to compare with gas heaters, the hybrid solar–geothermal systems presented a payback of 2 years from 14 years (Mehrpooya et al., 2015). The PVT geothermal heat pump hybrid system TRNSYS simulation model for residential buildings with exergy and economic analysis (Kavian et al., 2020) was studied. The maximum and minimum energy efficiency in January and July indicated 12.38% and 4.06%, respectively. There are many studies of hybrid solar geothermal heat pump systems, but a few of them have proven the hybrid solar–geothermal heat pump polygeneration system performance with both simulation and system demonstration.
In this paper, a hybrid solar–geothermal heat pump polygeneration system was designed and modeled in TRNSYS and demonstrated in a building located in Cheongju, Korea. The justification of the polygeneration WWHP system has been conducted by comparing the lab WWHP COPc data based on ISO 13526 with the actual demonstration site WWHP COPc data. The verification of the polygeneration system was conducted by comparing the TRNSYS model results with the demonstration site WWHP load and system power consumption data. Finally, the impact of the source temperature on WWHP COPc and the impact of ambient temperature on system energy consumption will be also evaluated in this study. The output of this study could be needed to design and confirm a WWHP cooling system performance based on the WWHP lab performance data and actual demonstration site data. The future perspectives of the study include the contribution of a new carbon-free HVAC system for buildings and communities with this hybrid solar–geothermal heat pump polygeneration system. Therefore, this study could suggest and guide the future direction of a smart controlled carbon-free hybrid solar and geothermal heat pump system design and commission based on the ISO 13256 method WWHP lab performance data and the practical demonstration site performance data.
Hybrid solar–geothermal heat pump polygeneration system and component
Figure 1 is the hybrid solar–geothermal heat pump polygeneration system that includes a factory building, WWHP, PVT module, GHX, and storage tank. The PVT generates thermal energy and electricity simultaneously. The electricity can be used on the polygeneration site or export grid, and the thermal energy is stored in the PVT buffer tank to be utilized as WWHP heat source in the heating season. The geothermal heat presents relatively warmer than the outside air in winter and colder than the outside air in summer. Thus, two boreholes of GHX can be utilized as WWHP heat sources in both the heating and cooling seasons. The WWHP operates to supply heating and cooling thermal energy based on PVT and GHX heat source. When the WWHP starts operation, it consumes 100% electricity of the compressor capacity. The higher frequency of WWHP operation led to consumption of more electricity. Thus, the storage tank was utilized to reduce the frequency of WWHP operation under partial load that reduces the system electricity consumption consequentially. P1 is the PVT fluid flow pump that extracts thermal energy to store in the PVT buffer tank. P2 and P3 are WWHP source pump flows where extract thermal energy is from the PVT buffer tank and GHX, respectively. P4 is the WWHP load pump flow where the pump fluid flows to a storage tank to store heating thermal energy or flows to the FCU to supply cooling energy. P5 is the heating storage tank flow to supply heating thermal energy to FCU. P5 operates separately where the heating space temperature is lower than the setting temperature −1°C whether WWHP is on or off. The heating storage tank is a heating thermal energy damper that reduces the WWHP operating time in case of a small heating load to save electricity.
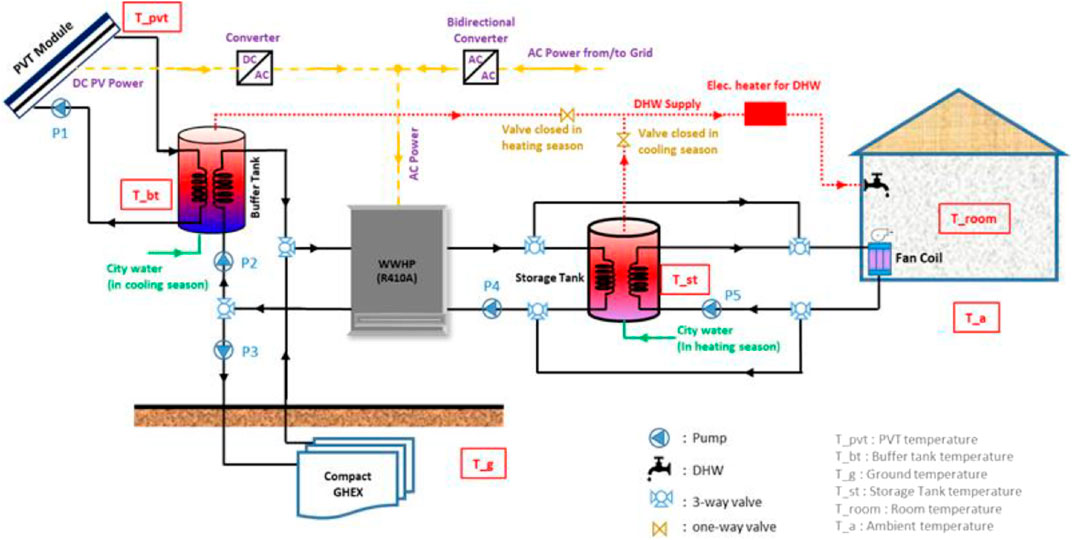
FIGURE 1. Hybrid solar–geothermal heat pump polygeneration system concept.
Figure 2 shows the hybrid solar–geothermal polygeneration application building located in Cheongju, Korea. The building has a floor area of 176 m2 (width 20.0 m × H 6.0 m × depth 8.8).
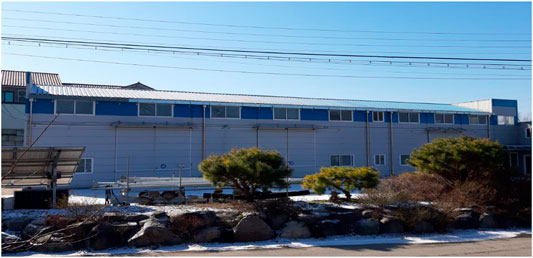
FIGURE 2. Hybrid solar–geothermal heat pump polygeneration demonstration building.
Nam et al. (2018) studied the heating and cooling load design temperature in eight cities in Korea with the Korea Meteoroidal Administration weather data from 1982 to 2015. The space heating and cooling load of the building is 13.8 and 10.6 kW, respectively, in the design temperature heating at −11.9°C and cooling at 32.3°C (Author Anonymous, 2015; Nam et al., 2018).
Figure 3 shows the PVT and GHX installation. A total of 10 U of 300 We PVT module and two of 150-m bore GHX were installed in the demonstration site. Table 1 presents detail specifications of the polygeneration components. Table 2 presents the polygeneration cooling control logic that the system operates related to the state of room temperature–set temperature. Table 3 presents the polygeneration detail sensor and measure range.
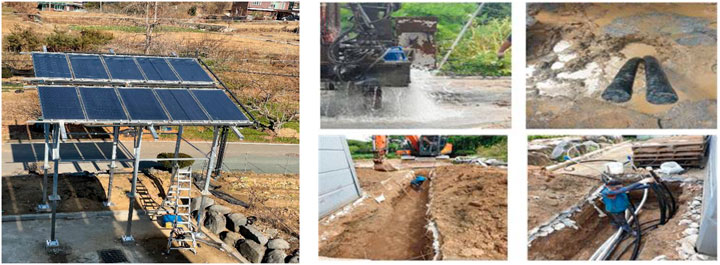
FIGURE 3. Photovoltaic–thermal (PVT) and ground heat exchanger (GHX) installation for the polygeneration.
TABLE 1. Hybrid solar–geothermal polygeneration components (Nam et al., 2018).
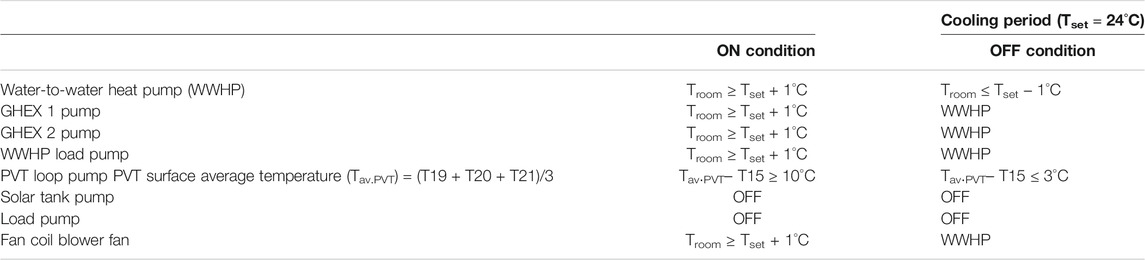
TABLE 2. Hybrid solar–geothermal polygeneration control logic (Andrew Putrayudha et al., 2015).
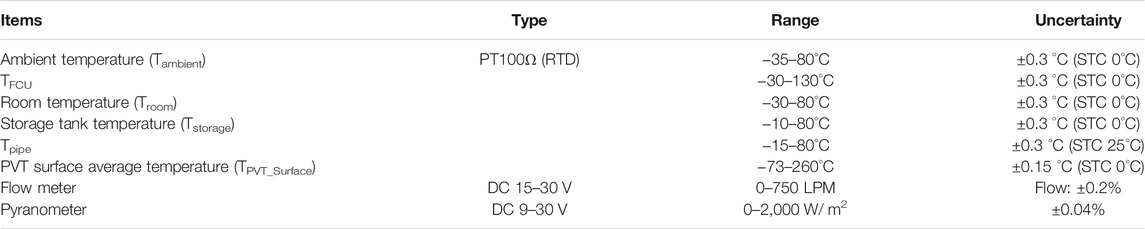
TABLE 3. Hybrid solar–geothermal polygeneration monitoring sensor.
Heat pump is a key component of the hybrid solar–geothermal polygeneration system for the heating and cooling of the building. Therefore, the ISO 13256-based heat pump performance lab data are very important for justification of the demonstration system whether it is properly designed and installed or not. In this paper, a lab test facility was designed and installed based on ISO 13256 (KS 8292) shown in Figure 4. Two of the 25-kW cooling units and 30-kW heater were used to satisfy evaporator conditions, and the 90-kW heating unit was used to satisfy the condenser condition for the heating and cooling performance test. Table 4 shows the 5 RT (17.5 kW) WWHP component and the performance lab tests conducted at various temperature condition cases such as in Table 5 (ISO 13256, 2017). The lab test facility is equipped with pressure and temperature sensors for monitoring and recording the performance data in heating and cooling. The heat pump cooling performance factor COP could be calculated by measuring the heat pump thermal load and the compressor work power as per Eqs 1 and 2 (ISO 13256, 2017).
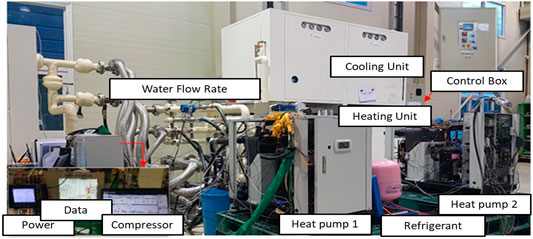
FIGURE 4. Water-to-water heat pump (WWHP) performance test facility (ISO 13256, 2017).
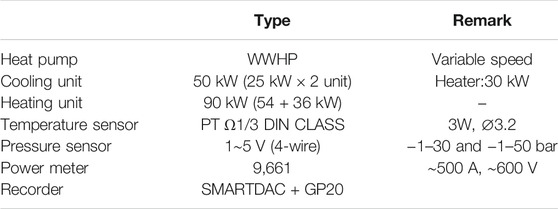
TABLE 4. Water-to-water heat pump performance test component.
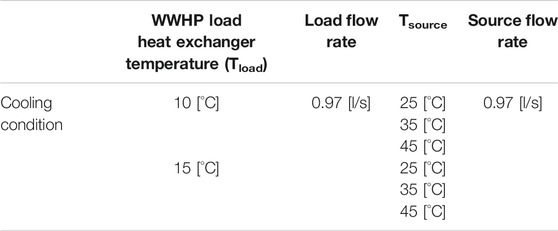
TABLE 5. Water-to-water heat pump performance lab test conditions.
Hybrid solar–geothermal heat pump polygeneration test results
The WWHP demonstration COPc comparison study has been analyzed and compared with the WWHP lab performance data. This comparison is very important for justification of the polygeneration site system whether it is properly designed and installed or not. Figure 5 and Table 6 show the WWHP SET lab COPc and the polygeneration demonstration site COPc data that indicated the WWHP performance according to the source temperature. The cooling performance COPc gradually decreased as long as the source temperature increased. The cooling performance COPc presented a maximum value of 6.84 under the source temperature of 25°C and load inlet temperature of 15.6°C conditions. Also, for the cooling performance, COPc presented a minimum value of 2.84 under the source temperature of 48°C and load inlet temperature of 10°C conditions. In the Cheongju demonstration site, the WWHP has been performing under real-life conditions. The analysis of the WWHP cooling performance under conditions that are the same as the lab test is difficult; thus, extrapolation was used to compare the site cooling data with the lab data. For example, when the WWHP source EWT (entering water temperature) is 16.6°C, which is the same condition, the calculated site data COP was 10.3, while the extrapolation data showed a COP of 9.9, which indicated a 4.3% relative error match. The COP comparison results showed that the polygeneration system is designed and operated reasonably well according to the lab performance. As a result of the COPc impact in Figure 5, The WWHP source temperature was decreased by 4.0°C from 20.9°C to 16.9°C by utilizing the GHXs, which increased the COPc by 13% from a COPc of 8.5 to a COPc of 9.8.
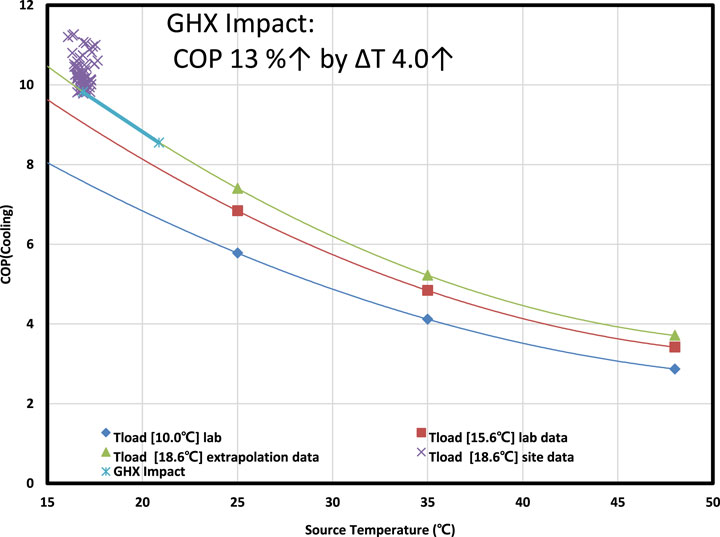
FIGURE 5. WWHP lab vs. demonstration cooling heat pump performance (COPc) comparison.
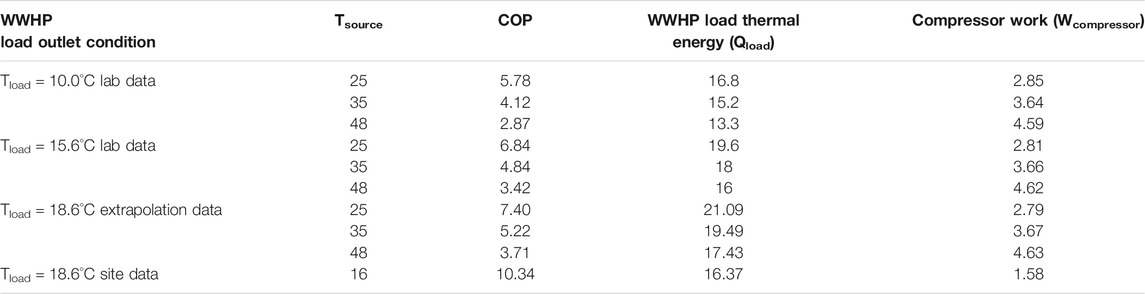
TABLE 6. WWHP lab vs. demonstration site heat pump performance (COP) comparison results.
In the heating and cooling seasons, the polygeneration operates and consumes energy depending on the load and ambient temperature. In the heating season, the polygeneration operates with more time and consumes electricity as long as the ambient temperature decreases. However, in the cooling season, the polygeneration operates with more time and consumes electricity as long as ambient temperature increases by contrast. Thus, system thermal load and power consumption can be analyzed by a V-characteristic curve, such as in Figures 6 and 7 which shows how the polygeneration system reacts to ambient temperature and load clearly and objectively. Liang et al. and Wang et al. used building heating and cooling load depending on ambient temperature with the V-characteristic curve to analyze the HVAC system energy consumption clearly (Liang et al., 2019; Wang et al., 2019). Figure 6 shows the thermal load comparison between the simulation model and test data for different ambient temperatures. Figure 7 shows the power consumption comparison between the simulation model and test data for different ambient temperatures. The red point data in Figures 6 and 7 present the TRNSYS model WWHP heating thermal load and system cooling power consumption, respectively; the blue point data in Figures 6 and 7 present the TRNSYS model WWHP cooling thermal load and system cooling power consumption, respectively; and the yellow point data in Figures 6 and 7 present the site system WWHP cooling thermal load and system cooling power consumption, respectively. When the ambient temperature is at the design cooling temperature of 32.3°C, the TRSNYS model WWHP cooling thermal load was indicated as 9.2 kW, and the demonstration model WWHP cooling thermal load was indicated as 8.1 kW; the TRNSYS component model overestimated the demonstration site data by 12%. At the same design conditions, the TRSNYS model cooling system power consumption indicated 3.07 kW, and the demonstration model WWHP cooling load indicated 2.17 kW; the demonstration cooling load is 0.9 kW lower than the TRNSYS model. This is because the water flow pumps used in simulations were slightly different from the ones at the demonstration site.
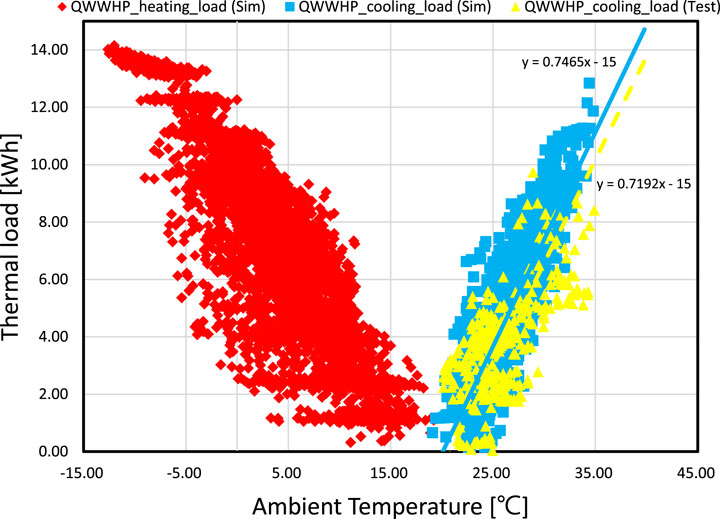
FIGURE 6. Thermal load comparison.
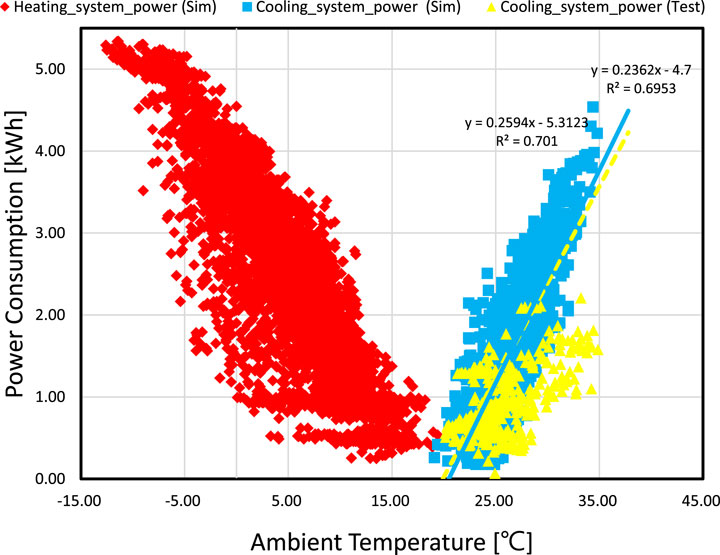
FIGURE 7. Power consumption comparison.
Conclusion
In this paper, a hybrid solar geothermal heat pump polygeneration system was designed and modeled in TRNSYS and demonstrated in a building located in Cheongju, Korea. The justifications of polygeneration are as follows:
1. A hybrid solar–geothermal heat pump polygeneration was designed and demonstrated in a factory building (176 m2 floor area) in Cheongju, Korea. The building heating and cooling load are 13.8 kW for heating at −11.9°C ambient temperature and 10.6 kW for cooling at 32.3 C ambient temperature, respectively.
2. ISO 13256-based WWHP lab performance data showed a COPc of 9.9, and the site demonstration data showed a COPc of 10.3 representing a 4.3% relative error and indicating that the demonstration COP was higher than the lab COP due to higher heat rejection at the same source temperature. As result for the COPc impact, the WWHP source temperature was decreased by 4.0°C from 20.9°C to 16.9°C by utilizing the GHXs, which increased COPc by 13% from COPc 8.5 to 9.8.
3. When the ambient temperature was at the design cooling temperature of 32.3°C, the TRSNYS model WWHP indicated a cooling thermal load of 9.2 kW, and the demonstration model WWHP indicated a cooling thermal load of 8.1 kW; the TRNSYS component model overestimated the demonstration site data by 12%.
4. Also, the TRSNYS model hourly cooling system power consumption indicated 3.1 kW, and the demonstration site hourly cooling power consumption indicated 2.2 kW for the same ambient temperature. The power consumption of this hybrid solar–geothermal heat pump polygeneration system was reduced by 2.6 kw from 3.8 to 1.2 kW when ambient temperature decreased from 35°C to 25°C.
In the future, more COPh impact studies will be conducted during the upcoming cooling and heating seasons.
Data Availability Statement
The raw data supporting the conclusions of this article will be made available by the authors, without undue reservation.
Author Contributions
Y-JK and E-JL conceptualized the study. Y-JK, LY, and EE developed the methodology. Y-JK and E-CK validated the study. Y-JK, LY, EE, and SC conducted the formal analysis. Y-JK and E-CK investigated the study. Y-JK was in charge of the data curation. Y-JK and LY wrote and prepared the original draft. SC, E-JL, and EE wrote, reviewed, and edited the manuscript. All authors have read and agreed to the published version of the manuscript.
Funding
This research was funded by the Korea Institute of Energy Technology Evaluation and Planning (KETEP) and the Ministry of Trade, Industry and Energy (MOTIE) of the Republic of Korea, grant number 20188550000430.
Conflict of Interest
The authors declare that the research was conducted in the absence of any commercial or financial relationships that could be construed as a potential conflict of interest.
Publisher’s Note
All claims expressed in this article are solely those of the authors and do not necessarily represent those of their affiliated organizations, or those of the publisher, the editors, and the reviewers. Any product that may be evaluated in this article, or claim that may be made by its manufacturer, is not guaranteed or endorsed by the publisher.
Abbreviations
Cp, specific heat capacity; COP, heat pump performance; COPc, cooling heat pump performance; COPh, heating heat pump performance;
References
Andrew Putrayudha, S., Kang, E. C., Evgueniy, E., Libing, Y., and Lee, E. J. (2015). A Study of Photovoltaic/thermal (PVT)-ground Source Heat Pump Hybrid System by Using Fuzzy Logic Control. Appl. Therm. Eng. 89, 578–586. doi:10.1016/j.applthermaleng.2015.06.019
Author Anonymous, (2015). The Standard of Energy Saving in a Building, the Ministry of Land, Infrastructure and Transport, 1108.
Choi, J., Kang, B., and Cho, H. (2014). Performance Comparison between R22 and R744 Solar-Geothermal Hybrid Heat Pumps According to Heat Source Conditions. Renew. Energ. 71, 414–424. doi:10.1016/j.renene.2014.05.057
Erbay, Z., and Hepbasli, A. (2014). Application of Conventional and Advanced Exergy Analyses to Evaluate the Performance of a Ground-Source Heat Pump (GSHP) Dryer Used in Food Drying. Energ. Convers. Manage. 78, 499–507. doi:10.1016/j.enconman.2013.11.009
Fudholi, A., Sopian, K., Yzadi, M. H., Ruslan, M. H., and Hussein, A. I. (2013). Kazem A, Perromance Analysis of Photovoltaic Thermal(PVT) Water Collectors. Energ. Convers. Manage. 78, 641–651.
Gagliano, A., Tina, G. M., Nocera, F., Grasso, A. D., and Aneli, S. (2019). Description and Performance Analysis of a Flexible Photovoltaic/thermal (PV/T) Solar System. Renew. Energ. 137, 144–156. doi:10.1016/j.renene.2018.04.057
Gao, Q., Li, M., Yu, M., Spitler, J. D., and Yan, Y. Y. (2008). Review of Development from GSHP to UTES in China and Other Countries. Renew. Sustain. Energ. Rev. 13, 1383–1394.
Jin, D., Zuo, J., Quan, S., Xu, S., and Gao, H. (2017). Thermohydraulic Performance of Solar Air Heater with Staggered Multiple V-Shaped Ribs on the Absorber Plate. Energy 127, 68–77. doi:10.1016/j.energy.2017.03.101
Kavian, S., Aghanajafi, C., Mosleh, H. J., Nazzari, A., and Nazzari, A. (2020). Exergy, Economic and Environmental Evaluation of an Optimized Hybrid Photovoltaic Geothermal Heat Pump System. Appl. Energ. 276. doi:10.1016/j.apenergy.2020.115469
Khelifa, A., Touafek, K., Moussa, H. B., Tabet, I., Hocine, H. B. c. E., and Haloui, H. (2015). Analysis of a Hybrid Solar Collector Photovoltaic Thermal (PVT). Energ. Proced. 74, 835–843. doi:10.1016/j.egypro.2015.07.819
Kim, J. H., Kim, S. H., and Yoo, S. H. (2020). Public Acceptance of the Renewable Energy 3020 Plan Evidence from a Contingent Valuation Study in South Korea. Sustainability 12–12. doi:10.3390/su12083151
Kim, W., Choi, J., and Cho, H. (2013). Performance Analysis of Hybrid Solar-Geothermal CO2 Heat Pump System for Residential Heating. Renew. Energ. 50, 596–604. doi:10.1016/j.renene.2012.07.020
Kim, Y. J., Lee, K. S., Yang, L., Entchv, E., Kang, E. C., and Lee, E. J. (2020). Validation and Numerical Sensitivity Study of Air Baffle Photovoltaic-thermal Module. Energies 13–8. doi:10.3390/en13081990
Kim, Y. W., and Yu, K. H. (2020). Study on the Certification Policy of Zero Energy Building in Korea Sustainability, 12, 8. doi:10.3390/su12125172
Korea Ministry of Land (2019). Infrastructure and Transport, 2019, Notification 2019-179, Regulations on Zero Energy Building.
Lee, K.-S., Kang, E.-C., Kim, Y.-J., and Lee, E.-J. (2019). Model Verification and Justification Study of Spirally Corrugated Pipes in a Ground-Air Heat Exchanger Application. Energies 12, 4047. doi:10.3390/en12214047
Liang, M., Meng, Y., Lu, N., Lubkeman, D., and Kling, A. (2019). HVAC Load Disaggregation Using Low-Resolution Smart Meter Data. IEEE Power & Energy Society Innovative Smart Grid Technologies Conference ISGT. doi:10.1109/ISGT.2019.8791578
Liu, Z., Xu, W., Qian, C., Chen, X., and Jin, G. (2015). Investigation on the Feasibility and Performance of Ground Source Heat Pump (GSHP) in Three Cities in Cold Climate Zone, China. Renew. Energ. 84, 89–96. doi:10.1016/j.renene.2015.06.019
Luo, J., Rohn, J., Xiang, W., Bertermann, D., and Blum, P. (2016). A Review of Ground Investigations for Ground Source Heat Pump (GSHP) Systems. Energy and Buildings 117, 160–175. doi:10.1016/j.enbuild.2016.02.038
Mehrpooya, M., Hemmatabady, H., and Ahmadi, M. H. (2015). Optimization of Performance of Combined Solar Collector-Geothermal Heat Pump Systems to Supply thermal Load Needed for Heating Greenhouses. Energ. Convers. Manage. 97, 382–392. doi:10.1016/j.enconman.2015.03.073
Nam, A. Y., Park, J. J., and Kim, Y. I. (2018). Study on the Change of South Korea Outdoor Design Temperature According to the Assigned Period. J. Clean Energ. Tech. 6 (3), 465. doi:10.18178/jocet.2018.6.3.465
Tina, G. M., Grasso, A. D., and Gagliano, A. (2015). Monitoring of Solar Cogenerative PVT Power Plants: Overview and a Practical Example. Sustainable Energ. Tech. Assessments 10, 90–101. doi:10.1016/j.seta.2015.03.007
UNFCCC (2015). Historic Paris Agreement on Climate Change: 195 Nations Set Path to Keep Temperature Rise Well below 2 Degrees Celsius. United Nations Climate Change Retrieved from : https://unfccc.int/news/finale-cop21.
Keywords: ground heat exchanger, heat pump, photovoltaic-thermal, poly-generation, tri-generation, zero energy building
Citation: Kim Y-J, Yang L, Entchev E, Cho S, Kang E-C and Lee E-J (2022) Hybrid Solar Geothermal Heat Pump System Model Demonstration Study. Front. Energy Res. 9:778501. doi: 10.3389/fenrg.2021.778501
Received: 17 September 2021; Accepted: 28 October 2021;
Published: 03 January 2022.
Edited by:
Elisa Marrasso, University of Sannio, ItalyReviewed by:
Gianluca Lillo, University of Naples Federico II, ItalyRosaria Volpe, University of Catania, Italy
Copyright © 2022 Kim, Yang, Entchev, Cho, Kang and Lee. This is an open-access article distributed under the terms of the Creative Commons Attribution License (CC BY). The use, distribution or reproduction in other forums is permitted, provided the original author(s) and the copyright owner(s) are credited and that the original publication in this journal is cited, in accordance with accepted academic practice. No use, distribution or reproduction is permitted which does not comply with these terms.
*Correspondence: Euy-Joon Lee, ZWpsZWVAa2llci5yZS5rcg==