 Rui Yang
 Kuining Li
 Yi Xie
 Wei Li
 Yuping Qian4
 Yangjun Zhang
 Hongxiang Zhang
- 1Key Laboratory of Low-grade Energy Utilization Technologies and Systems (Chongqing University), Ministry of Education of China, Chongqing University, Chongqing, China
- 2School of Energy and Power Engineering, Chongqing University, Chongqing, China
- 3College of Mechanical and Vehicle Engineering, Chongqing University, Chongqing, China
- 4State Key Lab of Automotive Safety and Energy, School of Vehicle and Mobility, Tsinghua University, Beijing, China
At present, 48 V mild hybrid battery systems are widely used in hybrid electric vehicles to reduce fuel consumption and emissions. The battery pack often operates at high discharge/charge rates and requires an efficient and compact battery thermal management system (BTMS) to control its temperature, improve its electrical performance and extend its life. Due to their short start-up times and simple structures, semiconductors can provide rapid refrigeration and cool a battery quickly in response to sudden high current rates. Therefore, semiconductors were applied to the BTMS of a 48 V battery. The performance of the semiconductor-based BTMS was studied by simulation and experiment at high discharge rates (up to 9.375 C). Firstly, a thermal model of the BTMS was developed that integrates a resistance-based battery thermal model, a semiconductor thermal model and a three-dimensional fluid-solid coupled heat transfer model. Unlike a traditional thermal model, the proposed model considers the joint influences of SOC, temperature and current on battery resistance and improves the predictive precision of the battery’s thermal behaviour. The thermal model was verified by an experiment, with the results showing that it could precisely describe the temperature increase in the battery (maximum average absolute error within 0.9°C). Finally, the BTMS thermal model was applied to predict the cooling performance of the semiconductor BTMS at an ambient temperature of 37°C and high current rates (up to 9.375 C), which was compared with that of an air-cooled BTMS. The results demonstrate that the semiconductor-based BTMS achieves lower battery temperature than the air-cooled BTMS and ensures a temperature difference within the 48 V pack of <1.6°C.
1 Introduction
Over the past decade, new energy vehicles have rapidly become a technological focal point, as they can reduce fossil fuel consumption and the negative environmental impacts of vehicular traffic (including ground-level ozone, regional smog and climate change) (Dunn et al., 2011). Hybrid electric vehicles (HEVs) are a combination of fossil-fuelled and electric vehicles (EVs). They use an electric motor in parallel with an internal combustion engine (ICE) and also have a kinetic energy recovery function, which saves energy and reduces fuel costs while ensuring range (Maggetto and Van Mierlo, 2001; Bradley and Quinn, 2010). Compared with regular hybrid technology, the 48 V mild hybrid system offers better space utilization and easier integration with ICE-based powertrains, as well as lighter weight and lower cost (Ran et al., 2017; Lee et al., 2018; Yu et al., 2018).
Lithium-ion batteries are used as the power source in 48 V systems because of their good energy density, power density and service life. However, high-power 48 V battery pack systems produce high amounts of heat, which directly affects battery performance, lifetime and safety (Yang et al., 2014; Placke et al., 2017; Huang et al., 2018). For optimal battery performance, its operating temperature needs to be controlled within 25–40°C, and the temperature difference between battery cells should not exceed 5°C (Pesaran, 2002; Malik et al., 2016; Al-Zareer et al., 2017). Therefore, a battery thermal management system (BTMS) is necessary to ensure performance and avoid accidents such as combustion and explosion caused by thermal runaway (Ianniciello et al., 2018).
Currently, BTMSs have achieved cooling using air, liquid, heat pipes, phase-change materials and semiconductor-based thermoelectric cooling (TEC). Semiconductor cooling has received widespread attention for its short start-up time, simple structure and ability to achieve rapid cooling under instantaneous high currents. It is usually combined with one or more other cooling methods. In 2003, Alaoui et al. (Alaoui and Salameh, 2003; Alaoui and Salameh, 2005) were the first to study BTMSs based on TEC technology for use in EVs and demonstrated their feasibility. Li, Song, and Lyu (Song et al., 2018; Li et al., 2019; Lyu et al., 2019) combined TEC with forced-air, phase-change material, and liquid cooling methods to improve the cooling of battery modules. Song, Sirikasemsuk, and Seo (Seo et al., 2018; Song et al., 2018; Sirikasemsuk et al., 2021) investigated the effects of TEC parameters such as semiconductor arrangement, optimal ambient temperature range, cooling power and voltage on cooling. Liu (Liu et al., 2014) further verified the effectiveness of TEC systems at high temperatures. In the above studies, the accurate prediction of cell temperatures and heat production is related to the design and validation of the BTMS. Therefore, the relationships between the electrical and thermal characteristics of Li-ion batteries need to be established (Kim et al., 2011). The battery energy balance system proposed by Bernardi (Bernardi et al., 1985) provides a theoretical basis for calculating battery heat production. Electrochemical-thermal and electro-thermal models were established, both of which can calculate external characteristics such as charge-discharge curves and temperature distributions. However, the estimates of some internal characteristics may differ when different models are used. Electrochemical-thermal models analyse the influence of electrochemical parameters on thermal properties. They describe electrode reaction kinetics using the Butler-Volmer equation and the diffusion of particles in the electrolyte or active material by Fick’s law. These models focus on the parameters and properties of the cell materials, such as particle size and solid-liquid diffusion coefficient, and require a large number of electrochemical parameters (Tang et al., 2019). In contrast, electro-thermal models use empirical equations to describe the potential and current density distribution on the electrode, so focus on the electrical properties of the cell (such as open-circuit voltage and entropy coefficient). Their advantages of requiring fewer parameters and less calculation make them more suitable for studying the effects of macroscopic parameters on cell performance, such as cell size and internal resistance. In HEVs, 48 V battery systems require an instantaneous discharge rate close to 10 C to satisfy the power requirements. At high ambient temperatures, such high currents are a great challenge in terms of battery heat dissipation. Therefore, the performance of the TEC systems used in BTMSs needs to be studied under high currents and temperatures.
To overcome the shortcomings of present semiconductor-based BTMS (SBTMS) studies, this paper develops three models to study the performance of 48 V battery packs with coupled TEC–forced-air cooling at high discharge rates and temperatures: 1) a resistance-based battery thermal model, 2) a semiconductor thermal model and 3) a three-dimensional fluid-solid coupled heat transfer model. The contributions of this paper are 1) the development of a battery model and 2) validation of the effect of TEC at high currents and ambient temperatures. The first contribution involves the development of a resistance-based battery body thermal model that considers the dependence of ohmic resistance and polarization resistance on battery SOC (tested range = 0.1–1), current (at 3.125, 6.25, 9.375 and 12.5 C) and ambient temperature (tested range = 5–40°C). A thermal model of battery tabs is also established due to the drastic effect of the tabs’ ohmic heat on the cells’ temperature distribution. A complete battery thermal model is developed to accurately predict the heat production and temperature distribution of the battery. The second contribution involves testing the performance of TEC by simulation of a 48 V battery system at a discharge rate of 9.375 C and ambient temperature of 37°C.
In this paper, an eight A h LiFePO4 pouch battery and 72,001/241/060B semiconductor are used as the research objects. Thermal models of the battery and semiconductor are established and verified through experiments. Then, a 48 V battery pack BTMS coupled with TEC and forced-air cooling is built to test cooling performance at an ambient temperature of 37°C and high current rates of up to 9.375 C.
2 Pouch Battery Cell Thermal Model
Assuming that the thermal conductivity of the cell is anisotropic, the rest of each material physical parameters are isotropic and do not vary with the temperature. By Fourier’s law, the three-dimensional unsteady heat transfer model of the lithium battery cell can be expressed as (Yang and Tao, 2006):
where
2.1 Battery Cell Heat Generation Model
2.1.1 Battery Body
During charge/discharge processes, the cell has four heat sources according to Ref. (Bernardi et al., 1985): electrochemical reaction heat, ohmic heat, polarization heat and side reaction heat (always ignored). Newman (Thomas and Newman, 2003) linked the electrochemical parameters with the electrical and thermal parameters that can be easily measured to describe the heat sources. Because the difference between the cell terminal voltage and open-circuit voltage (OCV) can be expressed in terms of current and resistance, the heat production inside the cell can be calculated by:
where Qtotal is the total heat generation inside the cell, I is the current through the cell, V is the cell terminal voltage, U is the OCV, T is the cell temperature, dU/dT is the entropy coefficient, Ro is the ohmic resistance, Rp is the polarized resistance, I2
where Vb is the cell volume (m3).
2.1.2 Tabs
Tabs are the metal conductors connecting the cells to the external charging and discharging equipment. They have a strong impact on the temperature distribution of a pouch battery. According to Ref. (Xie et al., 2020), the heat conducted between a tab and the battery body can be ignored at low-current discharge rates because there is little heat conduction. Thus, according to the first law of thermodynamics, the simplified energy balance inside a tab is:
where Rtab,j is the total resistance of the tab, which is the sum of the contact resistance Rc and tab resistance Rt, mtab is the tab mass, Cp,tab is specific heat capacity of the tab, Ttab is the tab temperature, htab is the heat transfer coefficient between the tab and the air, Atab is the tab area, ΔTtab is the difference between the tab and ambient temperatures, and subscript j represents tab’s polarity (positive = p, negative = n). The heat generation rate inside the tab qtab can be obtained by solving:
where Vtab,j is the tab volume, which is 1.152 × 10⁻⁶ m3 in the studied pouch battery.
2.2 Parameters of the Thermal Model
2.2.1 Battery Resistance and Entropy Coefficient
In this paper, an 8 Ah lithium-ion pouch battery produced by A123 was adopted to study the thermal performance of the SBTMS. Table 1 shows its technical parameters. Hybrid pulse power characterization (HPPC) tests were implemented to obtain the cell resistance according to the process given in Ref. (Stroe et al., 2018). The cell OCV was measured before each impulse current in the HPPC and the entropy coefficient was calculated based on the OCVs at different battery temperatures. Figure 1 shows the experimental devices: the current load on the cell was provided by a NEWARE CE-7001 PACK battery tester, a thermostat was used to control the desired ambient temperature of the cell, and the body temperature of the cell was monitored by K-type thermocouples attached to the cell surface. The layout of temperature measurement points on the cell is also shown in Figure 1. The cell temperature, voltage and current were recorded by computers. The relative error of the temperature sensor was ±0.75%.

TABLE 1. Main technical parameters of the lithium-ion battery and 48 V battery pack.

FIGURE 1. Devices used in the cell experiment.
Figure 2A–D show the variations in cell ohmic resistance and polarized resistance with SOC, cell temperature and current. A polynomial responding surface model (PRSM) was adopted to fit these data, and the results are:
where the coefficients are:
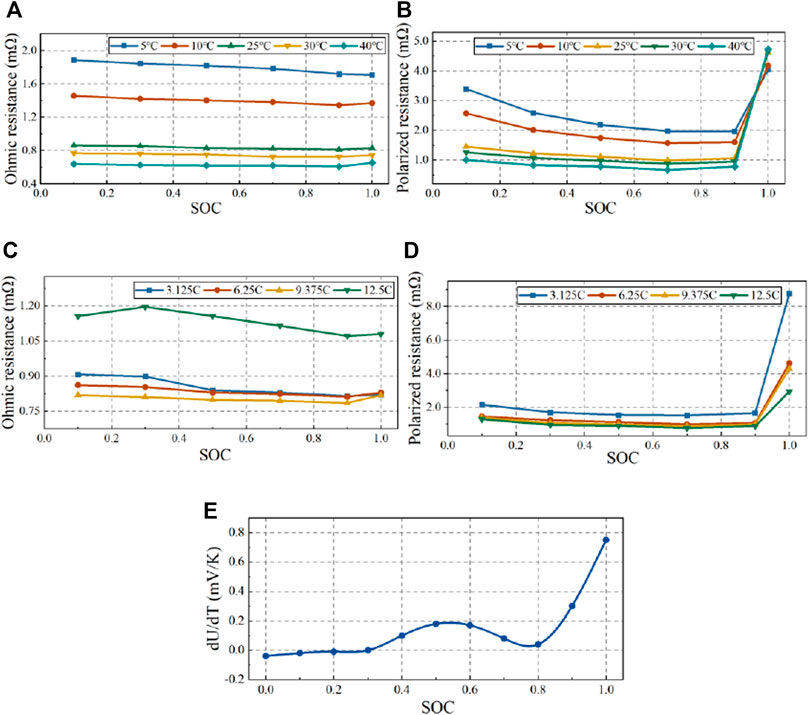
FIGURE 2. Total resistance and entropy coefficient of the pouch battery: (A) ohmic resistance and (B) polarized resistance at a discharge current of 6.25 C; (C) ohmic resistance and (D) polarized resistance at an ambient temperature of 25°C; and (E) entropy coefficient.
The correlation coefficient R2 was applied to evaluate the fitting precision. Its values of 0.996 for ohmic resistance and 0.98 for polarization resistance indicate that Eqs 6, 7 are accurate enough to predict the battery resistance at high current rates.
The evolution in the Figure 2E. A seventh-order PRSM was applied to fit the data, and the relationship between the entropy coefficient and SOC is:
where
The R2 value of Eq. 14 is 0.993, indicating that this equation is accurate enough to predict the entropy coefficient.
2.2.2 Resistance of Tabs
The parameter identification method was used to obtain the total resistance Rtab,j and heat transfer coefficient htab,j. From Eq. 4,
The variation curve of calculated ΔTtab,j values over times acquired from Eq. 14 is fitted with the experimentally measured values by adjusting the total resistance Rtab,j and heat transfer coefficient htab,j. Once the identified ΔTtab,j curve agreed with the tested one, the Rtab,j and htab,j values were determined. For the pouch battery, the Rtab,p, R tab,n and ht values were 0.198 mΩ, 0.027 mΩ and 5.7 W/m2•K, respectively.
2.2.3 Physical Parameters
According to Eq. 1, the specific heat capacity Cp, density ρ, and thermal conductivities kx, ky and kz should be modelled in order to predict the temperature distribution inside the cell. The lumped parameter method was used for modelling, which can be expressed as:
where m is the material mass, v is the material volume, ρ is the material density, L is the material thickness, k is the thermal conductivity of the material, and subscript i represents the type of material. Supplementary Table S1 in the appendix gives the geometrical and physical parameters of the cell for Eqs (15) to 19).
2.3 Cell Thermal Model Verification
An experiment using the devices shown in Figure 1 was carried out to validate the thermal model of the cell. The discharge currents used for verification were 6.25, 9.375 and 12.5°C, and the ambient temperatures were 17°C, 27°C and 37°C. Finite element method (FEM) was used to solve the thermal models created in this paper, and ANSYS Fluent is used as the solver. Firstly, the cell structure was constructed using CATIA, and then the geometric models were imported into ANSA for geometric pre-processing and meshing. A hexahedral grid was adopted to discretize the computational domain due to the regular structure of the pouch battery geometric model shown in Figure 3A, and its number was determined to be 0.22 million after verification of the independence of the grid to the temperature change, as shown in Figure 3B. The number of grids ranges from 0.046 million to 0.94 million was tested with loading9.375°C currents under the ambient temperature of 27°C, and when it was greater than 0.22 million, the average temperature change was within 0.1°C.
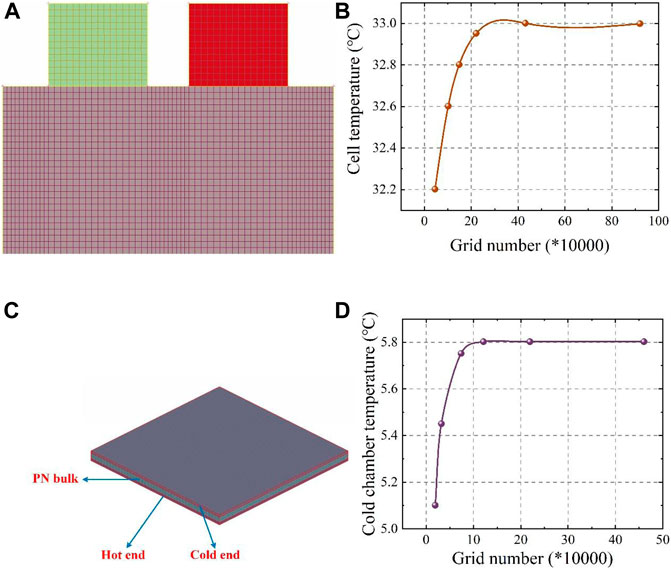
FIGURE 3. (A) Computational grid of cell; (B) The grid independence verification of cell; (C) Computational grid of Semiconductor; (D) The grid independence verification of semiconductor.
The thermal boundary used for the cell thermal model is (Yang and Tao, 2006):
where Tw is the temperature on the cell surface, Tf is the air temperature near the cell, and h is the thermal transfer coefficient, which is calculated by:
where the average Nusselt number
where
The anemometer was used to measure the wind speed of 0.9 m/s on the surface of the cell in the thermostat, and the physical parameters of the air at 27°C were brought into Equation 23, therefore, h = 9.34
Figure 4 shows the temperature evolutions according to the experiment and simulation. The temperature behaviour predicted by the cell thermal model fitted well with the experimental measurements. The average absolute error (
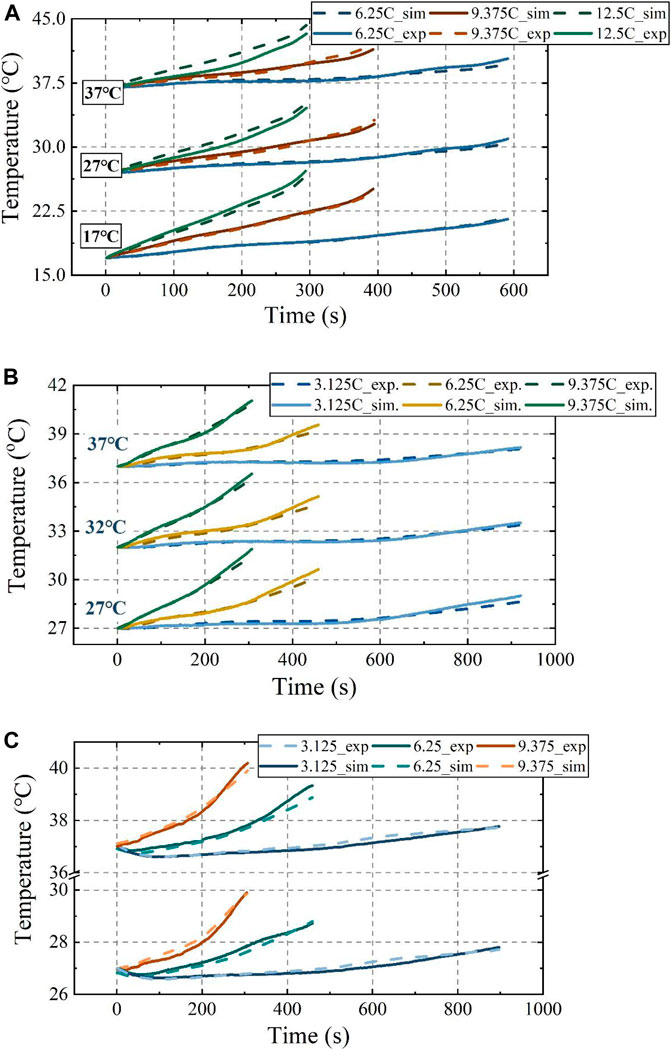
FIGURE 4. Thermal model validation at different currents and ambient temperatures: (A) Cell thermal model; (B) Battery pack thermal model; (C) BTMS thermal model.
Table 2A shows the
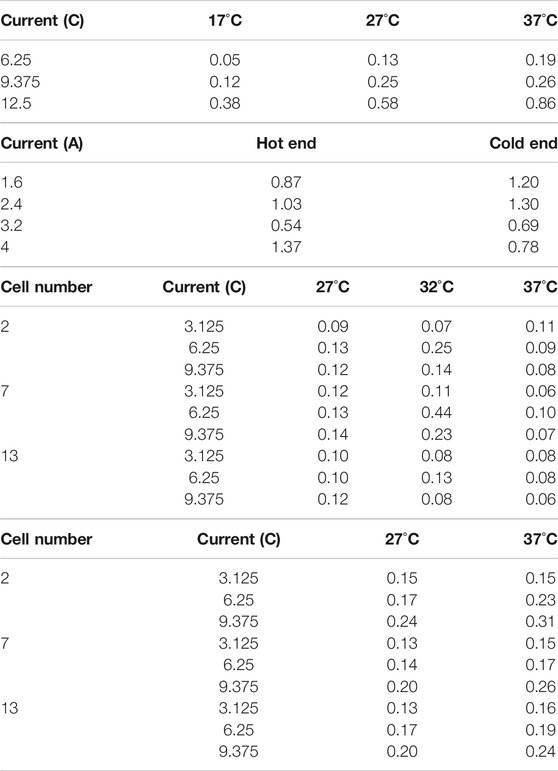
TABLE 2.
3 Thermal Model of the BTMS
3.1 Heat Generation Model of Semiconductor
The TEC consisted of a number of p- and n-type semiconductor couples connected electrically in series and thermally in parallel. With the consumption of electrical energy, heat is transferred from one side of the device to the other side against a temperature gradient (from cold to hot). The TEC operating principle is shown in Figure 5A. These couples were sandwiched between two thermally conductive and electrically insulated substrates. The heat direction could be altered by changing the polarity of the DC charging current so that the TEC could also be used as a temperature controller that either heats or cools. The physical effects of semiconductor refrigeration mainly include three reversible effects—the Seebeck, Parr paste and Thomson effects—and two irreversible effects—the Joule and Fourier effects. Thus, the heat generation rate of the TEC can be expressed as:
where q is the heat generation rate; I is the current through the semiconductor;
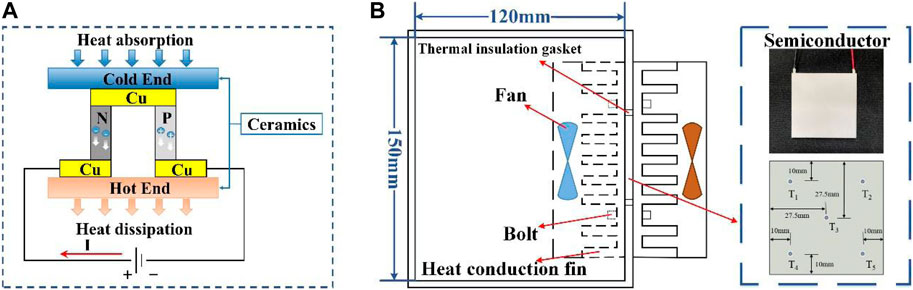
FIGURE 5. (A) TEC operating principle; (B) Diagram of the semiconductor refrigeration system.
3.1.1 Parameters of the Semiconductor Model
The resistance
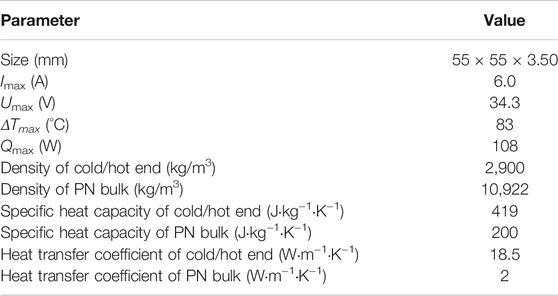
TABLE 3. Physical parameters of the semiconductor (Th = 50°C).
Figure 5B shows the structure of the TEC and its dimensions are shown in Supplementary Table S2 of appendix. The whole system was powered by a 12 V electric source. Both conduction fins at the cold and hot ends were turned on to cool the closed chamber made of polyurethane insulation board material. The temperature of the semiconductor was recorded by the temperature sensors. The arrangement of the measurement points is shown in Figure 5B.
Different currents were loaded on the semiconductor at an ambient temperature of 27°C and the experimental results are shown in Supplementary Table S3. The TEC operating voltage is equal to the sum of the voltage drop generated by the resistance of the semiconductor and the Seebeck voltage:
Parameters
3.1.2 Verification of the Semiconductor Thermal Model
The FEM method was also applied to the validation of the semiconductor thermal model with a grid number of 121,000 after grid-independent verification. Its computational grid and verification are shown in Figures 3C,D. The temperature evolution in the simulation and experiment at different currents are shown in Figure 6 for the
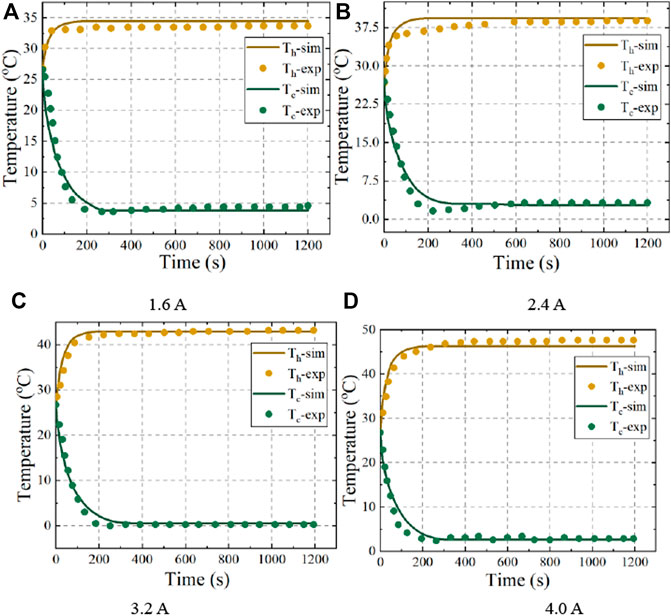
FIGURE 6. Temperature evolution at the hot and cold ends at different currents.
3.2 Thermal Model of the SBTMS
In the SBTMS, the total heat transfer process is divided into four parts. The first part is the heat conduction between the cell and aluminium heat dissipation structure. The heat generated by the cell is transferred to the base through graphene and heat-conducting fins, or the contact surface between the bottom of the cell and the base. The heat transfer inside the cell was modelled in Section 2. Assuming that the thermal conductivity of the graphene and aluminium plate are constant, the thermal conductivity equation for this process is:
where a is the thermal diffusion coefficient, which can be expressed as:
Subscript m represents the thermal conductivity media (aluminium plates and graphene) parameters.
The second part is the heat transfer between the cold end and hot end. The heat of the aluminium base is absorbed by the cold end and transferred to the hot end by the semiconductor cooling effect, which was modelled in Section 3.1. The heat transfers from the surface of the heat-conducting fins to the air at the hot end and the heat transfer in the air are the third part and the fourth part, respectively. The governing equations are used for these processes are:
1 Mass conservation equation, assuming that the density of incompressible fluids is constant, it can be simplified as:
Where t is the time,
2 Momentum conservation equation:
where
3 Energy conservation equation
4
The fluid flow under turbulent conditions is unstable. In this paper,
The standard
where
where
5 Fluid-solid coupled heat transfer model
In numerical simulations, the fluid-solid coupling interface must be coupled to the interface surface mesh in order to achieve the interaction of heat transfer data, in other words, to achieve the one-to-one correspondence of the interface mesh nodes. Based on the basic theorem of convective heat transfer, the governing equation at the fluid-solid contact interface is:
where c is the ratio of the distance between the center of the solid (
4 Thermal Behaviour of the SBTMS
4.1 Structure of the SBTMS
The overall structure of the 48 V battery pack based on TEC is shown in Figure 7. The thickness of the heat-conducting fins and graphene were 1 and 0.6 mm, respectively, and an aluminium slot base with a depth of 5 mm fixed and supported the fins. Four semiconductors were embedded in a recess at the bottom of the aluminium base and held in place with thermally conductive silicone. Two 80 × 80 mm fans were used for forced-air cooling of the fins at the hot end and two holes of 10 mm diameter were reserved on the air duct side to measure the temperature and speed of the airflow. The parameters of the 48 V battery pack are shown in Table 1.
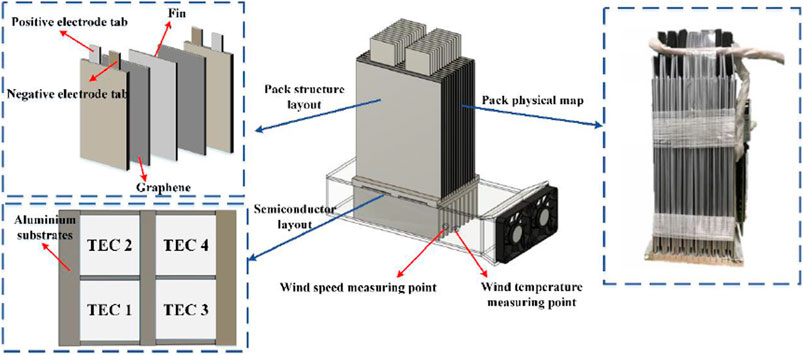
FIGURE 7. Structure of the 48 V battery pack’s semiconductor cooling system.
4.2 Computation and Simulation Setups
The computational fluid dynamics (CFD)-based method was used to solve the 48 V battery pack BTMS model. The governing equations were discretized by the FEM using a hexahedral grid for the battery pack and semiconductor and a tetrahedral grid for the fins and fluid region with a most suitable grid number of five million, as shown in Figure 8A. The discretization method used for the governing equations is shown in Table 4, and the physical parameters of the materials in the cooling system are shown in Supplementary Table S4. Figure 8B shows the boundary conditions and computational domain of the SBTMS.
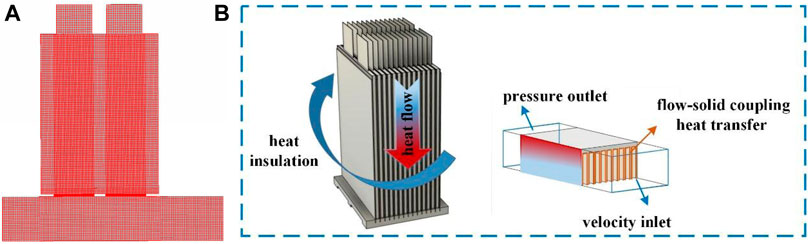
FIGURE 8. (A) Computational grid used for the 48 V battery pack BTMS model; (B) Schematic of boundary conditions and the computational domain.

TABLE 4. Discretization method for the governing equations.
4.3 SBTMS Thermal Model Verification
To verify the accuracy of the model, the battery pack was discharged from SOC = 0.9 to 0.1 at ambient temperatures of 27°C, 32°C and 37°C and discharge currents of 3.125, 6.25, 9.375 and 12.5°C. In the experiments, the surface of the battery pack was wrapped adiabatically and temperature sensors were attached to the centres of the two sides.
4.3.1 Battery Pack
1 Temperature evolution
The T1 point of battery No. 7 was the highest among all temperature measurement points in the battery pack, and using the temperature of this point as an example, the temperature evolution in the experiment and simulation at current loadings of 3.125, 6.25 and 9.375 C from 27°C to 37°C were highly consistent, with a majority of
2 Temperature distribution
A simulated temperature cloud map of a battery pack at the end of discharge can be used to show its temperature distribution visually. In Figure 9, when the battery pack was discharged at an ambient temperature of 37°C and current of 9.375 C, its temperature decreased from the top (near the tabs) to the bottom. The cells located in the middle of the pack had higher temperatures than those on the two sides, which is consistent with the theoretical analysis. The heat production rate of the positive electrode tab material (Al) was higher than that of the negative electrode tab (Cu), and the heat conduction from top to bottom was not an instantaneous process, so the maximum temperature occurred in the area of the positive tab in the upper part of the battery. Therefore, the temperature of the battery pack was chosen to be the measurement point temperature closest to the battery tab when BTMS was applied. The reliability of BTMS can be demonstrated if the maximum temperature of the battery pack was controlled within the appropriate range. Graphene with good temperature homogenisation provides a small temperature difference within each cell, and the maximum temperature difference within the cell did not exceed 2 C. However, the heat transfer coefficient of both the pouch lithium battery and graphene in the lateral direction were much smaller than those in the longitudinal and axial directions, making heat accumulate in the middle of the pack more easily. In addition, the maximum temperature of the battery was already over 40°C when a current of 9.375 C was loaded in the pack at an ambient temperature of 37°C. As the current continues to increase, the temperature of the battery will increase, seriously affecting its performance and cycle life, and temperature differences in different locations inside the cell and temperature inconsistency between cells will gradually increase.
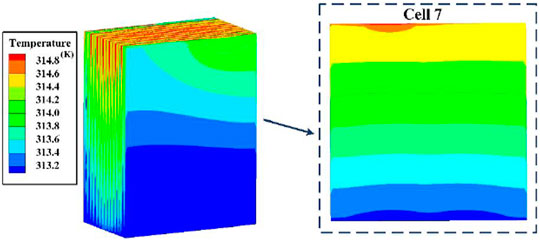
FIGURE 9. Temperature cloud map.
4.3.2 Semiconductor-Based BTMS
The 48 V battery pack was discharged at 3.123, 6.25 and 9.375 C currents at a 37°C and 27°C ambient temperature, and the semiconductor-based BTMS was turned on to test the cooling effect of the semiconductor at a current of 2.0 A and an airflow speed of 5 m/s. The T1 point of battery No. 7 was selected as the temperature monitoring point for its maximum temperature character in the BTMS model verification. As shown in Figure 4C, the simulations and experiments were more accurately fitted in the early stage of discharge when the battery temperature was low, while the error increased in the late stage of discharge at 9.375°C, with the simulated temperatures being lower than the measured ones. This is due to heat accumulation from the battery in the late discharge period; heat not readily transferred from the hot end will cause the cold-end temperature of the semiconductor to rise and decrease the cooling performance. However, the maximum error between the experiment and simulation was within 0.5°C and 0.3°C at 37°C and 27°C ambient temperature, respectively. And the majority of
4.4 Heat Dissipation of the SBTMS
The temperature evolution of the 48 V battery pack in the adiabatic state and with SBTMS at 2A current or air-cooled BTMS (ABTMS) were compared by discharging at constant currents of 3.125, 6.25, and 9.375 C, respectively, at 37°C, as shown in Figure 10. The temperature of the battery pack with SBTMS decreased at the beginning of discharge when loaded with 3.125 and 6.25 C currents, and was particularly noticeable at 3.125 C. The net cooling capacity of the semiconductor can be calculated as:
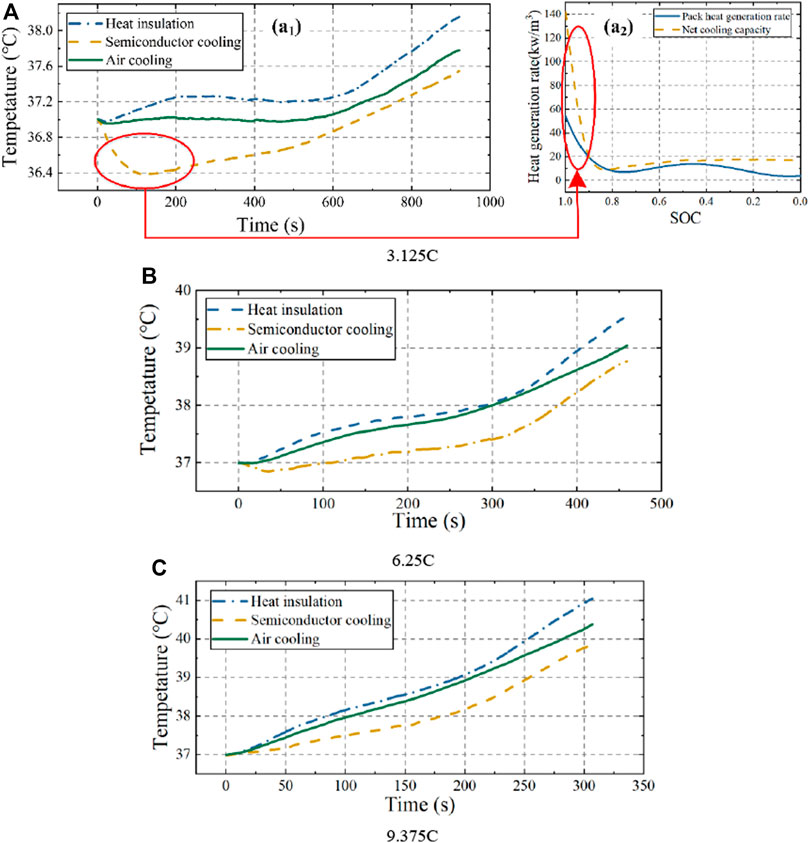
FIGURE 10. Battery pack temperature performance under adiabatic, semiconductor with 2A current cooling and air-cooled conditions at 37°C.
K is the semiconductor thermal resistance,
The calculated heat generation rate of the battery pack loaded with 3.125C current and the TEC cooling rate of the battery pack loaded with 2A current as a function of the SOC (discharge time) at an ambient temperature of 37°C are shown in Figure 10 (A2). The TEC cooling rate was much higher than the heat production of the battery pack at the early stage of discharge, so that a significant temperature reduction of the battery pack occurs in Figure 10 (A1). However, this phenomenon disappeared when the pack was discharged at 9.375 C, when there was very high heat production.
Temperature decreases of 0.6°C, 0.78°C and 1.21°C at currents of 3.125, 6.25 and 9.375 C, respectively, were achieved in the battery pack with SBTMS. The maximum temperature of the pack at 9.375 C current was 39.84°C as shown in Table 5, and the maximum temperature difference between cells was 1.6°C, which meet the requirements for optimal pack operating temperature range and temperature consistency. However, if the current increases, the semiconductor-cooled battery pack will exceed the safe operating temperature. Therefore, loading the TEC with 2 A current was the minimum current at which SBTMS can achieve temperature control within 40°C of the pack at 9.375 C current and an ambient temperature of 37°C discharge. As the TEC current increases, the cooling effect increases and better demonstrates the superiority of the SBTMS.
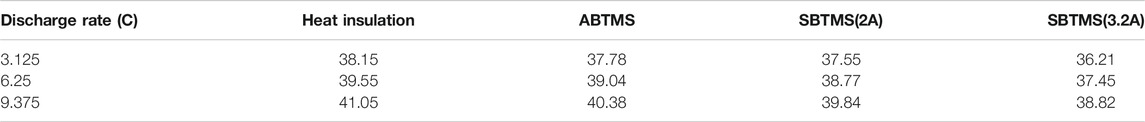
TABLE 5. Temperature at the end of discharge (oC).
For a battery pack with ABTMS, the temperature decreased by 0.37°C, 0.51°C and 0.67°C compared with the pack in the adiabatic state; hence, it had a weaker cooling effect than SBTMS. Moreover, the lower thermal inertia of semiconductors allows for higher cooling sensitivity. At currents of 3.125, 6.25 and 9.375 C, the pack with SBTMS achieved cooling of 0.2°C some 149 s, 67 s and 120 s faster, respectively, than the pack with ABTMS.
5 Conclusion
A semiconductor-based BTMS thermal model was developed to predict the temperature performance of a 48 V battery pack. It integrates a resistance-based cell thermal model, a semiconductor thermal model, and a three-dimensional fluid-solid coupled heat transfer model. The performance of the semiconductor cooling system at high temperatures and discharge rates was verified using this model and compared with that of an air-cooled system. Based on the results, the following conclusions are made.
1. The battery thermal model considers the effects of current, temperature and SOC on ohmic resistance and polarization resistance. It can accurately predict the thermal behaviour of 8 Ah pouch batteries. The maximum errors in temperature prediction by the thermal model were mostly <0.8°C at the cell level and <0.6°C at the pack level.
2. In this paper, a BTMS structure with coupled semiconductor and air cooling was designed. The proposed BTMS thermal model was able to accurately describe the temperature performance of the battery, with a maximum error within 0.5°C in ambient temperature of 37°C and 0.3°C in 27°C. At an ambient temperature of 37°C and high current rate (up to 9.375 C), the SBTMS achieved an overall temperature control requirement of <40°C and provided a temperature difference of no more than 1.6°C in the 48 V battery pack.
3. The hybrid semiconductor-based BTMS was more sensitive and had a better cooling effect than the single air-cooled BTMS. At 3.125, 6.25 and 9.375 C, the SBTMS achieved the initial 0.2°C temperature drop some 149 s, 76 s and 120 s faster, respectively, than the ABTMS and cooled the pack by 0.6°C, 0.78°C and 1.21 C at the end of discharge.
Data Availability Statement
The original contributions presented in the study are included in the article/Supplementary Material, further inquiries can be directed to the corresponding author.
Author Contributions
RY proposed the main idea of the paper, did the simulation and wrote the paper. KL, YX and WL built the battery thermal model. HZ did the experiment of 48 V. YQ and YZ dealt with the results of experiment and simulation, and checked the paper.
Funding
This work is supported by the National Science Foundation of China (Grant Nos. U1864212, 52072052 and U20A20310), State Key Laboratory of Automotive Safety and Energy under Project Grant Nos. KF 2031, the Fundamental Research Funds for the Central Universities (Grant Nos. 2021CDJQY-050) and Guangdong Science and Technology Department (Grant Nos. 2020B0909030001).
Conflict of Interest
The authors declare that the research was conducted in the absence of any commercial or financial relationships that could be construed as a potential conflict of interest.
Publisher’s Note
All claims expressed in this article are solely those of the authors and do not necessarily represent those of their affiliated organizations, or those of the publisher, the editors and the reviewers. Any product that may be evaluated in this article, or claim that may be made by its manufacturer, is not guaranteed or endorsed by the publisher.
Supplementary Material
The Supplementary Material for this article can be found online at: https://www.frontiersin.org/articles/10.3389/fenrg.2021.794438/full#supplementary-material
References
Al-Zareer, M., Dincer, I., and Rosen, M. A. (2017). Novel Thermal Management System Using Boiling Cooling for High-Powered Lithium-Ion Battery Packs for Hybrid Electric Vehicles. J. Power Sourc. 363, 291–303. doi:10.1016/j.jpowsour.2017.07.067
Alaoui, C., and Salameh, Z. M. (2005). A Novel Thermal Management for Electric and Hybrid Vehicles. IEEE Trans. Veh. Technol. 54 (2), 468–476. doi:10.1109/tvt.2004.842444
Alaoui, C., and Salameh, Z. M. (2003). “Modeling and Simulation of a Thermal Management System for Electric Vehicles,” in 29th Annual Conference of the IEEE Industrial-Electronics-Society, Roanoke, VA, USA, 2-6 Nov. 2003, 887–890.
Bernardi, D., Pawlikowski, E., and Newman, J. (1985). A General Energy Balance for Battery Systems. J. Electrochem. Soc. 132 (1), 5–12. doi:10.1149/1.2113792
Bradley, T. H., and Quinn, C. W. (2010). Analysis of Plug-In Hybrid Electric Vehicle Utility Factors. J. Power Sourc. 195 (16), 5399–5408. doi:10.1016/j.jpowsour.2010.02.082
Dunn, B., Kamath, H., and Tarascon, J.-M. (2011). Electrical Energy Storage for the Grid: A Battery of Choices. Science 334 (6058), 928–935. doi:10.1126/science.1212741
Huang, Q., Li, X., Zhang, G., Zhang, J., He, F., and Li, Y. (2018). Experimental Investigation of the Thermal Performance of Heat Pipe Assisted Phase Change Material for Battery Thermal Management System. Appl. Therm. Eng. 141, 1092–1100. doi:10.1016/j.applthermaleng.2018.06.048
Ianniciello, L., Biwolé, P. H., and Achard, P. (2018). Electric Vehicles Batteries Thermal Management Systems Employing Phase Change Materials. J. Power Sourc. 378, 383–403. doi:10.1016/j.jpowsour.2017.12.071
Lee, S., Cherry, J., Safoutin, M., McDonald, J., and Olechiw, M. (2018). Modeling and Validation of 48V Mild Hybrid Lithium-Ion Battery Pack. SAE Int. J. Alt. Power 7 (3), 273–287. doi:10.4271/2018-01-0433
Li, X., Zhong, Z., Luo, J., Wang, Z., Yuan, W., Zhang, G., et al. (2019). Experimental Investigation on a Thermoelectric Cooler for Thermal Management of a Lithium-Ion Battery Module. Int. J. Photoenergy 2019, 1–10. doi:10.1155/2019/3725364
Liu, Y., Yang, S., Guo, B., and Deng, C. (2014). Numerical Analysis and Design of Thermal Management System for Lithium Ion Battery Pack Using Thermoelectric Coolers. Adv. Mech. Eng. 6, 852712. doi:10.1155/2014/852712
Lyu, Y., Siddique, A. R. M., Majid, S. H., Biglarbegian, M., Gadsden, S. A., and Mahmud, S. (2019). Electric Vehicle Battery Thermal Management System with Thermoelectric Cooling. Energ. Rep. 5, 822–827. doi:10.1016/j.egyr.2019.06.016
Maggetto, G., and Van Mierlo, J. (2001). Electric Vehicles, Hybrid Electric Vehicles and Fuel Cell Electric Vehicles : State of the Art and Perspectives. Ann. de Chim. Sci. des Matériaux 26 (4), 9–26. doi:10.1016/s0151-9107(01)80066-0
Malik, M., Dincer, I., and Rosen, M. A. (2016). Review on Use of Phase Change Materials in Battery Thermal Management for Electric and Hybrid Electric Vehicles. Int. J. Energ. Res. 40 (8), 1011–1031. doi:10.1002/er.3496
Pesaran, A. A. (2002). Battery Thermal Models for Hybrid Vehicle Simulations. J. Power Sourc. 110 (2), 377–382. doi:10.1016/S0378-7753(02)00200-8
Placke, T., Kloepsch, R., Dühnen, S., and Winter, M. (2017). Lithium Ion, Lithium Metal, and Alternative Rechargeable Battery Technologies: The Odyssey for High Energy Density. J. Solid State. Electrochem. 21 (7), 1939–1964. doi:10.1007/s10008-017-3610-7
Ran, B., Victor, A., and James, B. (2017). Effect of 48 V Mild Hybrid System Layout on Powertrain System Efficiency and its Potential of Fuel Economy Improvement. SAE International. Technical Paper 2017-01-1175. doi:10.4271/2017-01-1175
Seo, Y. M., Ha, M. Y., Park, S. H., Lee, G. H., Kim, Y. S., and Park, Y. G. (2018). A Numerical Study on the Performance of the Thermoelectric Module with Different Heat Sink Shapes. Appl. Therm. Eng. 128, 1082–1094. doi:10.1016/j.applthermaleng.2017.09.097
Seong Kim, U., Yi, J., Shin, C. B., Han, T., and Park, S. (2011). Modeling the Dependence of the Discharge Behavior of a Lithium-Ion Battery on the Environmental Temperature. J. Electrochem. Soc. 158 (5), A611–A618. doi:10.1149/1.3565179
Sirikasemsuk, S., Wiriyasart, S., Naphon, P., and Naphon, N. (2021). Thermal Cooling Characteristics of Li‐Ion Battery Pack with Thermoelectric Ferrofluid Cooling Module. Int. J. Energ. Res 45 (6), 8824–8836. doi:10.1002/er.6417
Song, W., Bai, F., Chen, M., Lin, S., Feng, Z., and Li, Y. (2018). Thermal Management of Standby Battery for Outdoor Base Station Based on the Semiconductor Thermoelectric Device and Phase Change Materials. Appl. Therm. Eng. 137, 203–217. doi:10.1016/j.applthermaleng.2018.03.072
Stroe, D.-I., Swierczynski, M., Kar, S. K., and Teodorescu, R. (2018). Degradation Behavior of Lithium-Ion Batteries during Calendar Ageing-The Case of the Internal Resistance Increase. IEEE Trans. Ind. Applicat. 54 (1), 517–525. doi:10.1109/tia.2017.2756026
Tang, S., Wang, Z., Guo, H., Wang, J., Li, X., and Yan, G. (2019). Systematic Parameter Acquisition Method for Electrochemical Model of 4.35 V LiCoO2 Batteries. Solid State Ionics 343, 115083. doi:10.1016/j.ssi.2019.115083
Thomas, K. E., and Newman, J. (2003). Thermal Modeling of Porous Insertion Electrodes. J. Electrochem. Soc. 150 (2), A176–A192. doi:10.1149/1.1531194
Xie, Y., He, X.-J., Hu, X.-S., Li, W., Zhang, Y.-J., Liu, B., et al. (2020). An Improved Resistance-Based thermal Model for a Pouch Lithium-Ion Battery Considering Heat Generation of Posts. Appl. Therm. Eng. 164, 114455. doi:10.1016/j.applthermaleng.2019.114455
Yang, F., Ding, J., Huang, W., Xie, W., and Liu, W. (2014). Particle Size-Specific Distributions and Preliminary Exposure Assessments of Organophosphate Flame Retardants in Office Air Particulate Matter. Environ. Sci. Technol. 48 (1), 63–70. doi:10.1021/es403186z
Yu, C., Ji, G., Zhang, C., Abbott, J., Xu, M., Ramaekers, P., et al. (2018). Cost-Efficient Thermal Management for a 48V Li-Ion Battery in a Mild Hybrid Electric Vehicle. Automot. Innov. 1 (4), 320–330. doi:10.1007/s42154-018-0043-7
Nomenclature
Cp specific heat capacity (J/(kg· K))
T battery temperature (oC)
t time (s)
q heat production rate (W/m3)
Qtotal total heat generation rate (W/m3)
I Current (A)
V terminal voltage (V)
U open circuit voltage (V)
dU/dT entropy coefficient
Ro ohmic resistance (Ohm)
Rp polarized resistance (Ohm)
Vb cell volume (m3)
Rc contact resistance (Ohm)
Rt tab resistance (Ohm)
mtab tab mass (kg)
Cp,tab specific heat capacity of tab (J/(kg· K))
Ttab tab temperature (oC)
htab heat transfer coefficient between the tab and the air
Atab tab area (m2)
ΔTtab difference between the tab and ambient temperatures (oC)
Vtab,j tab volume (m3)
R2 correlation coefficient
Tw cell surface temperature (oC)
T f air temperature (oC)
h thermal transfer coefficient (W/(m2· k))
p static pressure (Pa)
u, v, w velocity vector in the x, y and z directions (m/s)
k turbulent kinetic energy (m2/s2)
c
ratio of the distance between the center of the solid (
K semiconductor thermal resistance(Ohm)
ΔT temperature difference between the cold and hot end of the semiconductor (oC)
BTMS battery thermal management system
EV electric vehicle
HEV hybrid electric vehicle
ICE internal combustion engine
TEC thermoelectric cooling
SBTMS semiconductor-based BTMS
OCV open-circuit voltage
HPPC hybrid pulse power characterization
PRSM polynomial responding surface model
CFD computational fluid dynamics
FEM finite element method
ABTMS air-cooled BTMS
Keywords: 48 V battery pack, battery thermal management system, semiconductor refrigeration, battery thermal behaviour, high ambient temperature, high discharge rate
Citation: Yang R, Li K, Xie Y, Li W, Qian Y, Zhang Y and Zhang H (2022) Thermal Management of a 48 V Lithium-Ion Battery Pack by Semiconductor Refrigeration. Front. Energy Res. 9:794438. doi: 10.3389/fenrg.2021.794438
Received: 13 October 2021; Accepted: 20 December 2021;
Published: 20 January 2022.
Edited by:
Ziye Ling, South China University of Technology, ChinaReviewed by:
Mohd Faizul Mohd Sabri, University of Malaya, MalaysiaZhiqiang Niu, Loughborough University, United Kingdom
Wenji Song, Guangzhou Institute of Energy Conversion (CAS), China
Copyright © 2022 Yang, Li, Xie, Li, Qian, Zhang and Zhang. This is an open-access article distributed under the terms of the Creative Commons Attribution License (CC BY). The use, distribution or reproduction in other forums is permitted, provided the original author(s) and the copyright owner(s) are credited and that the original publication in this journal is cited, in accordance with accepted academic practice. No use, distribution or reproduction is permitted which does not comply with these terms.
*Correspondence: Kuining Li, bGVla25AY3F1LmVkdS5jbg==