 Chuyu Sun1,2
 Xiaoli Zhao
 Fan Yang
- 1School of Economics and Management, China University of Petroleum, Beijing, China
- 2Institute for Low Carbon Economy and Policy, China University of Petroleum, Beijing, China
- 3Tangshan Natural Resources and Planning Bureau, Tangshan, China
Global climate problems caused by the overuse of fossil energy need to be settled urgently. To solve global warming threatening human life and production, environmental control policies have been proposed as the mainstream ways to push renewable energy development worldwide, such as carbon tax, carbon trading, emissions trading, and fiscal subsidies. This study examines how carbon tax and carbon emission trading policies could be coupled with subsidy policies to better promote renewable energy development. The data come from seven carbon emission trading pilots from 2013 to 2017 in China. Based on the evolutionary game, the research simulates the onshore wind power investment to deeply explore the spontaneous evolution process. Considering carbon tax and carbon emission trading policies, the two evolutionary game models are constructed under the context of fiscal subsidy policy, respectively. The results show that, under the scenario of carbon trading and subsidy policy coordination, investors will vote for wind farms and under the scenario of the carbon tax and subsidies coordination, investors will pay the funds in coal-fired power generation. Besides, this is worth noting that excessive carbon tax may give rise to the shrinking of the power industry. Accordingly, it is suggested that the government should continue to implement the carbon emission trading policy and maintain the free quota below 80% and the carbon emission trading price above 120.02 yuan/ton.
Introduction
Excessive use of fossil fuel emissions has begotten a series of climate problems seriously affecting human normal production and life, such as the greenhouse effect, global warming of 2°C, and rising sea levels. Therefore, carbon emission reduction has been a consensus all over the world in formulating environmental policies. As the world’s largest carbon emitter, China accounted for 29.38% of global carbon emissions in 2019 (International Energy Agency, 2021). China’s efforts to reduce emissions are pivotal to the world. President of the People’s Republic of China Xi Jinping delivered an important speech at the general debate of the 75th UN General Assembly that China will achieve carbon neutrality by 2060.
The power sector is the largest source of carbon emissions in China, accounting for about half of China’s total carbon emissions. Coal-fired power generation in China accounted for more than 69% of total carbon emissions in 2019 (Wang P. et al., 2021). Implementing a carbon tax or carbon emission trading policy is beneficial to curbing coal-fired power generation, encouraging renewable energy generation, and reducing carbon emissions. China promotes the development of renewable energy using financial subsidies. As of June 2021, the central government has allocated more than 600 billion yuan in subsidies, leading to a large shortfall in renewable energy subsidies (Ministry of Finance of the People’s Republic of China, 2021). Obviously, only relying on financial subsidies policy is not sustainable. Renewable energy development requires more carbon reduction policies to achieve carbon neutrality in 2030 and 2060.
China has made attempts on the path of carbon emissions trading; a nationwide carbon emission trading market in China was not operational before mid-2021, with only seven carbon trading pilots in place before then. The first pilot was built in 2013, Shenzhen. Currently, only 2,871 renewable energy power projects are qualified for carbon trading (China National Development and Reform Commission, 2021). However, with the launch of a nationwide carbon emission trading market, high-energy-consuming industries would enter the carbon emission trading market and increase the demand for carbon allowances, and the quota supply of renewable energy power generation enterprises should increase, leading the renewable energy power generators to achieve more carbon reduction benefits. The carbon emission trading policy still has a long way to go. Besides, the other effective emission policy, carbon tax, has not been implemented in China. Hence, when subsidies are gradually withdrawn, the comparative effects of carbon tax and carbon emission reduction policies are worth exploring.
From a theoretical point of view, under the conditions of a competitive market with completely symmetrical information, the policy effects of the carbon tax and carbon emission trading are the same, and both can achieve Pareto optimality (Wu et al., 2014). However, because the government and investors often do not have access to complete information, designing the best carbon tax level or the best tax exemption limit to meet the total emission standard becomes a problem. Therefore, this study explores how the carbon tax and carbon emission trading can promote the development of onshore wind power in China’s power industry to achieve emission reduction targets as soon as possible.
This study adopts the trading data from all the carbon emission trading pilots in China, including Beijing, Shanghai, Tianjin, Chongqing, Guangdong, Shenzhen, and Hubei provinces. It focuses on free quotas at different levels and provides a basis for evaluating reasonable carbon prices. Moreover, the input-output information in the evolutionary model allows us to consider the repeated investment of investors, which is in line with the actual situation. Furthermore, this research explores the impact of different subsidies, carbon tax rates, and free allowances for carbon emission trading on wind power investment and provides the policy basis for the continued growth of wind power investment after the decline of subsidies. The rest of the article is as follows: Literature Review reviews previous studies; Model establishes the evolutionary game model of the investment willingness in coal-fired power plants or wind farms in China, which is motivated by the carbon tax or carbon emission trading policy; Investment Simulations presents the numerical analysis under subsidy, carbon tax, and carbon emission trading based on the data from seven carbon emission trading pilots; and Conclusion section concludes the study.
Literature Review
Carbon taxes and carbon emission right trading are often used to promote the development of renewable energy. The general equilibrium model and econometric model are commonly used to compare the emission reduction effects of these two policies (Robinson, 2010; Aflaki and Netessine, 2017; Poelhekke, 2019; Kök et al., 2020; Chen et al., 2021). These studies analyzed the relationship between the economic, energy, and environmental sectors under the overall macroeconomic framework and analyzed energy consumption and environmental changes under subsidy, carbon tax, and emission trading policies. As summarized in Table 1, most studies analyzed the sector from a macro or meso perspective, but a few analyzed it from a micro perspective of enterprises selection (Li et al., 2021). Enterprises are the executors of the policy. The enterprise’s perspective could reflect the effects of policy implementation in a bottom-up manner, making the policy effect more relevant to reality.

TABLE 1. Recent studies on carbon tax and carbon emission trading policies.
From the perspective of enterprises, optimization and game theory methods are usually used to study renewable energy investment under the carbon tax and carbon emission trading policies (Liu and Zhao., 2015; Bai and Xu, 2016; Chen et al., 2021). Bai and Xu (2016) studied the optimal production and emission reduction investment strategies for manufacturers under the limit of carbon emissions and carbon transactions. In addition to manufacturing, the power industry also vigorously promotes carbon emission reduction. Liu and Zhao (2015) analyzed the production decision-making problems of power companies under different energy consumptions affected by the renewable energy tariff subsidy policy, the technology research and development (R&D) investment subsidy policy, and the carbon emission price policy. Further research was based on carbon emissions trading, carbon tax, and subsidy to study the production decision of power enterprises. Zhang et al. (2017) demonstrated that carbon emission trading could help reduce subsidies. They used stochastic processes to describe electricity market prices, CO2 prices, and investment costs to establish a real options model of optimal subsidies for renewable energy power generation projects. Goulder et al. (2022) analyzed the power generation and emissions of thermal power in a carbon trading pilot by matching analytically and numerically solved models, concluding that carbon trading gave positive incentives to power plants with lower emissions to expand their output. Although the previous studies discussed the decision-making behaviors of power companies under the low-carbon policy, these decisions often concentrated on the production decision-making and R&D decisions of enterprises. This study focuses on the investment decision-making problem of investing in new units.
Low-carbon policies would promote renewable energy generation in the power industry, ultimately reducing carbon emissions. According to the statistics of the International Energy Agency (2021), The sum of carbon dioxide emissions in China’s electricity and heat sectors account for 9.58% of total carbon dioxide emissions of all sectors. Reducing emissions in the power industry by encouraging renewable energy generation can help achieve China’s carbon neutrality.
Game theory is a relatively suitable method in power investment decision-making (Lu et al., 2014). The Cournot competition model, the Bertrand competition model, the SFE model, and the evolutionary game model are common ways to simulate the investment decision in the power industry (Gao and Sheng, 2003; Shafie-Khah, 2013; Lu et al., 2014; Liu et al., 2015; Wang et al., 2021a; Wang et al., 2021b). Among the four, the evolutionary game model does not require participants to be completely rational and emphasize a dynamic equilibrium. In the real game between the investors, information is generally incomplete and imperfect, and participants are not completely rational, so they need to achieve equilibrium through the continuous game, trial, error, and learning. These models considered the choice of investors when implementing policies but ignored the repeated trial and error game process between investors and the imitating attempts between participants. The evolutionary game theory considers bounded rationality, learning mechanism, and decision-making process, which is more in line with reality (Vincent and Newsom-Davis, 1985). This article uses the evolutionary game theory to build a model to analyze the impact of the carbon tax and carbon emission trading policies on wind power and thermal power investment.
However, there are further improvements in the above studies. 1) Most research studied the power sector from a macro or meso perspective (Barragán-Beaud et al., 2018; Hu et al., 2020; Fu et al., 2021), but few studies analyzed it from a micro perspective of enterprises selection. With the establishment of China’s carbon emission trading market, more enterprises will be included in the market access scope in the future. At that time, as the beneficiaries (investment in renewable energy power) and purchasers (investment in coal-fired power), the correct investment decisions towards enterprise will increase its right in the carbon market. 2) However, most existing studies use static analysis (Taghizadeh-Hesary et al., 2021; Fu et al., 2021). Such analysis is difficult to describe the repeatability and dynamics of enterprise investment and hard to reflect changes in firms’ investment behavior over time. This leads to inaccurate long-term forecasts, allowing policy effects to deviate from the original design. 3) Besides, in terms of exploring enterprises’ investment decisions, the decision model and assumptions need more discussion. Few studies analyzed the effects of the carbon tax and carbon emission trading under the same model, and the conclusions between different studies could not be compared. The CGE model and its extension rely heavily on hypothetical parameters when simulating the effect of carbon tax or carbon emission trading policy, while the values of parameters may still be different when different articles study the same country and the same department (Cao et al., 2019; Zhang et al., 2020). Therefore, the conclusions drawn using CGE are not suitable for direct comparison.
The marginal contribution of this study to the current literature could be summarized as follows: 1) the impact of carbon emission reduction policies on investment in renewable energy generation is analyzed under the carbon tax and carbon trading policies from the perspective of enterprises investment, respectively, which enriches the study of enterprise perspective; 2) the dynamic model of the evolutionary game theory was used in this research to reflect the evolution of enterprises investment; and 3) analyzing carbon tax and carbon trading policies under the unified method makes the results more comparable.
Model
Carbon taxes and carbon emission right trading are often used to promote the development of renewable energy. The government needs to consider the appropriate policies and their combination to promote investment in renewable energy. China’s carbon emission trading pilot has been successfully operated for many years, and China has a complete tax system. Thus, this article only studies the carbon tax policy and carbon emission trading policy. Under the exogenous low-carbon policy, we considered the price of carbon emission trading to be relatively stable in a certain period because the impact of carbon emissions from new units is also small on the entire electricity market and the balance of the existing carbon emission trading market. Besides, given that the proportion of new power generation to total power generation is very low, in 2019 and 2020, the ratio is 2.04% and 2.56%, respectively (China National Energy Administration, 2020; China National Energy Administration, 2021), it is assumed that the power generation of new power plants will not affect the overall on-grid price; that is, the on-grid price P will not be affected by the amount of power generation Q.
The conceptual framework of the research is shown in Figure 1. The evolutionary game is employed to investigate the investment of wind power under carbon tax or carbon emissions trading. Under different low-carbon policies, thermal and wind units possess different costs and benefits. When the profit of thermal turbines is greater than that of wind turbines, more investors will invest in thermal turbines, and when the profit of thermal turbines is less than that of wind turbines, more entrepreneurs will inaugurate in wind turbines until the game results in an evolutionary stable equilibrium or a partial equilibrium. The government implements a policy of corporate investment in wind power according to the results of the corporate game to promote corporate investment in wind power and achieve China’s carbon peaking and carbon neutrality goals.
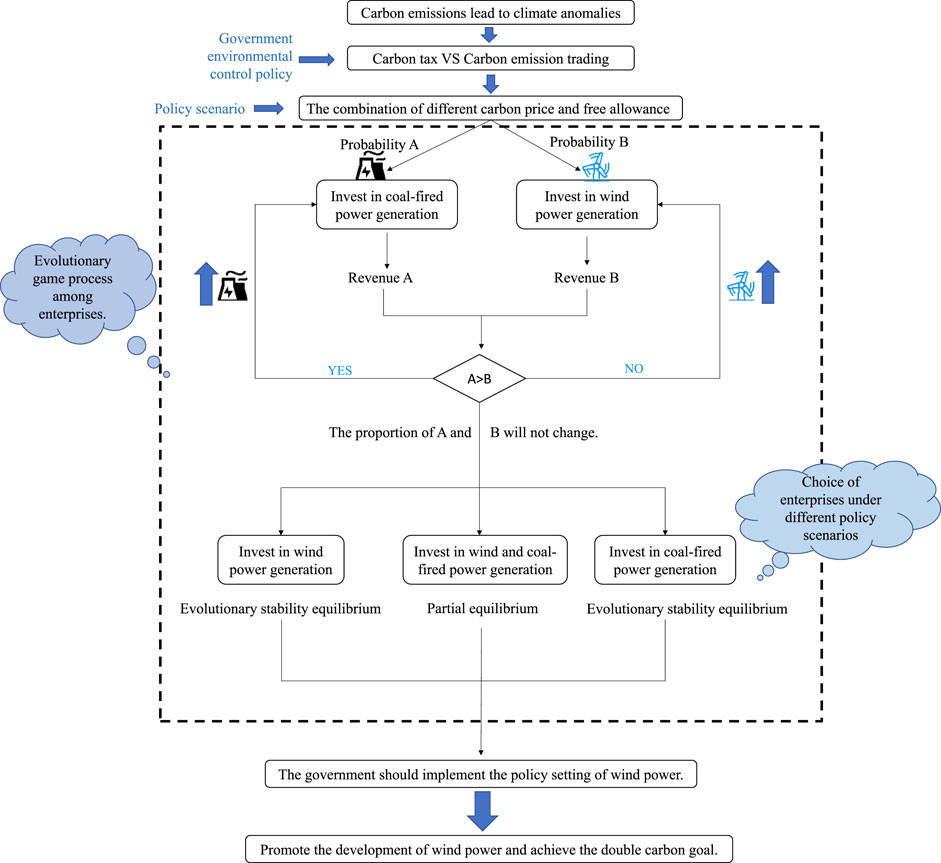
FIGURE 1. The framework of evolutionary game theory for an investment decision.
Evolutionary Game Matrix for Investors
The basic idea of the evolutionary game is that participants have different strategic choices, in which they choose their strategy while obeying a certain probability distribution. According to the income of the previous game, the participants will reduce the probability of selecting a low-yield strategy and increase the probability of selecting a high-yield strategy in the next game. The evolutionary game assumes that the game object is randomly selected from a large population, and the extracted samples are played according to the established rules. The results will be fed back to the large population, and the distribution of the random extraction will be changed. The above process will be repeated until the evolution is stable.
Following Stanford Encyclopedia of Philosophy (2021), consider a
Investor Strategy Choice for Investing in Thermal Power and Wind Power
Profit Function for Investing in Thermal Power
Following Yao (2015), the payoff function of thermal power investors is given by Eq. 2. The function contains the revenue of electricity sales, the cost of coal, and carbon dioxide emission cost:
where
Profit Function for Investing in the Wind Power
Following Yao (2015), Gartman et al. (2016a), and Gartman et al. (2016b), the payoff function of wind power investors is given by Eq. 3. The function contains the revenue in the electricity sale, the subsidies given by the government, the cost of building the wind power unit, and the revenue πwind in carbon dioxide emission trading:
Replicator Dynamics for Investors
If the probability of investor A investing in the wind power units is x, then the probability of investor A investing in the thermal power units is 1-x. If y is the probability of investor B investing in the wind power units, 1-y is the probability of investor B investing in the thermal power units. Following Friedman (1991) and Stanford Encyclopedia of Philosophy (2021), the replicator dynamics for the bimatrix game 1) is given as follows:
where E(A1) and E(B1) are the profits of strategies A1 and B1, respectively, and E(A) and E(B) are the average profits of investors A and B, respectively.
Let
If f(x) = 0, then
Let
If f(x) = 0, then
Following Li et al. (2015), the evolutionary game has four boundary equilibria [(0, 0), (1, 0), (0, 1), (1, 1)] and one interior equilibrium
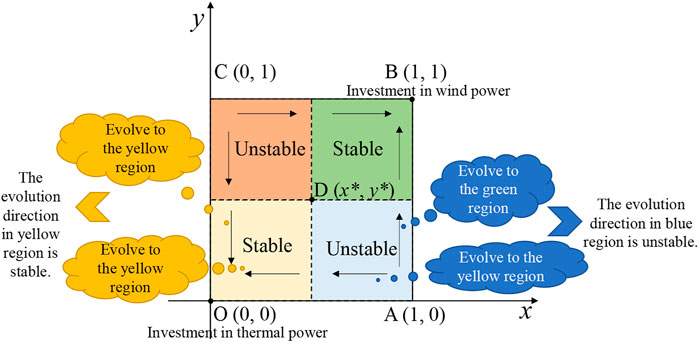
FIGURE 2. Phase diagram of investors evolution game.
In Figure 2, the evolution process and the steady population state are affected by the initial state of the system and the relative position of the saddle point D. When the initial state falls in the OD region (i.e., the yellow region), the evolutionary game system converges to O (0,0). At this time, investors all decide to build thermal power units. When the initial state falls in the BD region (i.e., the green region), the evolutionary game system converges to B (1,1). At this time, investors all decide to build wind power units. However, investors will not reach equilibrium in other regions. If
Investment Simulations
Parameter Initialization Settings
This study counts all the approved wind farm projects from 2013 to 2017 in China Certified Emission Reduction Exchange Info-Platform (China National Development and Reform Commission, 2021) and selects the average value of the on-grid energy and the carbon dioxide emission reduction from 393 wind farm projects with an installed capacity of 49.5 MW. The 49.5 MW wind farm was chosen because most of the newly built wind farms in China have an installed capacity of it as wind farms whose installed capacity above 50 MW requires approval of the National Energy Administration. Meanwhile, other wind farms only require local government’ approval. In the numerical example, the CO2 emission of the wind turbine is
The other parameters in our simulation are shown in Table 2.
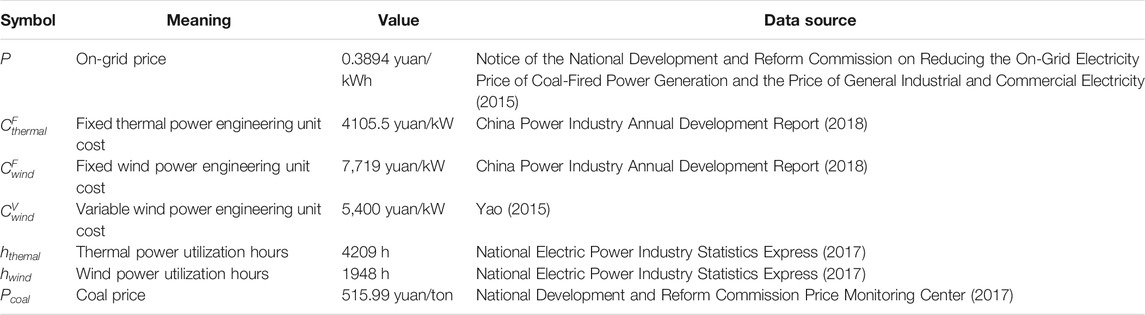
TABLE 2. Parameter and the value in our model.
The Result of Simulation
Baseline Scenario
Basically, China only implements the fiscal subsidy policy for wind power units, such as the carbon revenue of wind power units
where
When the financial subsidy is less than 0.047 yuan/kWh, investors will choose to invest in the thermal power units. When the subsidy is more than 0.047 yuan/kWh, investors will choose to invest in the wind power units, as shown in Figure 3. In Figure 3, point D (x*, y*) coincides with point O (0, 0). No matter where the initial situation is, all evolutionary directions eventually point to point B (1, 1), and the evolution result is (1,1), which means investors A and B all choose wind power generation. It is suited for the actual situation and proves that our model is reasonable. At the end of 2017, China’s renewable energy subsidy gap has reached 100 billion yuan, unsustainable for the wind power industry (Polaris solar photovoltaic network, 2018). Therefore, it is necessary to reduce subsidies and promote renewable energy development through a policy combination.
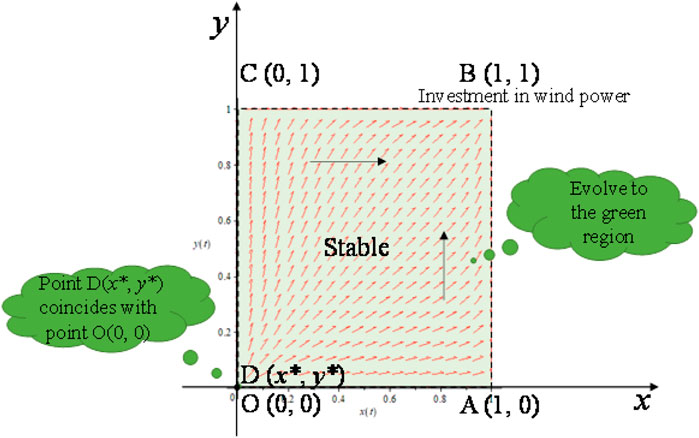
FIGURE 3. Simulation results in the basic scenario.
The Carbon Emissions Trading and Subsidy Scenario
In China’s carbon emission trading pilot areas, the average carbon emission trading price during 2017 was 27.85 yuan/ton in Shenzhen, 50.48 yuan/ton in Beijing, 23.35 yuan/ton in Shanghai, 14.28 yuan/ton in Guangdong, 13.70 yuan/ton in Tianjin, 18.52 yuan/ton in Hubei, and 4.01 yuan/ton in Chongqing. Therefore, this section discusses the impact of free quotas on the game when the carbon trading prices are 5, 10, 15, 20, 30, and 50 yuan/ton. The different carbon emission trading prices and financial subsidies are brought into the evolutionary game matrix, and the results under different conditions are obtained in Table 3. In the results, (0,0) represents the evolutionary game reaching the evolutionary stability equilibrium (ESS), where all investors invest in the thermal power units. (1,1) represents the evolutionary game reaching the evolutionary stability equilibrium (ESS), where all investors invest in the wind power units. (0,1) and (1,0) represent the evolutionary game reaching partial equilibrium, in which investor A invests in thermal power units and investor B invests in wind power units, and investor A invests in wind power units and investor B invests in thermal power units, respectively. Figure 4 shows some typical simulation results of different carbon trading prices under different subsidies in the carbon emission trading policy. Figure 4A implies that investors arrive at the evolutionary stability equilibrium for wind power. Figure 4B means the evolutionary game of investors reaches partial equilibrium, and the investment evolution direction of investors in green and yellow regions is random. Investors in these two regions may eventually invest along the red region or the blue region. Both red area and blue area mean that the investment is in an evolutionary unstable equilibrium state, with both investors investing in wind power and thermal power. At this point, investors are likely to invest in both wind power and thermal power. In Figure 4C, all investors prefer thermal power to reach evolutionary stability equilibrium.
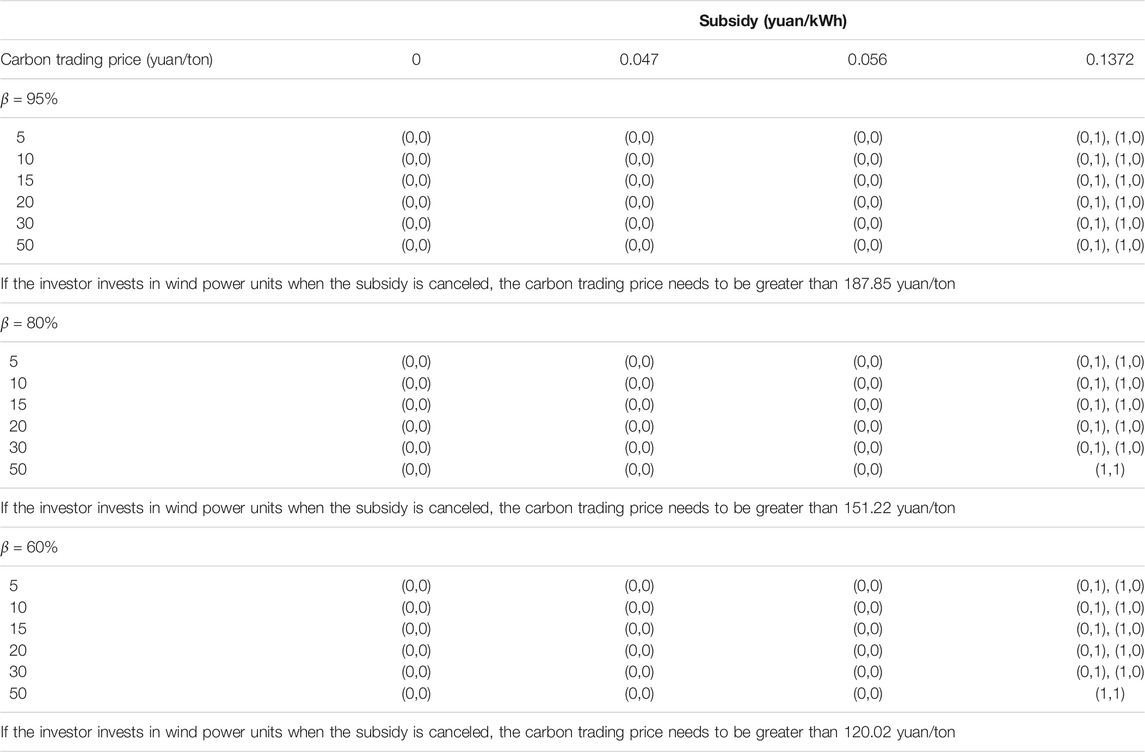
TABLE 3. Simulation results in the carbon emission trading policy.
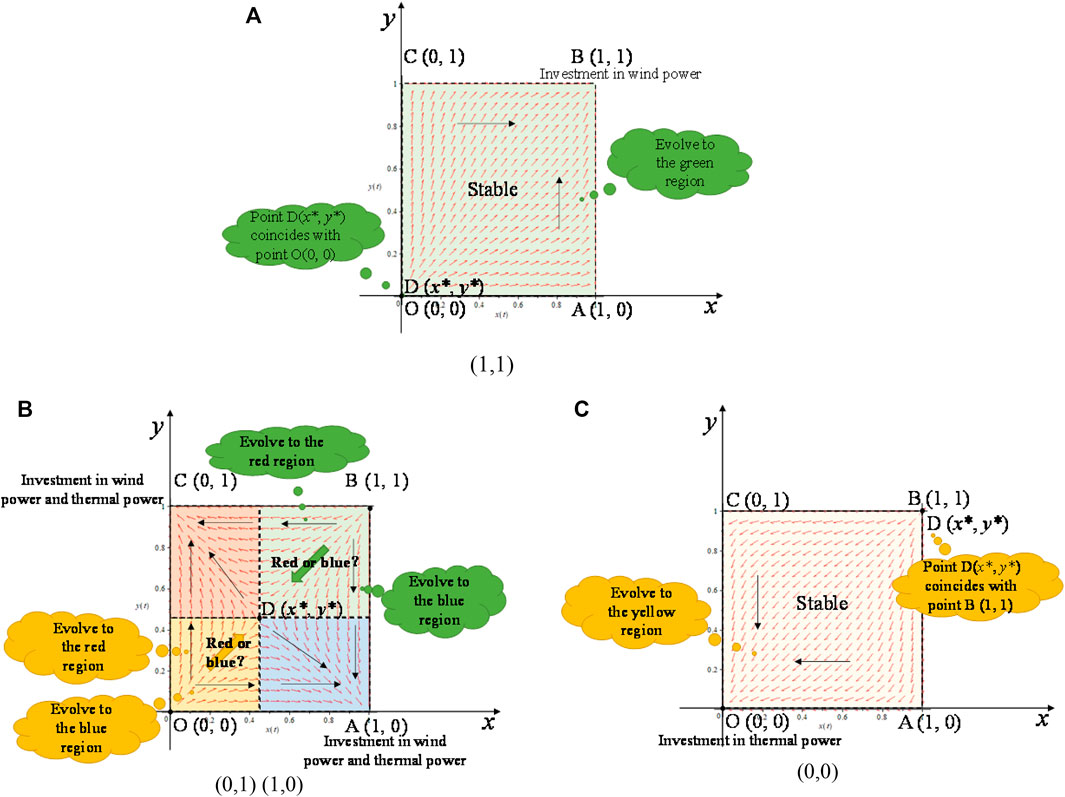
FIGURE 4. Typical simulation results in the scenario (A) evolutionary to (1, 1) which means investor invest in wind power. (B) evolutionary to (0,1) (1,0) which means investor invest in wind power and thermal power. (C) evolutionary to (0,0) which means investor invest in thermal power.
Table 3 shows that when the current financial subsidies are implemented, some investors invest in thermal power units, and others invest in wind turbines, which is the same as the real world. This finding is consistent with Luo et al. (2022), stating that the carbon trading policy does not play a role in carbon emission reduction under a 95% free quota. Besides, for comprehensive consideration, this study also analyzes more possible scenarios compared to the previous studies, the free quota at 80% and 60%. Under these two kinds of quotas, the lowest carbon emission trading price corresponding to enterprises’ investment in wind power is different, and enterprises can optimize their investment decisions according to our guidance price. The results of both papers conclude that the carbon trading mechanism can play a better role when the carbon trading price reaches 120 yuan/ton.
Additionally, we can reduce government financial pressure by increasing the price of carbon emission trading and reducing the free emission allowances of thermal power units. According to our simulation, if the free emission allowance of thermal power units is cut from 95% to 60% and the carbon trading price is greater than 120.02 yuan/ton, then the government can save at least 4020 million yuan per year (China National Energy Bureau 2017). The government could adapt to local conditions and change the access conditions in different regions, indirectly guiding the carbon emission trading price and changing the free emission quotas of thermal power units. By the above methods, the government can choose not to subsidize wind power units to alleviate the fiscal pressure.
The Carbon Tax and Subsidy Scenario
Studies on China’s optimal carbon tax never implemented in China are extremely different. This section separately solves the evolutionary game under different carbon tax levels. In China, the study shows the carbon tax should include 17.18, 36.49, 40, 81.08, and 132 yuan/ton (Yao and Liu 2010; Zhang 2011; Wang et al., 2012). China Carbon Forum (CCF) and ICF International Consulting Co., Ltd. jointly released the “China Carbon Price Survey” in August 2015. The result shows that the expected carbon tax in 2020 is 40 yuan/ton. According to the Carbon Pricing Watch 2017 report released by the World Bank, Mexico, Poland, and Ukraine have a carbon tax of less than 1 $/ton. The carbon tax is 84 $/ton in Switzerland, 52 $/ton in Norway, 33 $/ton in France, 25 $/ton in Denmark, and 126 $/ton in Sweden. In summary, we set the carbon tax in this section as 20, 40, 80, and 130 yuan/ton. The carbon emission cost of coal-fired units is determined by the carbon tax, and the tax rate of the carbon tax is set by the Chinese government.
Table 4 shows the results of the carbon tax policy; that is, when the subsidy is 0.1372 yuan/kWh, enterprises with carbon prices higher than 40 yuan/ton will invest in wind power. Otherwise, they would invest in thermal power is in accordance with recent studies Zhao et al. (2019) and Gugler et al. (2021). Based on the previous study, the study also analyzed the situation of the investment without subsidy to imitate the investment behavior of enterprises after subsidy declining. The future of China’s carbon reduction policy will be subsidy-free. The study could provide the basis for the government to predict the behavior of enterprises and promote the policy formulation to encourage enterprises to invest in wind power, so as to ensure the achievement of China’s double carbon target. We can see from the table that carbon taxes can replace subsidies, but there is a possibility to lead to a power industry shrinking when subsidies are too low or carbon taxes are too high.
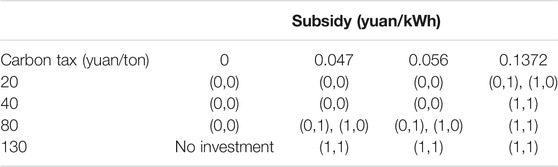
TABLE 4. Simulation results in the carbon tax policy.
Discussion
In this article, the evolutionary game is employed to study the investment of wind power under subsidy, carbon tax, and carbon emissions trading. By simulation analysis of the evolutionary game process, the impacts of free allowances, subsidy, the price of carbon emissions trading, and carbon tax are discussed. Then, under the two low-carbon policies, we conduct an in-depth scenario analysis to investigate the influences of those variables on the strategic evolution of participants. The results can be summarized as follows:
(1) The evolutionary game of investors has five partial equilibrium points, representing the following five cases: a) all investors invest in wind power units; b) investor A invests in wind power units and investor B invests in thermal power units; c) investor A invests in the thermal power unit and investor B invests in wind power units; d) all investors invest in thermal power units; and e) investors invest in thermal power units and wind turbines in a certain proportion. a and c are evolutionarily stable strategies.
(2) In the carbon emission trading policy, the government can change the price of carbon trading and the free emission quota of thermal power units and effectively reduce subsidies by means of multiple measures. In contrast, the government will turn to nothing but tax reduction to reduce subsidies on the carbon tax policy.
(3) In the two policies of the carbon tax and carbon emissions trading, the stability of the evolutionary game is more sensitive to the carbon tax policy, which means that the government’s choice of carbon tax policy is more conducive to guiding investors’ investment behavior, while carbon tax policies could lead to policy failures, so carbon emission trading policy is more suitable for China.
(4) There are some other partial equilibrium points in carbon emissions trading, in which investors will invest in wind power units and thermal power units. This will make the process of energy transition more gradual in China.
Conclusion
This research analyzes the impact of subsidies, carbon tax policies, and carbon emission trading policies on the investment in wind power units and thermal power units to promote carbon emission reduction. Based on a simulation of the model with the carbon emission trading in Beijing, Shanghai, Tianjin, Chongqing, Guangdong, Shenzhen, and Hubei provinces, the result shows that when the free quota is below 80%, free quotas can make up for the negative impact of reduced subsidies on wind power investment. Moreover, by simulating the impact of investment under a carbon tax, this article finds it is difficult to determine a reasonable carbon price, and fluctuations in carbon prices are likely to cause investment to switch from wind power to thermal power. Excessive carbon prices will even reduce investment in the power industry and gradually shrink.
Based on the above research results, to promote the development of wind power, this study proposes the following policy recommendations. 1) From the perspective of promoting renewable energy development, carbon emission trading is more effective than carbon tax policy in China. This study suggests that the government implements the carbon emission trading policy cause without the subsidy, and investors would prefer to invest in wind power under the carbon emission policy rather than carbon tax policy. In the absence of subsidies, only the implementation of carbon emission trading policy could increase the proportion of investment in wind power and achieve China’s double carbon target. 2) The reduction in wind power investment caused by the reduction of subsidies should be offset by the free allowance for carbon emission reduction trading. By this means, the wind power development plan could be reached without increasing the government subsidy gap. After the calculation, the government could reduce the total subsidy about 4020 million yuan per year by reducing the free quote from 95% to 60%. The establishment of appropriate quotas and trading prices of carbon emission rights could maintain the enterprises to continue to invest in wind power during the non-subsidy transition period and prevent the wind power investment from cooling down. 3) The future carbon emission trading market should be designed according to the price and free quota proposed in this research. The scenario analysis in the research is detailed and comprehensive, and the resulting free allowance and carbon trading prices are credible and could provide anchor prices for future carbon trading. The free allowances’ proportion in the carbon emission trading policy should not be higher than 80%. Once the subsidies are canceled, the carbon emission trading price should be 151.22 yuan/ton. When the free quota is 60%, the removal of subsidies will lower the carbon emissions trading price to 120.02 yuan/ton. Only by establishing a carbon emission trading market with such free quotas and carbon prices range, could enterprises be encouraged to invest in wind power and realize the wind power development plan of China’s “Economic and Social Development during the 14th Five-Year Plan Period".
Nevertheless, this article still has some limitations which can be addressed in future research. Above all, the uncertainty faced by wind power, for instance, the change in the cost of power generation of coal-fired units caused by changes in coal-fired power prices and changes in the price of a carbon-emission trading investment, can be discussed in future research. Next, this article only analyzes the two scenarios of carbon tax, subsidy and carbon emissions trading, which can partially describe the situation that may occur in reality, but there are far more scenarios in reality. The impact of low-carbon policies such as green power certificates on wind power could be simulated. Ultimately, this article does not consider the preferences of different types of investors. Therefore, the environmental preferences of investors should be investigated in the future to refine the impact of low-carbon policies on investment in wind power.
Data Availability Statement
The original contributions presented in the study are included in the article/Supplementary Material. Further inquiries can be directed to the corresponding author.
Author Contributions
Conceptualization: XZ and CS. Data curation: CS. Funding acquisition: XZ. Methodology: CS. Software: CS. Supervision: XZ and JW. Writing—original draft preparation: CS and XZ. Writing—reviewing and editing: JW and FY. All authors have read and agreed to the published version of the manuscript.
Funding
This work was supported by the National Science Foundation of China under project nos. 71934006 and 71573273.
Conflict of Interest
The authors declare that the research was conducted in the absence of any commercial or financial relationships that could be construed as a potential conflict of interest.
Publisher’s Note
All claims expressed in this article are solely those of the authors and do not necessarily represent those of their affiliated organizations or those of the publisher, the editors, and the reviewers. Any product that may be evaluated in this article, or claim that may be made by its manufacturer, is not guaranteed or endorsed by the publisher.
References
Aflaki, S., and Netessine, S. (2017). Strategic Investment in Renewable Energy Sources: The Effect of Supply Intermittency. M&SOM. 19, 489–507. doi:10.1287/msom.2017.0621
Bai, Q. G., and Xu, J. T. (2016). Joint Production and Emission Reduction Decisions for the Distributionally Robust Optimization Problem Under Carbon Regulations. Syst. Eng. heor. Pract. 36 (7), 1696–1709. doi:10.12011/1000-6788(2016)07-1696-14
Barragán-Beaud, C., Pizarro-Alonso, A., Xylia, M., Syri, S., and Silveira, S. (2018). Carbon tax or emissions trading? An analysis of economic and political feasibility of policy mechanisms for greenhouse gas emissions reduction in the Mexican power sector. Energy Policy. 122, 287–299. doi:10.1016/j.enpol.2018.07.010
Cao, J. S., Ho, M. S. W., Jorgenson, D. W., and Nielsen, C. P. (2019). China's Emissions Trading System and an ETS-Carbon Tax Hybrid. Energ. Econ. 81, 741–753. doi:10.1016/j.eneco.2019.04.029
Chen, W., Chen, J., and Ma, Y. (2021). Renewable Energy Investment and Carbon Emissions under Cap-And-Trade Mechanisms. J. Clean. Prod. 278, 123341. doi:10.1016/j.jclepro.2020.123341
China National Development and Reform Commission (2021). China Certified Emission Reduction Exchange Info-Platform. Available at: http://cdm.ccchina.org.cn/ccer.aspx.
China National Energy Administration (2020). China National Electricity Industry Statistics List [EB/OL]. (2020-01-20) [2021-12-11]. Available at: http://www.nea.gov.cn/2020-01/20/c_138720881.htm.
China National Energy Administration (2021). China National Electricity Industry Statistics List [EB/OL]. (2021-01-20) [2021-12-11]. Available at: http://www.nea.gov.cn/2021-01/20/c_139683739.htm.
China National Energy Bureau (2017). Grid-connected operation of wind power in 2017 [EB/OL]. (2018-02-01) [2021-12-11]. Available at: http://www.nea.gov.cn/2018-02/01/c_136942234.htm.
Domon, S., Hirota, M., Kono, T., Managi, S., and Matsuki, Y. (2022). The Long-Run Effects of Congestion Tolls, Carbon Tax, and Land Use Regulations on Urban CO2 Emissions. Reg. Sci. Urban Econ. 92, 103750. doi:10.1016/j.regsciurbeco.2021.103750
Friedman, D. (1991). Evolutionary Games in Economics. Econometrica. 59 (3), 637–666. doi:10.2307/2938222
Fu, Y., Huang, G., Liu, L., and Zhai, M. (2021). A Factorial CGE Model for Analyzing the Impacts of Stepped Carbon Tax on Chinese Economy and Carbon Emission. Sci. Total Environ. 759, 143512. doi:10.1016/j.scitotenv.2020.143512
Gao, S., and Sheng, Z. H. (2003). Elementary Groping for Evolutionary Game Theory and its Application in Electricity Market. Automation Electric Power Syst. 27 (18), 18–21.
Gartman, V., Bulling, L., and Dahmen, M. (2016a). Mitigation Measures for Wildlife in Wind Energy Development, Consolidating the State of Knowledge — Part 1: Planning and Siting, Construction. J. Environ. Assess. Pol. Management. 18 (3), 1650013. doi:10.1142/s1464333216500137
Gartman, V., Bulling, L., and Dahmen, M. (2016b). Mitigation Measures for Wildlife in Wind Energy Development, Consolidating the State of Knowledge — Part 2: Operation, Decommissioning. J. Environ. Assess. Pol. Management. 18 (3), 1650014. doi:10.1142/s1464333216500149
Goulder, L. H., Long, X., Lu, J., and Morgenstern, R. D. (2022). China's Unconventional Nationwide CO2 Emissions Trading System: Cost-Effectiveness and Distributional Impacts. J. Environ. Econ. Management. 111, 102561. doi:10.1016/j.jeem.2021.102561
Gugler, K., Haxhimusa, A., and Liebensteiner, M. (2021). Effectiveness of Climate Policies: Carbon Pricing vs. Subsidizing Renewables. J. Environ. Econ. Management. 106, 102405. doi:10.1016/j.jeem.2020.102405
Hu, X., Yang, Z., Sun, J., and Zhang, Y. (2020). Carbon Tax or Cap-And-Trade: Which Is More Viable for Chinese Remanufacturing Industry? J. Clean. Prod. 243, 118606. doi:10.1016/j.jclepro.2019.118606
International Energy Agency (2021). Total CO2 Emissions [DB/OL]. Available at: https://www.iea.org/data-and-statistics/data-browser/?country=CHINA&fuel=CO2%20emissions&indicator=TotCO2
Jia, Z., and Lin, B. (2020). Rethinking the Choice of Carbon Tax and Carbon Trading in China. Technol. Forecast. Soc. Change. 159, 120187. doi:10.1016/j.techfore.2020.120187
Kök, S., Kevin, S., and Şafak, Y. (2020). Investments in Renewable and Conventional Energy: the Role of Operational Flexibility. Manuf. Serv. Oper. Manag. 22 (5), 925–941. doi:10.1287/msom.2019.0789
Li, L., Zhang, S., and Cao, X. (2021). Assessing Economic and Environmental Performance of Multi-Energy Sharing Communities Considering Different Carbon Emission Responsibilities under Carbon Tax Policy [J]. J. Clean. Prod. 328, 129466. doi:10.1016/j.jclepro.2021.129466
Li, Q., Zhang, J. H., Zhang, B. Y., Cressman, R., and Tao, Y. (2015). Effect of Spatial Dispersion on Evolutionary Stability: A Two-Phenotype and Two-Patch Model. Plos One. 10, e0142929. doi:10.1371/journal.pone.0142929
Liu, L., Liu, H., Liu, Z. F., and Chen, W. H. (2015). Analysis of Tripartite Asymmetric Evolutionary Game Among Wind Power Enterprises. Therm. Power Enterprises Power Grid Enterprises Under New Energ. Resour. Integrated Sci. China Press. 12, 1297–1303. doi:10.1360/N092015-00244
Liu, Q., and Zhao, Q. H. (2015). Policy Impacts on Power Generation Enterprises’ Decisions and Optimization Model. Syst. Eng. Theor. Pract. 35 (7), 1717–1725. doi:10.12011/1000-6788(2015)7-1717
Lu, Q., Chen, L. J., and Mei, S. W. (2014). Typical Applications and Prospects of Game Theory in Power System. Proc. CSEE. 29, 5009–5017. doi:10.13334/j.0258-8013.pcsee.2014.29.002
Luo, Y., Wang, W., and Zhao, D. (2022). The Impacts of Carbon Emissions Trading Mechanism on the Power Transition Pathway -taking Guangdong-Hong Kong-Macao Greater Bay Area as an Example [J]. J. Clean. Prod. 330, 129894. doi:10.1016/j.jclepro.2021.129894
Ministry of Finance of the People’s Republic of China (2021). Reply of the Ministry of Finance to No.9142 of the Fourth Session of the 13th National People's Congress Ministry of Finance of the People’s Republic of China 2021.06.30 (2021.12.23). Available at: http://jjs.mof.gov.cn/jytafwgk_8360/2021jytafwgk_1/rddbjyfwgk/202108/t20210805_3743186.htm.
Poelhekke, S. (2019). How Expensive Should CO2 Be? Fuel for the Political Debate on Optimal Climate Policy. Heliyon. 5, e02936. doi:10.1016/j.heliyon.2019.e02936
Polaris solar photovoltaic network (2018). At the End of 2017. Beijing: China's renewable energy subsidy gap has reached 100 billion yuan. Available at: http://guangfu.bjx.com.cn/news/20180202/878569.shtml.
Robinson, C. (2010). Markets, Imperfections and the Dangers of Over-Regulating Energy Markets. Econ. Affair. 24 (2), 52–55. doi:10.1111/j.1468-0270.2004.00474.x
Shafie-Khah, M., Parsa Moghaddam, M., and Sheikh-El-Eslami, M. K. (2013). Moghaddam M P and Heikh-El-Eslami M KDevelopment of a Virtual Power Market Model to Investigate Strategic and Collusive Behavior of Market Players. Energy Policy. 61 (61), 717–728. doi:10.1016/j.enpol.2013.06.003
Stanford Encyclopedia of Philosophy (2021). Evolutionary Game Theory. Available at: https://plato.stanford.edu/entries/game-evolutionary/#Bib.
Taghizadeh-Hesary, F., Yoshino, N., and Rasoulinezhad, E. (2021). Unconventional Monetary Policy and Income Disparity in an Aging Society. J. Econ. Pol. Reform. 11, 1–20. doi:10.1080/17487870.2021.1968860
Vincent, A., and Newsom-Davis, J. (1985). Acetylcholine Receptor Antibody as a Diagnostic Test for Myasthenia Gravis: Results in 153 Validated Cases and 2967 Diagnostic Assays. J. Neurol. Neurosurg. Psychiatry. 48, 1246–1252. doi:10.1136/jnnp.48.12.1246
Wang, G., Chao, Y., and Chen, Z. (2021a). Promoting Developments of Hydrogen Powered Vehicle and Solar PV Hydrogen Production in China: A Study Based on Evolutionary Game Theory Method. Energy 237, 121649. doi:10.1016/j.energy.2021.121649
Wang, G., Chao, Y., Jiang, T., and Chen, Z. (2021b). Facilitating Developments of Solar thermal Power and Nuclear Power Generations for Carbon Neutral: A Study Based on Evolutionary Game Theoretic Method. Sci. Total Environ., 151927. doi:10.1016/j.scitotenv.2021.151927
Wang, P., Lin, C.-K., Wang, Y., Liu, D., Song, D., and Wu, T. (2021). Location-specific Co-benefits of Carbon Emissions Reduction from Coal-Fired Power Plants in China. Nat. Commun. 12, 6948. doi:10.1038/s41467-021-27252-1
Wang, X. T., Xue, H. F., and Zhang, Q. (2012). Evolutionary Game Analysis on the Interest Coordination of Grid-Connected Renewable Energy Power Generation. Syst. Eng. 4, 94–99.
Wu, L. B., Qian, H. Q., and Tang, W. Q. (2014). Selection Mechanism between Emission Trading and Carbon Tax Based on Simulation of Dynamic Marginal Abatement Cost Economic. Res. J. 9, 48–61.
Yao, J. (2015). The Impacts of Carbon-Reduction Policies on the Investment Value of Power Plants. Master Thesis. North China Electric Power Univ.
Yao, X., and Liu, X. Y. (2010). Optimal Carbon Tax in China with the Perspective of Economic Growth Economic. Res. J. 11, 48–58.
Zhang, M. M., Zhou, D. Q., Zhou, P., and Chen, H. T. (2017). Optimal Design of Subsidy to Stimulate Renewable Energy Investments: The Case of China. Renew. Sustainable Energ. Rev. 71, 873–883. doi:10.1016/j.rser.2016.12.115
Zhang, W.-W., Zhao, B., Gu, Y., Sharp, B., Xu, S.-C., and Liou, K.-N. (2020). Environmental Impact of National and Subnational Carbon Policies in China Based on a Multi-Regional Dynamic CGE Model. J. Environ. Manage. 270, 110901. doi:10.1016/j.jenvman.2020.110901
Zhang, Y., Zhang, X., and Lan, L. (2022). Robust Optimization-Based Dynamic Power Generation Mix Evolution under the Carbon-Neutral Target. Resour. Conservation Recycling. 178, 106103. doi:10.1016/j.resconrec.2021.106103
Keywords: carbon tax, carbon emissions trading, financial subsidy, evolutionary game, wind energy
Citation: Sun C, Wei J, Zhao X and Yang F (2022) Impact of Carbon Tax and Carbon Emission Trading on Wind Power in China: Based on the Evolutionary Game Theory. Front. Energy Res. 9:811234. doi: 10.3389/fenrg.2021.811234
Received: 23 November 2021; Accepted: 27 December 2021;
Published: 16 March 2022.
Edited by:
Joni Jupesta, Research Institute of Innovative Technology for the Earth, JapanReviewed by:
Zhaoyang Kong, Beijing University of International Business and Economics, ChinaEhsan Rasoulinezhad, University of Tehran, Iran
Copyright © 2022 Sun, Wei, Zhao and Yang. This is an open-access article distributed under the terms of the Creative Commons Attribution License (CC BY). The use, distribution or reproduction in other forums is permitted, provided the original author(s) and the copyright owner(s) are credited and that the original publication in this journal is cited, in accordance with accepted academic practice. No use, distribution or reproduction is permitted which does not comply with these terms.
*Correspondence: Xiaoli Zhao, ZW1haWw5OXp4bEB2aXAuc2luYS5jb20=