Abstract
With the implementation of China’s “double carbon” strategy, the usage scale of electric vehicles has grown rapidly. Therefore, how to maintain the ideal voltage and energy curve in the distribution network with high penetration of electric vehicles is a challenging problem. In this paper, the random behaviors of fast charging, ordinary charging and discharging modes of electric vehicles have been analyzed and the mathematical formulation of the algorithm has been presented. Then, the strategy of coordinated charging-discharging stack of electric vehicles is proposed. The improved particle swarm optimization algorithm based on mixed real number and binary vector is used to solve the optimization model. The results of several case studies have also been presented in this paper to show that optimum capacitor switching and transformer tap adjustment solutions can be found to minimize the total operation cost including energy consumption, power quality and reactive power compensation equipment action cost. The paper demonstrates that the impact of high-penetration electric vehicles on the energy and voltage control of the distribution network has been solved. The proposed EV coordinated stacking method can make electric vehicles charge and discharge in an orderly queue, and ensure that the line flow does not exceed the limit. Through the proposed control strategy, the voltage curve is obviously improved, and the cost of the distribution system with large-scale EVs can be effectively reduced.
1 Introduction
In recent years, with the rapid development of electric vehicles (EV), the scale of them has increased significantly and shows a sustained growth potential in the world. Large-scale EVs charging and replacing power stations are novel large-scale random loads for power grids, and their concentrated charging behavior will cause sudden increase of distribution load, voltage drop, network losses and a series of problems[ (Zhang et al., 2016), (Ruan et al., 2019)]. Different from the traditional load, EVs are used as energy consumer and storage resources to exchange electric power with grid in both directions (Liu et al., 2014). When power supply is in shortage, EVs in turn support the stability and reliability of distribution network[ (Kang et al., 2021)] (Wang et al., 2022). In addition, there is a trend of increasing inductive load in modern power grid (Xu et al., 2022), and the improvement of permeability of EVs will adversely affect the power flow and quality of distribution networks whether they are in charging or discharging state (Zhao et al., 2021). This effect is manifested in the sharp increase of active and reactive power at centralized charging, which will cause bus voltage to decrease (Su et al., 2017) and cause line losses to increase. Therefore, in order to improve voltage distribution and reduce reactive power consumption, transformer tap adjustments and capacitor switching frequencies increase[ (Zhang et al., 2022)]- (Zeng et al., 2012). Aiming to challenges brought by high permeability EVs and their unique characteristics (Zeng et al., 2012), it is necessary to design a more reasonable charging and discharging mechanism to improve the effective utilization rate of reactive power resources, so that the distribution network can maintain an optimal power flow and power quality.
EVs have bidirectional energy flow characteristics and high flexibility, which consume electrical power from integration points of distribution network by charging or inject electrical power into them by discharging (Morro-Mello et al., 2021). In addition, the charging and discharging behaviors of a large number of EVs have certain randomness (Chen et al., 2015). Many researchers have been involved in control strategies for supporting role of EVs in distribution networks. Melo H (Melo et al., 2018) pointed out that the bidirectional charging and discharging technology between EVs and power grid was becoming commercial application, which made EVs parked for a long time available for dispatching and requisitioning on the power grid and realized the function of peak shaving and valley filling through bidirectional interaction of active power. Aiming at the challenge brought by the randomness of EV charging to the operation of distribution network, a forecasting method of EV charging load interval based on multi-correlation daily scenario generation was proposed (Huang et al., 2021). Li (Li et al., 2016) considered the reverse transmission behavior of EV to power system based on mobile social network, and proposed a prediction method of EV charging and discharging behavior under the constraint of time-of-use electricity price. Liu (Liu et al., 2020) proposed a distributed robust chance constraint model considering discrete reactive power compensators, which considered the influence of renewable energy in active distribution networks. Li (Li et al., 2018) used particle swarm optimization algorithm to solve the demand response model of EVs in plug-and-play mode, and improved the reliability of radial distribution system through V2G mode, but did not consider the constraint of line power flow exceeding limit.
Regarding the optimization techniques opted for EV integration, the literature identifies two types of approaches: centralized control and decentralized control. A typical centralized approach is presented in (Cheng et al., 2015), where all EVs are connected to a centralized control unit. But the proposed system suffers from two major disadvantages: first, the system requires performant data acquisition communication networks, and second, EV needs, as an energy consumer and a mobility device, are not taken into consideration. Paper (Cardona et al., 2018) presented a decentralized approach to EV charging. In addition to the need for a performant communication network, this approach requires that all EVs are connected to high-performance charging stations. However, charging stations that are capable of performing these tasks uaually cost a lot.
EVs are considered to be one of the important parts of distribution networks under the development of vehicle-to-grid technology among a wide variety of distributed network energy resources. A large number of EVs can be used as flexible storages or controllable load s to participate in different types of ancillary services in a distribution network (Vincent et al., 2019). The load profile of the distribution network is flattened in (Huang et al., 2020) by utilizing large-scale vehicle-to-grid-enabled EVs through the charging process of EVs in the distribution network (Brinkel et al., 2020). A smart charging strategy is proposed in (Moghaddam et al., 2017) for EV charging stations to address the issue of finding an optimal charging station.
To sum up, while EVs serve as mobile, rechargeable and dischargeable energy storage elements, they provide many flexible supports to the local grid. But there is no significant randomness research on driving habits and charging capacity of large-scale electric vehicles in relevant research at present. In addition, the interaction between high permeability electric vehicles and power grid may lead to the voltage drop exceeding the lower limit at monitoring points, and there is a lack of relevant research to solve this problem at present. Therefore, this paper will study how to coordinate the charging of large-scale electric vehicles in an orderly manner, and control the electric vehicles in fast charging, general charging and discharging modes and various reactive power sources in their distribution network in an orderly and coordinated manner, so as to solve the problem that the power flow of distribution network with large-scale electric vehicles exceeds the stability limit. The voltage control and power consumption of distribution network reach ideal value. In this paper, the impact of EV load profiles on the distribution network under the stochastic charging behavior is assessed, which shows that EV charging should be properly coordinated and planned to avoid the voltage drop.
The core contribution and innovation of this paper lies in exploring a voltage and energy control model for a distribution network with high permeability EVs whose random behaviors of fast charging, normal charging and discharging were analyzed, proposing a coordinated charging-discharging stack strategy for EVs, and putting forward an improved mixed real and binary vector swarm optimization algorithm to solve the proplem. Based on the proposed model, optimum capacitor switching and transformer tap adjustment schemes were found to minimize the total operation cost including energy consumption, power quality and reactive power compensation equipment action cost, and the impact of random charge and discharge behavior on the power grid was reduced. In the case studies, the effectiveness of the proposed model and algorithm was verified by comparing and analyzing various scenarios before and after reactive power compensation of baseline load in distribution network and before and after the access of high permeability electric vehicles. Finally, based on the proposed coordinated stack method for electric vehicles, the reactive power compensation equipment was optimized and adjusted to ensure the safe and stable operation of the distribution network.
Voltage energy control model of distribution network
Objective function
The increasing power demand of modern distribution system with a variety of intelligent devices will lead to the increase of reactive power loss, and then lead to the increase of voltage drop on the demand side. Capacitor bank switching and load tap switching of on-load voltage regulating transformer are one of the effective ways to solve this problem, which can minimize bus voltage deviation (Kisacikoglu et al., 2015). However, due to the time-varying load of high permeability EVs, the switching of capacitor banks and the adjustment of transformer taps need to closely follow the variability and randomness of the load. In order to achieve this goal, a multi-objective optimization model for large-scale centralized voltage and energy control for high permeability EVs is proposed in this paper to minimize the operation cost of distribution network. The objective functions are as follows:Where, is the energy consumption cost of distribution network, is compensation cost for bus voltage deviation, is the switching cost of shunt capacitors, is cost of adjusting transformer taps. In order to consider the total cost of cash cost and maintenance cost of the maximum allowable adjustment times in the life of the main transformer (Tao et al., 2020).
In the optimization model, the cost will be converted into unit ratio. However, the switching cost of shunt capacitor is similar to the adjustment cost of main transformer tap, which is finally converted into the cost per MVar.
The energy consumption cost is calculated as follows:Where() is the daily total active (reactive) energy consumption; () is the active (reactive) power cost per kW (kVar).
The compensation cost caused by bus voltage deviation is not only related to the voltage offset, but also related to the load on the bus. The heavier the load, the greater the loss caused by voltage deviation. Calculated by Eq 3:Where and are the voltage and active power on the bus at a moment respectively; is penalty imposed when the bus voltage value exceeds the lower () or upper () limit of the voltage.
It can be inferred from Eq 4 that when the bus voltage varies between 0.95 pu () and 1.05 pu (), there will be no penalty cost. Indicates the extreme value of the accident voltage that the distribution network can bear. If it is lower than , the low-frequency and low-voltage devices will act to cut off the load, and if it is higher than , the dispatcher should take measures such as emergency shutdown of the generator.
Constraints
One of the main constraints in distribution systems is that the active and reactive power flow satisfy the following equation (Fang et al., 2022), (Cai et al., 2015), (Kim and Dandurand, 2022):Where, and are the active and reactive power injected into the distribution network by the superior power grid at time t, which is always injected through the bus on the low voltage side of the main transformer; and are the active power loss and reactive power loss of branches respectively; and the active load and reactive load of bus i respectively; is the charging power of the jth EV in the sth parking lot or the active power injected into the power grid; The charge/discharge state of the jth EV is defined by . When the electric vehicle is in the charging mode, the value of is 1, and when the electric vehicle is in the discharging mode, the value of is -1. In addition, represents the total number of nodes in the distribution system; represents the total number of branches in the distribution system; indicates the total number of parking lots; indicates the number of EVs in the s parking lot at time t. represents the ratio of all other uncontrollable loads to the total load on bus i except for the load participating in the demand response. According to general conditions, the proportion of all controllable loads on a bus, including those involved in demand response and interruptible loads, is set to 20%. Then we will have = 0.8, = 1.
Coordinated charge and discharge stack method for EVs
Charge and discharge coordination strategy of EVs
If the charging power of a large-scale EVs cluster exceeds the thermal stability threshold of the connected grid line at the same time, the grid cannot meet the charging request. At this time, the EVs in the fast charging mode should first change the charging mode to normal charging until the current carrying capacity of the distribution line decreases to the normal range. If all EVs in fast charging mode on this line are changed to normal charging mode, the line may still exceed the stable limit; Or many EVs are in discharge mode, and the charging power to the power grid is too large, which leads to the problem of EV power spillage (EVPS). The solution to these two cases is to put some EVs in the queue and wait for charging orderly.
The charging and discharging power of EVs is as follows:Where, is the charging and discharging efficiency of EVs; is the nominal capacity of the battery of the ith EV.
Eq. 7 shows that considering the charging and discharging efficiency, the power grid needs to provide more power than the battery capacity to charge in the charging mode; Accordingly, there is also power loss when EVs inject electricity into the power grid in discharge mode. In order to simplify the analysis, it is assumed that the EV can operate in two different states: (i) the EV is fully charged and can deliver power to the power grid, and (ii) the EV is exhausted and needs to be recharged, regardless of the intermediate state. There are two charging modes: normal charging and fast charging, and the number of EVs allowed in fast charging mode is determined by the thermal stability limit of distribution network lines.
Assuming that the EV arrives at the station at and leaves at , this period is called parking duration PTD:Where, PTD depends on the wishes of EV owners and follows a random distribution pattern. However, due to the thermal stability limitation of parking lot lines, EVs may need to queue up to charge and discharge after entering the parking lot.
According to (Leemput et al., 2015), the charging speed of the EV in the fast charging mode is assumed 10 times faster than its normal charging speed in this paper, and the duration of the EV to keep charging is :
If the EV is in fast charging mode, the charging time will be reduced by 90%, and the active power is when charging:Where, = 10.
Therefore, for the second parking lot at time t, where some vehicles are charging and the other vehicles are discharging, the total power delivered to or obtained from the power grid is as follows:Where, andare the total number of cars charged and discharged in the first parking lot at a time respectively.
If > 0, the direction of power is that the power grid flows into the parking lot, otherwise, it means that the parking lot is transmitting electric energy to the power grid. The constraint conditions of thermal stability limit of transmission lines are as follows:Where, and are the number of EVs in charging and discharging modes at all times; For the total number of EVs in the first parking lot at all times is ; The number of EVs in normal charging mode is ; is the number of EVs in fast charging mode; is the thermal stability limit of the transmission line between the first parking lot and the large power grid; is the apparent power of the first parking lot at the moment; is reactive power flowing through the line connecting the first parking lot with the power grid at all times; , , and are the fast charging power, general charging power and discharge power of EVs in parking lots.
Considering that EVs need to queue up for charging after arriving at the parking lot, the priority stack table of vehicles is obtained according to the time when each EV arrives at the parking lot. Assuming that the number of EVs arriving at the parking lot and their willingness to charge (fast charge or general charge) or discharge follow a random distribution, the following charging coordination strategy is established in the parking lot:
1) Check whether there are unoccupied charging piles in the parking lot every 20min. If so, the car ranked first in the stack table will go to the charging pile. If the power grid has sufficient active power, it will enter the next step. If the power grid is at the peak of power consumption, the car willing to discharge will be preferred. 20 min is the time window assumed in this paper. If the load on the power line is high, the electric vehicle to be fast charged will wait 20 min to see whether the load on the power line is still high after 20 min. If the load drops at that time and the conditions for fast charging are met, the electric vehicle can be quickly charged in the high-power charging mode. If the load on the power line is still high, the owner of the electric vehicle will continue to wait for the next 20 min, or the owner will give up waiting and switch to normal mode charging.
2) The power of fast charging of electric vehicles is more than 10 times higher than that of ordinary charging. When a large number of electric vehicles are in the state of fast charging, the aggregation effect makes the down-flow of the distribution network very large. The allowable capacity of a typical 10 kV distribution line is about 6MVA, the safety current limit is 340A, and the rated capacity of the 110 kV main transformer supplied to it is 40MVA (GB50293-1999). Therefore, it is necessary to limit the total charging power of electric vehicle charging piles connected to the same 10 kV distribution line. Otherwise, the line will cause the relay protection device arranged on the 10 kV circuit breaker to act due to exceeding the stability limit, which will cause the circuit breaker to trip and then the line will lose power. If the car wants to charge quickly, it must check whether the stability limit of the line connecting the parking lot and the power grid is allowed. If allowed, the vehicle can go to the charging pile to charge, otherwise it should wait for another 20min, and then call the next vehicle with general charging intention in the priority list.
Solution of swarm optimization algorithm based on mixed real number and binary vector
In this paper, mixed real number and binary vector particle swarm optimization algorithm is used to solve the optimization problem (Brinkel et al., 2020). The solution format of the optimization model is a matrix containing decision variables and objective function values in a 24-h time range. The solutions in each time period are as follows:
Among them,Where, is a 0–1 binary variable, which indicates the switching state of the ith capacitor; is the gear of transformer tap; OF is the total operating cost of distribution network with the objective function in Eq. 1.
In each iteration, a population representing the switching of capacitor banks and the state change of transformer taps will be generated. Capacitor banks can be switched on or off at will, and the switching situation can be solved by discrete binary particle swarm optimization[ (Holmquist et al., 1993; Jiang et al., 2008; Wu et al., 2010; Ma et al., 2011; Guan et al., 2013; Anonymous, 2021)], and its evolution process is as follows:Where, is the velocity of the kth iterative particle in the dimensional space; is the position of particle i in dimensional space in the kth iteration; is the optimal solution of a single particle; is the global optimal solution; and are the acceleration factors of the value [0, 2]; , , and are random function with a range of (0, 1); is non-negative optimization weight, variable inertia weight is adopted in this paper.
The expression is as follows:Where, t is the current evolutionary algebra; is the maximum number of iterations.
At the beginning of the search, a larger value of is taken, and the maximum value is taken, so that each particle searches for the optimal solution with a larger step size and avoids falling into the local optimum. In the later stage, gradually decreases until the particles can carpet search near the optimal solution, thus ensuring the convergence of the algorithm at the global optimal position.
In this paper, the adjustment gear of the main variable taps is integer, and the traditional particle swarm optimization algorithm and binary particle swarm optimization algorithm are powerless. In this paper, a discrete particle swarm optimization algorithm is designed to deal with the optimization variables as integer. In this paper, we define a new operation of fetching random numbers, which generates random integers from the ranges of [0, ] and [0, ], respectively. It will be defined as: generating integers with the range of [0, ], and the above is substituted into the formula, where the values of position and velocity are integers.
, the constant is the dimension vector, which represents the speed limit. If the distribution network contains controllable load, will be defined as controllable load and added to .
Therefore, the iterative solution formula is:Where the iented, is the integer from to . is main variation tap gear.
Coordinate charge and discharnteger from to is represge stack flow
The improved particle swarm optimization algorithm based on mixed real numbers and binary vectors is used to realize the energy and voltage control of distribution network system with high permeability EVs. Figure 1 is a flow chart of the proposed optimization problem. The first stage is to form a coordinated charge and discharge stack table.
FIGURE 1
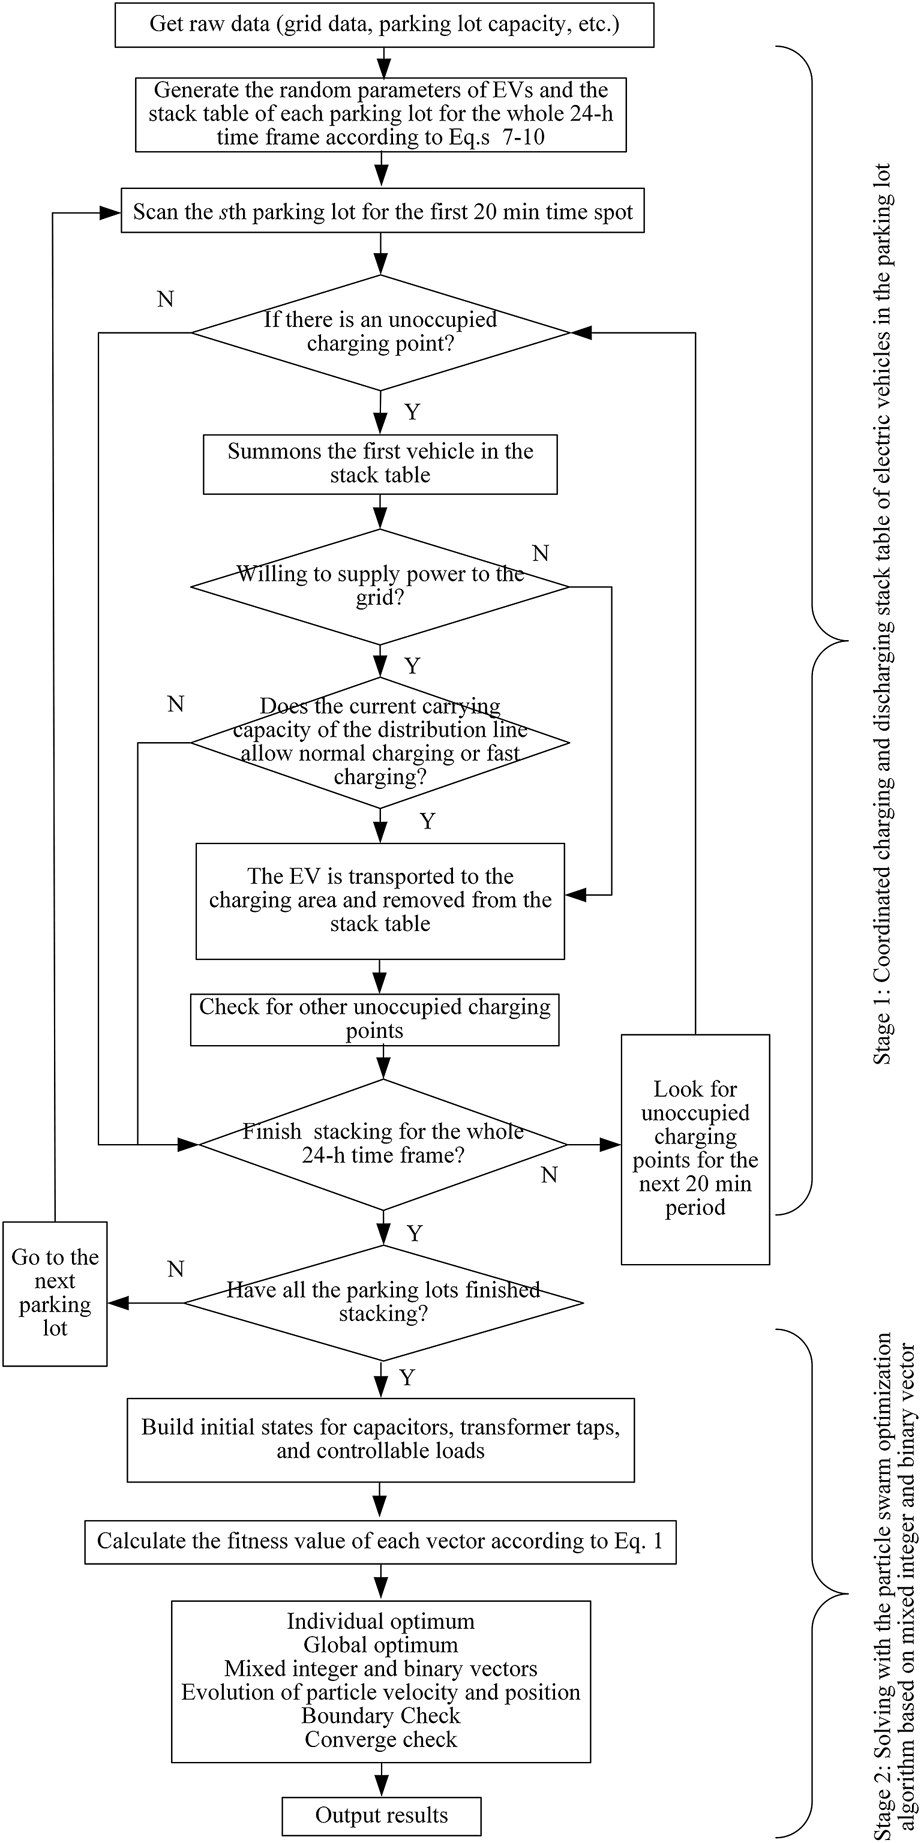
Flow chart of coordination algorithm for charge and discharge of EVs.
1) According to Figure 1, first read the original data (grid data, parking lot capacity, etc.) and generate the random parameters of EVs and a 24-h all-weather priority list of each parking lot according to formula. Scan the unoccupied charging pile in the first parking lot at the first 20 min time node, and summon the first car in the priority list if there is any spare time.
2) Judge whether to supply power to the power grid, determine the initial number of EVs in each parking lot and the charging/discharging state using the normal distribution function, and then determine whether the charging mode is general charging or fast charging.
3) Check whether the line power will exceed the thermal stability limit and whether the charging and discharging power of EVs will overflow. If the distribution line reaches the limit, the number of charging and discharging EVs must be modified. In order to further prevent the line load from exceeding the limit, the number of EVs with fast charging will be limited, while EVs with general charging will be given priority, transferred to the charging area and removed from the stack table.
4) Find other unoccupied charging piles in the next 20min time period. After the 24-h stack table in the parking lot is generated, go to the next parking lot until all parking lots are scanned.
In the second stage, the mixed real number and binary vector particle swarm optimization algorithm is used to solve the problem. There will be n decision variables related to capacitors and one variable related to transformer taps in the solution space sm. The steps are as follows:
5) Formation of initial population. The initialization Eq 13, 14, and 20 and the solution vector defined in the formula other than the objective function OF are used to construct the capacitor, main transformer tap state and controllable load state.
6) Construct the evaluation function in vector optimization. In this step, the fitness of each vector is calculated based on the objective function in Eq 1.
7) Population renewal based on evaluation function. The new vector is calculated through four stages: reproduction, mutation, boundary checking and selection. Replication combines multiple vectors to determine the best information, and iteratively searches for the best solution by using Eqs 21, 22)
8) Termination conditions. When the accuracy is 0.0001, the solution of the objective function is the same in two consecutive iterations. If the termination condition is not met, the process will be iterated from Step 2.
Case studies
Model assumptions and cases description
Based on IEEE 69-bus system, the model and solution method proposed in this paper are tested, as shown in Figure 2. The total active load of the system is 3801.5 kW and the total reactive load is 2694.6 kVar. Ten three-phase shunt capacitors with a capacity of 300 kVar in the system are located at nodes 9, 19, 31, 37, 40, 47, 52, 55, 57 and 65, which can be connected to or disconnected from the system; The on-load voltage regulating transformer is located at the first node of distribution network. The first gear of transformer tap is 0.02 p. u. and the maximum 3 grades can be adjusted in seven gears, so that the voltage variation range of the first node is within [0.94, 1.06] p. u.
FIGURE 2
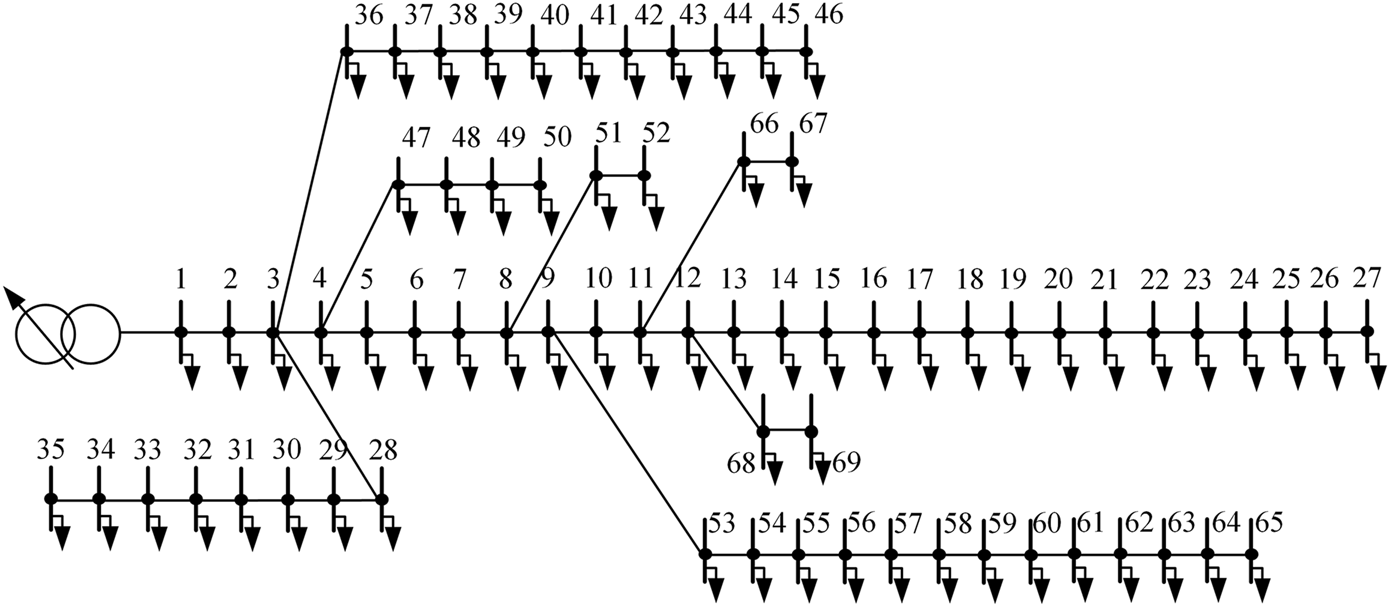
IEEE 69-node distribution network system.
When calculating the cost function, the adjustment cost of compensation capacitor and tap of on-load voltage regulating transformer are 9.18 yuan/MVAR and 18.35 yuan/tap, respectively (Tao et al., 2020). Where is 0.8 pu, 1.2 pu and 23.46 yuan/kWh. and are set to 0.41 yuan/kWh and 0.14 yuan/kVarh, respectively. In the hybrid real and binary vector particle swarm optimization algorithm , the number of particles in the population is 90, the number of objective functions is 4, the variable inertia weights is 0.8, is 0.4, and the maximum particle optimization speed is 10 and the minimum is-10. The simulations were run in MATLAB (The MathWorks, Inc. Natick, MA, United States) on a desktop computer equipped with an Intel Corei5-7200U 2.60 GHz CPU, 8.00 GB memory, and 64 bit Windows 10 operating system (Datta and Senjyu, 2013; Yao et al., 2019).
Three scenarios are used to analyze and verify the voltage and energy control effect of the proposed algorithm in distribution network. Scenario 1: Power flow distribution and operating cost of distribution network under load baseline within 24 h; Scenario 2: Without EVs, the distribution network cost evaluation of reactive power compensation is carried out by means of capacitor switching and on-load voltage regulating transformer tap adjustment; Scenario 3: Consider the situation with high permeability EVs on the basis of Scenario 2.
Scenario 1: Power flow distribution and operating costs under baseline load
Because the proposed optimization algorithm is not applied in Scenario 1, the results are compared with other scenarios as nominal values to prove the effectiveness of the proposed algorithm in other scenarios. The typical daily load level with a time step of 1 h in distribution network is shown in Figure 3. All simulation analysis in this paper uses the daily load curve in Figure 3. According to Figure 3, within 24 h, the load at 15:00 is the nominal load, the load at 1:00 is light load level, the load at 11:00 is heavy load level, and the load at 1:00 and 11:00 are 0.73 times and 1.25 times of the nominal load respectively.
FIGURE 3
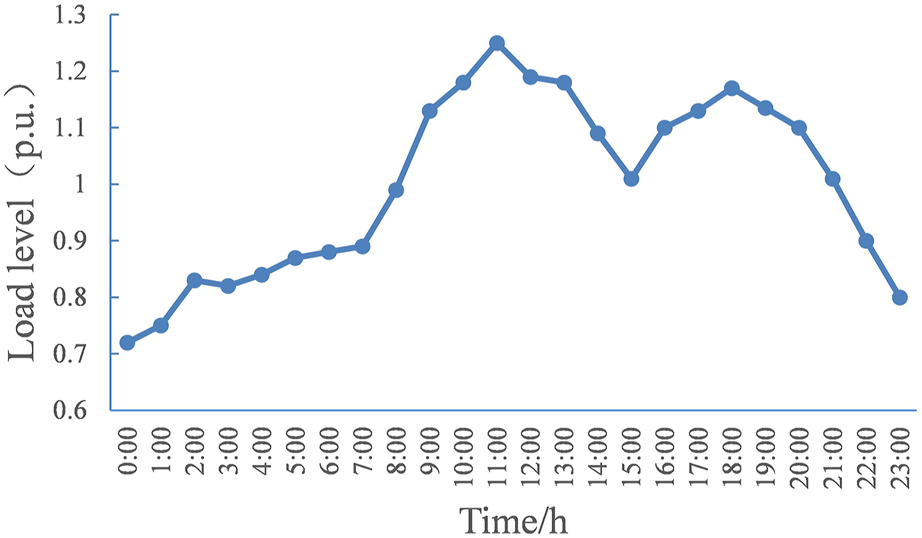
Typical daily load level.
The voltage curves of each node of distribution network under light load, nominal load and heavy load level are shown in Figure 4. As can be seen from Figure 4, the increase of load will lead to more voltage drop of the whole system. Nodes 49 and 50 have the heaviest load, and the nominal loads of both nodes are 384.7 kW and 274.5 kVar, accounting for 1/10 of the total load of the system. Therefore, the node voltage on the branches from these two nodes drops seriously, and the lowest voltage in the whole distribution network appears at the terminal node 65. The other section of voltage drop line is in the branch from nodes 11 and 12 to node 27, because the load of nodes 11 and 12 is also heavy, both of which are 145kW and 104kVar. In addition to the network loss cost, the voltage of some nodes is lower than the lower limit of 0.95, but higher than the critical voltage of 0.8, so there is voltage deviation cost.
FIGURE 4
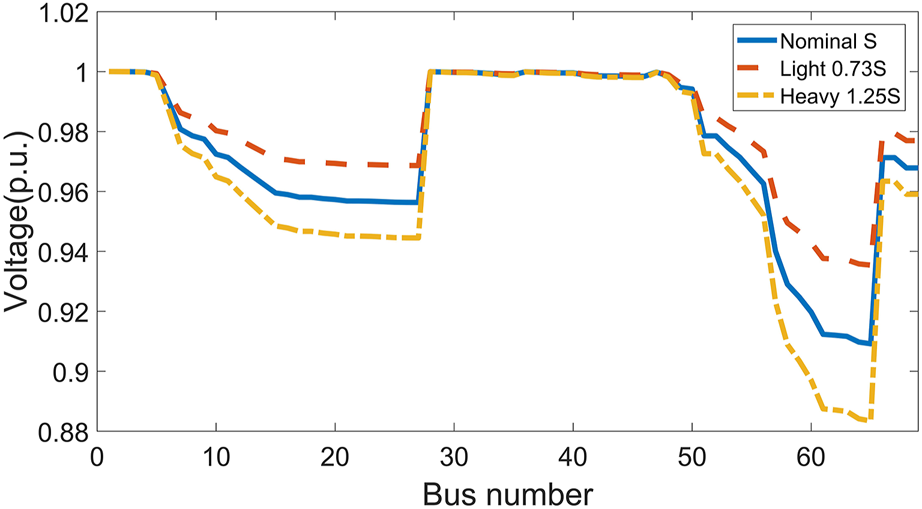
The volume profile of IEEE 69-bus distribution system in scenario 1
Table 1 lists the active and reactive power losses based on the above three load levels and the comprehensive operating costs defined in Eq. 1. The total cost of the whole 24 h is 290,800 yuan. In scenario 1, because reactive power compensation is not used, and are zero. For specific gravity load and nominal load level, it can be seen that in IEEE 69-bus distribution network system, the load will increase by 25%, the network loss will increase by 64%, and the energy consumption cost will increase by 27% because the network loss accounts for a low proportion of the total load. When the load is heavy, the node voltage drops more, and the voltage deviation cost will double by 110%, which will bring a substantial increase in the total cost, increasing by 96%.
TABLE 1
| Load level/p.u | /kW | /kVar | /kW | /kVar | /yuan | /yuan | Total cost/yuan |
|---|---|---|---|---|---|---|---|
| Light load (0.73) | 2775.095 | 1967.058 | 114.26 | 52.03 | 1475.01 | 2303.63 | 3778.65 |
| Nominal load (1) | 3801.5 | 2694.6 | 224.99 | 102.16 | 2053.16 | 9717.68 | 11770.85 |
| Heavy Load (1.25) | 4751.875 | 3368.25 | 369.04 | 167.11 | 2608.13 | 20463.54 | 23071.67 |
Operation cost of distribution network in scenario 1
Scenario 2: Power flow distribution and operating cost after reactive power compensation
In Scenario 2, reactive power compensation equipment is put into use, and particle swarm optimization algorithm based on mixed real number and binary vector is used to solve the optimal state of capacitor switching and transformer tap, so as to minimize the total operating cost. Figure 5A shows the change process of the optimal fitness function. It can be seen that it has converged after five iterations, and the convergence speed is fast. Figure 5B reflects the optimization process of capacitor bank switching at each node in these five iterations, and the transformer tap is adjusted to +1 gear.
FIGURE 5
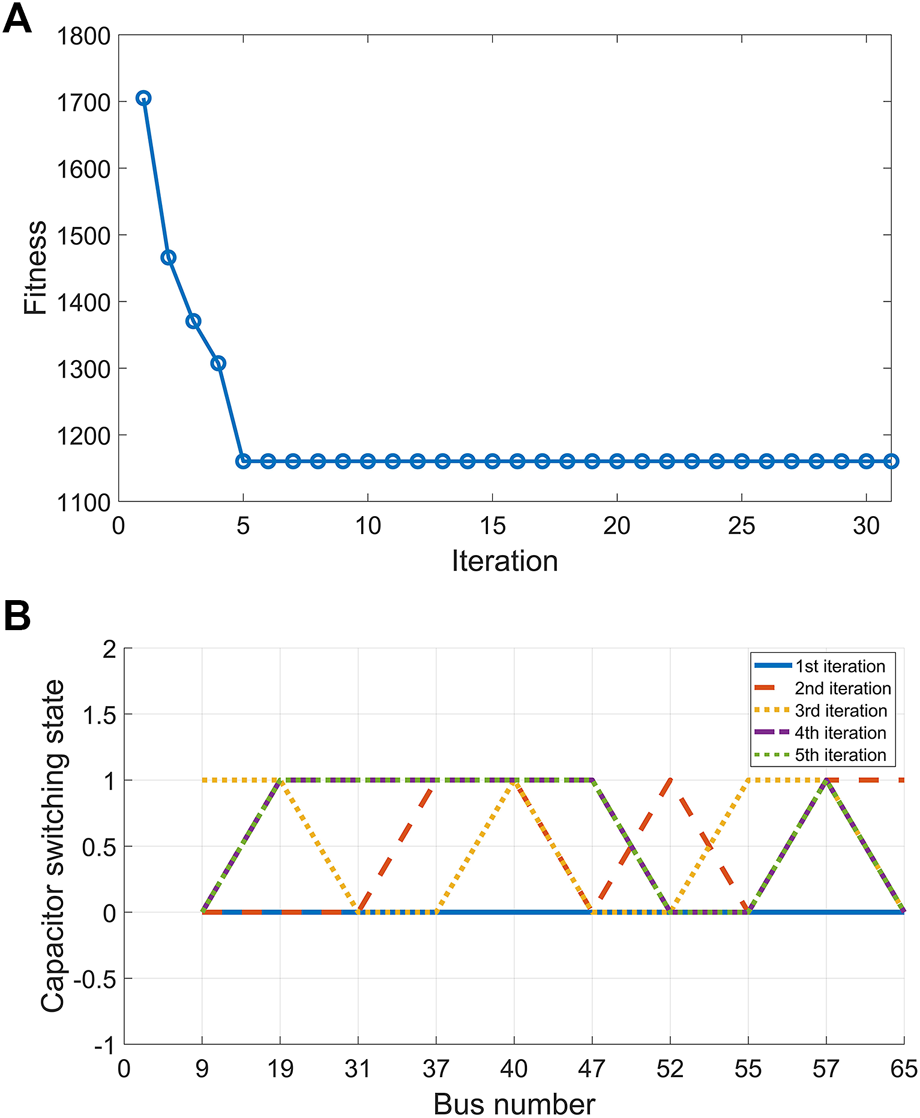
Evolution profile of fitness and switching states of capital banks. (A)Fitness function (B) Optimal process of switching capacitor banks at each node.
In order to prove the effectiveness of the optimization algorithm proposed in this paper, the results of Scenario one and Scenario two under different load levels (light, nominal and heavy) are compared. Figure 6 shows the voltage situation of each node under the optimal capacitor switching and transformer tap adjustment strategy. It can be seen that after the reactive power compensation equipment in Scenario two is put into operation, the voltage of each node is obviously improved compared with that in Scenario one under light, nominal and heavy load levels, and the power quality is improved.
FIGURE 6
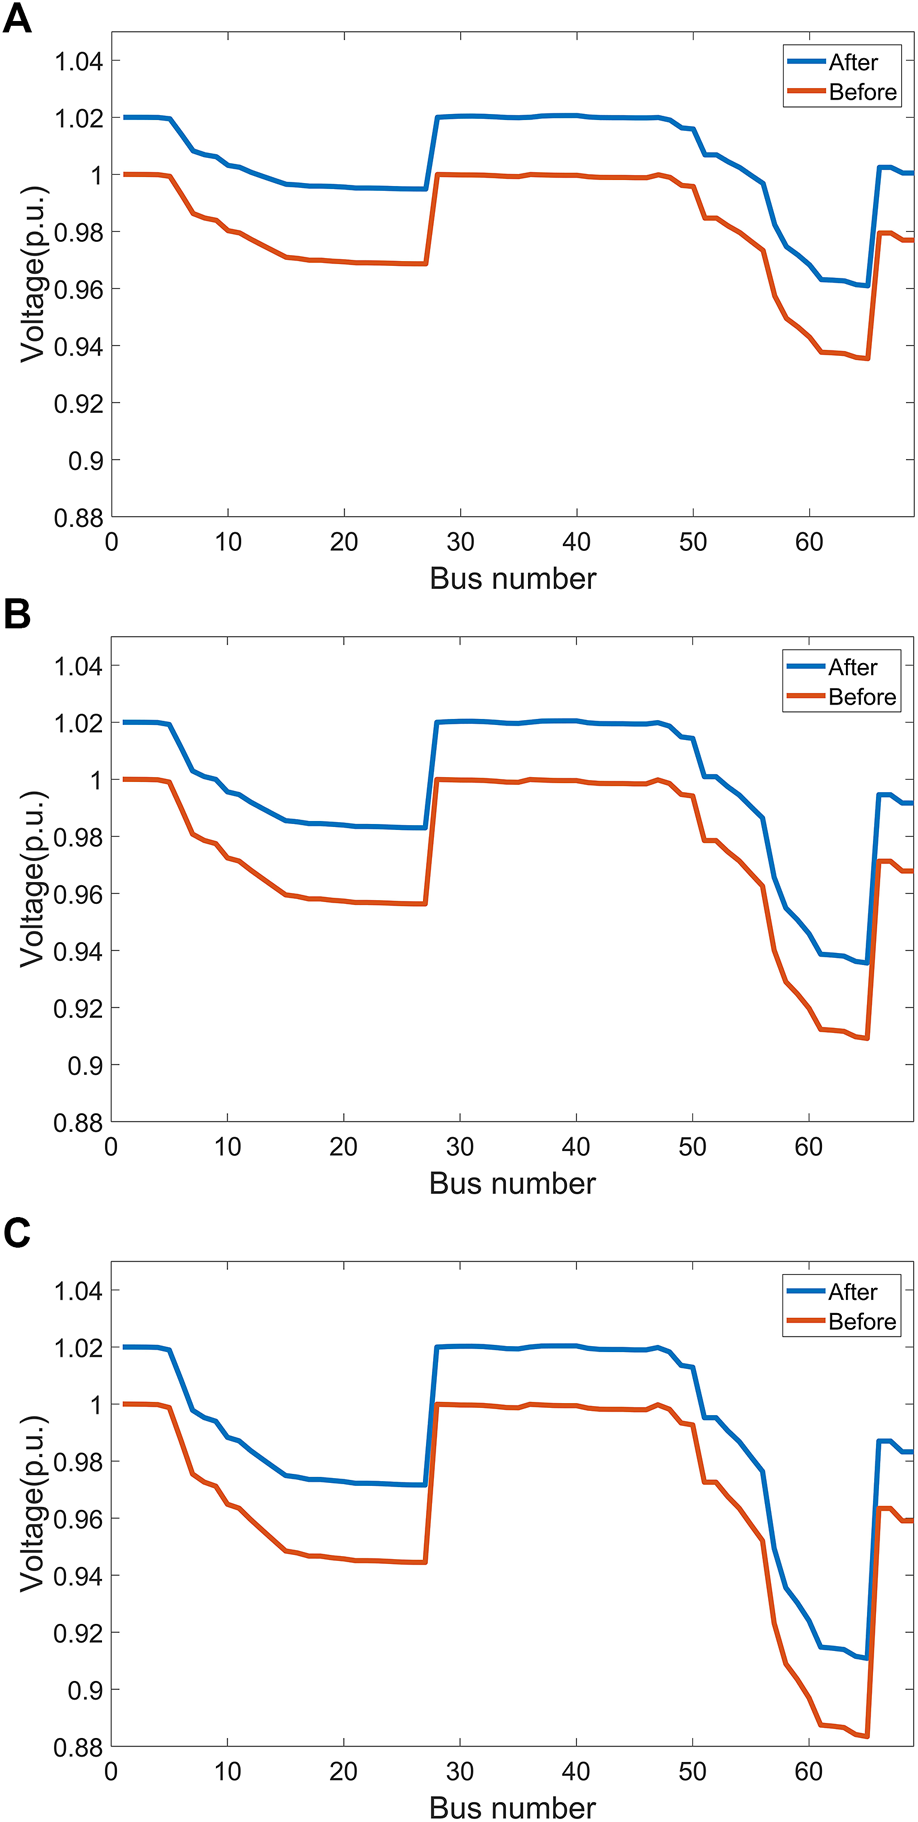
Voltage of each bus based on the optimal capacitor switching and transformer tap adjustment scheme. (A) Fitness function (B) Nominal load 1p. U (C) Heavy load 1.25 p. u.
The total voltage control cost of IEEE 69-bus distribution network system in scenario two is shown in Table 2.represents the energy consumption cost defined in Eq. 1, the voltage deviation cost defined in Eq. 1, and OF is the total operating cost. Comparing Table 1 with Table 2, it can be seen that a large part of the operating cost of Scenario one is related to the cost of voltage deviation, while in Scenario 2, the cost has been significantly reduced due to the improvement of voltage curve, especially in the case of light load, the cost of voltage deviation is zero. Thanks to the reactive power optimization strategy in this paper, the main transformer tap and capacitor act correctly, the total active and reactive power losses of the distribution system are reduced, and the total cost is reduced by more than 50%.
TABLE 2
| Load level/p.u | /kW | /kVar | /kW | /kVar | /yuan | /yuan | Total cost/yuan |
|---|---|---|---|---|---|---|---|
| Light load (0.73) | 2775.10 | 1967.06 | 92.63 | 42.4 | 1475.01 | 0 | 1475.01 |
| Nominal load (1) | 3801.50 | 2694.60 | 187.62 | 85.46 | 2053.16 | 2883.51 | 4936.67 |
| Heavy Load (1.25) | 4751.88 | 3368.25 | 313.39 | 142.23 | 2608.13 | 11323.80 | 13931.93 |
Operation cost of distribution network in scenario 2
Scenario 3: Comparative analysis of high permeability electric vehicles before and after they are connected to the distribution network.
Scenario three analyzes the influence of large-scale EVs on distribution network voltage and energy control before and after being connected to distribution network. There are five large charging parking lots in the distribution network. The location of the nodes, the number of charging piles and the stability limit of the distribution lines from each parking lot to the power system are shown in Table 3. The current carrying capacity of distribution lines determines the maximum number of EVs allowed in fast charging mode, so as to ensure that the line power flow does not exceed the limit. Among them, the thermal stability limit of connecting lines in parking lots 1, two and four is lower.
TABLE 3
| Lot | Bus # | Number of charging stations | Thermal stability limit (kVA) |
|---|---|---|---|
| 1 | 30 | 60 | 1455 |
| 2 | 32 | 100 | 5823 |
| 3 | 45 | 60 | 1455 |
| 4 | 48 | 60 | 1455 |
| 5 | 63 | 100 | 5823 |
Details of parking lot and charging pile in distribution network system.
Assume that the general charging power of each EV is 7 kW and the fast charging power is 70 kW. The connection between EV and power grid and its charging and discharging states are randomly distributed. This paper uses normal probability distribution to evaluate. According to the proposed EV coordinated charge and discharge stack method, orderly queue charge and discharge is carried out to ensure that the line power flow does not exceed the limit. Figure 7 shows the number of EVs occupying charging piles in each parking lot within 24 h. Queue in and out of the stack table according to the process shown in Figure 1, assuming that the remaining power of EVs when they arrive at the parking lot is randomly selected from four values: 10, 20, 30 and 40%. In order to protect the battery, trickle charging will be adopted when charging to 90%. In the fast charging mode, the time from full discharge to full charge of EVs is 2 h, while in the general charging mode, it is 9 h, and it takes about 4 h from full charge to full discharge of batteries to the power grid. In order to simplify the analysis, this paper assumes that the PTD of the EV that wants to use the fast charging mode is 2H, while the PTD of the owner of the EV that wants to use the general charging mode is 9H. During this period, the owner will not pick up the car, and the electric car can be charged or discharged with constant power according to the demand of the power grid.
FIGURE 7
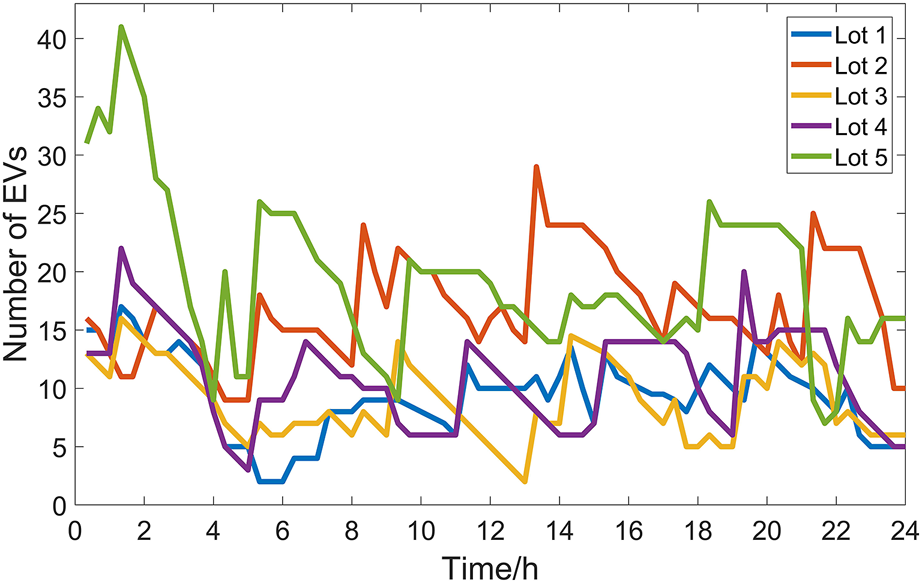
Distribution of the number of electric vehicles in coordinated charging and discharging stacks within 24 h.
After obtaining the information of EVs in each parking lot as shown in Table 3, the EVs are charged and discharged in an orderly and coordinated way, and the particle swarm optimization algorithm based on mixed real numbers and binary vectors is applied to solve the problem, and the best switching strategy of capacitor bank and transformer tap is obtained. Figure 8 is the evolution curve of distribution network operation cost fitness and capacitor bank switching state with high permeability EVs, and the optimal switching strategy is found after six iterations. Because of the high load at this time, the sum of charging and discharging power of EVs reaches 3145.9 MW, and the total active load of the system is equivalent to 182.75% of the original one. In order to maintain the voltage stability, the optimization result is that all capacitor banks are put into operation, and the transformer tap is adjusted to the highest grade of 1.06 p. u.
FIGURE 8
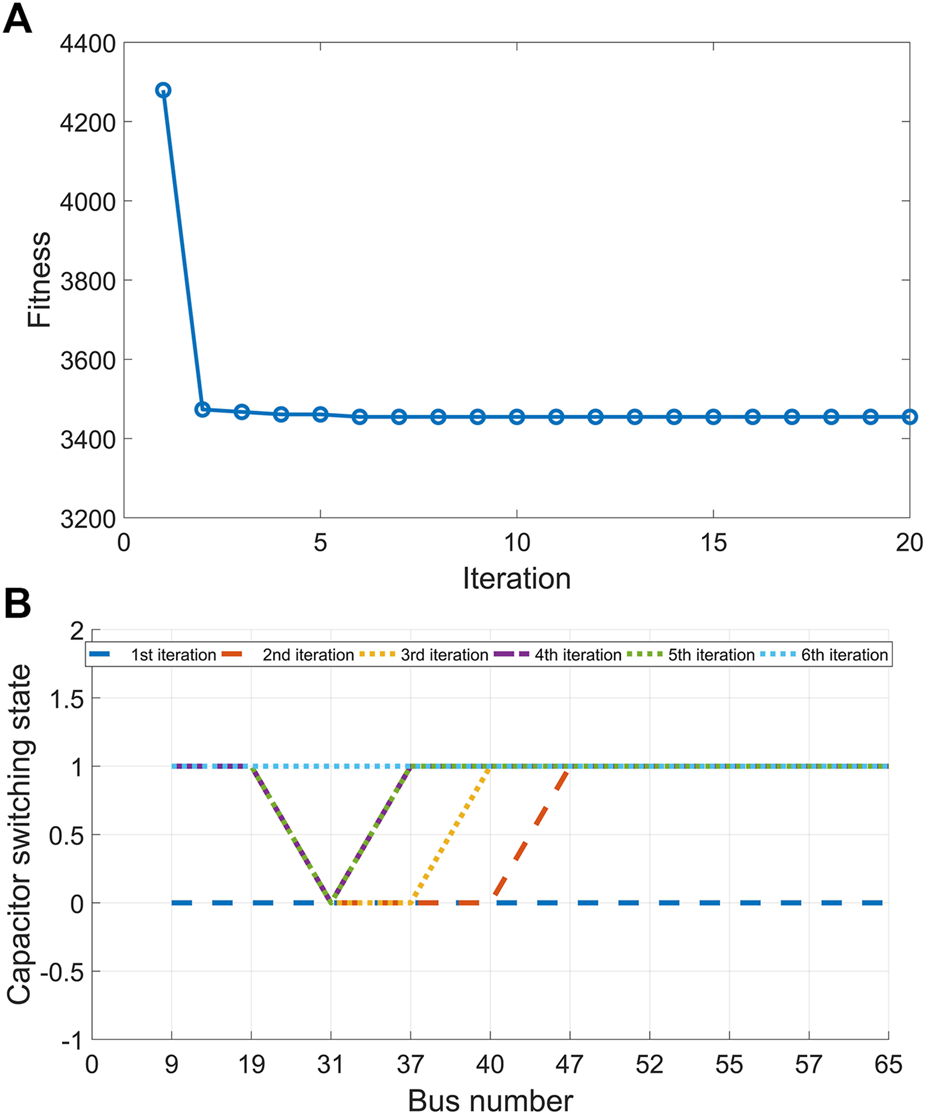
The evolution profiles of fitness and switching state of capital banks. (A) Light load 0.73 p. u. (B) Optimization of Capacitor Bank Switching at Each Node U.
Figure 9 shows the voltage comparison of each node before and after reactive power compensation when the high permeability EV is connected, with light load of 0.73 p. u, nominal load of 1p.u. and heavy load of 1.25 p. u. The three load levels correspond to the loads at 1:00, 15:00 and 11:00 respectively in the typical load curve of Figure 3. The load of EVs is determined by the number of vehicles occupying charging piles and the charging and discharging status in Figure 7.
FIGURE 9
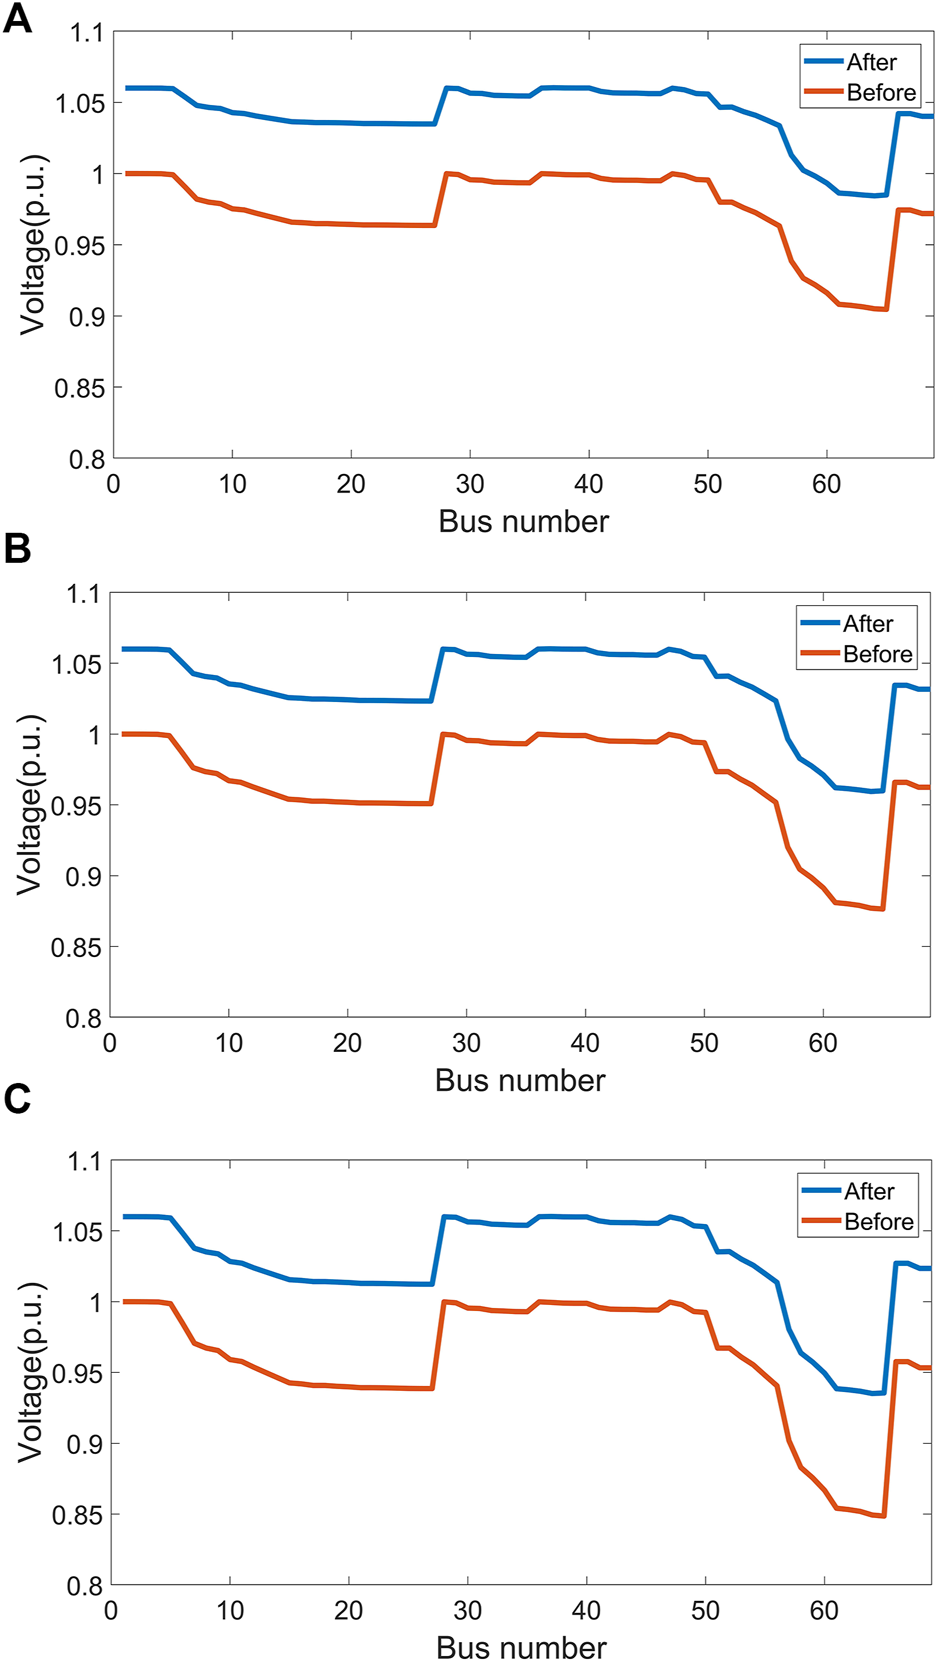
Voltage of each node before and after active power compensation when high-penetration EVs are connected. (A) Light load 0.73 p. u. (B) Nominal load 1p. U. (C) Heavy load 1.25 p. U.
Compared with scenario 2, the voltage drop at all three load levels increases. Take heavy load as an example as shown in Figure 9C. If reactive power compensation equipment is not implemented, the voltage at the lowest point node 65 of distribution network voltage is only 0.83 p. u. In fact, if it is lower than 85% of rated voltage for more than 3 s, it will cause the action of automatic load shedding device according to voltage, thus cutting off a large number of loads. If the duration exceeds 1 h and the voltage deviation fails to recover to less than 10% of the rated voltage, it will meet the general power grid accident identification standard of State Grid Corporation (Anonymous, 2021). After the optimal control proposed in this paper, the voltage of the whole distribution network can be maintained within the normal range of [0.95, 1.06] p. u. .
In the case of high penetration electric vehicle access, the total cost of distribution network operation without control measures is shown in Table 4, and the total cost of distribution network operation based on the control strategy in this paper is shown in Table 5. The table also shows the switching results of optimal main transformer taps and capacitors under different load conditions. In order to compare with the distribution network without large-scale EVs in Table 2, the energy consumption of charging and discharging EVs is not included in Tables 4, 5, but the reactive power exchange and network loss increase caused by large-scale EVs will be included in the total cost.
TABLE 4
| Load level/p.u | /kW | /kVar | /kW | /kVar | /yuan | /yuan | Total cost/yuan |
|---|---|---|---|---|---|---|---|
| Light load (0.73) | 3011.56 | 2075.03 | 235.94 | 108.10 | 2835.56 | 12962.48 | 15798.03 |
| Nominal load (1) | 4195.76 | 2870.75 | 392.90 | 178.39 | 3435.58 | 26091.04 | 29526.62 |
| Heavy Load (1.25) | 5343.46 | 3627.82 | 588.90 | 265.88 | 4015.25 | 43083.26 | 47098.50 |
Energy and voltage control cost for distribution network with high permeability electric vehicle.
TABLE 5
| Load level/p.u | /kW | /kVar | /kW | /kVar | /yuan | /yuan | /yuan | yuan | Total cost/yuan | Number of capacitors put into use CB # | Main Transformer Tap Gear Tap # |
|---|---|---|---|---|---|---|---|---|---|---|---|
| Light load (0.73) | 2947.36 | 947.37 | 174.02 | 80.70 | 2391.89 | 3356.78 | 22.01 | 36.71 | 5807.39 | 8 | 2 |
| Nominal load (1) | 4080.16 | 1699.74 | 281.12 | 128.54 | 2968.17 | 2612.62 | 24.77 | 55.06 | 5660.62 | 9 | 3 |
| Heavy Load (1.25) | 5166.46 | 5664.63 | 417.69 | 189.46 | 3519.55 | 8550.76 | 27.53 | 55.06 | 12152.90 | 10 | 3 |
Energy and voltage control cost of distribution network with high permeability EV based on the control strategy in this paper.
Comparing the baseline load in Table 4 with that in Table 1, although the load of EVs is not included in Table 4, the high permeability EVs still cause the increase of active and reactive power network losses, which leads to the increase of total active load and reactive load of distribution network system compared with Table 1. In terms of cost, the addition of EVs causes a significant increase in voltage drop, which makes the voltage deviation cost double compared with Scenario 1, resulting in a double increase in the total cost of distribution network. Compared with the operation cost of distribution network without reactive power compensation in Tables 4, 5 reflects the fact that after adopting the control strategy proposed in this paper, the network loss will be reduced to a large extent both at the light load level and at the heavy load level, which brings about the reduction of total active/reactive load and the reduction of energy consumption cost. In addition, in combination with Figure 9, it can be seen that the voltage deviation is significantly reduced, which leads to the conclusion that the voltage deviation cost in Table 5 is about 1/6 of that when no control measures are taken, so the total cost is significantly reduced.
The control strategy proposed in this paper can effectively deal with the multi-objective control problem of the lowest power quality and operation cost when a large number of EVs with dynamic random charging and discharging activities are connected to the distribution network. The total cost of distribution network in scenario three of large-scale EVs (Table 5) is at the same level as that in scenario two without EV load (Table 2), which shows that the proposed optimization algorithm can flexibly adjust the switching strategies of transformer taps and capacitor banks to offset the impact of EVs on distribution network and reduce the impact of randomness on distribution network.
Conclusion
This paper presented how to maintain the stability of the system voltage and to minimize the operation cost of the power grid by controlling the switching of capacitors and the adjustment of transformer taps in the distribution network. The core contribution in this paper is to design a voltage and energy control model for a distribution network with high permeability electric vehicles whose random behaviors of fast charging, normal charging and discharging were analyzed, proposing a coordinated charging-discharging stack strategy for EVs, and putting forward an improved mixed real and binary vector swarm optimization algorithm to solve the proplem. Then, the improved swarm optimization algorithm based on mixed real numbers and binary vectors is used to solve the problem, and the best capacitor switching and transformer tap adjustment strategy is found.
The effectiveness of the proposed optimization model and solution algorithm is proved by the analysis of three different scenarios. They were selected for the simulation, including power flow and operating costs under baseline load, power flow and operating cost after reactive power compensation, and comparative analysis of high permeability electric vehicles before and after they are connected to the distribution network. The simulation results demonstrated the effectiveness of the proposed control strategy. The voltage drop of the distribution network caused by the access of a large number of electric vehicles is reliably compensated, and the distribution of active and reactive power also tends to be reasonable. The total operating cost of the distribution system can be effectively reduced. The proposed coordinated charging-discharging stack strategy provided a new way for a large number of electric vehicles to be charged and discharged in an orderly manner.
Statements
Data availability statement
The original contributions presented in the study are included in the article/supplementary material further inquiries can be directed to the corresponding author.
Author contributions
JY and WL analyzed the optimization method, summarized all the data and wrote the paper, WT and WC provided paper ideas. All authors read and approved the final manuscript.
Conflict of interest
The authors declare that the research was conducted in the absence of any commercial or financial relationships that could be construed as a potential conflict of interest.
Publisher’s note
All claims expressed in this article are solely those of the authors and do not necessarily represent those of their affiliated organizations, or those of the publisher, the editors and the reviewers. Any product that may be evaluated in this article, or claim that may be made by its manufacturer, is not guaranteed or endorsed by the publisher.
References
1
Anonymous Author . Rules for safety accident investigation of state grid corporation of China. Bejing: China Electric Power Press, 2021.
2
Brinkel N. B. G. Gerritsma M. K. AlSkaif T. A. Lampropoulos I. van Voorden A. Fidder H. et al (2020). Impact of rapid PV fluctuations on power quality in the low-voltage grid and mitigation strategies using electric vehicles. Int. J. Electr. Power & Energy Syst.118, 105741. 10.1016/j.ijepes.2019.105741
3
Cai Y Jin L Song Y (2015). Voltage control strategy in active distribution network based on model predictive control[J]. Trans. China Electron. Soc.30 (23), 8. 10.19595/j.cnki.1000-6753.tces.2015.23.006
4
Cardona J. E. López J. C. Rider M. J. (2018). Decentralized electric vehicles charging coordination using only local voltage magnitude measurements. Electr. Power Syst. Res.161, 139–151. 10.1016/j.epsr.2018.04.003
5
Chen S Zhang Y Xue G (2015). Microgrid economic dispatch considering interaction with EV BSS[J]. Electr. Power Autom. Equip.35 (4), 60–69. 10.16081/j.issn.1006-6047.2015.04.009
6
Cheng L. Chang Y. Huang R. (2015). Mitigating voltage problem in distribution system with distributed solar generation using electric vehicles. IEEE Trans. Sustain. Energy6 (4), 1475–1484. 10.1109/tste.2015.2444390
7
Datta M. Senjyu T. (2013). Fuzzy control of distributed PV inverters/energy storage systems/electric vehicles for frequency regulation in a large power system. IEEE Trans. Smart Grid4 (1), 479–488. 10.1109/tsg.2012.2237044
8
Fang X Zheng Y Wang H . 2022. Underlying quantification method of distribution network power flow consuming the random and fuzzy characters of source-load[J/OL]. Proc. CSEE1-17. 2022-05-22.
9
Guan L Liu Z He S (2013). Application of BPSO algorithm in model-based fault diagnosis of distribution network[J]. Electr. Power Autom. Equip.33 (9), 89–93. 10.3969/j.issn.1006-6047.2013.09.016
10
Holmquist T. J. Johnson G. R. Cook W. H. (1993). A computational constitutive model for concrete subjected to large strains,hish strain rates, and high pressures[C]. Quebec, Canada: 14th”International Sym-posium on Ballistics, 591–600.
11
Huang N Liu D Cai G (2021). Interval prediction of electric vehicle charging load based on scene generation with multiple correlation days[J]. Proc. CSEE41 (23), 7980–7990. 10.13334/j.0258-8013.pcsee.201906
12
Huang Z. Fang B. Deng J. (2020). Multi-objective optimization strategy for distribution network considering V2G-enabled electric vehicles in building integrated energy system[J]. Prot. Control Mod. Power Syst.5 (1), 1–8. 10.1186/s41601-020-0154-0
13
Jiang J. C. Kazuyoshi Y. Takuo Y. (2008). Identification of dem parameters for rockfall sim ulation analysis. Chin. J. Rock Mech. Eng.27 (12), 2418–2430.
14
Kang K Shi N Wang Y (2021). New decentralized V2G mode of electrical vehicles based on blockchain technology[J]. Electr. Power Autom. Equip.41 (12), 78–86 +114. 10.16081/j.epae.202108018
15
Kim K. Dandurand B. (2022). Scalable branching on dual decomposition of stochastic mixed-integer programming problems. Math. Program. Comput.14 (1), 1–41. 10.1007/s12532-021-00212-y
16
Kisacikoglu M. C. Kesler M. Tolbert L. M. (2015). Single-phase on-board bidirectional PEV charger for V2G reactive power operation. IEEE Trans. Smart Grid6 (2), 767–775. 10.1109/tsg.2014.2360685
17
Leemput N. Geth F. Van Roy J. Olivella-Rosell P. Driesen J. Sumper A. (2015). MV and LV residential grid impact of combined slow and fast charging of electric vehicles. Energies8 (3), 1760–1783. 10.3390/en8031760
18
Li G Dong Y Wen F (2016). Charging and discharging behavior prediction of electric vehicles based on mobile social network platform[J]. Automation Electr. Power Syst.40 (9), 64–70+99. 10.7500/AEPS20150708010
19
Li Z Chen X Yu K (2018). Hybrid particle swarm optimization for distribution network reconfiguration[J]. Proc. CSEE28 (31), 35–41. 10.13334/j.0258-8013.pcsee.2008.31.006
20
Liu J Chen Y Duan C Lin J. Lyu J. (2020). Distributionally robust optimal reactive power dispatch with wasserstein distance in active distribution network. J. Mod. Power Syst. Clean Energy8 (3), 426–436. 10.35833/mpce.2019.000057
21
Liu W Wu Q Wen F (2014). A market mechanism for participation of electric vehicles and disptachable loads in distribution system congestion management[J]. Automation Electr. Power Syst.38 (4), 26–33101. 10.7500/AEPS20131104003
22
Ma Z Duncan S. C. Ian A. H. (2011). Decentralized charging control of large populations of plug-in electric vehicles. IEEE Trans. Control Syst. Technol.21 (1), 67–78. 10.1109/tcst.2011.2174059
23
Melo H. Trovao J. Pereirinha P. G. (2018). A controller bidirectional battle charger for electrical vehicles with vehicle-to-grid capability[J]. IEEE Trans. Virtual Technol.67 (1), 114–123. 10.1109/TVT.2017.2774189
24
Moghaddam Z. Ahmad I. Habibi D. Phung Q. V. (2017). Smart charging strategy for electric vehicle charging stations. IEEE Trans. Transp. Electrific.4 (1), 76–88. 10.1109/tte.2017.2753403
25
Morro-Mello I. Padilha-Feltrin A. Melo J. D. Heymann F. (2021). Spatial connection cost minimization of EV fast charging stations in electric distribution networks using local search and graph theory. Energy235, 121380. 10.1016/j.energy.2021.121380
26
Ruan H Gao H Liu J (2019). A distributed robust reactive power optimization model for active distribution network consuming reactive power support of DG and switch reconfiguration[J]. Proc. Chin. Soc. Electr. Eng.39 (3), 685–695. 10.1016/j.egypro.2019.01.272
27
Su S Hu Y Wang S (2017). Voltage regulation strategy for distribution network based on reactive power compensation of electric vehicles[J]. Automation Electr. Power Syst.41 (10), 72–81. 10.7500/AEPS20160915001
28
Tao Y Cheng X Chen Y (2020). Joint optimization of charging station and energy storage economic capacity based on the effect of alternative energy storage of electrical vehicle[J]. Energy208, 118357. 10.1016/j.energy.2020.118357
29
Vincent D. Huynh P. S. Azeez N. A. Patnaik L. Williamson S. S. (2019). Evolution of hybrid inductive and capacitive AC links for wireless EV charging—a comparative overview. IEEE Trans. Transp. Electrific.5 (4), 1060–1077. 10.1109/tte.2019.2923883
30
Wang M Lin L. V. Xiang Y (2022). Coordinated scheduling strategy of electrical vehicles for peak shaving considering V2G price incentive[J]. Electr. Power Autom. Equip.42 (04), 27–33 +85. 10.16081/j.epae.202201009
31
Wu X Yao L Li H (2010). Study on the parameters of concrete HJC constitutive model. J]-Acta Appl. Mech.11 (02), 340–344. 10.3788/HPLPB20102208.1935
32
Xu X Zhao Y Liu Z (2022). Daily load charactic classification and feature set reconstruction strategy for short-term power load forecasting[J]. Power Syst. Technol.46 (04), 1548–1556. 10.13335/j.1000-3673.pst.2021.0859
33
Yao R. Liu Y. Sun K. Qiu F. Wang J. (2019). Efficient and robust dynamic simulation of power systems with holomorphic embedding. IEEE Trans. Power Syst.35 (2), 938–949. 10.1109/tpwrs.2019.2935040
34
Zeng Z Zhao R Yang H (2012). Responsive schemes to high penetration of electrical vehicles and optimal planning of battle swap stations[J]. Electr. Power Autom. Equip.32 (9), 7–12.
35
Zhang L Sun C Cai G (2022). Two-stage optimization strategy for coordinated charging and discharging of EVs based on PSO algorithm[J]. Proc. CSEE42 (05), 1837–1852. 10.13334/j.0258-8013.pcsee.211150
36
Zhang P Guo J Xu J (2016). Joint planning and site selection of centralized charging station and battery swapping point[J]. Power Syst. Technol.40 (11), 3489–3496. 10.13335/j.1000-3673.pst.2016.11.031
37
Zhao J Wen F Yang A (2021). Impacts of electric vehicles on power systems as well as the associated dispatching and control problem[J]. Automation Electr. Power Syst.35 (14), 2–10 +29.
Summary
Keywords
electric vehicle (EV), charging and discharging, distribution network, reactive power compensation, high-penetration
Citation
Xiaoyan J, Tian W, Can W and Yuli W (2022) A novel optimization method for high-penetration electric vehicles integration to electrical distribution network. Front. Energy Res. 10:1012192. doi: 10.3389/fenrg.2022.1012192
Received
05 August 2022
Accepted
05 September 2022
Published
23 September 2022
Volume
10 - 2022
Edited by
Rabeh Abbassi, University of Hail, Saudi Arabia
Reviewed by
Nikolaos Manousakis, University of West Attica, Greece
Puja Dash, Gayatri Vidya Parishad College of Engineering, India
Updates
Copyright
© 2022 Xiaoyan, Tian, Can and Yuli.
This is an open-access article distributed under the terms of the Creative Commons Attribution License (CC BY). The use, distribution or reproduction in other forums is permitted, provided the original author(s) and the copyright owner(s) are credited and that the original publication in this journal is cited, in accordance with accepted academic practice. No use, distribution or reproduction is permitted which does not comply with these terms.
*Correspondence: Wu Tian, wutian@ctgu.edu.cn
This article was submitted to Process and Energy Systems Engineering, a section of the journal Frontiers in Energy Research
Disclaimer
All claims expressed in this article are solely those of the authors and do not necessarily represent those of their affiliated organizations, or those of the publisher, the editors and the reviewers. Any product that may be evaluated in this article or claim that may be made by its manufacturer is not guaranteed or endorsed by the publisher.