 Yu Ding
 Sarah Barber
 Florian Hammer
- 1Wm Michael Barnes ‘64 Department of Industrial and Systems Engineering, Texas A&M University, College Station, TX, United States
- 2IET Institute for Energy Technology, Eastern Switzerland University of Applied Sciences, Rapperswil, Switzerland
Quantifying a wind turbine’s holistic, system-level power production efficiency in its commercial operating condition is one of the keys to reducing the levelized cost for energy of wind energy and thus contributing significantly to the Sustainable Development Goal 7.2: “By 2030, increase substantially the share of renewable energy in the global energy mix.” It is so important because designers and operators need an effective baseline quantification in order to be able to identify best practices or make operation and maintenance decisions that produce actual improvements. However, this task is highly challenging due to the stochastic nature of the wind and the complexity of wind turbine systems. It is imperative to carry out accurate, trust-worthy performance assessment and uncertainty quantification of wind turbine generators. This article provides a concise overview of the existing schools of thought in terms of wind turbine performance assessment and highlights a few important technical considerations for future research pursuit.
1 Introduction
Wind energy is one of the fastest-growing clean energy sources and plays a significant role in reducing global carbon emissions and combating climate change (GWEC, 2022). But in order to help the global community achieve carbon net zero, the global wind power growth needs to be doubled now, or to be tripled after 2030 if on the current trajectory (GWEC, 2021). Further reducing the cost is still of paramount importance. Improving turbine performance and efficiency of existing turbine fleets is one way to do this. Even a one percent net increase in the annual energy production (AEP) translates to over one billion euro extra revenue (assuming five euro cents per kilowatt-hour and on average one megawatt power capacity per turbine).
One fundamental issue for any performance improvement is the need for an accurate performance assessment method that quantifies uncertainty and can work with a sufficient degree of robustness in the actual operating environments of commercial-sized wind turbines. While it is highly important to develop new technologies for better designs/configurations/controls or materials/manufacturing of wind turbine blades and drive trains, an equally critical question is how one can be certain that a newly proposed technology could deliver the proposed/promised improvement in energy capture in a real-world, commercial operation environment, measured in terms of the percentage change in AEP. To the authors’ knowledge, this problem is unfortunately still unsettled.
When a new design, a new manufacturing technology, or a retrofit, is proposed, it will understandably go through theoretical or modeling justification and laboratory experimental tests. But the lab tests can only be conducted on small turbines, due to the limitation in the size of a wind tunnel, which is generally one order of magnitude smaller than the rotor diameter of the commercial turbines. When the same technology is applied to the actual commercial turbines, the sheer size of the turbines make a controlled experiment impractical. By “controlled” we mean that the wind and environmental conditions are controlled to the level like they are controlled in a wind tunnel.
The uncontrolled, stochastic wind input to a turbine causes a huge problem when it comes to accurately assessing and quantifying the change in AEP for commercially operated turbines, something wind owners/operators ultimately care about. The small-scaled lab test does not extrapolate well, and there are historical instances that earlier estimates missed by a large margin (Øye, 1995; Ding et al., 2015; Lee et al., 2020). This is due to challenges with up-scaling, such as the effect of Reynolds number and rotational speed on performance as well as the changing stress-to-weight ratio. Partially due to the lack of a credible and universally agreed-upon verification method, the wind industry is currently flooded by a large number of service options, turbine redesigns, and control logic upgrades, all of which promise to improve the efficiency of wind energy capture but nobody knows for sure whether the promise can be delivered and how much is to be delivered. It is long overdue to settle on this crucial, yet somewhat overlooked, question. This is precisely what we would like to share our thoughts on.
To summarize the settings under which we consider the question of turbine performance assessment, we would like to articulate the following characteristics:
• The turbines are operated in their commercial operating environments.
• The performance of concern is the system-level, holistic power production performance of the entire wind turbine generators, not that of any turbine components or subsystems. This is the primary concern of operators, although it should be noted that the performance of the entire wind farm is becoming more interesting (as discussed further in Section 4).
• The change in turbine performance is quantified by the change in its AEP.
• The data used to assess and quantify such change should be readily available in the commercial operations of the turbines, and therefore, by and large, should be limited to the use of SCADA data and the wind farm environmental measurements.
Apparently our focus in this perspective article is on performance assessment and quantification. Whilst we recognize that a review of the literature on performance improving strategies, such as retrofit devices, yaw error analysis, and pitch system health monitoring, would be beneficial to the community, this is beyond the scope of the current paper.
The rest of the paper unfolds as follows. Section 2 presents a number of existing turbine performance quantification methods or metrics. Section 3 shares our thoughts on important considerations and technical needs for fulfilling such performance quantification objective. Section 4 summarizes our discussions and makes a few concluding remarks.
2 Existing turbine performance assessment methods
We review several schools of thought concerning turbine performance assessment. We note that there have been some earlier discussions along this line; for instance, Niu et al. (2018). Our review here captures some of the new development emerging in the more recent years.
2.1 Power coefficient
The physical law behind wind power production is expressed as (Ackermann, 2005)
where y denotes the turbine power output, ρ denotes the air density, A denotes the swept area of the rotor, V is the wind speed, and Cp is the power coefficient. Given the turbine design (so that we know A) and the field measurements of y, ρ, and V, one can compute the power coefficient as
The power coefficient is commonly used as a performance metric for wind turbines (Kjellin et al., 2011; Xia et al., 2013). There are variants of power coefficient-based performance comparison methods. For example, Mathew et al. (2022) introduce an efficiency index based on the power coefficient model, in which they employ a deep neural network model and Shapley Additive explanations (Lundberg and Lee, 2017) for evaluating the long-term turbine performance degradation.
Please note that the power coefficient is not a constant, but rather a function of air density, blade pitch angle and tip speed ratio (which is the ratio between the tangential speed of the tip of a blade and the wind speed), and is often depicted as a functional curve against the tip speed ratio; for an example, please take a look at Figure 1C of Hwangbo et al. (2017b). Considering the difficulty in comparing two power coefficient curves, people would use the peak power coefficient, which is the highest value on a power coefficient curve, when they use power coefficients for performance comparison. Naturally, the higher the peak power coefficient, the better efficiency a turbine is supposed to be.
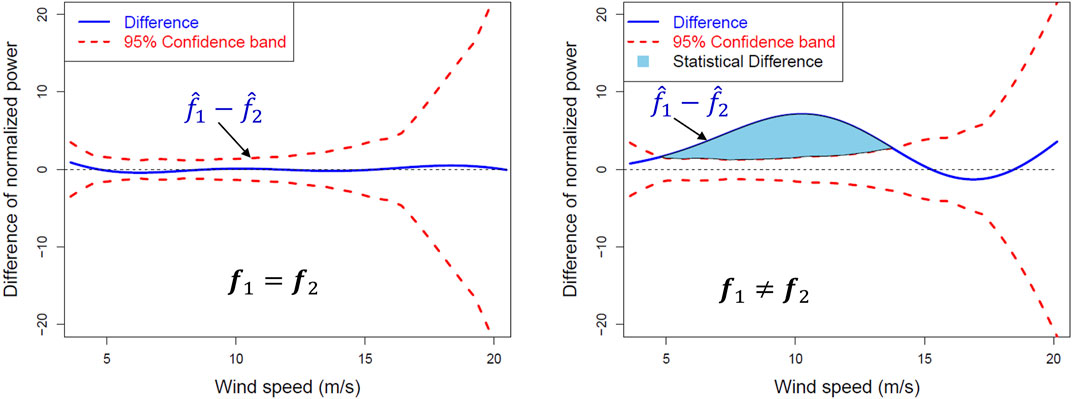
FIGURE 1. Power functional curve comparison and uncertainty quantification.
2.2 Productive efficiency metric
Hwangbo et al. (2017b) noted the limitation in the use of peak power coefficient, especially that it is more sensitive to changes in the wind speed range of 7.5–8.5 m/s but may miss out the changes taking place outside that range, even if a change is still important, say, around the rated wind speed. Hwangbo et al. (2017b) invoke the theory of production economics and impose a shape constraint on the power curve of a turbine. The shape constraint says that the power curve should start as a convex curve, followed by a concave curve. The two curves are connected by an inflection point. Hwangbo et al. (2017b) present the production economics model as
where f(V) is the shape-constrained power curve, representing the performance frontier of a class of turbines, u(V) is the systematic under-performance, μ(V) is the non-negative average of u(V), ϵ is a zero-mean random noise. By subtracting μ(V) from f(V), g(V) is the average power curve, or the power curve of the typical sense but with the convexity/concavity shape constrains imposed, and e is a redefinition of the error with a zero mean.
Hwangbo et al. (2017b) present a procedure to estimate both the shape-constrained average power curve, g(V), and the systematic under-performance. Then, they define a new productive efficiency metric as
where Vci and Vco are the cut-in and cut-out wind speed, respectively. The above-defined productive efficiency metric, θ, is in the range of 0 and 1. When there is no systematic under-performance, namely μ(V) = 0, then g(V) = f(V) and thus θ = 1; otherwise θ is smaller than 1.
Through analysis of both onshore and offshore turbine data, Hwangbo et al. (2017b) concluded that their newly defined productive efficiency metric has a fairly obvious positive correlation with the power coefficient. The empirical analysis yields a correlation of 0.70 between the power coefficient and the productive efficiency, which suggests that the productive efficiency measures a turbine’s performance on a broad common ground with the power coefficient. But Hwangbo et al. (2017b) also noted that the productive efficiency has a better sensitivity in measuring a turbine’s performance change than the peak power coefficient, because the productive efficiency integrates over the entire valid wind spectrum, from the cut-in wind speed to the cut-out wind speed. The peak power coefficient, on the other hand, is sensitive to a much narrower range of wind speed where the peak value of power coefficient falls.
2.3 Nonparametric power curve comparison and quantification
The productive efficiency metric is based on shape-constrained power curves. There are other power curve-based performance comparison methods that do not require the power curve to satisfy any shape constraints (Astolfi et al., 2022a,b; Lee et al., 2015b). Astolfi et al. (2022a,b) use the method of bins and a polynomial regression applied to operation curves, whereas (Lee et al., 2015b) propose a method known as the Kernel PLUS. More recently, Prakash et al. (2022a) develop another method, funGP—the acronym stands for functional Gaussian Process. Unlike the previous methods that ultimately reduce the turbine performance assessment into scalar values and then compare them, funGP takes advantage of comparing two power curves without reducing them into scalar values first. One of the benefits is to identify the regions of difference between two power curves, which provides better understanding on 1) whether the difference is in the critical region affecting power production and 2) what might cause the difference between the power curves, facilitating root cause identification. Other than identifying the regions of difference, Prakash et al. (2022a) also provide uncertainty quantification for the power curve comparison. The uncertainty quantification comes in the form of a (1 − α) × 100% confidence band around the difference curve. The value outside the confidence band is considered statistically significant at the confidence level of (1 − α) × 100%, whereas the value within the band is deemed random fluctuation.
An example is presented in Figure 1, where α = 0.05, meaning the confidence is at the level of 95%. The solid-line curve is the difference curve, i.e.,
Prakash et al. (2022a) further quantify the difference between the two power curves. Provided the confidence band established for the difference curve, they define two metrics—one is the absolute difference between the two curves, namely the area under the difference curve summed over the entire wind speed spectrum, and the second is the statistical difference, which is the area corresponding to the blue shade in the right plot of Figure 1. Prakash et al. (2022a) suggest using the statistical difference for decision making, as it is more robust and less prone to random fluctuation.
Prakash et al. (2022a) applied the function curve comparison to the data used in Hwangbo et al. (2017b) and conducted the same analysis for the four turbines over six year-by-year comparisons. The total number of turbine-year combinations is 24. Among the 24 comparisons, Prakash et al. (2022a) found they agree with those of Hwangbo et al. (2017b) in 23 cases but differ in one case. When looking closer at the one case showing the difference, Prakash et al. (2022a) concluded that funGP-based comparison is more sensitive to the difference between the two power curves.
2.4 Side-by-side comparison
The aforementioned methods make use of either the power coefficient curve or the power production curve. Mindful of modeling uncertainty, especially in the early time when the power curve model was less capable and entailed higher uncertainty, there were parallel efforts looking for a model-free approach to compare the performance of turbines. The basic idea is generally referred to as side-by-side comparison (Albers, 2004; Antoniou et al., 2012), in which a pair of turbines standing side by side in physical vicinity are compared with one another. This is especially so in the context of conforming and quantifying the performance change of a turbine after certain technical upgrade or retrofit has been undertaken on a turbine. The turbine that underwent the change/upgrade is referred to as the test turbine or upgrade turbine, whereas the turbine nearby without any change is referred to as the control turbine. As commented in Lee et al. (2015b), “the difference in power between two side-by-side turbines is measured in a timeline including data before and after the upgrade. The correlation of the wind power generated by the side-by-side turbines may remove the uncertainty of environmental measurements, leaving only the effect resulting from the turbine upgrade.” The side-by-side comparison has to involve two turbines that are of the same make, same model, on the same terrain, serving at the same time, and presumably deteriorating in the comparable fashion. Please also note that the side-by-side comparison in and by itself does not provide a turbine performance metric like the above-reviewed three metrics, but rather provide a difference between the two turbines.
While the idea sounds simple and straightforward, the successful implementation of the side-by-side comparison is not necessarily easy. Section 2 of Hwangbo et al. (2017a) presents one of the most sophisticated side-by-side comparison algorithms, referred to as power-by-power method, and developed by Smart Blade, a German company specializing in vortex generator installation. The Smart Blade procedure does not use any power curve models but it entails a five-step procedure with various actions nested in several of the steps. All those actions were designed to carefully control for the environmental conditions. Even after going through this involved procedure, the power-by-power method is only able to detect small to moderate changes in a turbine when a high-frequency data is used. The high-frequency data ranges from 0.13 ∼ 1 Hz, providing 80 to 600 times more data than the standard 10-minute SCADA data. When applying to the SCADA data, the power-by-power method appears to be much less effective. Astolfi et al. (2019a,b, 2020) improve upon the power-by-power idea via automatic features selection and use it for assessing a small energy gain observed through SCADA data or the impact of systematic yaw error correction.
3 Important considerations and technical needs
In this section, we would like to highlight a few important technical issues in turbine performance assessment.
3.1 The need for better power curves
Among the performance assessment and comparison methods, several of them make use of a turbine’s power curve, such as the productive efficiency, Kernel PLUS, and funGP. The power coefficient method does not directly use a power curve. But it is nonetheless closely correlated with the power curve-based metrics, according to the empirical study conducted by Niu et al. (2018). It is thus fair to say that power curve modeling plays a crucial role in turbine performance analysis.
The early power curve model follows the recommendation of IEC-12 standard [International Electrotechnical Commission (IEC), 2005] and is nicknamed the binning method, as it bins the wind speed and wind power data before forming the power curve. The effort of building multi-dimensional power curve started at least a decade ago when researchers and practitioners realize that the binning power curve does not account for many environmental measurements adequately (Albers et al., 2007; Antoniou et al., 2009; Wagner et al., 2010). The Power Curve Working Group (PCWG), an industry-led consortium, was formed around 2012 and released a study report 8 years later (Lee et al., 2020). There were parallel developments outside PCWG; for instance, the kernel method proposed by Bessa et al. (2012), which took three important inputs when building a power curve model. Later Lee et al. (2015a) extended the capability of Bessa et al. (2012), proposing an additive-multiplicative kernel (AMK) model, capable of taking in as many inputs as possible. AMK became the foundation enabling the Kernel PLUS comparison in Lee et al. (2015b). Various more machine learning methods were attempted to build the power curve using a turbine’s operational data, including trees (Barber and Nordborg, 2020; Lee et al., 2015a, CART or BART), support vector machine (Pandit and Kolios, 2020; Astolfi et al., 2021, SVM), k-nearest neighborhood (Yesilbudak et al., 2013, kNN), gradient boost (Barber et al., 2022b), smoothing spline (Ding, 2019, SSANOVA), deep neural network (Karami et al., 2021, DNN), Gaussian process (Pandit et al., 2020; Pandit et al., 2022; Prakash et al., 2022b) and ensembles of multivariate polynomial regressions (Cascianelli et al., 2021). Chapter 5 of Ding (2019) provides an in-depth discussion of research challenges and data science solution techniques in modeling wind turbine power curves and Barber et al. (2022b) provides a comparison among four machine learning methods (kNN, random forest, gradient boost, and ANN).
In modeling the power curves, one particular issue, as encountered in applying the production economics theory, is to estimate the shape-constrained power curve (Ding, 2019, Chapter 6) or sign-constrained power curve (Hwangbo et al., 2018). Another issue, addressed through a more recent development, is to remove the temporal overfitting while building a power curve. The tempGP method (Prakash et al., 2022b) was able to accomplish this, giving it a considerable boost in terms of model accuracy. Using Dataset# 5 (DSWE-Datasets, 2019) associated with Ding (2019), which houses four onshore turbine datasets and two offshore datasets, we ran a quick numerical comparison of the various power curve methods so far discussed; see Table 1. The last row presents the RSME ratio relative to that of the tempGP, calculated using the average RMSE. A ratio of 1.81, in the column of binning, means that the binning method has an average RMSE 81% higher than that of tempGP. The results in Table 1 showcase an impressive progress made by the research community over the past decade in building more accurate power curves. We believe that the progress is still being made and additional improvement can again be anticipated.
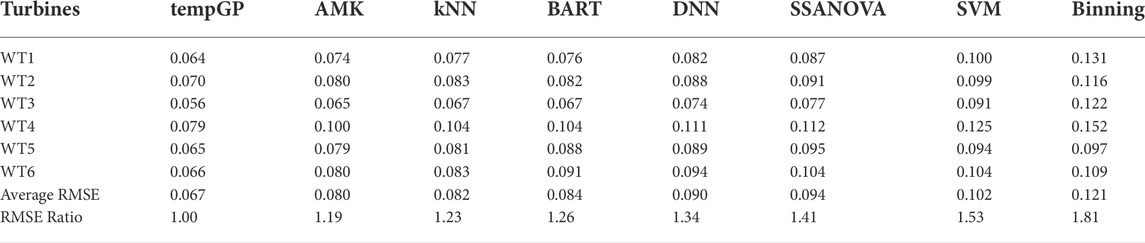
TABLE 1. Comparing various data science-based power curve methods. Reported below are the RMSE values based on a randomized five-fold cross validation. The results of AMK, KNN, BART, SSANOVA, and binning are taken directly from Table 5.7 of Ding (2019); the results of tempGP and SVM are obtained using the DSWE R package (Kumar et al., 2020); and DNN is obtained using the DSWE Python package (Kumar et al., 2022).
Due to the complex nature of the atmospheric boundary layer and the many variables influencing the power output of wind turbine generators another important distinction between power curve models has to be made, namely the distinction between deterministic and probabilistic models. Here by “deterministic,” we mean that the model only provides a point estimate, whereas by “probabilistic,” the model provides the full distribution information of the estimate or prediction. Many of the machine learning methods, such as k-nearest neighborhood, trees and random forests, are deterministic and hence no information about model uncertainty is available (Gonzalez et al., 2019). A common practice is the assumption of a normal distribution for the uncertainty. However, Gonzalez et al. (2019) have shown that model errors are heteroskedastic and concluded that probabilistic models, such as Gaussian processes (Prakash et al., 2022a; Pandit et al., 2020; Pandit et al., 2022) and AMK (Lee et al., 2015a), are more suitable in identifying the normal bounds of turbine performance, allowing for uncertainty quantification for power curve comparisons.
3.2 Causal inference to control for environments
One branch of statistical machine learning, known as causal inference (Pearl, 2009; Imbens and Rubin, 2015), finds its relevance in wind turbine performance assessment. Causal inference handles comparison data coming from the so-called natural experiments, referring to the situations under which one cannot control but can observe. Natural experiments are very relevant in social sciences—unlike in medical clinical trials, many policy actions cannot be tested in large scale using controlled and randomized experiments. In an uncontrolled environment, the observed outputs are affected by many confounding factors, and researchers want to know which portion of the observed outcome is caused by the policy action itself and which is caused by the confounding factors. In the problem of turbine performance assessment and quantification, causal inference finds great relevance. At least up to now, it is impractical, to the degree of being infeasible, to conduct controlled experiments on commercial turbines with accurate enough estimates of how much more energy (as compared to the current baseline) a new energy capture technology can generate. Nonetheless, likely due to the discipline barriers, the application of causal inference to wind energy is rare.
One of the first work was done by Shin et al. (2018), who applied one of the classical causal inference methods, the covariate matching (Rubin, 1973), to the wind turbine performance problem. The idea is in fact simple—one needs to carefully select data points for making the environmental conditions probabilistically comparable before and after a technical action, so much so that the treatment effect, e.g., the actual benefit of having vortex generators installed or leading edges protected, can be discerned with a high degree of confidence. Of course, this is just a starting effort; many more challenges need to be addressed in future efforts.
The causal inference method should be used together with the power curve model. The power curve model answers the question which input variables should be used and how they should be quantitatively connected with the power output. The causal inference method answers the question of which subset of data should be used in performance comparison. Once the first two steps are completed, the funGP method (Prakash et al., 2022a) can be used to conduct the functional curve comparison and quantify the uncertainty in performance differences through building a (1 − α)100% confidence band. Ding et al. (2021) formally propose these three steps in forming a complete pipeline for turbine performance analysis and demonstrate that the benefit in so doing is to control for the effect of environmental variables as much as possible, so that the estimated treatment effect can be attributed to the innate turbine performance change with a high confidence. This three-step performance assessment method is implemented in both R (Kumar et al., 2020) and Python (Kumar et al., 2022) and ready to use. A subsequent cross-validation (Latiffianti et al., 2022) with detailed energy and power decomposition confirms the robustness and accuracy of this three-step method.
3.3 The potential of additional field measurements
Instead of just using the SCADA data, measurements on operating wind turbines (“field measurements”) can be used to enhance data-driven wind turbine performance assessment.
On one hand, the wind speed measurement can be improved by using remote sensing technology such as lidars. The wind speed and direction measurements from the SCADA data are affected by the rotor, usually by an unknown amount, and are sometimes already corrected by the wind turbine manufacturer using a factor that might not be known to the owner/operator, or that might change with software updates. This is therefore a large uncertainty source in performance assessment. Independent lidar measurements can increase the accuracy of the measured power curve. Recent studies showed that nacelle-mounted lidars can provide a reasonable wind speed estimate and similar power curve results to sonic anemometer measurements, although the measurements had a higher scatter (Özinan et al., 2022). A further study presents a filtering method based on modelling the radial speed contribution generated by the wind turbine blades to enhance the data reliability of wind-turbine-mounted continuous-wave doppler lidars (Angelou and Sjöholm, 2022).
The wind speed can also be inferred using measurements on the blades or from the rotor response, although this is a difficult task and still a research topic. For example, the Blade Vision product from SBB Wind Systems claims to infer the inflow using cameras inside the blades, but published studies related to this are not conclusive (Deepalakshmi et al., 2017; Montano et al., 2018). In Bertelè et al. (2018), a linear implicit model is developed that relates the wind shear and misalignment angles to the 1P harmonics of pitch angles and blade loads.
On the other hand, local blade measurements can help quantify the aerodynamic performance of different blade sections. The measurements can be aggregated to calculate the power performance, but also to help understand—and therefore improve—aerodynamic performance. Aerodynamic measurements have been carried out on operating wind turbines within research projects, e.g., Schepers and Schreck (2019), Troldborg et al. (2013), Wu et al. (2019), Medina et al. (2011), and Madsen et al. (2016), but these are all very expensive and time-consuming, and therefore not applicable for industrial use. However, recent initiatives are attempting to do this in an easier and cheaper manner, e.g., Barber et al. (2022a), Duthé et al. (2021), and Fischer et al. (2021).
4 Concluding remarks
Accurate and trust-worthy turbine performance assessment methods have high impact and could fundamentally change the landscape of how a new turbine retrofit or upgrade option is evaluated. Innovations and progress in this regard have the potential to change the international standards for performance assessment and could save the wind industry the agony of not knowing how to choose which new technologies from the many options nowadays available on the market. A consensus converging towards the most capable performance assessment and evaluation tools could weed out those technologies that do not really work, while promoting those that actually work, so as to advance wind energy’s efficiency and market competitiveness. In order to do this, we recommend an industry-wide benchmarking effort that allows different tools to be compared and evaluated in a fair way.
Recall the remark in Section 1 about the increasing interest on the performance of the entire wind farm. The research done for quantifying the performance of individual turbines lays the foundation for wind farm-level performance assessment. Additional complexities arise at the wind farm level. Turbines situated in wind farms influence each other, referred to as interaction losses. This interaction effect complicates the modeling of power curves and hence the performance analysis. To account for this a more wind farm centric approach by means of spatio-temporal models can be taken (You et al., 2017; Hwangbo et al., 2018; Yan et al., 2019; Ding et al., 2021). A very recent development is the use of graph neural networks (GNN), where turbines in a wind farm are seen as nodes and connected through edges. With such models the influence between neighboring turbines is described by weighting factors of edges that are learned within the GNN. The resulting GNN model can than predict the power output for each individual turbine within a wind farm (Park and Park, 2019; Bleeg, 2020; Bentsen et al., 2022).
In terms of field measurement capability and new sensor technology, one of the current hurdles is the expense and reliability of adding additional sensors to the wind turbine devices. In the future, especially with the increasing uptake of digital solutions in the wind energy sector in the digital era (Clifton et al., 2022), such methods are expected to become cheaper and more efficient, and have the potential to greatly enhance wind turbine performance assessment.
Data availability statement
Publicly available datasets were analyzed in this study. This data can be found here: DSWE Dataset#5, https://aml.engr.tamu.edu/book-dswe/dswe-datasets/.
Author contributions
All authors listed have made a substantial, direct, and intellectual contribution to the work and approved it for publication.
Funding
YD research is partially supported by NSF grants IIS-1741173l and CCF-1934904. The contributions of SB and FH were kindly supported by the Swiss Federal Office of Energy through grant SI/502329-01.
Conflict of interest
The authors declare that the research was conducted in the absence of any commercial or financial relationships that could be construed as a potential conflict of interest.
Publisher’s note
All claims expressed in this article are solely those of the authors and do not necessarily represent those of their affiliated organizations, or those of the publisher, the editors and the reviewers. Any product that may be evaluated in this article, or claim that may be made by its manufacturer, is not guaranteed or endorsed by the publisher.
References
Albers, A., Jakobi, T., Rohden, R., and Stoltenjohannes, J. (2007). “Influence of meteorological variables on measured wind turbine power curves,” in Proceedings of the European Wind Energy Conference and Exhibition (EWEC 2007), Milan, Italy, 5 January 2007 (European Wind Energy).
Albers, A. (2004). “Relative and integral wind turbine power performance evaluation,” in Proceedings of the 2012 European Wind Energy Conference & Exhibition (EWEC 2012), London, UK, 9 January 2012 (European Wind Energy).
Angelou, N., and Sjöholm, M. (2022). Data reliability enhancement for wind-turbine-mounted lidars. Remote Sens. 14, 3225. doi:10.3390/rs14133225
Antoniou, I., Downey, R., Paulsen, H., Enevoldsen, P., Piperas, A., and Jensen, L. (2012). “Improved power performance of upgraded turbine rotors: A full scale verification study (a poster presentation),” in Proceedings of the 2012 European Wind Energy Conference & Exhibition (EWEC 2012), Copenhagen, Denmark, 13 January 2012 (European Wind Energy).
Antoniou, I., Pedersen, S., and Enevoldsen, P. (2009). Wind shear and uncertainties in power curve measurement and wind resources. Wind Eng. 33, 449–468. doi:10.1260/030952409790291208
Astolfi, D., Castellani, F., Becchetti, M., Lombardi, A., and Terzi, L. (2020). Wind turbine systematic yaw error: Operation data analysis techniques for detecting it and assessing its performance impact. Energies 13, 2351. doi:10.3390/en13092351
Astolfi, D., Castellani, F., Fravolini, M. L., Cascianelli, S., and Terzi, L. (2019a). Precision computation of wind turbine power upgrades: An aerodynamic and control optimization test case. J. Energy Resour. Technol. 141, 051205. doi:10.1115/1.4042450
Astolfi, D., Castellani, F., Lombardi, A., and Terzi, L. (2021). Multivariate scada data analysis methods for real-world wind turbine power curve monitoring. Energies 14, 1105. doi:10.3390/en14041105
Astolfi, D., Castellani, F., and Natili, F. (2019b). Wind turbine yaw control optimization and its impact on performance. Machines 7, 41. doi:10.3390/machines7020041
Astolfi, D., Pandit, R., Celesti, L., Vedovelli, M., Lombardi, A., and Terzi, L. (2022a). Data-driven assessment of wind turbine performance decline with age and interpretation based on comparative test case analysis. Sensors 22, 3180. doi:10.3390/s22093180
Astolfi, D., Pandit, R., Terzi, L., and Lombardi, A. (2022b). Discussion of wind turbine performance based on scada data and multiple test case analysis. Energies 15, 5343. doi:10.3390/en15155343
Barber, S., Deparday, J., Marykovskiy, Y., Chatzi, E., Abdallah, I., Duthé, G., et al. (2022a). Development of a wireless, non-intrusive, MEMS-based pressure and acoustic measurement system for large-scale operating wind turbine blades. Wind Energy Sci. 7, 1383–1398. doi:10.5194/wes-7-1383-2022
Barber, S., Hammer, F., and Tica, A. (2022b). Improving site-dependent wind turbine performance prediction accuracy using machine learning. ASME J. Risk Uncertain. Part B. 8, 021102. doi:10.1115/1.4053513
Barber, S., and Nordborg, H. (2020). Improving site-dependent power curve prediction accuracy using regression trees. J. Phys. Conf. Ser. 1618, 062003. doi:10.1088/1742-6596/1618/6/062003
Bentsen, L., Dilp Warakagoda, N., Stenbro, R., and Engelstad, P. (2022). Wind park power prediction: Attention-based graph networks and deep learning to capture wake losses. J. Phys. Conf. Ser. 2265, 022035. doi:10.1088/1742-6596/2265/2/022035
Bertelè, M., Bottasso, C., and Cacciola, S. (2018). Simultaneous estimation of wind shears and misalignments from rotor loads: Formulation for IPC-controlled wind turbines. J. Phys. Conf. Ser. 1037, 032007. doi:10.1088/1742-6596/1037/3/032007
Bessa, R. J., Miranda, V., Botterud, A., Wang, J., and Constantinescu, E. M. (2012). Time adaptive conditional kernel density estimation for wind power forecasting. IEEE Trans. Sustain. Energy 3, 660–669. doi:10.1109/tste.2012.2200302
Bleeg, J. (2020). A graph neural network surrogate model for the prediction of turbine interaction loss. J. Phys. Conf. Ser. 1618, 062054. doi:10.1088/1742-6596/1618/6/062054
Cascianelli, S., Astolfi, D., Castellani, F., Cucchiara, R., and Fravolini, M. L. (2021). Wind turbine power curve monitoring based on environmental and operational data. IEEE Trans. Ind. Inf. 18, 5209–5218. doi:10.1109/tii.2021.3128205
Clifton, A., Barber, S., Bray, A., Enevoldsen, P., Fields, J., Sempreviva, A. M., et al. (2022). Grand challenges in the digitalisation of wind energy. Wind Energy Sci. in review, [discussion preprint]. doi:10.5194/wes-2022-29
Deepalakshmi, B., Sujatha, K., Ponmagal, R., and Reddy, T. K. (2017). An assessment of potential windmills using image processing and artificial intelligence (AI) based wind speed estimation. In 2017 International Conference on Energy, Communication, Data Analytics and Soft Computing (ICECDS). 3770–3773. doi:10.1109/ICECDS.2017.8390169
Ding, Y. (2019). Data science for wind energy. Boca Raton, FL, USA: Chapman & Hall. doi:10.1201/9780429490972
Ding, Y., Kumar, N., Prakash, P., Kio, A., Liu, X., Liu, L., et al. (2021). A case study of space-time performance comparison of wind turbines on a wind farm. Renew. Energy 171, 735–746. doi:10.1016/j.renene.2021.02.136
Ding, Y., Tang, J., and Huang, J. Z. (2015). “Data analytics methods for wind energy applications,” in Proceedings of ASME Turbo Expo 2015: Turbine Technical Conference and Exposition, Montreal, Canada, 15–19 June 2015 (ASME), 1–9.
DSWE-Datasets (2019). Available at: https://aml.engr.tamu.edu/book-dswe/dswe-datasets/dataset/#5 (Accessed July 22, 2022).
Duthé, G., Abdallah, I., Barber, S., and Chatzi, E. (2021). Modeling and monitoring erosion of the leading edge of wind turbine blades. Energies 14, 7262. doi:10.3390/en14217262
Fischer, R., Mueller, H., Polonelli, T., Benini, L., and Magno, M. (2021). “Windnode: A long-lasting and long-range bluetooth wireless sensor node for pressure and acoustic monitoring on wind turbines,” in 2021 4th IEEE International Conference on Industrial Cyber-Physical Systems (ICPS), Victoria, BC, Canada, 10-12 May 2021 (IEEE), 393–399.
Gonzalez, E., Stephen, B., Infield, D., and Melero, J. J. (2019). Using high-frequency scada data for wind turbine performance monitoring: A sensitivity study. Renew. Energy 131, 841–853. doi:10.1016/j.renene.2018.07.068
GWEC (2021). Global wind power growth must triple over next decade to achieve Net Zero. Brussels, Belgium: Global Wind Energy Council Newsletter.
Hwangbo, H., Ding, Y., Eisele, O., Weinzierl, G., Lang, U., and Pechlivanoglou, G. (2017a). Quantifying the effect of vortex generator installation on wind power production: An academia-industry case study. Renew. Energy 113, 1589–1597. doi:10.1016/j.renene.2017.07.009
Hwangbo, H., Johnson, A. L., and Ding, Y. (2017b). A production economics analysis for quantifying the efficiency of wind turbines. Wind Energy (Chichester). 20, 1501–1513. doi:10.1002/we.2105
Hwangbo, H., Johnson, A. L., and Ding, Y. (2018). Spline model for wake effect analysis: Characteristics of a single wake and its impacts on wind turbine power generation. IISE Trans. 50, 112–125. doi:10.1080/24725854.2017.1370176
Imbens, G. W., and Rubin, D. B. (2015). Causal inference in statistics, social, and biomedical sciences. Cambrideg, UK: Cambridge University Press.
International Electrotechnical Commission (IEC) (2005). Iec TS 61400-12-1 ed. 1, wind turbines – Part 12-1: Power performance measurements of electricity producing wind turbines. Geneva, Switzerland: IEC.
Karami, F., Kehtarnavaz, N., and Rotea, M. (2021). “Probabilistic neural network to quantify uncertainty of wind power estimation,” in 2022 IEEE 15th Dallas Circuit And System Conference (DCAS), Dallas, TX, USA, 17-19 June 2022 (IEEE).
Kjellin, J., Bülow, F., Eriksson, S., Deglaire, P., Leijon, M., and Bernhoff, H. (2011). Power coefficient measurement on a 12 kW straight bladed vertical axis wind turbine. Renew. Energy 36, 3050–3053. doi:10.1016/j.renene.2011.03.031
Kumar, N., Prakash, A., and Ding, Y. (2020). Dswe: Data science for wind energy. R Package (The Comprehensive R Archive Network (CRAN) Available at: https://cran.r-project.org/web/packages/DSWE/index.html.
Kumar, P., Prakash, A., and Ding, Y. (2022). Dswe: Data science for wind energy. Python Package (The Python Package Index (PyPI) Available at: https://pypi.org/project/dswe/.
Latiffianti, E., Ding, Y., Sheng, S. S., Williams, L., Morshedizadeh, M., and Rodgers, M. (2022). Analysis of leading edge protection application on wind turbine performance through energy and power decomposition approaches. Wind Energy 25, 1203–1221. doi:10.1002/we.2722
Lee, G., Ding, Y., Genton, M. G., and Xie, L. (2015a). Power curve estimation with multivariate environmental factors for inland and offshore wind farms. J. Am. Stat. Assoc. 110, 56–67. doi:10.1080/01621459.2014.977385
Lee, G., Ding, Y., Xie, L., and Genton, M. G. (2015b). A kernel plus method for quantifying wind turbine performance upgrades. Wind Energy (Chichester). 18, 1207–1219. doi:10.1002/we.1755
Lee, J. C. Y., Stuart, P., Clifton, A., Fields, M. J., Perr-Sauer, J., Williams, L., et al. (2020). The Power Curve Working Group’s assessment of wind turbine power performance prediction methods. Wind Energy Sci. 5, 199–223. doi:10.5194/wes-5-199-2020
Lundberg, S. M., and Lee, S.-I. (2017). “A unified approach to interpreting model predictions,” in Proceedings of the 31st International Conference on Neural Information Processing Systems NIPS 2017, California, USA, 31 December 2017 (Long Beach), 4768–4777.
Madsen, H. A., Bertagnolio, F., Fischer, A., Bak, C., and Paulsen, U. S. (2016). “A novel full scale experimental characterization of wind turbine aero-acoustic noise sources,” in Proceedings of the International Symposium on Transport Phenomena and Dynamics of Rotating Machinery (ISROMAC 2016), Hawaii, Honolulu, 10-15 April, 2016.
Mathew, M. S., Kandukuri, S. T., and Omlin, C. W. (2022). Estimation of wind turbine performance degradation with deep neural networks. Proc. 7th Eurc Conf. Prognostics Health Manag. Soc. 22, 351–359. doi:10.36001/phme.2022.v7i1.3328
Medina, P., Singh, M., Johansen, J., Rivera Jove, A., Machefaux, E., Fingersh, L., et al. (2011). “Aerodynamic and performance measurements on a SWT-2.3-101 wind turbine,” in Windpower 2011, Anaheim, California, 22-25 May, 2011 (U. S Department of Energy).
Montano, Z., Kühn, M., Daniele, E., and Stüve, J. (2018). Bend-twist coupling on rotor blades for wind turbines. Lightweight Des. Worldw. 11, 42–47. doi:10.1007/s41777-018-0029-5
Niu, B., Hwangbo, H., Zeng, L., and Ding, Y. (2018). Evaluation of alternative power production efficiency metrics for offshore wind turbines and farms. Renew. Energy 128, 81–90. doi:10.1016/j.renene.2018.05.050
Øye, S. (1995). “The effect of vortex generators on the performance of the ELKRAFT 1000 kW turbine,” in Aerodynamics of Wind Turbines: 9th IEA Symposium, Stockholm, Sweden, 11–12 December, 1995, 9–14.
Özinan, U., Liu, D., Adam, R., Choisnet, T., and Cheng, P. W. (2022). Power curve measurement of a floating offshore wind turbine with a nacelle-based lidar. J. Phys. Conf. Ser. 2265, 042016. doi:10.1088/1742-6596/2265/4/042016
Pandit, R., Infield, D., and Penas, M. (2022). Accounting for environmental conditions in data-driven wind turbine power models. IEEE Trans. Sustain. Energy. [accepted and online published]. doi:10.1109/TSTE.2022.3204453
Pandit, R. K., Infield, D., and Kolios, A. J. (2020). Gaussian process power curve models incorporating wind turbine operational variables. Energy Rep. 6, 1658–1669. doi:10.1016/j.egyr.2020.06.018
Pandit, R. K., and Kolios, A. J. (2020). SCADA data-based support vector machine wind turbine power curve uncertainty estimation and its comparative studies. Appl. Sci. 10, 8685. doi:10.3390/app10238685
Park, J., and Park, J. (2019). Physics-induced graph neural network: An application to wind-farm power estimation. Energy 187, 115883. doi:10.1016/j.energy.2019.115883
Prakash, A., Tuo, R., and Ding, Y. (2022a). Gaussian process-aided function comparison using noisy scattered data. Technometrics 25, 92–102. doi:10.1080/00401706.2021.1905073
Prakash, A., Tuo, R., and Ding, Y. (2022b). The temporal overfitting problem with applications in wind power curve modeling. Technometrics. [accepted and online published]. doi:10.1080/00401706.2022.2069158
Rubin, D. B. (1973). Matching to remove bias in observational studies. Biometrics 29, 159–183. doi:10.2307/2529684
Schepers, J. G., and Schreck, S. J. (2019). Aerodynamic measurements on wind turbines. WIREs Energy Environ. 8, e320. doi:10.1002/wene.320
Shin, Y. E., Ding, Y., and Huang, J. Z. (2018). Covariate matching methods for testing and quantifying wind turbine upgrades. Ann. Appl. Stat. 12, 1271–1292. doi:10.1214/17-aoas1109
Troldborg, N., Bak, C., Madsen, H. A., and Skrzypinski, W. (2013). Danaero mw II: Final report. DAN-AERO MW Exp. doi:10.13140/RG.2.2.13805.03042
Wagner, R., Courtney, M., Larsen, T., and Paulsen, U. (2010). Simulation of shear and turbulence impact on wind turbine performance. Technical Report Risø-R No. 1722(EN), Technical University of Denmark and Risø National Laboratory. Available at: https://backend.orbit.dtu.dk/ws/portalfiles/portal/4550246/ris-r-1722.pdf (Accessed October 20, 2022).
Wu, G., Zhang, L., and Yang, K. (2019). Development and validation of aerodynamic measurement on a horizontal axis wind turbine in the field. Appl. Sci. 9, 482. doi:10.3390/app9030482
Xia, Y., Ahmed, K. H., and Williams, B. W. (2013). Wind turbine power coefficient analysis of a new maximum power point tracking technique. IEEE Trans. Ind. Electron. 60, 1122–1132. doi:10.1109/tie.2012.2206332
Yan, C., Pan, Y., and Archer, C. L. (2019). A general method to estimate wind farm power using artificial neural networks. Wind Energy 22, 1421–1432. doi:10.1002/we.2379
Yesilbudak, M., Sagiroglu, S., and Colak, I. (2013). A new approach to very short term wind speed prediction using k-nearest neighbor classification. Energy Convers. Manag. 69, 77–86. doi:10.1016/j.enconman.2013.01.033
Keywords: data driven, field measurements, machine learning, power curve, turbine performance analysis, uncertainty quantification
Citation: Ding Y, Barber S and Hammer F (2022) Data-Driven wind turbine performance assessment and quantification using SCADA data and field measurements. Front. Energy Res. 10:1050342. doi: 10.3389/fenrg.2022.1050342
Received: 21 September 2022; Accepted: 13 October 2022;
Published: 02 November 2022.
Edited by:
Yolanda Vidal, Universitat Politecnica de Catalunya, SpainReviewed by:
Davide Astolfi, University of Perugia, ItalyChristian Javier Tutivén, ESPOL Polytechnic University, Ecuador
Copyright © 2022 Ding, Barber and Hammer. This is an open-access article distributed under the terms of the Creative Commons Attribution License (CC BY). The use, distribution or reproduction in other forums is permitted, provided the original author(s) and the copyright owner(s) are credited and that the original publication in this journal is cited, in accordance with accepted academic practice. No use, distribution or reproduction is permitted which does not comply with these terms.
*Correspondence: Yu Ding, eXVkaW5nQHRhbXUuZWR1