 Nicole S. Schauser
 Christianna N. Lininger
 Tal Z. Sholklapper
- Voltaiq, Inc., Cupertino, CA, United States
Early and accurate battery lifetime predictions could accelerate battery R&D and product development timelines by providing insights into performance after only a few days or weeks of testing rather than waiting months to reach degradation thresholds. However, most machine learning (ML) models are developed using a single dataset, leaving unanswered questions about the broader applicability and potential impact of such models for other battery chemistries or cycling conditions. In this work, we take advantage of the open-access cycling performance data within the recently released Voltaiq Community to determine the extensibility of a highly cited feature-based linear ML model used for battery lifetime prediction. We find that the model is unable to extrapolate to different datasets, with severe model overfitting resulting in unphysical lifetime predictions of much of the unseen data. We further identify that the features engineered for this model are likely specific to the degradation mode for the original lithium iron phosphate (LFP) fast-charge dataset and are unable to capture the lifetime behavior of other cathode chemistries and cycling protocols. We provide an open access widget-based Jupyter Notebook script that can be used to explore model training and lifetime prediction on data within the Voltaiq Community platform. This work motivates the importance of using larger and more diverse datasets to identify ML model boundaries and limitations, and suggests training on larger and diverse datasets is required to develop data features that can predict a broader set of failure modes.
1 Introduction
1.1 Lifetime testing: Challenges and strategies
Understanding battery performance is critical to the development of new battery technologies, as well as the integration of batteries into products. Battery performance is examined through controlled laboratory testing, including analyzing rate and power capabilities, and performing lifetime testing. Lifetime testing exposes a battery to many charge-discharge cycles under a variety of temperatures, rates, and cycling profiles. The outcome of lifetime testing is observing and recording the cell behavior—including capacity, energy, efficiency, and voltage fade—over time. The goal of this highly controlled testing is to provide a proxy for the expected battery performance during true operation, while still enabling the calculation of standard metrics to provide a clear comparison between cells. The length of time it takes to test battery performance can be prohibitively long, especially for high-performing battery materials—on the order of months or years for a battery to truly reach “end of life” based on the application (Harlow et al., 2019; Beltran et al., 2020). Speeding up this time to insight is critical in helping accelerate the development cycles both for new materials, as well as cell qualification/validation and ultimately product development and use. Since battery lifetime testing time can approach the total product development time, especially in the areas of consumer electronics and automotive where OEMs rush to release new products, reducing lifetime testing time is a clear area where optimization and time savings can significantly reduce development timelines. Conversely, incorrect lifetime prediction can result in overconfidence and early failure once a product is launched.
Lifetime testing and prediction in batteries is often complicated by a non-linear performance decay which can be dominated by a number of underlying degradation mechanisms governed by factors such as battery chemistry, form factor, and operating conditions. This non-linear behavior, often governed by a roll-over towards accelerated decay–the “knee” point–makes it challenging to employ simple or naïve methods such as linear extrapolation for predicting future battery performance and end-of-life behavior (Dubarry et al., 2020; Attia et al., 2022). End-of-life designates the performance criteria at which a battery is no longer fit for the current application, and is often based on a percent capacity, energy, or power retention. The variability of battery cycling behavior, even within nominally similar cells, adds additional complexity and uncertainty to lifetime prediction (Baumhöfer et al., 2014; Rumpf et al., 2017; Beck et al., 2021).
Strategies for reducing time to insight for battery lifetime performance include accelerated aging testing, (Schmalstieg et al., 2013; Sun et al., 2018; Sulzer et al., 2021) physics-based modeling, (Ning et al., 2006; Safari and Delacourt, 2011; Ouyang et al., 2016; Atalay et al., 2020) and data-driven lifetime prediction (He et al., 2011; Wang et al., 2017; Severson et al., 2019; Ng et al., 2020; Sulzer et al., 2021). Accelerated aging is a common strategy employed in both academic labs and in industry, and generally encompasses testing at higher temperatures and/or rates such that battery degradation occurs more quickly. However, testing using conditions that are not expected under normal operation can lead to fundamental misunderstandings and poor performance prediction if the degradation modes accessed during accelerated aging differ from those seen during more realistic use (Sun et al., 2018). Both academic and industry groups are therefore also exploring other options for speeding up the lifetime testing cycle, either through physics-based modeling or data-driven prediction. Physics-based modeling can be used to parameterize and completely describe the underlying physics of a specific battery chemistry and form factor during certain operation modes. However, the parameterization of these models is challenging, as high-fidelity models require extensive measurements on battery chemistry, thermodynamics, macro and microstructure, etc. These high-fidelity models also solve complex and often non-linear differential equations which require significant computational resources and time. Simpler physics-based models address some of these issues, but the simplifying assumptions generally prevent their use for certain operational cases such as high-rate applications.
1.2 Data-driven lifetime prediction
Data-driven predictive techniques have emerged in the past decade as a promising approach to lifetime prediction due to their allure of eliminating the need for understanding the underlying battery degradation mechanisms. As will be discussed in this work, the belief that data-driven approaches remove the need for understanding degradation is somewhat naïve or optimistic, and many of the same challenges exist for data-driven or machine learning approaches as for the physics-based approaches mentioned above. Data-driven approaches rely on the collection or curation of adequate amounts of battery testing data, as well as the development of algorithms that can generate accurate prediction models from this data. The scope of the collected datasets–including chemistry, form factor and operating conditions–as well as the features engineered by the researcher or algorithm govern both the resulting accuracy as well as the potential extensibility of the models.
A variety of machine learning and data-assisted techniques have been employed for battery lifetime prediction, with published predictive performance achieving error rates under 10% and as low as 0.2% (Tseng et al., 2015) for the best models. The least complex models are feature-based linear regression models which have the benefit of low computational effort and clear interpretability (Long et al., 2013; Xing et al., 2013; Tseng et al., 2015; Berecibar et al., 2016; Song et al., 2017; Severson et al., 2019; Chen et al., 2020; Attia et al., 2021; Gasper et al., 2021). Simple feature-based models also limit the potential for overfitting small training datasets (Sendek et al., 2022) but require the design and selection of features tailored to a given battery dataset. These features can be based on electrochemical signals, such as capacity, current, or internal resistance; auxiliary signals such as temperature or impedance spectroscopy; or on metadata such as cell chemistry and form factor. While feature-based linear models achieve reasonable performance, improved performance has been shown for more complicated models, such as tree-based models, (Nuhic et al., 2013; Liu et al., 2015; Patil et al., 2015; Berecibar et al., 2016; Mansouri et al., 2017; Susilo et al., 2018; Fermín-Cueto et al., 2020; Paulson et al., 2022) Gaussian models, (He et al., 2011; Guo et al., 2015; Hu et al., 2015; Li and Xu, 2015; Richardson et al., 2017; Wang et al., 2017; Susilo et al., 2018; Aitio and Howey, 2021) or neural network models. (Liu et al., 2010; Berecibar et al., 2016; Wu et al., 2016; Mansouri et al., 2017; Zhang et al., 2017; Ren et al., 2018; Khumprom and Yodo, 2019; Venugopal and Vigneswaran, 2019; Hong et al., 2020; Ma et al., 2020; Shen et al., 2020; Li et al., 2021; Strange and dos Reis, 2021). The reduced prediction errors of these models come with important caveats, including difficulty in model interpretation, propensity for over-fitting, and high computational requirements which might limit edge computing or on-board applications.
As illustrated in Figure 1, most of the research referenced above is limited in scope to a single dataset or chemistry type, inhibiting the ability to draw generalizable conclusions from these studies. The use of small datasets of limited scope originates due to data scarcity–data acquisition is time-consuming and costly, requiring specialized testing facilities and access to battery cells, such that many researchers working at the intersection of battery engineering and data science turn towards publicly available datasets, which are themselves generally small, in non-uniform formats and dispersed across a variety of sources. Additionally, small datasets are often used when developing new algorithms as they are easier to manipulate and often result in cleaner conclusions. While this approach is valid for new method development - in the case where a reduction of experimental variables can be useful-there is in most cases a lack of follow-up by the same group or other researchers to attempt to identify the boundaries or limits of given models. A narrow dataset scope means that these models are generally over-hyped, but often under-utilized in real-world situations (e.g., by industry) since significant uncertainty remains about the true applicability of a specific model to a given use case.
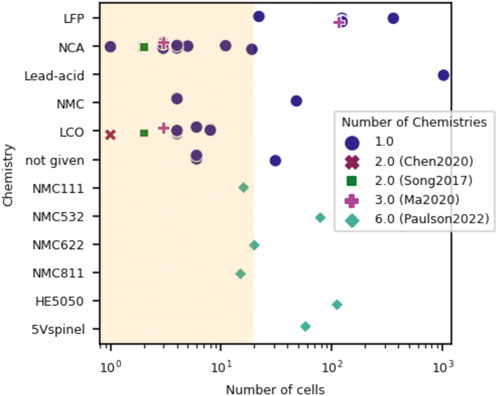
FIGURE 1. Visual showing the cell chemistries and number of cells per dataset for previously published data-driven lifetime prediction studies. Only four studies examined more than a single cell chemistry: Chen 2020 (2 chemistries), (Chen et al., 2020) Song 2017 (2 chemistries), (Song et al., 2017) Ma 2020 (3 chemistries) (Ma et al., 2020) and Paulson 2022 (6 chemistries). (Paulson et al., 2022). Most studies examined fewer than 20 cells for their dataset, as shown by the shaded yellow region.
Two recent studies did focus on questions surrounding generalizability of ML models for lifetime prediction, showing that certain models and feature sets may apply well to a variety of cathode chemistries. The first study re-created a feature-based linear regression model first developed by Severson et al. in 2019 for lifetime prediction of fast-charging LFP cells, (Severson et al., 2019) and showed that they were able to train a similar model successfully on a set of 12 NMC cells. (Sulzer et al., 2020). A recent publication by Paulson et al. (2022) is one of the first to more explicitly explore the implications of ML model applicability to a broad and diverse range of battery cathode chemistries. They identified 2 ML models, one which worked better at prediction within known chemistry spaces, and one which performed better at extrapolation to new chemistries–likely because it limited model complexity and thus prevented overfitting of the training data. They also identified a series of features that seemed to be generalizable across chemistries.
1.3 This publication
In this work, we explore these generalizability concepts further, examining the applicability or efficacy of using a published ML model on more diverse datasets than those it was developed on. We first investigate the ability of the Severson ML model (Severson et al., 2019) to predict the lifetimes of unseen datasets with diverse chemistries and cycling protocols, which is examined by using the pre-trained model to predict cycle performance for diverse datasets. We show that while the original model’s performance is reasonably accurate, it is unable to effectively predict the lifetime for a variety of other chemistries and experimental conditions. Core ML tenets are highlighted, such as the propensity for over-fitting to occur for models with more features, which can lead to larger errors and unphysical predictions. Additionally, an understanding of the statistical distribution of the training data compared to the testing data can provide insight into whether a ML model would need to interpolate or extrapolate; ML models generally do not extrapolate well, as is confirmed in this study.
Second, we examine whether training the same models on a more diverse dataset can provide reasonable lifetime prediction performance—we show that errors can indeed be reduced to 25%. This significant improvement in model error highlights again the importance of ensuring that the training dataset encompasses the same feature space distribution as the test dataset. Interestingly, while errors are reasonably low, the parity plots illustrate that the models still do not fully capture the lifetime behavior for individual datasets.
Third, we more explicitly investigate whether a model performs better when trained on a single dataset other than the one for which it was originally designed. This line of inquiry probes whether the engineered features can be applied to different chemistries and diverse operating conditions. We show mixed results, in which some datasets perform well, and others perform poorly. In general, the small number of cells in each dataset increases the variance of our ML pipeline and can be a cause of both overfitting and underfitting. The mixed results of small datasets underscore the continued need for larger and standardized datasets for model performance comparisons.
We conclude with a discussion of best practices gleaned from these results, and the importance of these findings for the larger community of battery researchers. Specifically, we encourage the practice of open-access data and code which enables other researchers to reproduce or expand upon a given finding. Voltaiq Community (www.voltaiqcommunity.com) is a newly launched, open-access platform for collaborative battery data science. In this study, we use the library of open-access data and the integrated Python programming environment of the Voltaiq Community platform to illustrate a best-practices workflow based on open-access data and ML models. Emphasizing the scope of a study and the expected limitations of a newly developed ML model will also help provide context for battery engineers who are looking to apply ML for lifetime prediction, but who perhaps lack the prior experience in ML that would allow them to understand model limitations that are implicit but not explicit. Lastly, standardization of both the input data as well as the feature generation/calculation steps can dramatically improve reproducibility and decrease time to insight. To this end, we have provided an open-access script in conjunction with this work that allows users to interactively select models and train/test datasets to explore the potential extensibility of ML models on data hosted in the Voltaiq Community platform.
2 Methods
2.1 Data access and organization
All data for this study was accessed through the open-access Voltaiq Community platform at www.voltaiqcommunity.com. Datasets are automatically harmonized to ensure consistent formatting and cycle statistic calculations to enable comparison between datasets and calculations of the features relevant for the machine learning models (see next section). Data can be accessed and analyzed on www.voltaiqcommunity.com free of charge, and each dataset includes references to the original publication or source from which the data was obtained.
2.2 Lifetime prediction model generation and feature calculation
Three machine learning models are compared in this study: (Harlow et al., 2019) a Dummy model, using scikit-learn’s DummyRegressor as a baseline, (Pedregosa et al., 2011) (Beltran et al., 2020) the Severson Variance model, a feature-based linear regression (ElasticNetCV) model developed by Severson et al. 2019 which calculates the variance of the difference between the discharge vs. capacity curves of a start and end cycle, and (Attia et al., 2022) the Severson Discharge model, which is also an ElasticNetCV model based on a number of additional features which are described in the Supplementary Information of the original publication. Scikit-learn pipelines are developed for each model, and results are stored in Prediction and Model classes within the accompanying script. 5-fold cross validation is employed, with a single train-test split.
The procedure for feature calculation is as follows:
1. Load voltage and discharge capacity time-series data for cycles cyc_start and cyc_end. The script defaults, and the values used in this study are cyc_start = 20 and cyc_end = 99 for each test record. These were chosen to ensure that the start and end cycle exist for each dataset, and that they are of the same type (CCCV cycles with nominally the same C-rate for the start and end cycle of a single test record). Through interaction with the provided script, users can select other start and end cycles for analysis.
2. Interpolate the discharge capacity data using 1,000 evenly spaced voltage points between the minimum and maximum cutoff voltages for each dataset. This interpolation is achieved using Scipy’s interp1d function. Note that the Severson model originally used a fixed upper and lower voltage cut-off since these voltages were constant for their dataset, but in our work this interpolation step is generalized.
3. Calculate the relevant features for each model. These include the minimum, mean, variance, skew, and kurtosis of the difference between the interpolated voltage versus discharge capacity curves of the end and start cycle. Additional features include: the difference in capacity measured at the lower voltage cutoff between the start and end cycle (deltaQ_lowV), the slope and intercepts of the line fit between the capacity of cycles (cyc_start + 2) and cycle_end, and of cycles (cyc_end—9) and cycle_end, the capacity of (cyc_start + 2), the capacity of cyc_end, and the difference in the maximum capacity and the capacity of (cyc_start + 2). Details can be found within the calc_X_and_y function of the severson_featurization.py module of the Showcase (https://www.voltaiqcommunity.com/editions/studio?showcase=ca667ebf-7131-4d1b-b8b1-cc396c1adc7f). Key deviations between calculations from the original Severson models and this work are noted here:
a. The Severson model calculated a few features based on a fixed voltage or fixed cycle number, which have been updated for this study. Specifically, delta_Q_lowV, which previously referenced the difference in capacity measured at 2V between the start and end cycle, was updated to use the lower voltage cutoff instead of 2V.
b. Additionally, the Severson model chose the slopes and intercepts of capacity values of cycles 2, 91 and 100; in our models we have updated the cycle values to be the (start cycle + 2), the (end cycle—9), and the end cycle, respectively. The start and end cycles in our work were 20 and 99, but are left as adjustable parameters within the provided script. These default start and end cycle values were chosen to ensure that those cycles were included in each test for each dataset, without cycling anomalies present.
c. The capacity of cycle two was an input feature in the Severson Discharge model, which has been updated to be the capacity of the (start cycle + 2) instead (in this case, cycle 22). This cycle shift also translates to the feature maxQ_q2, which is the difference between the maximum capacity and the capacity of the (start cycle + 2).
d. In our implementation, we drop the initial cycle from each test to avoid issues with high capacity measurements that were recorded especially for the Severson dataset, due to the existence of a slow conditioning cycle.
e. The capacity of cycle 100 was used in the original Discharge model, and has been generalized to the capacity of the end cycle chosen by the user (99 in this case).
4. Calculate the true “end-of-life” criteria, namely the cycle at which the 85% capacity retention threshold is met. In the provided script, 85% is set as the default but is an adjustable parameter. In order to make this calculation robust to capacity fluctuations and single cycles with low capacity, the end-of-life calculation was adjusted to select the first cycle of a series of five consecutive cycles which fall below 85% capacity retention. The log of cycle life is used in model construction and training as it improves the normality of the distribution for the training dataset.
a. Note that the reference capacity is an important part of this calculation. The current script implementation allows a user to choose a cycle ordinal from which to calculate a reference capacity. The Severson model used cell nominal capacity as a reference capacity; however, this is not known for each dataset on Voltaiq Community. Thus, a reference capacity based on the cycling data is chosen instead. Currently this cycle number must be the same for all datasets used for the model. A fixed reference cycle choice requires a user to have some information about what cycle to choose–for this study, cycle 20 was used for reference capacity. We note that while this (a) does not correspond directly to nominal capacity, such as in the Severson case and (b) is not actually the first cycle for any of the datasets explored here, we do not expect this reference capacity choice to play a large role in the outcomes discussed within this study. It was deemed most important that the cells started out near 100% capacity at the start of cycling, without a large drop in capacity retention due to changes in cycling protocol, rather than choosing a value that exactly matches or reproduces the nominal capacity. In the datasets examined in this study, no large difference between the capacity of cycle 5 through 20 was observed. Cycle 20 presented the first cycle that matched the cycling protocol of subsequent cycles for each test in all datasets examined in this study.
2.3 Basic model reproduction
The Severson 2019 manuscript describes splitting the 124 commercial LFP cell cycling test records into three groups–a Train, a Test and a Test2 (or additional evaluation) dataset. We follow the same dataset splitting as the original manuscript, which was determined using the cell ID within each metadata file on the original site hosting the data (https://data.matr.io/1/projects/5c48dd2bc625d700019f3204). Note that we also generated a random train-test split using scikit-learn and obtained similar results. This dataset splitting has been provided to users as a drop-down selection within the script accompanying this manuscript.
The Variance and Discharge model are both implemented using a Scikit-learn pipeline which includes a StandardScaler step followed by an ElasticNetCV model. This model is implemented with 5-fold cross validation and L1 ratios of [0.1, 0.5, 0.7, 0.9, 0.95, 0.99, 1]—these values were referenced from Attia et al.’s (Attia et al., 2021) continuation of Severson et al.’s work (https://github.com/petermattia/revisit-severson-et-al), (Severson et al., 2019).
2.4 Machine learning model extrapolation to unseen datasets
The initial portion of this study examines the ability of the trained ML models to extrapolate to unseen datasets. In this section, the models were trained on the original Severson Train dataset (see above), and then tested on a number of diverse open-access datasets from www.voltaiqcommunity.com. Datasets were loaded based on a dropdown widget in the provided script, which searches for specific dataset by keyword(s) within a test record name. The datasets and their characteristics are provided in Table 1.
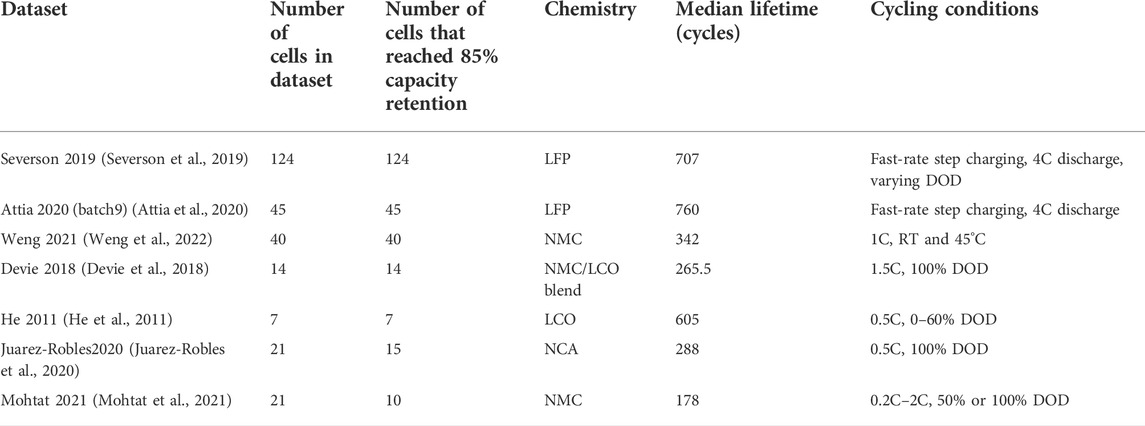
TABLE 1. Overview of the datasets analyzed within this study, including chemistry, number of cells, median lifetime, and general cycling characteristics. Cycling rates are denoted as C-rates, which designate the number of times a battery can be charged within 1 h (e.g., 4C = 15-min charge).
2.5 Model re-training on diverse datasets
Next, the diverse datasets were combined into a single dataset, which was then split into a Train set and Test set using scikit-learn train_test_split() with a 60–40 split (to roughly match the train-test split ratio used in Severson et al.) and a fixed random seed. The accompanying script provides the train-test split ratio as an adjustable parameter.
2.6 Machine learning model applicability to single datasets
The Severson models were also trained and tested on two individual datasets within the list provided in Table 1. The two datasets that were chosen were Devie2018 and Mohtat 2021. The Juarez-Robles2020 dataset did not have enough samples which reached 85% capacity, while the Weng2021 dataset failed to converge, likely due to the small dataset size and lower correlation between the Variance feature and end-of-life. Training and testing on individual datasets entailed using scikit-learn’s train_test_split() method to randomly split an individual dataset into a train and test set. A 60–40 split was chosen for this work, though the accompanying script provides this as an adjustable parameter. Each model was then trained on the training subset of the single dataset and tested on the testing subset. Note that the models include 5-fold cross-validation.
2.7 Data access and organization
Data used for this work is openly accessible on Voltaiq Community at www.voltaiqcommunity.com.
Additionally, a script has been made openly accessible for researchers to explore the findings of this work in greater detail, or on custom datasets of their choosing which can be uploaded to www.voltaiqcommunity.com. This script is hosted in a public GitHub repository (https://github.com/nicole-voltaiq/vce_Severson-Generalized-Cycle-Life-Prediction_ca667ebf) and is also associated with a Showcase on the Voltaiq Community platform (https://www.voltaiqcommunity.com/editions/studio?showcase=ca667ebf-7131-4d1b-b8b1-cc396c1adc7f). The script provides a series of widgets for users to select model Train and Test datasets, which models they are interested in exploring, and which cycles and capacity retention % they want to use for model featurization. Users then have the ability to predict battery lifetimes of an additional prediction dataset, which includes as an output an estimated time until end of life. Time until end of life is calculated based on the predicted cycle life, the current test cycle, and the average cycle time for the test. The time until end of life value is intended to be used as a rough guideline for test planning.
3 Results
The large volume of standardized data available in Voltaiq Community presents an unprecedented opportunity for battery scientists and data scientists to explore and analyze publicly available battery datasets in a frictionless manner. While Voltaiq Community is not the first or only public repository of battery data, it both presents the largest collection of such data, and also enables coherent analysis through a web-based application or a Python or Matlab programming environment, including seamless integration with GitHub. Voltaiq Community enables scientists to easily explore numerous datasets and expand their analysis beyond a single or small dataset generated by themselves or their collaborators.
In this study, we take advantage of several diverse, open-access datasets on the Voltaiq Community platform to identify the extensibility and possible limitations of a seminal academic machine learning model for battery lifetime prediction. The model framework chosen in this work was developed and published by Severson et al. and includes two feature-based linear regression models–the ‘Variance’ model and the ‘Discharge’ model. Severson et al. also developed a third ‘Full’ model which was not considered here because it included features based on temperature and internal resistance which were not always present for other publicly available datasets. The datasets examined in this study are shown in Figure 2a, including their distribution of cycling performance to 85% capacity retention–see Methods for more information on this calculation. 85% capacity retention was chosen as the “end of life” parameter in this study because it enabled the examination of the largest subset of battery data, since not all studies cycled their cells to lower levels of capacity retention. While selecting a different threshold parameter might change the specific details of the resulting study, the goal of this work is not to optimize the performance or output of any one parameter or model, but rather to illustrate common challenges and pitfalls that occur when developing machine learning models for small and uniform datasets.
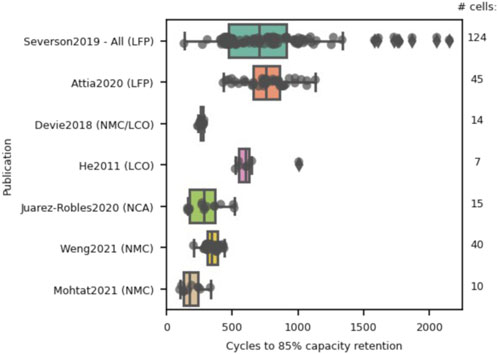
FIGURE 2. Overview of the open-access datasets used within this study, showing the distribution of “end of life” (85% capacity retention) cycle count for each dataset. The number of cells in each study are shown along the right-hand side of the plot.
Notably, this work seeks to emphasize that ML models developed on one dataset cannot be expected to be automatically applicable to other datasets–instead, the dataset characteristics (such as battery degradation mode) and model parameters will determine the extensibility of a model.
The datasets examined in this study include the common cathode chemistries LFP, NMC, NCA, and LCO (Table 1), as well as a range of cycling conditions from fast-charge cycling (rates at/above 4C) and some slow cycling (C/2) (Table 1). The data can be explored in more detail and free of charge at www.voltaiqcommunity.com.
3.1 Basic model reproduction
The original Severson models are able to predict cell lifetime to 85% capacity retention with a mean absolute percentage error (MAPE) of under 16% for the original LFP fast-charge dataset (Figure 3A). A smaller MAPE value indicates lower prediction errors and thus better model performance. Similar to the original study, which used an end-of-life metric of 80% of the nominal capacity, the feature-based linear regression models are able to capture the lifetime trends of the Train, Test, and Test2 datasets with reasonable accuracy, as illustrated by the parity plots shown in Figures 3B,C. It is important to examine the parity plot trends as they provide additional details compared with the MAPE results. Deviations from the unity line shown in each parity plot would suggest the model’s inability to truly learn from the given dataset; the Dummy model’s parity plot (shown in Supplementary Figure S1) illustrates that complete inability to learn from the data would result in a horizontal trend of the data within the parity plot. In agreement with the conclusions presented within the original study, we find that the two models perform reasonably well on the original dataset which suggests that these models can be used to predict the lifetime of commercial LFP 18650 cells under fast-charge conditions with an accuracy of around 16% after only 100 cycles of testing. As discussed in the original study, lifetime prediction after only 100 cycles of testing is an exciting result as early prediction enables reduced testing time for qualification/validation and presents an opportunity for possible on-board lifetime prediction due to the simplicity of the model feature calculations.
FIGURE 3. (A) Mean absolute percentage error on the training, test and test2 (evaluation) datasets for a Dummy, Severson Variance and Severson Discharge model. Train/test/test2 splits follow that of Severson et al., (Severson et al., 2019) and MAPE values are similar to those found in the original publication. Parity plots showing observed vs. predicted cycle life for the (B) Severson Variance model and (C) Severson Discharge model show the models generally capture the dataset behavior well, with under-prediction of long lifetime cells.
3.2 Extrapolation to unseen datasets
While the linear feature-based models presented above perform well on the original dataset, the models extrapolate poorly to previously unseen chemistries and cycling conditions. The simplicity of the Severson Variance model, which only uses a single feature as a lifetime predictor, limits the propensity for overfitting of that model, and therefore results in better predictive performance compared to the Discharge model on the unseen datasets (Figures 4A–C). The better extrapolation performance for the Variance model illustrates a core tenet of ML, which states that simpler models (e.g., those with fewer fitting parameters) are less likely to overfit training data and therefore might perform better on unseen datasets. (James et al., 2013). Mean absolute percentage errors for the Variance model range from 17% (for a small dataset of only seven test records) to 30%, with an average of 22% error for all unseen datasets. This is almost twice the MAPE of the Severson Test2 dataset (12.6%). Additionally, closer inspection of the parity plot (see Figure 4C) suggests that this model is unable to capture the true end-of-life trend of many of the datasets, since each individual dataset shows strong deviation from the unity slope that would be expected if a model is able to learn the dataset behavior fully.
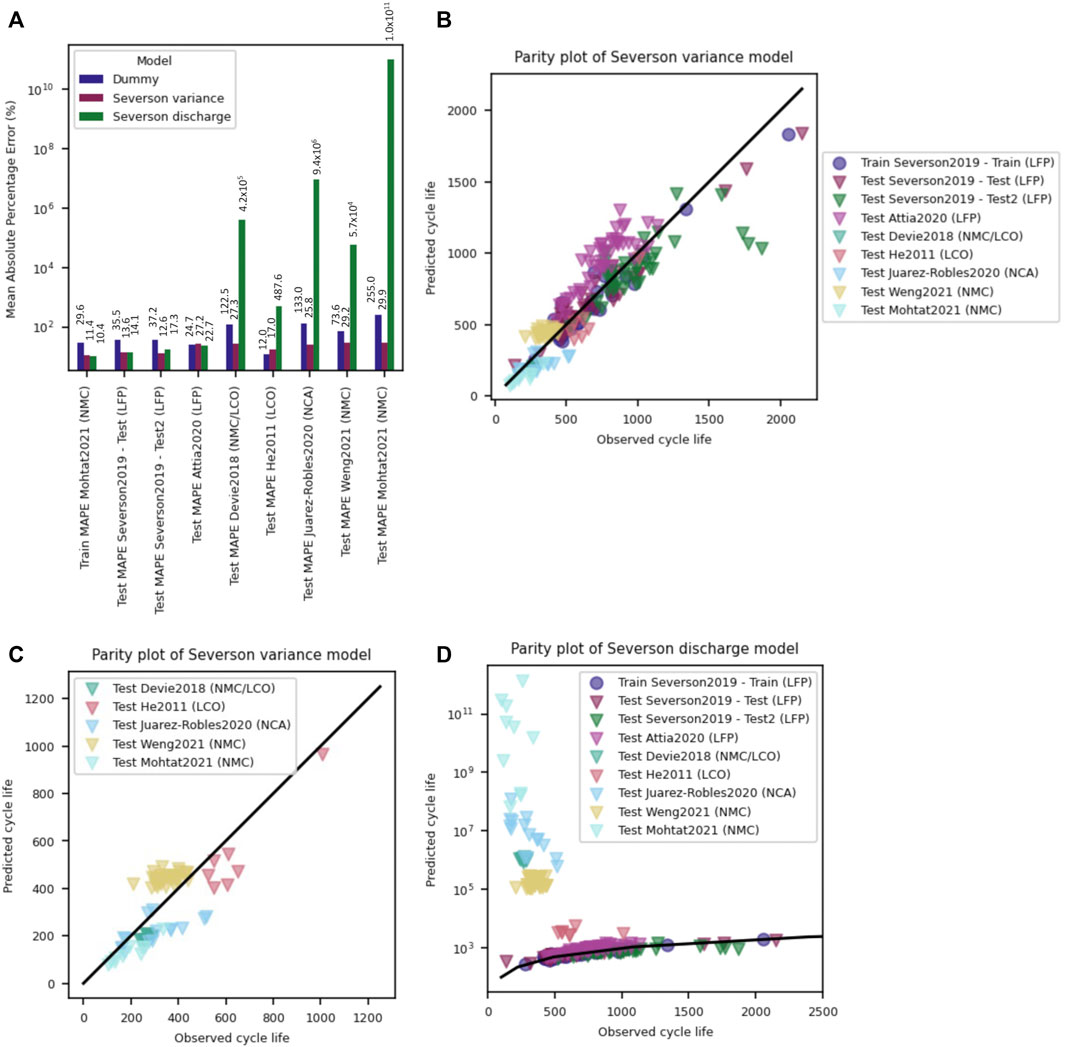
FIGURE 4. (A) Mean absolute percentage error for the Dummy, Severson Variance and Severson Discharge models trained on the Severson et al. training dataset and tested on a variety of open-access datasets. The MAPE shows that the Severson Discharge model suffers from severe overfitting, while the simpler Severson Variance model performs significantly better but still shows errors of up to 30%. (B) Parity plot of the Severson Variance model suggests that it performs reasonably well on the combined datasets, though (C) closer inspection of any single unseen dataset will reveal a deviation from unity slope, suggesting the model does not fully capture the lifetime behavior. (D) A semi-log parity plot of the Severson Discharge model shows that this model suffers from severe overfitting and extreme, unphysical lifetime predictions for many datasets; only the Severson and Attia datasets are predicted reasonably well from the Discharge model trained on Severson data.
The Severson Discharge model illustrates extreme overfitting behavior and wildly over-predicts the lifetime of many of the unseen datasets, suggesting this model is unable to extrapolate to unseen chemistries and cycling conditions. Again, this model contains more features than the Variance model, and it thus might be expected that the model, which was trained on a small dataset, will learn the training set behavior well but will not extrapolate well to different conditions. (James et al., 2013). Examining the distribution of calculated features, which are used by the trained model to predict lifetime performance, can help illustrate possible reasons for the model’s high error on many of the datasets.
There are two reasons why a ML model might not perform well on an unseen dataset. First, the dataset might not have the same range and distribution of features compared to the training dataset, which is a core assumption in the use of machine learning. Alternatively, the model’s features might be irrelevant or inappropriate for capturing the signatures that determine cell degradation and end of life within the new dataset. To examine whether one or both reasons is the cause for the poor performance of the Severson models, we plot the distribution of values of calculated features which are used by the trained model. The Variance model uses only var(ΔQ99-20) (Figure 5B), while the Discharge model includes five features (the weightings are shown in Supplementary Table S1); we have selected the three highest weighted features [which includes var(ΔQ99-20)] for illustrative purposes. The Variance model had errors in lifetime prediction of up to 30%, and based on Figure 5B it is possible that some of that error arises due to the difference in statistical distribution of the Variance feature for the unseen datasets. Specifically, the calculated Variance feature in many of the unseen datasets falls outside of the range of the training data. Additionally, the spread in the data—as signaled by the interquartile ranges of the box plot—is also much narrower for some of the datasets. The difference in feature distribution between the Train and Test datasets motivates that re-training the model on a more diverse training set (see Section 2.3) might improve model performance further.
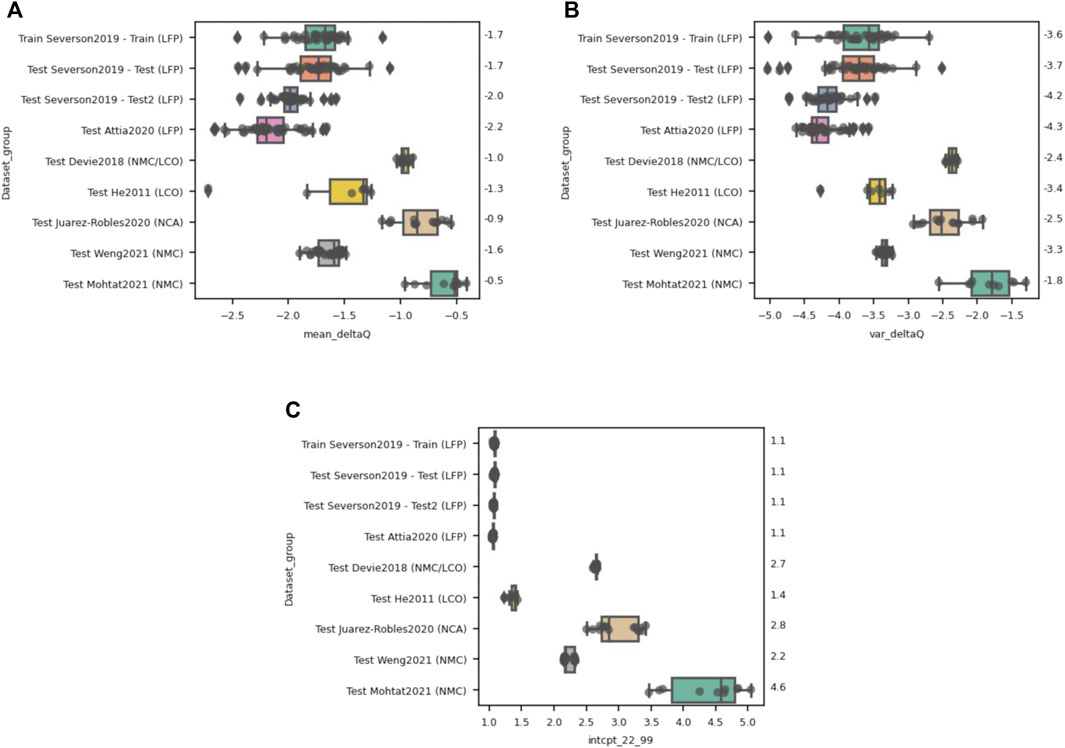
FIGURE 5. Distribution of the top three features (A) mean(ΔQ99-20), (B) var(ΔQ99-20) and (C) intercept between a linear fit of the capacity decay between cycles 22 and 99 for each dataset for the Severson Discharge model trained on the Severson2019 Train dataset. The distribution of all three features differs between the LFP Severson/Attia datasets and the other cell chemistries, with the largest variations occurring for the feature of third-most importance–the intercept value between cycle 22 and cycle 99. The median values for each dataset are listed on the right-hand side of each figure for reference.
As for the Discharge model, Figures 5A,C likewise suggests that some of the features that are used for model training vary dramatically in scale and distribution for the unseen datasets. These two features are the first- and third-most important features for the discharge model. It is likely that the large deviation in feature distribution is causing the extremely unphysical lifetime estimations using this model and suggests that this model is poor at extrapolating to unseen data.
3.3 Model re-training on diverse datasets
A more robust approach for attempting to build a generalizable machine learning model is to train the model on a larger variety of data, such that it will not overfit to a single dataset type. The models are trained on more diverse data by selecting all datasets and using Scikit-learn’s train_test_split method to split the datasets into a training set and a test set. (Pedregosa et al., 2011). The Dummy, Variance and Discharge models are then trained on the training dataset, and their performance is evaluated on the test dataset.
The MAPE values (Figure 6A) for the various test datasets are all below 23%, suggesting this model would perform reasonably well on any of the tested chemistries after incorporating some of those chemistries within the training dataset. The MAPE for the model trained on diverse data shows a small improvement compared to the model trained only on the Severson data for the Variance model, while a substantial improvement is seen for the Discharge model, since that model had previously dramatically overfit the Severson training data. The parity plots (Figures 6B,C) also show relatively good performance for all datasets as well, though both models underestimate the performance of long-lasting cells, similar to the original Severson models shown in Figures 3B,C. Importantly, focusing on any single dataset still shows deviation from a unity slope in the parity plot, as can be seen for both the Devie2018 and Weng2021 data for the Severson Discharge model in Figure 6D. Thus, while an improvement in model performance is certainly seen by increasing the diversity of the training dataset to encompass the full feature distribution, the model continues to have some difficulties in learning the nuanced behavior of any individual dataset.
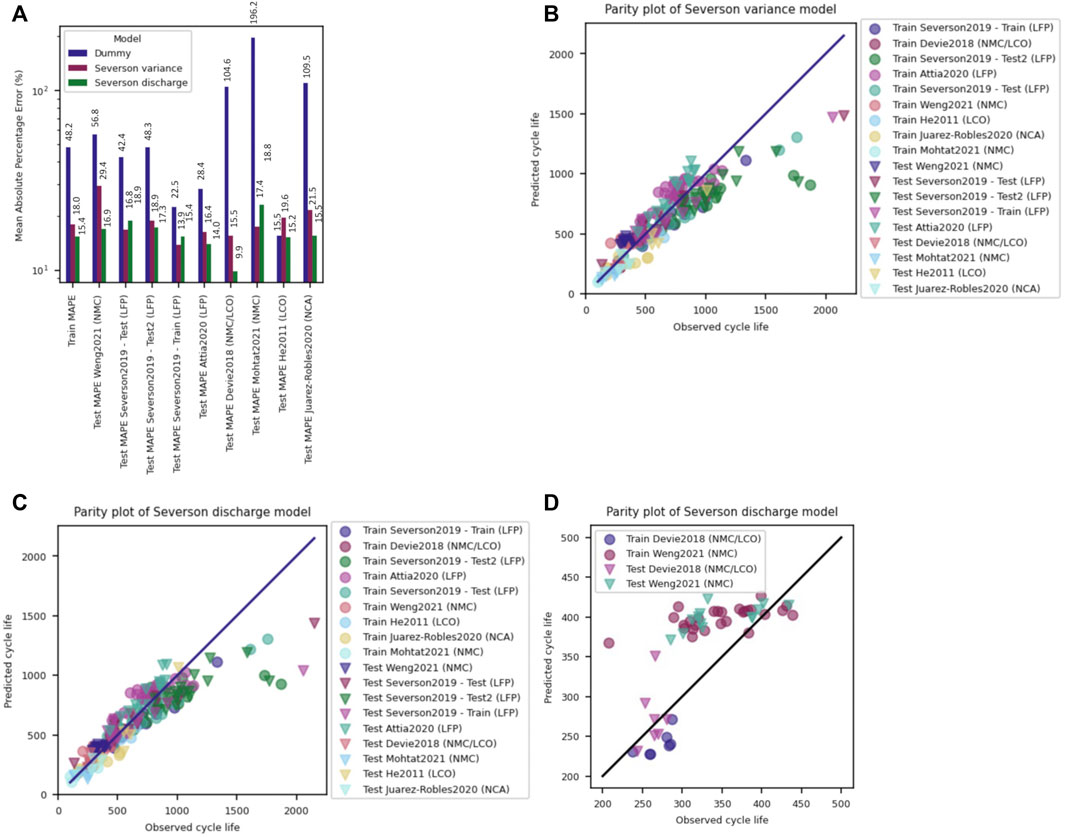
FIGURE 6. (A) Models trained on a diverse dataset including data from all studies show significantly improved MAPE results, with a maximum error of around 23%. Parity plots for the (B) Variance and (C) Discharge models show reasonable agreement between predicted and observed cycle lives, though any individual study still shows deviation from unity slope, as can be seen in (D) for the Devie2018 and Weng2021 datasets.
Interestingly, the Variance feature is selected as an important feature during Discharge model training for both the LFP training set and the more diverse training set, suggesting that, of all the features examined by Severson et al., it captures a large portion of the lifetime behavior. Importantly, the Variance feature is weighted much more heavily when the discharge model is trained on the diverse data set, while all other feature weightings are reduced by an order of magnitude (Supplementary Table S2). Thus, the Discharge and Variance models are very similar when trained on the diverse training dataset. For the Discharge model trained on only the Severson data, the mean(ΔQ99-20), and linear fit of the capacity decay between cycles 22 and 99 also play an important role. As mentioned, when the Variance and Discharge models were trained on more diverse datasets, the models performed similarly. The simple model that focused on a single feature is most likely to be more generalizable, due to limited overfitting inherent to the single feature, which was observed. However, underfitting for individual test sets occurred for the diversely trained models, as they were unable to perform well for any individual test set. This suggests that the Variance feature is not universal enough between datasets to act as a metric that can provide lower than 23% mean absolute percentage error in the end-of-life estimation.
Data-driven lifetime prediction depends on being able to capture information about relevant degradation mechanisms within the electrochemical signals that are selected as features for a ML model. The dominance of the Variance feature suggests that this feature does indeed capture some of the degradation behavior within the first 100 cycles. The key insight of the importance of the Variance feature was discovered by Severson et al. in their original study and emphasizes that there is a rich amount of information within the discharge voltage curve that can be used to identify subtle signals indicating early degradation. However, deviations from a unity slope in the parity plots shown above, suggest that for many of the datasets presented here, this variance feature captures only part of the degradation signal. Additional signals are either (Harlow et al., 2019) present within the dataset but described by features other than the Variance feature, or (Beltran et al., 2020) not present within the electrochemical signatures of the first 100 cycles. It is important to emphasize that data-driven methods can only be expected to learn cell lifetime trends reliably if the dominant degradation pathways of those cells can be described by the features being used to train a model. (Attia et al., 2022).
3.4 Model applicability to single datasets
In the previous section we have shown that training both of the Severson models (Discharge model and Variance model) on a diverse dataset can provide lifetime predictions with under 23% error. We would now like to explore whether the MAPE performance can be further improved when the model is trained on a single dataset, differing from the dataset that the model was originally developed on. This returns to the workflow set out at the outset of this study and in the original Severson study, which focused on a dataset with uniform cathode chemistry, cell form factor, and only small variations in operating conditions.
We begin by looking at the correlation between the Variance feature and the cycles to “end-of-life” for each dataset–some datasets show a strong correlation with this single parameter, while others show weaker (but non-zero) correlations (Figure 7, Table 2). The Pearson correlation coefficient is a measure of the linear correlation between two variables, with one or -1 denoting perfect positive or negative correlation, respectively, and 0 denoting no correlation. The non-zero correlation for all datasets emphasizes that the Variance feature captures at least some of the degradation signals from all of the datasets explored in this study. The Variance feature expresses the dispersion of changes in the voltage versus discharge capacity curve between two cycles–in our study between cycle 99 and cycle 20. As Severson et al. noted in their original study, battery cycling curves provide rich information about electrochemical processes occurring within a battery, and the creation of features based on shifts in those cycling curves can enable models to better capture degradation phenomena that ultimately affect the time to reach “end of life”.

FIGURE 7. (A) Plot showing correlation between the log of the Variance feature and the log of the number of cycles to 85% capacity retention for all datasets. Correlation plots for single datasets are shown for (B) the Devie2018 data and (C) the Mohtat2021 data.
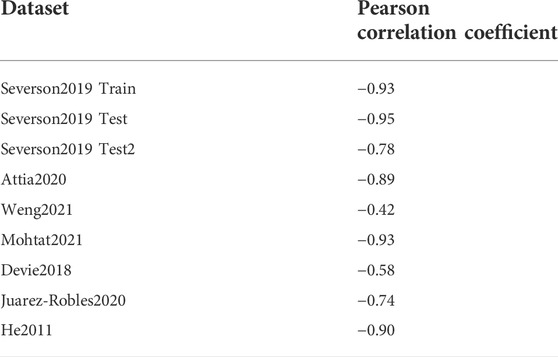
TABLE 2. Pearson correlation coefficient between the Variance feature and the cycle life of each dataset.
The datasets in this study which show the weakest dependence of cell lifetime on the Variance feature are Weng 2021 (NMC) with a Pearson correlation coefficient of -0.42, Devie 2018 (NMC/LCO) with a correlation coefficient of -0.58, and Juarez-Robles2020 (NCA) with a correlation coefficient of -0.74 (Table 2). The low correlation of the Weng2021 dataset is especially interesting, as it contrasts sharply with the strong correlation of the Mohtat2021 NMC dataset which was generated within the same lab, and which was used in a previous study for lifetime prediction with a slightly modified version of the Severson models with great success. (Sulzer et al., 2020). It is possible that differences in degradation mechanisms between these two studies plays a role, as the Weng2021 dataset explicitly examined the role of changing SEI characteristics based on varying formation protocols. However, both studies indicate that loss of lithium inventory (LLI) as examined through differential capacity analysis, plays a dominant role in degradation, and Sulzer et al. suggest a strong correlation between LLI and the Variance feature within the Mohtat2021 dataset.
Two datasets were chosen for training using the Variance and Discharge models–Devie 2018 (NMC/LCO) and Mohtat 2021 (NMC)—and show the large contrast in possible model performance outcomes (Figure 8). As might be expected based on the weaker correlation between the Variance feature and calculated lifetime, the Devie2018 NMC/LCO dataset shows poor performance for both models. Test MAPE values do not decrease significantly from the Dummy model to either of the two models, suggesting that neither model appropriately captures the lifetime behavior of this dataset. In contrast, the Mohtat2021 NMC dataset can be fit extremely well by both the Variance and Discharge models, though the Discharge model dramatically overfits the training data, likely due to the small number of samples compared with the number of features in the model. Again, in this case an analysis of sample size to feature set size is important in limiting the potential for overfitting. Feature weightings for the Discharge model are included in Supplementary Tables S3, S4 for the Devie2018 and Mohtat2021 datasets, respectively.
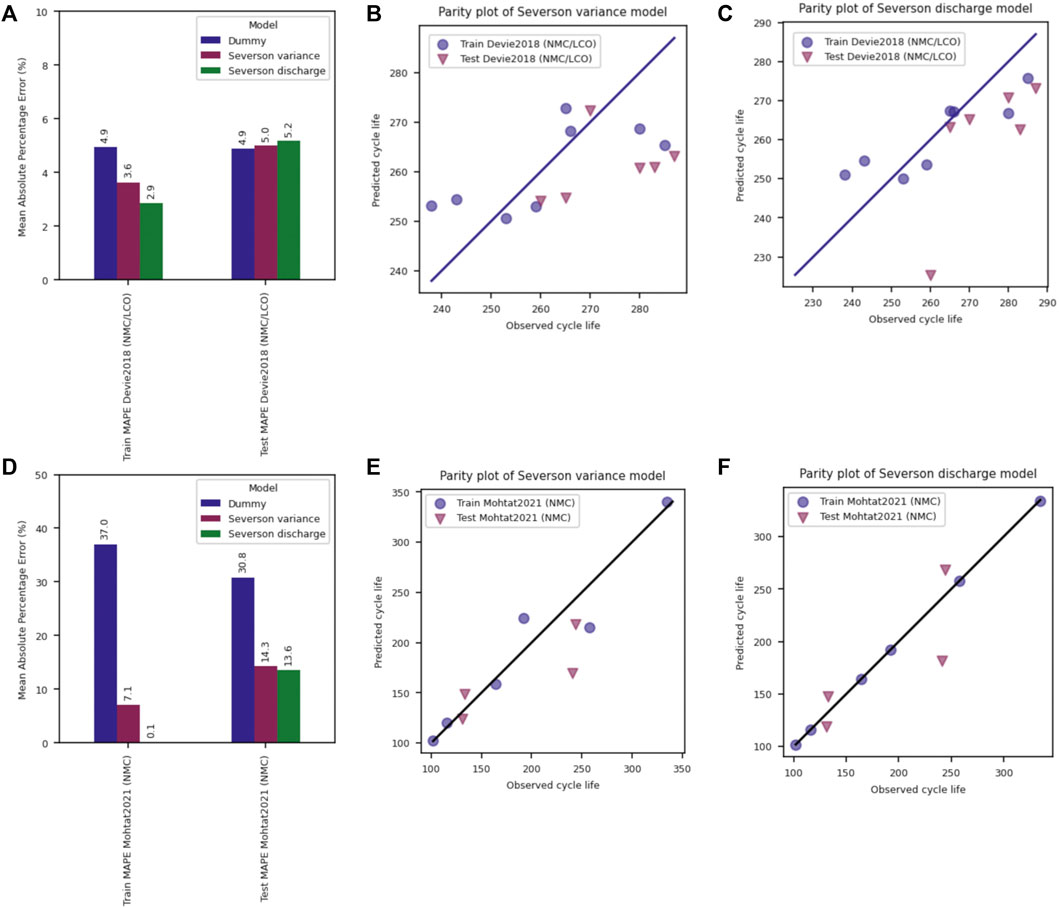
FIGURE 8. Severson model performance for the Devie2018 and Mohtat2021 datasets. (A,D) Train and Test MAPE for the Devie and Mohtat datasets, respectively. Parity plots for the (B,E) Variance, and (C,F) Discharge model for the Devie and Mohtat datasets, respectively.
The dramatic difference in performance between the two datasets points to two important take-aways from this single-dataset analysis:
1. Small datasets can lead to specific analysis outcomes that might vary dramatically based on sampling.
2. Generalizability discussions must begin to use larger datasets which are more likely to capture inherent or untracked variability between cells.
As battery scientists know, there are a large number of parameters which can affect battery lifetime, and a lot of variability in performance can be seen in even nominally identical cells. (Baumhöfer et al., 2014; Rumpf et al., 2017; Beck et al., 2021). This lifetime performance variability does not always create clear signals within the features used for model development and can therefore be lost in prediction outcomes when small datasets are used.
3.5 Best practices
As was mentioned earlier, this work represents an illustrative case study on the extensibility of a highly cited linear feature-based model. As was shown in Figure 1, several other models have been developed, some of which might perform better on unseen chemistries than others. The goal of this study is not to denigrate a single model or suggest that no models can extrapolate to unseen chemistries, but to illustrate the importance of (Harlow et al., 2019) thinking critically about the claims and impact of any ML model and (Beltran et al., 2020) understanding and identifying the known or suspected degradation mechanisms for a specific dataset, as that will likely govern whether or not a specific model might be able to learn from and capture the behavior of a dataset.
A simple set of best practices can be developed based on the findings of this study. First, for those developing new ML models for lifetime prediction: it is important to be explicit about the dataset that was used to train and test a ML model, as well as the assumptions inherent to the model’s parameters (e.g., within the features that are either engineered or learned by the mode l). As was shown in this study, ML models can exhibit accurate performance for one dataset and one type of degradation mode while failing to perform well for another. While it is not necessary to work towards the development of universally applicable ML models, the battery community could benefit from a more explicit statement of assumptions and limitations of any one model. Additionally, industry partners would likely benefit substantially from a discussion of model extensibility, since the curation of data and model development represent the bottlenecks in lifetime prediction work.
Many early ML prediction studies are performed on battery test data and chemistries that might be less relevant in the future (e.g., models developed on older cells which exhibit poor performance such as the NASA dataset, (Saha and Goebel, 2007) models developed on cells of unspecified chemistries, etc.). A best practice is to provide both information about the dataset (usually done, though incomplete information sometimes provided) as well as the developed models so that future researchers can easily extend the models to different datasets, chemistries and systems. We acknowledge that not all models are easily written in a generalizable manner, and that some data requirements will remain (e.g., models built on impedance spectroscopy inputs will require EIS data, etc.).
To this end, the larger community would dramatically benefit if those who publish new lifetime prediction studies could (Harlow et al., 2019) ensure model calculations are dataset agnostic (or clarify where they are not, such as might be the case if temperature or impedance features are required) and (Beltran et al., 2020) provide open access to datasets and model development code for other researchers to reproduce and extend the published findings.
To begin to follow our suggested best practices, we have developed a Jupyter Notebook script and associated modules which will allow users to examine the extensibility of a machine learning model to publicly available data hosted on the Voltaiq Community platform. In the initial script release, we have focused on reproducing and generalizing the Severson Variance and Discharge models, though we provide users with the ability to add or edit ML models based on our generalized Model class. This script represents a coordinated effort to help others structure their ML pipelines and model development workflow in a manner that will enable not only reproducibility but also extensibility; since these models can be run on any dataset within the Voltaiq Community platform, special emphasis should be placed on ensuring model robustness and generalizability of feature calculations.
Those who are evaluating the claims and impact of published lifetime prediction studies can benefit by asking some of the following questions.
• What sort of chemistry and experimental conditions exist within the training and testing datasets explored by the study?
• Are the dataset parameters relevant to the application of interest?
• What degradation modes might be expected to exist within the dataset(s)?
• Do those degradation modes exhibit electrochemical signals that could be reasonably captured by the features used or learned by the model of interest?
Following these best practices can ensure better communication and understanding of potential impact for the development of new lifetime prediction models for the broader community. Academic research can take advantage of small datasets to explore potentially high-impact new ideas, such as the development of novel ML models for lifetime prediction. Industry and practical application require a more concerted effort to explore the extensibility of a published model towards a specific use case. Without ultimately gaining an understanding of the scope and limitations of the developed models, the work performed during academic exploration cannot cross the gap towards practical deployment. Thus, for maximum potential impact, researchers can at a minimum make their work available to collaborators, peers and the broader community on an open-access and traceable platform.
4 Conclusion
This work emphasizes the challenges and opportunities for assessing machine learning (ML) model generalizability for battery lifetime prediction. Many previous studies have suggested that ML can be a powerful tool for predicting battery lifetime, especially from controlled cycling data on relatively uniform datasets. Here, we hope to expand this discussion further towards identifying the limitations of developed ML models, as this is an important cornerstone in the transition of data-driven lifetime prediction from academic research into practical industry applications.
Using a feature-based linear regression model as a case study, we illustrate a few core ML tenets. First, ML models are better at interpolation than extrapolation; understanding the statistical distribution of the model inputs and features can help ascertain likelihood of success in the lifetime prediction of unseen data. Second, small datasets can lead to variance issues for ML models. Specifically, small datasets might only sample a small subset of the actual performance space, even for a single chemistry and range of operating conditions–this narrow dataset range can result in overly optimistic models which perform well on one dataset, but do not perform well for a similar dataset, such as in the case of exploring the lifetime performance of the Mohtat2021 and Weng2021 NMC datasets. While these datasets were suggested to have similar degradation mechanisms (LLI), the Variance feature worked well as a descriptor only for the Mohtat2021 dataset.
In all cases, access to more diverse and larger datasets can help the battery community understand the extensibility and limitations of published ML models. An understanding of model applicability is integral for moving from model development to application, and will provide not only the academic community but also industry with important tools for gauging model applicability and potential for impact. We have developed a script to enable users to compare various ML models, and examine their applicability to a growing number of open-access datasets on Voltaiq Community. Readers are encouraged to add open-source or private data to the Voltaiq Community platform to test this script and others available, or to develop their own models. We hope that this work sets the stage for continued development and expansion of lifetime prediction algorithms coupled with an exploration of their generalizability.
Data availability statement
The original contributions presented in the study are included in the article/Supplementary Material, further inquiries can be directed to the corresponding author.
Author contributions
NS: Conceptualization, methodology, formal analysis, software, investigation, writing–original draft and review and editing. CL: Supervision, writing–review and editing. EL: Supervision, writing–review and editing. TS: Conceptualization, writing–review and editing.
Conflict of interest
NS, CL, EL, TS, was empolyed by Voltaiq, Inc.
Publisher’s note
All claims expressed in this article are solely those of the authors and do not necessarily represent those of their affiliated organizations, or those of the publisher, the editors and the reviewers. Any product that may be evaluated in this article, or claim that may be made by its manufacturer, is not guaranteed or endorsed by the publisher.
Supplementary material
The Supplementary Material for this article can be found online at: https://www.frontiersin.org/articles/10.3389/fenrg.2022.1058999/full#supplementary-material
References
Aitio, A., and Howey, D. A. (2021). Predicting battery end of life from solar off-grid system field data using machine learning. Available at: http://arxiv.org/abs/2107.13856.
Atalay, S., Sheikh, M., Mariani, A., Merla, Y., Bower, E., and Widanage, W. D. (2020). Theory of battery ageing in a lithium-ion battery: Capacity fade, nonlinear ageing and lifetime prediction. J. Power Sources 478, 229026. doi:10.1016/j.jpowsour.2020.229026
Attia, P. M., Bills, A., Planella, F. B., Dechent, P., dos Reis, G., Dubarry, M., et al. (2022). Knees” in lithium-ion battery aging trajectories. Available at: http://arxiv.org/abs/2201.02891.
Attia, P. M., Grover, A., Jin, N., Severson, K. A., Markov, T. M., Liao, Y. H., et al. (2020). Closed-loop optimization of fast-charging protocols for batteries with machine learning. Nature 578 (7795), 397–402. doi:10.1038/s41586-020-1994-5
Attia, P. M., Severson, K. A., and Witmer, J. D. (2021). Statistical learning for accurate and interpretable battery lifetime prediction. J. Electrochem. Soc. 168 (9), 090547. doi:10.1149/1945-7111/ac2704
Baumhöfer, T., Brühl, M., Rothgang, S., and Sauer, D. U. (2014). Production caused variation in capacity aging trend and correlation to initial cell performance. J. Power Sources 247, 332–338. doi:10.1016/j.jpowsour.2013.08.108
Beck, D., Dechent, P., Junker, M., Sauer, D. U., and Dubarry, M. (2021). Inhomogeneities and cell-to-cell variations in lithium-ion batteries, a review. Energies (Basel) 14 (11), 3276. doi:10.3390/en14113276
Beltran, H., Ayuso, P., and Pérez, E. (2020). Lifetime expectancy of Li-ion batteries used for residential solar storage. Energies (Basel) 13 (3), 568. doi:10.3390/en13030568
Berecibar, M., Devriendt, F., Dubarry, M., Villarreal, I., Omar, N., Verbeke, W., et al. (2016). Online state of health estimation on NMC cells based on predictive analytics. J. Power Sources 320, 239–250. doi:10.1016/j.jpowsour.2016.04.109
Chen, L., An, J., Wang, H., Zhang, M., and Pan, H. (2020). Remaining useful life prediction for lithium-ion battery by combining an improved particle filter with sliding-window gray model. Energy Rep. 6, 2086–2093. doi:10.1016/j.egyr.2020.07.026
Devie, A., Baure, G., and Dubarry, M. (2018). Intrinsic variability in the degradation of a batch of commercial 18650 lithium-ion cells. Energies (Basel) 11 (5), 1031. doi:10.3390/en11051031
Dubarry, M., Baure, G., and Anseán, D. (2020). Perspective on state-of-health determination in lithium-ion batteries. J. Electrochem. Energy Convers. Storage 17 (4). doi:10.1115/1.4045008
Fermín-Cueto, P., McTurk, E., Allerhand, M., Medina-Lopez, E., Anjos, M. F., Sylvester, J., et al. (2020). Identification and machine learning prediction of knee-point and knee-onset in capacity degradation curves of lithium-ion cells. Energy AI 1, 100006. doi:10.1016/j.egyai.2020.100006
Gasper, P., Gering, K., Dufek, E., and Smith, K. (2021). Challenging practices of algebraic battery life models through statistical validation and model identification via machine-learning. J. Electrochem. Soc. 168 (2), 020502. doi:10.1149/1945-7111/abdde1
Guo, J., Li, Z., and Pecht, M. (2015). A Bayesian approach for Li-Ion battery capacity fade modeling and cycles to failure prognostics. J. Power Sources 281, 173–184. doi:10.1016/j.jpowsour.2015.01.164
Harlow, J. E., Ma, X., Li, J., Logan, E., Liu, Y., Zhang, N., et al. (2019). A wide range of testing results on an excellent lithium-ion cell chemistry to be used as benchmarks for new battery technologies. J. Electrochem. Soc. 166 (13), A3031–A3044. doi:10.1149/2.0981913jes
He, W., Williard, N., Osterman, M., and Pecht, M. (2011). Prognostics of lithium-ion batteries based on Dempster-Shafer theory and the Bayesian Monte Carlo method. J. Power Sources 196 (23), 10314–10321. doi:10.1016/j.jpowsour.2011.08.040
Hong, J., Lee, D., Jeong, E. R., and Yi, Y. (2020). Towards the swift prediction of the remaining useful life of lithium-ion batteries with end-to-end deep learning. Appl. Energy 278, 115646. doi:10.1016/j.apenergy.2020.115646
Hu, C., Jain, G., Schmidt, C., Strief, C., and Sullivan, M. (2015). Online estimation of lithium-ion battery capacity using sparse Bayesian learning. J. Power Sources 289, 105–113. doi:10.1016/j.jpowsour.2015.04.166
James, G., Witten, D., Hastie, T., and Tibshirani, R. (2013). An introduction to statistical learning, 112. New York: Springer.
Juarez-Robles, D., Jeevarajan, J. A., and Mukherjee, P. P. (2020). Degradation-safety analytics in lithium-ion cells: Part I. Aging under charge/discharge cycling. J. Electrochem. Soc. 167 (16), 160510. doi:10.1149/1945-7111/abc8c0
Khumprom, P., and Yodo, N. (2019). A data-driven predictive prognostic model for lithium-ion batteries based on a deep learning algorithm. Energies (Basel). 12 (4), 660. doi:10.3390/en12040660
Li, F., and Xu, J. (2015). A new prognostics method for state of health estimation of lithium-ion batteries based on a mixture of Gaussian process models and particle filter. Microelectron. Reliab. 55 (7), 1035–1045. doi:10.1016/j.microrel.2015.02.025
Li, W., Sengupta, N., Dechent, P., Howey, D., Annaswamy, A., and Sauer, D. U. (2021). One-shot battery degradation trajectory prediction with deep learning. J. Power Sources 506, 230024. doi:10.1016/j.jpowsour.2021.230024
Liu, D., Zhou, J., Pan, D., Peng, Y., and Peng, X. (2015). Lithium-ion battery remaining useful life estimation with an optimized Relevance Vector Machine algorithm with incremental learning. Meas. (Lond) 63, 143–151. doi:10.1016/j.measurement.2014.11.031
Liu, J., Saxena, A., Goebel, K., Saha, B., and Wang, W. (2010). “An adaptive recurrent neural network for remaining useful life prediction of lithium-ion batteries,” in Conference of the Prognostics and Health Management Society, Portland, Oregon, October 10–16, 2010.
Long, B., Xian, W., Jiang, L., and Liu, Z. (2013). An improved autoregressive model by particle swarm optimization for prognostics of lithium-ion batteries. Microelectron. Reliab. 53 (6), 821–831. doi:10.1016/j.microrel.2013.01.006
Ma, Y., Wu, L., Guan, Y., and Peng, Z. (2020). The capacity estimation and cycle life prediction of lithium-ion batteries using a new broad extreme learning machine approach. J. Power Sources 476, 228581. doi:10.1016/j.jpowsour.2020.228581
Mansouri, S. S., Karvelis, P., Georgoulas, G., and Nikolakopoulos, G. (2017). “Remaining useful battery life prediction for UAVs based on machine learning,” in IFAC-PapersOnLine (Elsevier B.V.), 4727–4732. doi:10.1016/j.ifacol.2017.08.863
Mohtat, P., Lee, S., Siegel, J. B., and Stefanopoulou, A. G. (2021). Reversible and irreversible expansion of lithium-ion batteries under a wide range of stress factors. J. Electrochem. Soc. 168 (10), 100520. doi:10.1149/1945-7111/ac2d3e
Ng, M. F., Zhao, J., Yan, Q., Conduit, G. J., and Wei Seh, Z. (2020). Predicting the state of charge and health of batteries using data-driven machine learning. Nat. Mach. Intell. 2, 161–170. doi:10.1038/s42256-020-0156-7
Ning, G., White, R. E., and Popov, B. N. (2006). A generalized cycle life model of rechargeable Li-ion batteries. Electrochim. Acta 51 (10), 2012–2022. doi:10.1016/j.electacta.2005.06.033
Nuhic, A., Terzimehic, T., Soczka-Guth, T., Buchholz, M., and Dietmayer, K. (2013). Health diagnosis and remaining useful life prognostics of lithium-ion batteries using data-driven methods. J. Power Sources 239, 680–688. doi:10.1016/j.jpowsour.2012.11.146
Ouyang, M., Feng, X., Han, X., Lu, L., Li, Z., and He, X. (2016). A dynamic capacity degradation model and its applications considering varying load for a large format Li-ion battery. Appl. Energy 165, 48–59. doi:10.1016/j.apenergy.2015.12.063
Patil, M. A., Tagade, P., Hariharan, K. S., Kolake, S. M., Song, T., Yeo, T., et al. (2015). A novel multistage Support Vector Machine based approach for Li ion battery remaining useful life estimation. Appl. Energy 159, 285–297. doi:10.1016/j.apenergy.2015.08.119
Paulson, N. H., Kubal, J., Ward, L., Saxena, S., Lu, W., and Babinec, S. J. (2022). Feature engineering for machine learning enabled early prediction of battery lifetime. J. Power Sources 527, 231127. doi:10.1016/j.jpowsour.2022.231127
Pedregosa, F., Michel, V., Grisel, O., Blondel, M., Prettenhofer, P., Weiss, R., et al. (2011). Scikit-learn: Machine learning in Python. J. Mach. Learn. Res. 12, 2825–2830. Available at: http://scikit-learn.sourceforge.net.
Ren, L., Zhao, L., Hong, S., Zhao, S., Wang, H., and Zhang, L. (2018). Remaining useful life prediction for lithium-ion battery: A deep learning approach. IEEE Access 6, 50587–50598. doi:10.1109/access.2018.2858856
Richardson, R. R., Osborne, M. A., and Howey, D. A. (2017). Gaussian process regression for forecasting battery state of health. J. Power Sources 357, 209–219. doi:10.1016/j.jpowsour.2017.05.004
Rumpf, K., Naumann, M., and Jossen, A. (2017). Experimental investigation of parametric cell-to-cell variation and correlation based on 1100 commercial lithium-ion cells. J. Energy Storage 14, 224–243. doi:10.1016/j.est.2017.09.010
Safari, M., and Delacourt, C. (2011). Simulation-based analysis of aging phenomena in a commercial graphite/LiFePO4 cell. J. Electrochem. Soc. 158 (12), A1436. doi:10.1149/2.103112jes
Saha, B., and Goebel, K. (2007). Battery data setMoffett Field, CA: NASA Ames Research Center. NASA AMES prognostics data repository.
Schmalstieg, J., Käbitz, S., Ecker, M., and Sauer, D. U. (2013). “From accelerated aging tests to a lifetime prediction model: Analyzing lithium-ion batteries,” in 2013 World Electric Vehicle Symposium and Exhibition (EVS27), Barcelona, Spain, 17-20 November 2013. doi:10.1109/EVS.2013.6914753
Sendek, A. D., Ransom, B., Cubuk, E. D., Pellouchoud, L. A., Nanda, J., and Reed, E. J. (2022). Machine learning modeling for accelerated battery materials design in the small data regime. Adv. Energy Mater. 12, 2200553. doi:10.1002/aenm.202200553
Severson, K. A., Attia, P. M., Jin, N., Perkins, N., Jiang, B., Yang, Z., et al. (2019). Data-driven prediction of battery cycle life before capacity degradation. Nat. Energy 4 (5), 383–391. doi:10.1038/s41560-019-0356-8
Shen, S., Nemani, V., Liu, J., Hu, C., and Wang, Z. (2020). “A hybrid machine learning model for battery cycle life prediction with early cycle data,” in 2020 IEEE Transportation Electrification Conference & Expo (ITEC), Chicago, IL, USA, 23-26 June 2020. doi:10.1109/ITEC48692.2020.9161647
Song, Y., Liu, D., Yang, C., and Peng, Y. (2017). Data-driven hybrid remaining useful life estimation approach for spacecraft lithium-ion battery. Microelectron. Reliab. 75, 142–153. doi:10.1016/j.microrel.2017.06.045
Strange, C., and dos Reis, G. (2021). Prediction of future capacity and internal resistance of Li-ion cells from one cycle of input data. Energy AI 5, 100097. doi:10.1016/j.egyai.2021.100097
Sulzer, V., Mohtat, P., Aitio, A., Lee, S., Yeh, Y. T., Steinbacher, F., et al. (2021). The challenge and opportunity of battery lifetime prediction from field data. Joule 5, 1934–1955. doi:10.1016/j.joule.2021.06.005
Sulzer, V., Mohtat, P., Lee, S., Siegel, J. B., and Stefanopoulou, A. G. (2020). Promise and challenges of a data-driven approach for battery lifetime prognostics. Available at: http://arxiv.org/abs/2010.07460.
Sun, S., Guan, T., Cheng, X., Zuo, P., Gao, Y., Du, C., et al. (2018). Accelerated aging and degradation mechanism of LiFePO4/graphite batteries cycled at high discharge rates. RSC Adv. 8 (45), 25695–25703. doi:10.1039/c8ra04074e
Susilo, D. D., Widodo, A., Prahasto, T., and Nizam, M. (2018). “State of health estimation of lithium-ion batteries based on combination of Gaussian distribution data and least squares support vector machines regression,” in Materials science forum (Trans Tech Publications Ltd), 93–102. doi:10.4028/www.scientific.net/MSF.929.93
Tseng, K. H., Liang, J. W., Chang, W., and Huang, S. C. (2015). Regression models using fully discharged voltage and internal resistance for state of health estimation of lithium-ion batteries. Energies (Basel) 8 (4), 2889–2907. doi:10.3390/en8042889
Venugopal, P., and Vigneswaran, T. (2019). State-of-health estimation of Li-ion batteries in electric vehicle using InDRNN under variable load condition. Energies (Basel) 12 (22), 4338. doi:10.3390/en12224338
Wang, Z., Ma, J., and Zhang, L. (2017). State-of-Health estimation for lithium-ion batteries based on the multi-island genetic algorithm and the Gaussian process regression. IEEE Access 5, 21286–21295. doi:10.1109/access.2017.2759094
Weng, A., Mohtat, P., Attia, P. M., Sulzer, V., Lee, S., Less, G., et al. (2022). Predicting the impact of formation protocols on battery lifetime immediately after manufacturing. Available at: http://arxiv.org/abs/2203.14158.
Wu, J., Wang, Y., Zhang, X., and Chen, Z. (2016). A novel state of health estimation method of Li-ion battery using group method of data handling. J. Power Sources 327, 457–464. doi:10.1016/j.jpowsour.2016.07.065
Xing, Y., Ma, E. W. M., Tsui, K. L., and Pecht, M. (2013). An ensemble model for predicting the remaining useful performance of lithium-ion batteries. Microelectron. Reliab. 53 (6), 811–820. doi:10.1016/j.microrel.2012.12.003
Keywords: open access, machine learning, battery lifetime prediction, diverse data, model extensibility
Citation: Schauser NS, Lininger CN, Leland ES and Sholklapper TZ (2022) An open access tool for exploring machine learning model choice for battery life cycle prediction. Front. Energy Res. 10:1058999. doi: 10.3389/fenrg.2022.1058999
Received: 30 September 2022; Accepted: 25 October 2022;
Published: 09 November 2022.
Edited by:
Shrihari Sankarasubramanian, University of Texas at San Antonio, United StatesReviewed by:
Masaki Adachi, University of Oxford, United KingdomThiagarajan Soundappan, Navajo Technical University, United States
Copyright © 2022 Schauser, Lininger, Leland and Sholklapper. This is an open-access article distributed under the terms of the Creative Commons Attribution License (CC BY). The use, distribution or reproduction in other forums is permitted, provided the original author(s) and the copyright owner(s) are credited and that the original publication in this journal is cited, in accordance with accepted academic practice. No use, distribution or reproduction is permitted which does not comply with these terms.
*Correspondence: Nicole S. Schauser, bmljb2xlQHZvbHRhaXEuY29t