 Osama A. Alghamdi1Abdullah Ali Alhussainy1,2,3
 Sultan Alghamdi1,3
 Kareem M. AboRas3*
 Muhyaddin Rawa1,2,3*Abdullah M. Abusorrah1,2,3Yusuf A. Alturki1,3
- 1Department of Electrical and Computer Engineering, Faculty of Engineering, King Abdulaziz University, Jeddah, Saudi Arabia
- 2K. A. CARE Energy Research and Innovation Center, King Abdulaziz University, Jeddah, Saudi Arabia
- 3Smart Grids Research Group, Center of Research Excellence in Renewable Energy and Power Systems, King Abdulaziz University, Jeddah, Saudi Arabia
The world’s attention is increasingly focused on the growing need to diversify energy sources. Saudi Arabia is under natural pressure to seize the opportunity in the renewable energy sector. Since renewable natural resources such as wind and solar energy are less expensive and environmentally friendly, most countries like to move away from the use of fossil fuels. This paper focuses on a techno-economic-environmental study of supplying Yanbu city in Saudi Arabia with a hybrid energy system consisting of solar energy, wind energy, and storage batteries. This has been carried out by considering an off-grid system or a system connected to the grid. In order to find the best solution from technical, economic, and environmental perspectives to supply the city, 15 options were considered. Photovoltaic (PV) and wind turbines (WT) connected to a grid make up the grid-connected system. The off-grid system considers the development of a load profile for Yanbu city. In both systems, an energy storage system (ESS) is essential (off-grid and grid-connected). The results show that the 850-MW PV system connected to the grid without an ESS is the best option both economically and technically.
1 Introduction
The Kingdom of Saudi Arabia has the natural capability and capacity to play a key role in and lead the renewable energy industry. It possesses the economic and environmental elements required to produce different forms of renewable energy. This provides significant growth potential for preserving current resources, achieving balance, meeting the needs of future generations, and achieving long-term economic growth.
By 2030, Saudi Arabia wants to attain the environmentally friendly, optimal, most efficient, and least expensive energy mix in the production of electricity by replacing liquid fuel with natural gas and renewables, which will each account for half of the energy mix. Figure 1 shows the location of Yanbu City in Saudi Arabia Map. This helps in the localization of manufacturing solar and wind energy components, the advancement of their technologies, and the development of national human cadres. Solar energy and wind energy are the most common renewable energy sources, and they are preferable to traditional energy sources since they are clean energy. In both grid-connected and off-grid power systems, these two energy sources received great attention.
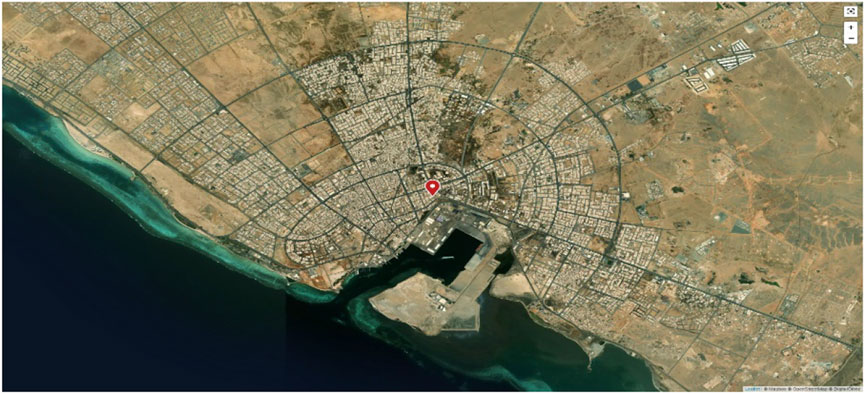
FIGURE 1. Map of Yanbu city.
Global warming has caused a significant rise in temperature over the years, leading to changes in climatic conditions throughout the world. The climatic changes have brought new challenges in the form of heavy rains, flooding, and heavy cyclones generally in the entire world and, more specifically, in the countries most vulnerable to abrupt climatic changes (Shafiq et al., 2022).
On the other hand, to deal with global warming, a swift transition toward renewable power generation is the top priority at the global level. Thus, a common question among the research community is how to make the power system more resilient and reliable while utilizing renewable energy resources under prolonged harsh weather conditions that cause faults and blackouts (Iqbal et al., 2022a).
Solar energy can be converted into electricity using the PV effect or into heat energy using the solar thermal effect. The wind is always blowing somewhere because of the Earth’s varying temperatures and pressure, and locational factors such as geography and terrain also play a role. The wind’s kinetic energy can be harnessed by wind converters, called wind turbines, and transformed it into usable electrical or mechanical power (Iqbal et al., 2022b).
One of the most important parts of a hybrid solar PV and wind system is energy storage, which is utilized to store excess energy until needed. This paper presents a techno-economic-environmental study of more than 10 cases of PV/wind/battery grid-connected and off-grid systems for supplying Yanbu city with the best energy solution possible using renewable energy sources.
2 Literature review
Assorted studies have been conducted to find the optimal renewable sources based on the availability of renewable energy with different techniques (Mohamed et al., 2015). Utilizing iterative optimization to size an off-grid hybrid PV/wind/diesel/battery energy system, the researchers’ main objective was to find the optimum size of each component for the cheapest produced energy and the cheapest dummy energy at the maximum level of reliability, and they used 10 types of wind turbines to choose the best type (Shambhu et al., 2021). This study provides two optimal options for each on-grid and off-grid case for fully renewable energy and diversified energy. Twenty-four solutions were given, and the results indicate that a PV/wind/grid combination with an energy cost of $0.044 is the best option for Willingdon Island. Alharthi et al. (2018) tried a similar approach using different renewable energy sources as a solution to the continuous use of fossil fuels as the primary source of power, which increases the operational environmental effect of electricity generation, and the suggested grid-connected solar PV/wind hybrid system is both economically and environmentally viable. Rezk et al. (2020) followed the same approach but with various sources using off-grid PV/fuel-cell/battery hybrid energy systems.
There are various research studies on different tracking techniques. Mubaarak et al. (2020) studied a combination of grid-connected PV/fuel-cell hybrid systems applying major types of PV tracking techniques, and the results showed that the vertical single-axis tracker was the best choice. In another study, Kaddoura et al. (2016) performed Sun tracking in different cities in Saudi Arabia to find the optimum tilt: for example, in Jeddah, during the summer months, the Sun will be in the northern path, so PV panels should be tilted to the north, but in winter, the Sun will be in the southern path, and we can find the optimum annual fixed tilt between them (Sinha and Chandel, 2014; Malik et al., 2022).
Bahramara et al. (2016) and Konneh et al. (2021) carried out different techniques with different components such as scheduling strategies, PV modules, and solar-tracking systems in a hybrid off-grid system with each scenario including a scheduling strategy, a Sun-tracking system, and a specific type of PV module. Also, the results could vary with different approaches to the maximum PV obtained using a two-axis tracking system (Zhang et al., 2022).
For scheduling, a diesel generator operating only during the rainy season with the Canadian Solar Dymond PV module was considered the best approach in the study. The goal of the study by Sinha and Chandel (2014) was to use the Hybrid Optimization Model for Electric Renewables (HOMER) software to determine the optimal type of solar PV for use in Sudan.
The aforementioned studies were specific to a location or a region. The literature review shows the potential of solar and wind energy by using different techniques to make them more viable and cost-effective.
3 Methodology and component formulation
This section focuses on the design and method principles of the system under consideration. In this study, we used HOMER software to explore an ideal solution for the city to evaluate the possibility of implementing renewable energy systems to minimize challenges connected to power affordability, dependability, and accessibility. We later discuss 15 cases in this section.
As inputs, the HOMER model requires factors, including the data of all renewables, the load profile, the cost of the energy sources, dispatch techniques, and economic limitations.
3.1 Location and load profile
Yanbu is a city situated to the east of Saudi Arabia and to the north of Jeddah. It is located on the coast of the Red Sea at latitude 24.186848 and longitude 38.026428. The city has a population reaching nearly 200,000 (Louai et al., 2013).
Modeling of the load profile is an essential part of creating the electrical sources and identifying the ideal scenario.
The load profile for Yanbu city was created by assuming a seasonal change of 40%, a day and night change of 10%, and a load change at weekends and workdays of 50%. These assumptions were made on the basis of the energy consumption behavior of Saudi Arabia (The Ministry of Energy, 2022), and the following graph was drawn. The average load consumption is 200,000 kWh/day, the peak demand is 21,912.2 kW, and the average load is 8,333.3 kW. The maximum load in the summer months (March–August) and the minimum load in the winter months (September–February) are shown in Figure 2.
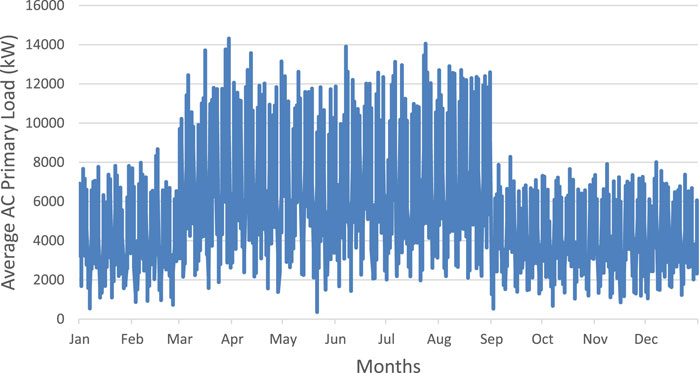
FIGURE 2. Annual average AC primary load (The Ministry of Energy, 2022).
3.2 Solar and temperature resources
Solar irradiation and ambient temperature are generated automatically using HOMER and obtained from the NASA website. The yearly average solar radiation is 5.90 kWh/m2/day. The optimal solar radiation was recorded in June at 7.490 kWh/m2/day, while the lowest solar radiation was recorded in December at 4.020 kWh/m2/day. We determine the average clearness index to be .642 (Figure 3A).
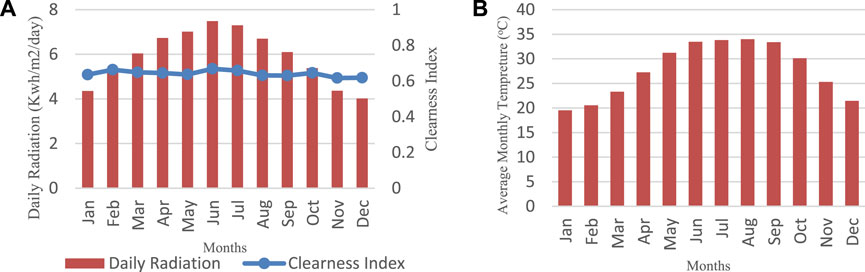
FIGURE 3. (A) Annual daily radiation and clearness index; (B) annual average temperature (The Ministry of Energy, 2022).
The annual average ambient temperature was 27.79°C, the highest temperature was recorded in summer months at 33.99oC, and the lowest temperature was recorded in winter months at 19.540oC (Figure 3B).
According to the collected data, the area has a significant amount of solar potential, and the temperature of the surrounding environment is suitable for the installation of photovoltaic (PV) panels (The Ministry of Energy, 2022).
3.3 Wind recourses
Wind speeds are generated automatically using HOMER and were obtained from the NASA website; it was recorded 50 m above the surface and found that wind is usually consistent throughout the year. June is the windiest month with a wind speed of 5.180 m/s, and October is the least windy month with a wind speed of 4.070 m/s. The annual average wind speed was found to be 4.72 m/s, as shown in Figure 4.
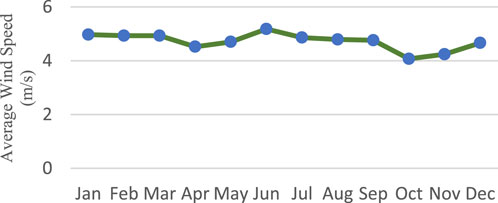
FIGURE 4. Annual average wind speed (The Ministry of Energy, 2022).
3.4 System design and component parameters
The components used in this study are a wind turbine, PV, ESS, converter, and grid. The schematic description is shown in Figure 5. We used a standalone (off-grid) hybrid renewable system with an ESS, and the capacity of renewable energy should be 500 MW to supply the load and charge the battery. Figure 6 is a schematic description of a hybrid microgrid without an ESS, and the capacity of renewable energy should be 850 MW according to the National Renewable Energy Program of Saudi Arabia to supply the load and sell the excess energy to the national grid. Figure 7 is a schematic description of a hybrid microgrid with an ESS, and the capacity of renewable energy should be 850 MW, the same as that of the hybrid microgrid without an ESS. The battery will utilize 250 MW, the remaining 600 MW will be used to supply the load and charging the battery, and the excess energy will be sold back to the grid. Each of these three categories will have five different combinations with varied sizes, with a total of 15 systems to choose the optimal one.
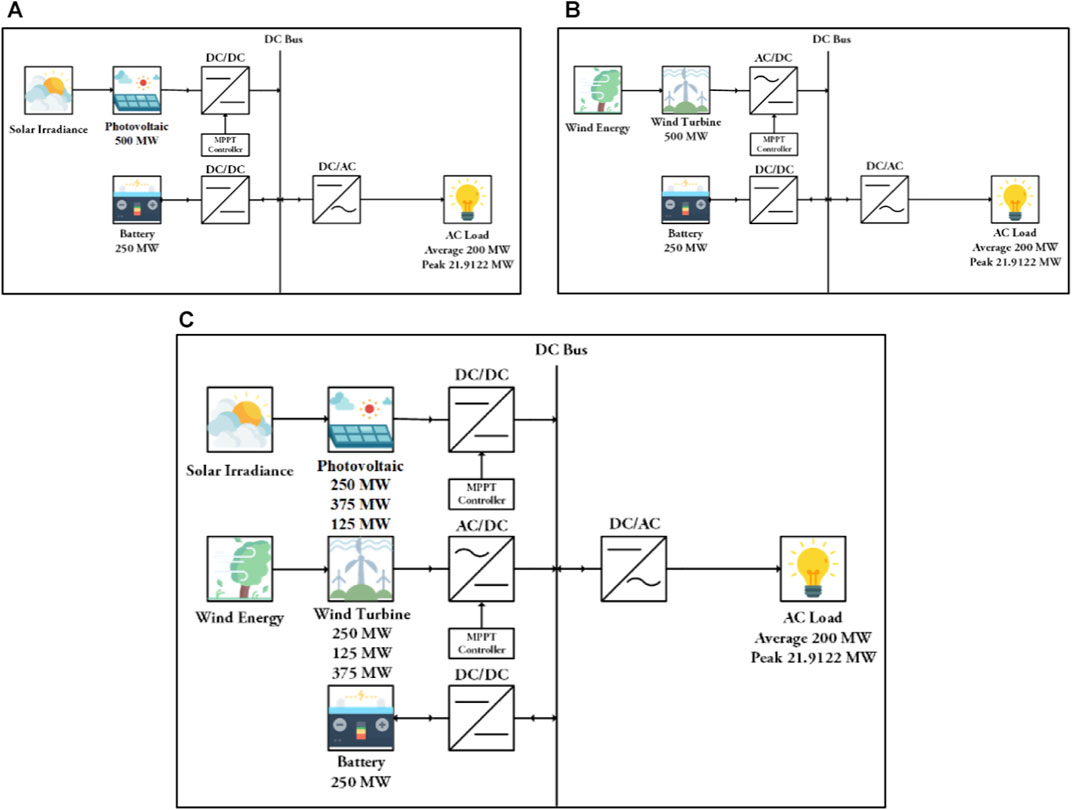
FIGURE 5. Standalone (off-grid) hybrid renewable system with an ESS. (A) PV and battery off-grid connected; (B) wind turbine and battery off-grid connected; (C) PV, wind turbine, and battery off-grid connected with PVs and wind turbines of three different capacities.
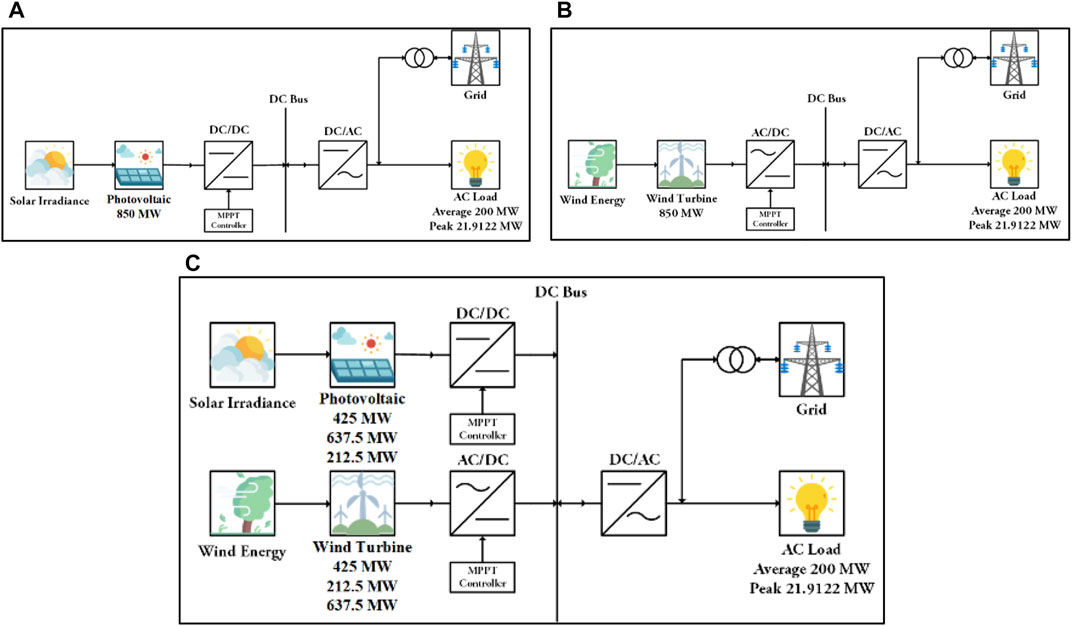
FIGURE 6. Hybrid microgrid without an ESS. (A) PV on-grid connected; (B) wind turbine on-grid connected; (C) PV and wind turbine on-grid connected with PVs and wind turbines of three different capacities.
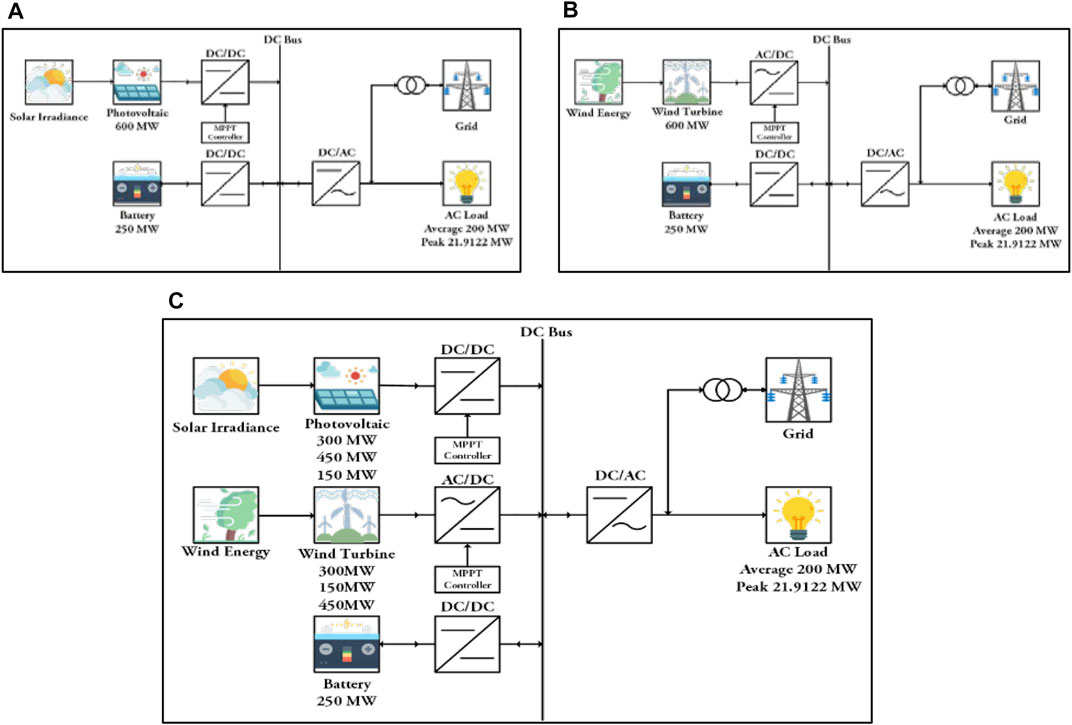
FIGURE 7. Hybrid microgrid with an ESS. (A) PV and battery on-grid connected; (B) wind turbine and battery on-grid connected; (C) PV, wind turbine, and battery on-grid connected with PVs and wind turbines of three different capacities.
The techno-economic parameters for each component are shown in Table 1.
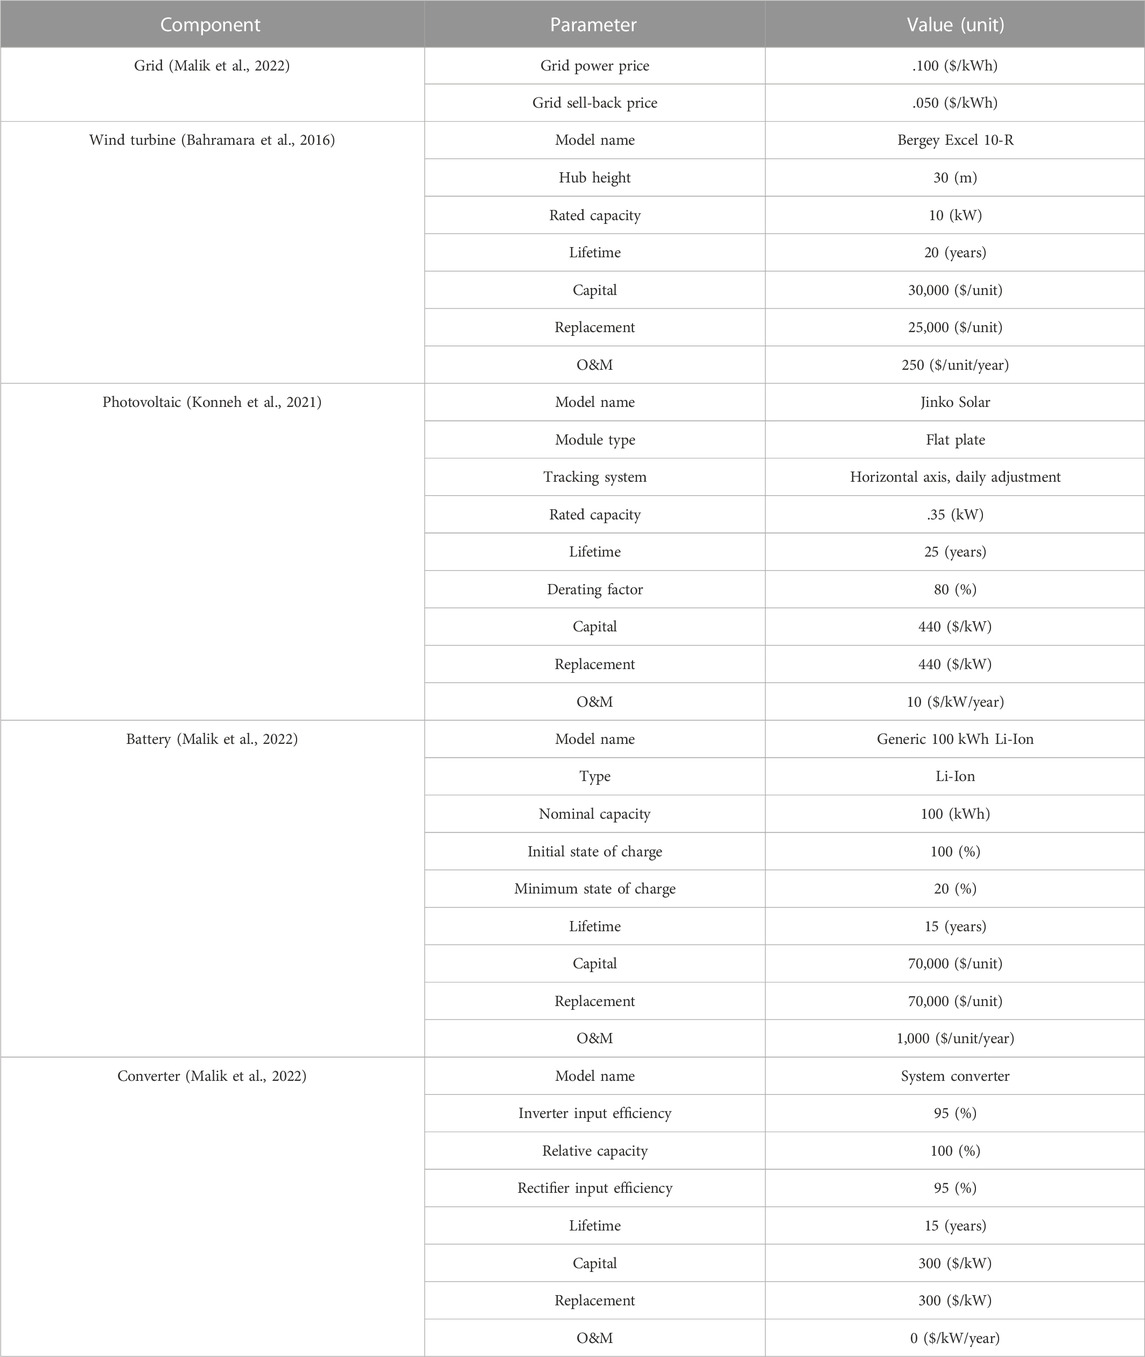
TABLE 1. Components of the system and their parameters (Iqbal et al., 2022a).
3.5 Mathematical configuration
3.5.1 Modeling the photovoltaic module
PV modules are used to convert solar radiation into direct current electrical energy. The output of the PV array can be calculated with the help of HOMER, 2018 by using the following equation (Fadlallah and Serradj, 2020):
where
The temperature of the PV array surface is equivalent to the temperature of the PV cells. It is the same as the temperature outside during the night, but when the Sun is up, the temperature inside the cell might be at least 30°C higher than the temperature outside, and it is calculated using the following equation (Awan et al., 2022):
where τ is the solar transmittance of any cover over the PV array; α is the solar absorptance of the PV array; ηc is the electrical conversion efficiency of the PV array;
3.5.2 Modeling the wind turbine module
Using a method consisting of three stages, HOMER determines the amount of electricity generated by the wind turbine during each time step. First, HOMER determines the speed of the wind at the hub height of the wind turbine. Then, it determines the amount of electricity generated by the wind turbine when the wind is blowing at the given speed and the air density is constant. Finally, HOMER makes the necessary adjustments to the power output figure to account for the real air density. The following equation is used by HOMER to determine the wind speed at the hub height (Cetinbas et al., 2019):
where
3.5.3 Economic mathematics
The entire net present cost (NPC) of a system is its lifetime costs minus its lifetime earnings. Capital, replacement, operation and maintenance (O&M), fuel, emission penalties, and grid electricity expenditures are included. Revenues include salvage and grid sales. The following equation is used to determine a system’s total NPC (The Excel 10 kWWind Power 2013):
where
Levelized cost of energy, also known as COE, is the average cost incurred per kilowatt-hour of the system’s production of usable electrical energy. Using the following equation, one can determine the COE by dividing the annualized cost
3.6 Control dispatch
The battery bank operates according to the dispatch plan. Cycle charging and load following are HOMER’s dispatch techniques. The ideal solution relies on various parameters, including battery bank sizes, the quantity of renewable power in the system, and renewable resources.
1) Load-following strategy (LF) generators only create enough electricity to satisfy the principal load. Renewable power sources charge the storage bank. The generator may ramp up and sell electricity to the grid if it is profitable.
2) Cycle charging approach (CC) generators run at full power while serving the principal load. In a sequence of decreasing importance, surplus electricity generation serves the storage bank.
When a set-point state of charge is applied to the cycle charging strategy, the storage state of charge is below the set point and not discharged in the preceding time step. The main load and storage bank are powered by a generator. So, the machine keeps charging the storage bank until it reaches the predefined point (Sohoni et al., 2019; Saidani et al., 2021).
4 Results and discussion
Figure 8 shows the net present cost (NPC), wherein the present value is equal to the difference between the present value of the component’s expected revenues and the present value of all expenses associated with installing and running the component during the duration of the project. The result shows that the PV on-grid system with a capacity of 850 MW has the lowest value and the WT on-grid system with a capacity of 850 MW has the highest value.
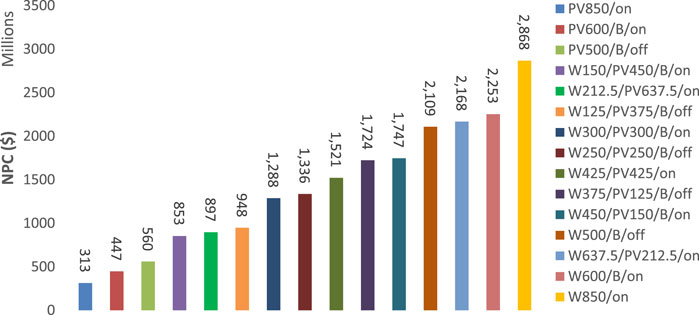
FIGURE 8. Net present cost of all systems.
Figure 9 shows the cost of energy (COE) calculated by dividing the yearly cost of energy production by the total load served. The results show that the WT with an ESS off-grid system with the capacity of 500 MW, the WT with the capacity of 375 MW, and the PV with an ESS off-grid system with the capacity of 125 MW have the lowest value, and the PV on-grid system with the capacity of 850 MW has the highest value.

FIGURE 9. Cost of energy of all systems.
The operating cost shown in Figure 10 is the yearly value of everything apart from capital cost and includes the salvage value, which is a component’s worth at the project’s conclusion. The results show that the PV 850-MW on-grid system had the lowest value and the WT with an ESS off-grid system with the capacity of 500 MW has the highest value.
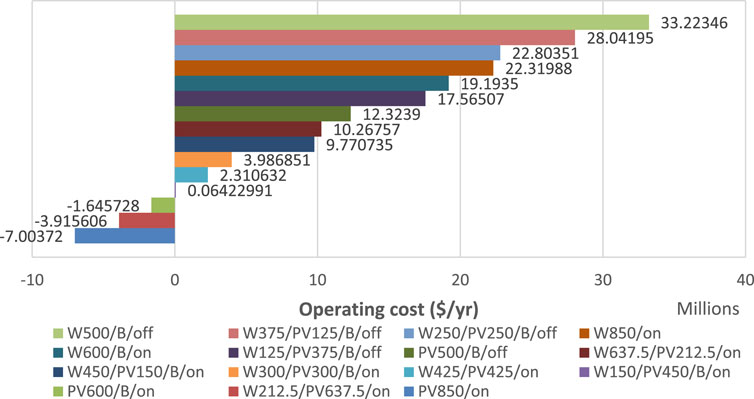
FIGURE 10. Operating cost of all systems.
The initial capital shown in Figure 11 is the entire cost of installing the components at the start of the project. The PV with an ESS off-grid system with the capacity of 500 MW and the PV on-grid system with the capacity of 850 MW have the lowest values of $401 million and $404 million, respectively. The WT on-grid system with the capacity of 850 MW has the highest value of $2,580 million.
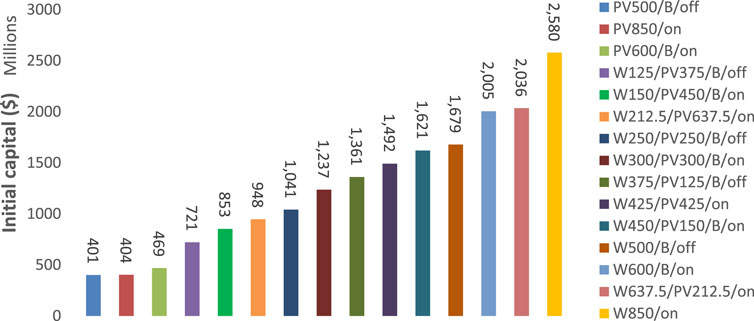
FIGURE 11. Initial capital of all systems.
The O&M shown in Figure 12 is the total cost of operating and maintaining all components, while the grid O&M cost is the yearly cost of purchasing and selling electricity from the grid. High values are obtained for the off-grid systems since there are no revenues from the grid, especially for the WT with an ESS with the capacity of 500 MW having the highest value and the WT with a capacity of 212.5 MW and the PV with a capacity of 637.5 MW on-grid systems having the lowest value.
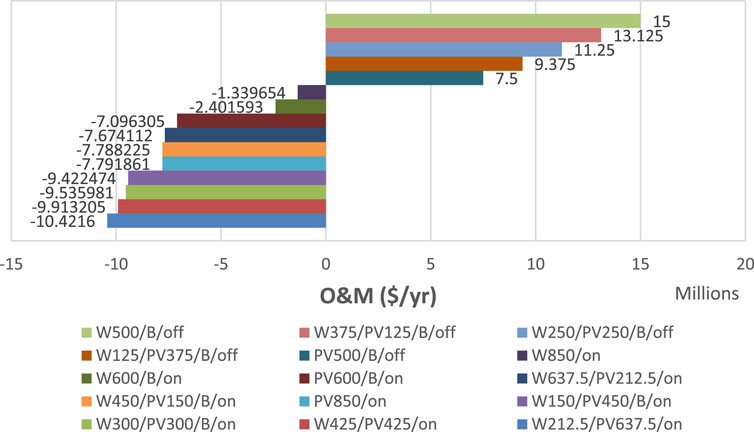
FIGURE 12. Operation and maintenance of all systems.
According to the economic criteria shown in Figures 8–12, the best option considering NPC, COE, and operating cost is a PV grid-connected system without an ESS with a capacity of 850 MW having the least value. The optimal system considering initial capital is a PV grid-connected system with an ESS with a capacity of 600 MW having a value close to the previous system. Considering O&M, a hybrid system with a wind capacity of 212.5 MW and PV of 637.5 MW without an ESS is the best option.
According to the technical criteria shown in Figures 13–16, renewable fraction is the percentage of load energy from renewable sources. The off-grid systems have the maximum renewable energy fraction and close to them is a hybrid microgrid system consisting of a wind turbine with a capacity of 637.5 MW and a PV without an ESS with a capacity of 212.5 MW. The PV without an ESS with the capacity of 850 MW on the grid-connected system produces maximum electricity and excess energy.
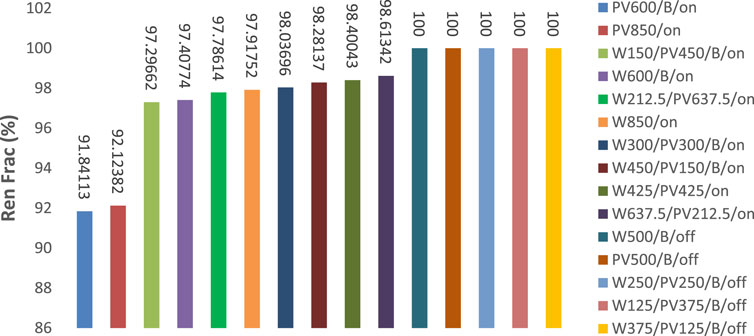
FIGURE 13. Renewable fraction of all systems.
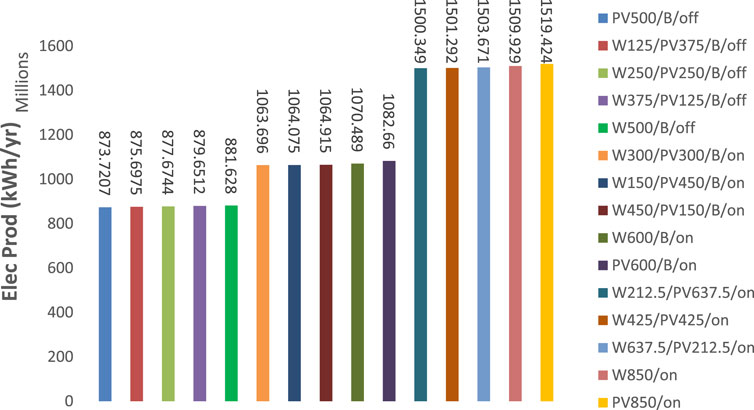
FIGURE 14. Electricity production of all systems.
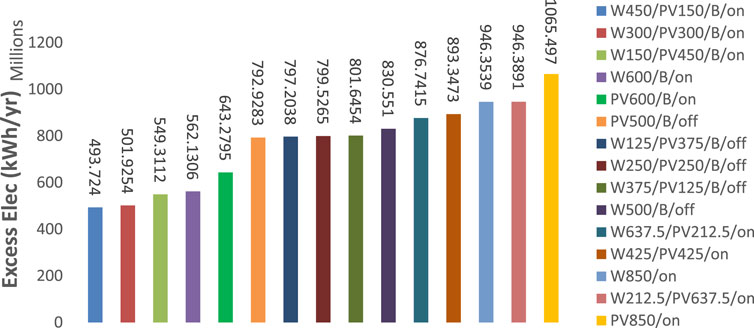
FIGURE 15. Excess electricity production of all systems.
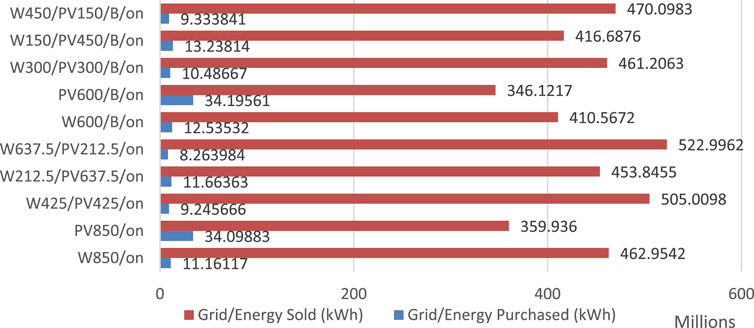
FIGURE 16. Energy sold and purchased from the grid to all grid-connected systems.
Figure 13 shows the renewable fraction of all systems calculated as the amount of the load’s energy consumption met by renewable sources. The off-grid systems have 100% use of renewable sources, and the least percentage of 91.8% is achieved by the PV with an ESS on-grid system with the capacity of 600 MW.
The total electricity production of all systems is shown in Figure 14. It is observed that the off-grid systems show the highest production of electricity, and the on-grid systems without batteries show the least electricity production.
Figure 15 shows the excess electricity produced by all systems that cannot be used to power a load or charge batteries and has to be discarded when there is more power than the batteries can hold. The PV on-grid system with the capacity of 850 MW produces the highest excess electricity, and the WT with the capacity of 450 MW and the PV with the capacity of 150 MW with an ESS on-grid system produces the lowest excess electricity.
Figure 16 shows the amount of electricity bought and sold from the grid as a whole. The WT with the capacity of 637.5 MW and the PV with the capacity of 212.5 MW on-grid system have the highest sales and lowest purchase of electricity from the grid. The PV with the capacity of 600 MW with an ESS on-grid system has the lowest sales and highest purchase of electricity from the grid.
There are advantages and disadvantages in selecting the optimal option for the grid. From economic and technical perspectives, the PV850/on-grid without an ESS is the best option but has high grid purchases and low sales. The system that has the lowest grid purchase and highest sales is a hybrid microgrid with a WT of 637.5 MW and PV of 212.5 MW without an ESS.
Lastly, we let HOMER search for the optimal system and size according to the Yanbu load profile shown in Figure 2, and the results show that the PV on-grid system has the best component combination and PV capacity of 179.168 MW. Table 2 shows all previous results of both economic and technical criteria for the optimal system.
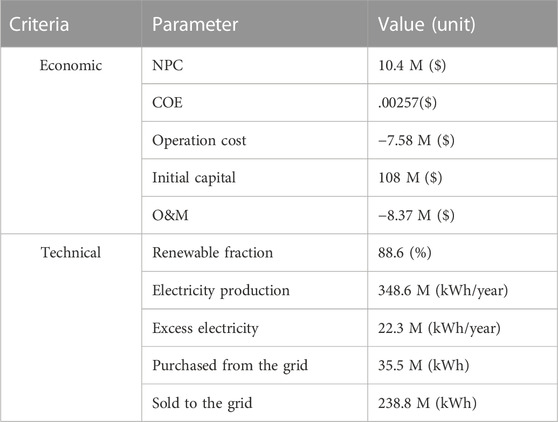
TABLE 2. Results of the optimal 179.168-MW PV on-grid system.
5 Conclusion
The purpose of this research was to determine the best possible layout from among 15 systems for Yanbu city that will allow for a steady supply of renewable energy to be provided at the lowest possible cost. The simulated results of different combinations of grid-connected units are derived using HOMER. Solar energy is the primary power source at this grid-connected site, and when solar energy is unavailable, the electric grid and battery bank will deliver power to the load. As a result, the grid-connected PV panel is the most cost-effective and efficient alternative. The HOMER tool will simulate hundreds of results in total. According to the optimization results, the PV on-grid system without an ESS and with a capacity of 850 MW is the optimal solution from an economic and technical perspective. In addition, the hybrid microgrid with 637.5 MW WT and 212.5 MW PV without an ESS is the best choice considering the grid sales and purchase. The number of choices depends on the selection criteria.
Data availability statement
The original contributions presented in the study are included in the article/Supplementary Material, further inquiries can be directed to the corresponding authors.
Author contributions
Conceptualization: OA, AA, and SA; methodology: OA, SA, MR, and AA; software: OA, KA, and MR; validation: OA, AA, and SA; investigation: KA, MR, and AA; resources: OA and AA; data curation: OA and SA; writing—original draft preparation: OA, AA, SA, KA, MR, and AA; writing—review and editing: KA, MR, and AA; project administration: SA and MR.
Acknowledgments
The authors thank the Deanship of Scientific Research (DSR) at King Abdulaziz University, Jeddah, Saudi Arabia, for funding this project, under grant no. RG-10-135-43. The authors also acknowledge the support provided by King Abdullah City for Atomic and Renewable Energy (K.A. CARE) under the K.A. CARE-King Abdulaziz University Collaboration Program.
Conflict of interest
The authors declare that the research was conducted in the absence of any commercial or financial relationships that could be construed as a potential conflict of interest.
Publisher’s note
All claims expressed in this article are solely those of the authors and do not necessarily represent those of their affiliated organizations, or those of the publisher, the editors, and the reviewers. Any product that may be evaluated in this article, or claim that may be made by its manufacturer, is not guaranteed or endorsed by the publisher.
Abbreviations
CC, cycle charging dispatch; COE, levelized cost of energy; CRF, capital recovery factor; ESS, energy storage system; HOMER, Hybrid Optimization Model for Electric Renewables; LF, load following dispatch; NPC, net present cost; O&M, operation and maintenance; PV, photovoltaic; WT, wind turbine.
References
Alharthi, Y., Siddiki, M., and Chaudhry, G. (2018). Resource assessment and techno-economic analysis of a grid-connected solar PV-wind hybrid system for different locations in Saudi Arabia. Sustainability 10 (10), 3690. doi:10.3390/su10103690
Awan, M. M. A., Yaqoob Javed, M., Asghar, A. B., Ejsmont, K., and Rehman, Z. U. (2022). Economic integration of renewable and conventional power sources—a case study. Energies 15 (6), 2141. doi:10.3390/en15062141
Bahramara, S., Parsa Moghaddam, M., and Haghifam, M. R. (2016). Optimal planning of hybrid renewable energy systems using HOMER: A review. Renew. Sustain. Energy Rev. 62, 609–620. doi:10.1016/j.rser.2016.05.039
Cetinbas, I., Tamyurek, B., and Demirtas, M. (2019). Design, analysis and optimization of a hybrid microgrid system using HOMER software: Eskisehir osmangazi university example. Int. J. Renew. Energy Development-Ijred 8 (1), 65–79. doi:10.14710/ijred.8.1.65-79
Fadlallah, S. O., and Serradj, D. E. B. (2020). Determination of the optimal solar photovoltaic (PV) system for Sudan. Sol. Energy 208, 800–813. doi:10.1016/j.solener.2020.08.041
HOMER Pro 3.12, (2018). Available online: https://www.homerenergy.com/products/pro/docs/3.12/index.Html (Accessed July, 2022).
Iqbal, S., Jan, M. U., Shafiq, A., ur Rehman, A., ur Rehman, A., ur Rehman, H., et al. (2022). Feasibility study and deployment of solar photovoltaic system to enhance energy economics of king Abdullah campus, university of Azad Jammu and Kashmir muzaffarabad, AJK Pakistan. IEEE Access 10, 5440–5455. doi:10.1109/ACCESS.2022.3140723
Iqbal, S., Habib, S., Ali, M., Shafiq, A., ur Rehman, A., Ahmed, E. M., et al. (2022). The impact of V2G charging/discharging strategy on the microgrid environment considering stochastic methods. Sustainability 14 (20), 13211. doi:10.3390/su142013211
Kaddoura, T. O., Ramli, M. A. M., and Al-Turki, Y. A. (2016). On the estimation of the optimum tilt angle of PV panel in Saudi Arabia. Renew. Sustain. Energy Rev. 65, 626–634. doi:10.1016/j.rser.2016.07.032
Konneh, K. V., Masrur, H., Othman, M. L., Wahab, N. I. A., Hiam, H., Islam, S. Z., et al. (2021). Optimal design and PerformanceAnalysis of a hybrid off-grid renewable power system ConsideringDifferent component scheduling, PV modules, and solar TrackingSystems. IEEE Access 9, 64393–64413. doi:10.1109/access.2021.3075732
Louai, N., Khaldi, F., and Bouras, F. (2013). “Techno-economic study of a hybrid system (PV/WIND) to provide electricity for a household in Algeria,” in Proceeding of the 16èmes Journées Internationales de Thermique (JITH), Marrakech-Maroc, November 2013.
Malik, P., Awasthi, M., and Sinha, S. (2022). A techno-economic investigation of grid integrated hybrid renewable energy systems. Sustain. Energy Technol. Assessments 51 (2022), 101976. doi:10.1016/j.seta.2022.101976
Mohamed, M. A., Estimably A, M., and Alolah, A. I. (2015). Sizing and techno-economic analysis of stand-alone hybridphotovoltaic-wind-diesel- battery power generation systems. J. Renew. Sustain. 77, 063128. doi:10.1063/1.4938154
Mubaarak, S., Zhang, D., Chen, Y., Liu, J., Wang, L., Yuan, R., et al. (2020). Techno-economic analysis of grid-connected PV, and fuel cell hybrid system using different PV tracking techniques. Appl. Sci. 10, 8515. doi:10.3390/app10238515
Rezk, H., Kanagaraj, N., and Al-Dhaifallah, M. (2020). Design and sensitivity analysis of hybrid photovoltaic-fuel-cell-battery system toSupply a small community at Saudi NEOM city. Sustainability 12, 3341. doi:10.3390/su12083341
Saidani, M., Pan, Z., Kim, H., Wattonville, J., Greenlee, A., Shannon, T., et al. (2021). Comparative life cycle assessment and costing of an autonomous lawn mowing system with human-operated alternatives: Implication for sustainable design improvements. Int. J. Sustain. Eng. 14 (4), 704–724. doi:10.1080/19397038.2021.1919785
Shafiq, A., Iqbal, S., Habib, S., ur Rehman, A., ur Rehman, A., Selim, A., et al. (2022). Solar PV-based electric vehicle charging station for security bikes: A techno-economic and environmental analysis. Sustainability 14 (21), 13767. doi:10.3390/su142113767
Shambhu, S., Tarun, D., Anil, K., Mohammad, Y., and Bhatd, R. S. A. (2021). Techno-economic and environmental assessment to mitigating climate change and building energy security: A study on Willingdon Island. Int. J. Sustain. Energy 41, 0752. gSOL. doi:10.1080/14786451.2022.2119973
Sinha, S., and Chandel, S. S. (2014). Review of software tools for hybrid renewable energy systems. Renew. Sustain. energy Rev. 32, 192–205. doi:10.1016/j.rser.2014.01.035
Sohoni, V., Gupta, S., and Nema, R. K. (2019). Design of wind-PV based hybrid standalone energy systems for three sites in central India. ECTI Trans. Electr. Eng. Electron. Commun. 17 (1), 24–34. doi:10.37936/ecti-eec.2019171.215397
The Excel 10 kWWind Power, (2013). Available online: https://www.bergey.com/(Accessed July, 2022).
The Ministry of Energy, (2022). Saudi Arabia. Available online: https://powersaudiarabia.com.sa/web/index.html (Accessed July, 2022).
Yimen, N., Tchotang, T., Kanmogne, A., Abdelkhalikh Idriss, I., Musa, B., Aliyu, A., et al. (2020). Optimal sizingand techno-economic analysis of hybrid renewable energysystems—A case study of a photovoltaic/wind/battery/dieselsystem in fanisau, northern Nigeria. Processes 8, 1381. doi:10.3390/pr8111381
Keywords: renewable energy, energy storage, hybrid microgrid, wind turbine, photovoltaic, HOMER
Citation: Alghamdi OA, Alhussainy AA, Alghamdi S, AboRas KM, Rawa M, Abusorrah AM and Alturki YA (2023) Optimal techno-economic-environmental study of using renewable energy resources for Yanbu city. Front. Energy Res. 10:1115376. doi: 10.3389/fenrg.2022.1115376
Received: 03 December 2022; Accepted: 23 December 2022;
Published: 16 February 2023.
Edited by:
Arvind R. Singh, University of Pretoria, South AfricaReviewed by:
Sheeraz Iqbal, University of Azad Jammu and Kashmir, PakistanSunanda Sinha, Malaviya National Institute of Technology, Jaipur, India
Imane Hammou Ou Ali, Mohammed V University, Morocco
Copyright © 2023 Alghamdi, Alhussainy, Alghamdi, AboRas, Rawa, Abusorrah and Alturki. This is an open-access article distributed under the terms of the Creative Commons Attribution License (CC BY). The use, distribution or reproduction in other forums is permitted, provided the original author(s) and the copyright owner(s) are credited and that the original publication in this journal is cited, in accordance with accepted academic practice. No use, distribution or reproduction is permitted which does not comply with these terms.
*Correspondence: Kareem M. AboRas, a2FyZWVtLmFib3Jhc0BhbGV4dS5lZHUuZWc=; Muhyaddin Rawa, bXJhd2FAa2F1LmVkdS5zYQ==