 Fernando Climent Barba
 Olivier Grasham2
 A. John Blacker
- 1Institute of Process Research and Development, School of Chemistry and School of Chemical and Process Engineering, University of Leeds, Leeds, United Kingdom
- 2School of Chemical and Process Engineering, University of Leeds, Leeds, United Kingdom
- 3Research and Development, Basepoint Enterprise Centre, Fiberight Ltd, Southampton, United Kingdom
A techno-economic assessment (TEA) of enzymatic hydrolyses of a municipal solid waste (MSW)-derived pulp was performed to compare various bioprocessing configurations for the production of platform sugars at both pilot and demonstration scales (two-stage continuous, batch, and two-stage fed-batch). The configurations modeled used either rotary drum and/or continuous stirred tank reactors. By using reaction kinetics and public vendor’s quotes, economic analyses were calculated for each of the proposed systems: capital expenditure (CapEx); operation expenditure (OpEx); revenue and profit; return on investment (ROI); and payback period (PP). The TEA showed that a two-stage continuous configuration with a total residence time of 54 h (6 and 48 h for primary and secondary stages) was the best option for obtaining sugars, showing sevenfold higher enzyme productivity and better profit than the reference systems. Although pilot-scale enzymatic hydrolysis demonstrated an unprofitable process, this was mainly due to the high associated enzyme cost. Increasing the scale diminished this problem, leading to higher profit per processed unit (£/kg lignocellulosic sugars). From an investment perspective, the two-stage 6/48 configuration gave a more attractive ROI and PP than the other designs.
1 Introduction
Following effective pre-treatment, enzymatic hydrolysis of lignocellulosic material has long been identified as an attractive method for generating value-added products from a biorefinery (Mosier et al., 2005). The saccharification of lignocellulosic biomass generates sugars as building blocks for numerous product applications such as biofuels, chemicals, and polymers. The biogenic and waste-derived nature of this lignocellulosic material reduces the carbon footprint of these products, helping to achieve the net-zero ambition. Several commercial cellulosic ethanol plants exist worldwide that use enzymatic processes (Rosales-Calderon and Arantes, 2019). However, the naturally recalcitrant nature of lignocellulosic biomass makes for expensive processing, and challenges exist in developing an ethanol product at a competitive market price. Therefore, a biorefinery concept employing low-cost lignocellulosic feedstock for the generation of bioethanol and high-value biochemicals is attractive. Recent developments in the conversion of lignocellulosics to soluble sugars, from the organic fraction of municipal solid waste (OFMSW), have provided reliable data for techno-economic analysis (TEA) (Climent Barba et al., 2021). The lignocellulosic fraction of OFMSW (∼30%) has been under-represented as a potential feedstock for enzymatic hydrolysis, but its global availability makes it attractive.
Enzymatic hydrolysis has been traditionally performed in batch processes due to its simple design (Davis et al., 2013). However, it has been recently recognized that fed-batch and continuous strategies could bring down costs by improving sugar productivity and reducing enzyme usage (Ghorbanpour Khamseh and Miccio, 2012; Sotaniemi et al., 2016; Lischeske and Stickel, 2019). The cost of enzymes used in the process is a key limiting factor in the economic viability of enzymatic processing. Fed-batch and continuous systems have been shown to improve enzyme recycling, which could help drive down costs (Gurram and Menkhaus, 2014). Further benefits may be seen with comparatively low reactor down-times, greater space-time yields, and optimized energy consumption (Rao et al., 2009). Other TEA studies have compared the cost-benefit of the batch, fed-batch, and continuous enzymatic systems, but none have performed this analysis with an MSW-derived pulp lignocellulosic feedstock (Argo and Keshwani, 2019; Olivieri et al., 2021).
TEA is a broad term to describe studying the financial feasibility of implementing a process design, whilst accounting for influences such as scale, capital, operational expenditure, geographical location, and product market condition. Performing TEAs for fledgling technologies, such as those described in this body of work, is vital to understanding their viability in a commercial setting. The National Renewable Energy Laboratory (NREL) and others have conducted numerous TEA investigations of enzymatic systems based on a primary feedstock of corn stover (Davis et al., 2013; Humbird et al., 2011a; Tao et al., 2014; Davis et al., 2015). Corn stover-derived ethanol was promoted heavily by the U.S. Department of Energy (DOE) due to the high carbohydrate content, established supply chains and national crop subsidy structure (Nguyen et al., 1996). These TEA studies were capitalized upon by companies such as DuPont, which started generating bioethanol from corn stover in 2015 in Nevada, USA, at 30 million gallons per year (Rosales-Calderon and Arantes, 2019). TEAs are a useful tool to assess market penetration and technology upscaling, as well as for identifying the direction of future research to move toward a market-ready process and product. TEA studies for other popular feedstocks, such as sugar cane and forest residues, have also helped provide the foundation for the TEA showcased herein (Gnansounou and Dauriat, 2010; Mesa et al., 2016; Longati et al., 2018).
2 Materials and Methods
2.1 Materials, Enzymes, and Reagents
MSW-derived lignocellulosic pulp was provided by Fiberight Ltd., from its commercial plant in Hampden (Maine, USA). After the plastics and metals were removed, the lignocellulosic fraction (consisting of mostly paper and cardboard) was pulped. The resulting fibrous material was supplied at a dry matter content of 50%–55% (w/w), determined by the “oven-drying method”. The lignocellulose composition was assessed by the NREL method (Sluiter et al., 2012), being composed of 55% glucan, 12% xylan, 6% araban/galactan/mannan, 24% lignin, and 3% ash (Climent Barba et al., 2021; Puri et al., 2013).
Cellic® CTec3 was kindly donated by Novozymes (Copenhagen, Denmark), with a protein content of 110 mg BSA ml−1, as determined by the Bradford Assay (Bradford, 1976). Other chemicals were purchased as high-purity grades from Sigma-Aldrich and/or Thermo-Fischer Scientific: 1,2-benzisothiazolinone (BIT), acid phosphoric (H3PO4), and sodium hydroxide (NaOH).
2.2 Enzymatic Hydrolysis set-up
An enzymatic hydrolysis assay of MSW-derived pulp (52% dry matter) was run for 72 h using 2-L rolling bottles into a mini-roller apparatus (Crystal Technology, MR-03UA), fitted inside a laboratory incubator. The reaction conditions were as follows; 25% solids, 2% enzyme loadings, and 0.1% BIT (antimicrobial agent) on a w/w dry substrate basis. Operational parameters (rotational speed and temperature) were kept constant at 30 rpm and 55°C, whilst pH was maintained at 4.75–5.25 by the addition of H3PO4 or NaOH after collection of samples. To determine the reaction kinetics, a power-law model was fitted into the discrete analysis of glucose yields (experimental data) with a high coefficient of regression (r2 > 0.95), as seen in Supplementary Figure S1.
2.3 Sugar Analysis
Monomeric sugars (d-glucose and d-xylose) were analyzed by HPLC UltimateTM Dionex 3000 column (United Kingdom). A 20 μl sample was injected and separated by a Supelcogel™ C-610H (6% crosslinked) column with a deashing guard column, operating at 30°C with 0.1 wt% phosphoric acid at a flow rate of 0.5 ml min−1 as mobile phase. Monosaccharides were detected by a Shodex RI-101 refractive index detector (Thermo Scientific, United Kingdom). High-purity analytical standards are used to calibrate each product to determine linear response concentrations. All samples were run in duplicate, and chromatograms were processed by Chromoleon software®.
2.4 Optimization
The optimization study involved conducting a 23 full-factorial experimental design by MODDE 12.1 (Umetrics, Sartorius, Sweden), as nine combinations of experiments (Supplementary Figure S2A) to determine the optimum total solids and residence time (factors) as a function of glucose yields, glucose rates, and energy efficiency (responses). Glucose yields were determined from individual runs as following the previous methodology but for each TS and residence time, where glucose rates and energy efficiency were calculated thereafter. Once the data were acquired, the sweet-spot tool of MODDE software was run to determine the experimental space which satisfies certain criteria known as “sweet spot” (Lindberg, 2010). Three criteria were proposed based on: commercial requirements of lignocellulosic sugars (da Silva et al., 2020), increased rates of continuous over batch processing (Brethauer and Wyman, 2010), and optimal energy efficiency (Dasari, 2008). For each criterion, a range of thresholds was set according to the literature values: 1) glucose yields of 80–120 g L−1 (da Silva et al., 2020), 2) glucose rates of 1–2 g L−1 (Brethauer and Wyman, 2010), and 3) energy efficiency of 0.1–0.4 g glucose Wh−1 (Dasari, 2008). The experimental design of all experiments and the consequent sweet-spot contour plot can be observed in Supplementary Figure S2, yielding an optimum residence time of 54 h at 25% solids.
2.5 Techno-Economic Assessment
TEA is a stepwise methodology for the economic analysis of a processing unit; in this case, it was defined as the enzymatic hydrolysis of MSW-derived pulp to fermentable sugars. In this study, several reactor configurations were compared (batch, fed-batch, and continuous) for bioprocessing of MSW-derived pulp into monomeric sugars at pilot and commercial scales. The following methodology describes each step (process design, mass/energy balances, cost estimation, and economic analysis) of the TEA.
2.5.1 Process Design
The design of the two-stage liquefaction and saccharification process was carried out using the τ = WV/Q expression for a fixed volume and residence time. The change in viscosity observed during hydrolysis follows two-stage kinetics. In the primary stage, high-solid loadings give high viscosity and are best handled by rotary drum reactors. Whilst some saccharification does occur, this is mainly a liquefaction stage. In the secondary stage, once liquified, stirred tanks provide sufficient mixing to be able to produce most of the glucose, hence, it is more of a saccharification stage. As seen in Table 1, the residence time of the liquefaction reactor dictates the flow rate, as well as the residence time and volume of the secondary hydrolysis tank. At steady state, the inlet (Qin) and outlet (Qout) flow rates are equal. In this study, four configurations of two-stage systems were investigated, with residence times of 1) 6 h/48 h (6/48) 2) 12 h/42 h (12/42) 3) 18 h/36 h (18/36), and 4) 24 h/30 h (24/30) for the liquefaction and saccharification stages, respectively. In addition to the reference systems, a two-stage fed-batch (same design as the 6/48 continuous) and a single-tank batch were used. The volume of the saccharification reactor was determined according to the saccharification residence time and the difference between the liquefaction and total residence time. Table 1 summarizes the process designs (flow-rate, residence time, and working volume) of the four continuous two-stage systems, which are employed for process modeling/simulation. The liquefaction bioreactor residence times are limited to 6 h per reactor, which is realistic for an industrial unit. Thus, 1, 2, 3, and 4 bioreactors were installed for the 6/48, 12/36, 18/40, and 24/30 continuous systems, respectively. A modified version of the 6/48 two-stage configuration was proposed, for reducing the volume of the saccharification reactor, and designated (6/48∗). This consisted of a liquefaction bioreactor and three CSTRs in series. All the bioreactors were connected with pumps for transferring the processed slurry.
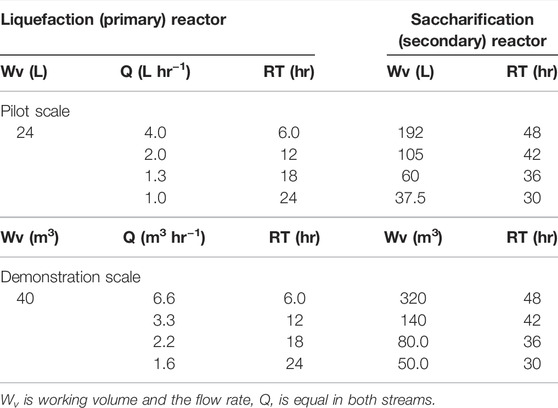
TABLE 1. Process design of two-stage systems (total τ of 54 h) for the continuous enzymatic hydrolysis of MSW-derived pulp: pilot and demonstration scales.
2.5.2 Mass and Energy Balances
Robust mass and energy (M&E) balances were generated using Excel (Microsoft Office) by process modeling and simulation in accordance with process design and reaction kinetics. A two-stage liquefaction and saccharification process was modeled. Apart from upstream and downstream activities, the biochemical conversion of MSW-derived pulp into glucose includes operations such as stirring, heating, and pumping, and the energy input was the sum of these. Without laboratory data for the energy requirements, the power demand used was that given in the technical description of the vendor (Humbird et al., 2011a). A list of assumptions was made for all the systems investigated, emphasizing the continuous configurations:
1) The upstream (waste reception to pulping and feeding of raw materials), downstream (recovery and purification), and storage processes are neglected.
2) The lignocellulosic composition of MSW pulp remains constant (Climent Barba et al., 2021; Puri et al., 2013)
3) The physicochemical characteristics of the other reagents remain unchanged.
4) The volume of H3PO4 is equal to 0.001% (v/v) of the working volume, and NaOH makes up half of H3PO4 to balance the pH throughout the bioprocessing.
5) The pumping of slurry (liquefaction and saccharification) reactors ignores differences in viscosity.
6) A downtime (DT) of 2 days per year and batch is estimated for the two-stage continuous and batch/fed-batch hydrolysis.
7) Downtime costs, ranging from 5 to 20% of total operating expenses, are estimated at a mid-range level of 10% (Ahmed, 2013).
8) Steady state is not achieved until 3 space volumes after the batch period, e.g., 162 h for a 54-h residence time.
9) Depreciation, labor, maintenance, and other indirect costs are included in the cost estimation.
2.5.3 Calculations: Process Modeling and Cost Estimation
A power-law model, from the kinetic analysis, is used for the prediction of glucose yields (Glu, in g L−1) depending on the mode of operation, batch (Glubatch, Eq. 1), and fed-batch (Glufed, Eq. 2) for a residence time of 120 h.
In continuous mode, the glucose concentration follows the fed-batch equation (Eq. 2) as the saccharification tank is being periodically filled for a residence time (RT) of 54 h, determined by the sweet-spot study (Section 2.4). The time to reach steady state is assumed at 3 space volumes (t3SV), i.e., 162 h for a 54-h residence time, yielding constant glucose titers throughout the whole operation. Therefore, the overall running time in steady state (TSS) is calculated by Eq. 2 on annual basis (tyr equal to 8,760 h) for the continuous systems:
The energy input is the sum of bioengineering processes (mixing, heating, and pumping) per step (liquefaction and saccharification). In the absence of actual energy requirements, the power demand was taken as a reference from the technical description of the vendor (Supplementary Table S1) (Humbird et al., 2011a).
For CapEx and operating expenses (OpEx) (raw materials, electricity, and revenue streams), costs were obtained from the world’s largest online B2B marketplace: www.alibaba.com. At pilot and demonstration scales, CapEx costs are summarized in Supplementary Table S1 in accordance with the process designs, whilst OpEx values were chosen according to chemical suppliers and literature values, summarized in Supplementary Table S2. If not found online, bioengineering costs are calculated via the “scale-up costs” expression for the demonstration scale (Eq. 3):
where n = 0.6 is the scale-up coefficient, known as the “0.6 rule” in cost engineering as described by Tribe and Alpine (1986).
In this biorefinery, the main revenue streams are sugars and post-hydrolysis solids (PHS), and maximum selling prices are assumed. Costs associated with energy consumption are based on UK national grid pricing. Two complementary parameters, return of investment (ROI, in %) and payback period (PP, in years), are calculated from profit (revenue-OpEx) and CapEx by employing Eqs. 4 and 5, respectively.
2.6 Sensitivity Analysis
At pilot scale, the sensitivity analysis involved a 23 full-factorial design with one center-point, using the statistical software MODDE 12.1 (Umetrics, Sartorius, Sweden). Four main parameters were set as factors with the next ranging costs: rotary drum reactor (£2,000–50,000), enzymes (£1–5/kg), sugar (£0.1–0.5/kg), and PHS (£0.025–0.25/kg), where CapEx, OpEx, revenue, profit, ROI, and PP are set as responses. Economic analysis was carried out for the 6/48 continuous configuration as a combination of 17 experiments as seen in Supplementary Table S3. Whilst for the demonstration scale, factors were used in the same range but fixing the horizontal reactor costs (£200,000). Therefore, only three factors were studied in the range of £1–4/kg (enzymes), £0.2–0.4/kg (sugar), and £0.05–0.25/kg (PHS), structured as 15 combinations of experiments (Supplementary Table S4).
3 Results and Discussion
3.1 Techno-Economic Assessment at Pilot Scale
3.1.1 M&E Balances
M&E balances of all the systems investigated are summarized in Table 2, grouping input/output flows and depicting some efficiency-based parameters. The 6/48 design outperforms the rest of the two-stage continuous systems by a factor of 2 for (12/42), 3 for (18/36), and 4 for (24/30) in mass flows (feedstock, water, enzymes, and reagents). For instance, a twofold increase in feedstock addition rate was seen in the 6/48 operation at 8.5 tonnes/annum (tpa), compared to the 12/42 (4.2 tpa). Processing capability varies in proportion with the flowrate (Table 1): 4.0 L h−1 (6/48), 2.0 L h−1 (12/42), 1.3 L h−1 (18/36), and 1 L h−1 (24/30). The 6/48 configuration has an annual revenue stream (sugar and PHS) twice, three, or four times higher than the 12/42, 18/36, and 24/30 configurations, respectively. Mass productivity is based on the process design, which has a direct impact on the CapEx, e.g., the number/size of engineering equipment (Noorman et al., 2018).
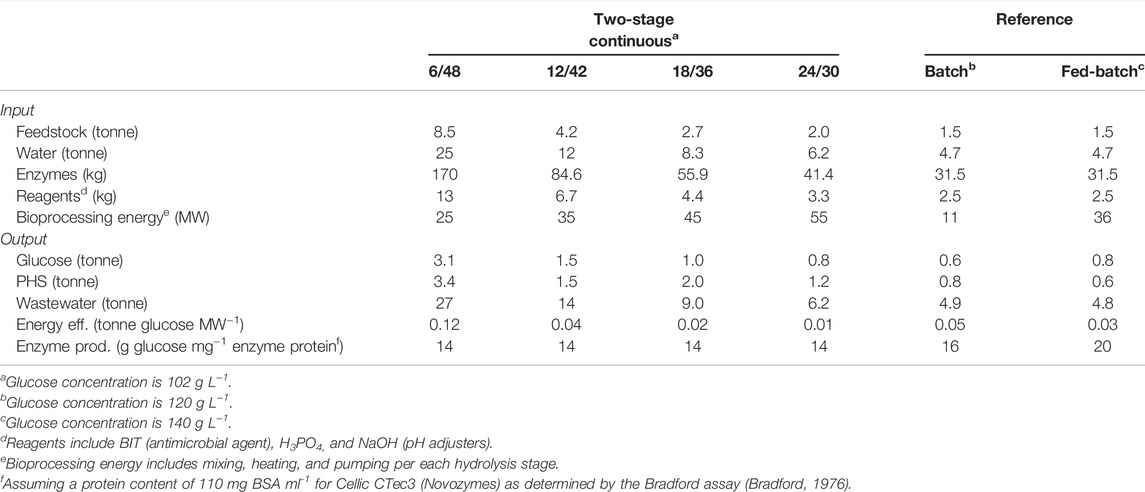
TABLE 2. Summary of M&E balances of the pilot-scale configurations.
Furthermore, the bioprocessing energy (sum of liquefaction and saccharification bioreactor energy requirements) of the 6/48 configuration is significantly lower, at 25 MW (MW), than the other two-stage continuous systems: 35 MW (12/42), 45 MW (18/36), and 55 MW (24/30). Increasing the number of liquefaction reactors (and pumps) results in higher energy demand due to mixing and heating, even though, smaller vessels are employed for the saccharification step (Jørgensen et al., 2007). According to the energy demands per engineering component (Supplementary Table S1), the electricity requirements for heating are four times higher than for mixing. Consequently, bioreactor designs with more vessels result in higher energy consumption. This statement is only valid when power consumption is not measured as a function of slurry viscosity, as this would have an impact on mixing and pumping processes (Palmqvist et al., 2016). In theory, shorter liquefaction times result in more viscous substrates, therefore, requiring higher energy requirements. A possible solution is to incorporate a correction factor for each mixing stage (liquefaction and saccharification) according to the reduction in viscosity observed during enzymatic saccharification in previous investigations working at high-solid loadings (Dasari et al., 2009; Kadić et al., 2014). Although these correction factors are inaccurate for the enzymatic hydrolysis of MSW pulp, they provide a further point of adjustment.
Energy and enzyme efficiencies were calculated for each configuration investigated. The energy efficiencies vary depending upon the configuration: 0.12, 0.04, 0.02, and 0.01 tonne of glucose per MW−1 for the 6/48, 12/42, 18/36, and 24/30 configurations, respectively. According to Dasari et al. (Dasari et al., 2009), energy efficiencies of 10%–25% w/w for enzymatic hydrolysis of pretreated corn stover were in the range of 0.15–0.20 tonne of glucose per MW−1, highlighting that 20% solid loadings were optimum for glucose release and compensated for the higher energy requirement. Correâ et al. (2016) reported values of 0.23–0.35 tonne glucose per MW−1 in sugarcane bagasse hydrolysis under different feeding strategies. Our fed-batch reference system displayed an energy efficiency value of 0.75 MW per tonne of glucose, at least double that reported, so, the two-stage continuous systems show that energy efficiency can be improved over batch and fed-batch strategies.
The enzyme cost contributes significantly to the process and was calculated in produced mass sugar per dose required of enzymes, known as enzyme productivity. This parameter has been under-reported, but it is gaining importance, particularly with enzyme recycling studies (Visser et al., 2015). Visser et al. (2015) determined enzyme productivities in the range of 3.78–2.56 g sugar/mg enzyme protein, depending on enzyme loadings for a solid content of 12% w/v. Therefore, lower enzyme efficiencies are displayed compared to this study (14–20 g glucose per mg enzyme protein), using commercial enzyme blends (Cellic CTec3) with FPase activity of 120 FPU/ml (Park et al., 2010).
Compared to the reference cases (batch and fed-batch), a fivefold increase in total production was seen with the 6/48 system (1.6–8.5 tpa). Although batch hydrolysis halves the bioprocessing energy (12 MW) to 6/48 (25 MW) and fed-batch (26 MW) system, in particular when processing through the 230 L stirred tanks. The incorporation of a second stage allows the fed-batch system to produce around 130 kg more than the batch design (0.69–0.83 tonnes per year) but with a lower energy efficiency (0.03 kg glucose kW−1) than the batch design (0.05 kg glucose kW−1). It is well-known that batch and fed-batch systems result in higher conversion yields than continuous processing, mainly due to operating at longer mixing times (Ghorbanian et al., 2014). The release of glucose yields during different modes of operation (batch, fed-batch, and continuous) has been compared for the enzymatic saccharification of corn stover (Lischeske and Stickel, 2019; Stickel et al., 2018) and orange peel wastes (Ghorbanpour Khamseh and Miccio, 2012). Although insoluble solid loadings were not set equally due to “clogging” issues during continuous processing, Stickel et al. (2018) showed that batch hydrolysis yielded over 10 g glucose per g biomass (at 10%TS) whilst only 0.44 g glucose per gram biomass in continuous mode (5% TS). A sudden decrease in glucose concentrations is observed when switching from batch to continuous, taking several hours to reach steady state. More recently, Lischeske and Stickel (2019) reported that final glucose concentrations of 5 and 7.5%TS acid-pretreated corn stover were significantly higher in batch than in continuous mode, 22.5 to 12.5 g L−1 and 40 to 22 g L−1, respectively. Ghorbanpour Khamseh and Miccio (2012) showed by modeling that galacturonic acid concentrations decrease from 0.3 to 0.15 g/kg biomass during orange peel hydrolysis when changing from batch to continuous operation. Similar behavior was observed in the mass production of the pectin-derived acid, 0.15–0.14 g, if processed in batch or fed-batch, respectively. As observed, poorer process yields are achieved in continuous than in batch or fed-batch processing (Ghorbanpour Khamseh and Miccio, 2012; Stickel et al., 2018; Andrić et al., 2010).
3.1.2 Economic Analysis
The economic analysis consists of determining CapEx, OpEx, revenue, and profit for the aforementioned pilot-scale configurations (Figure 1). As seen in M&E balances, the 6/48 configuration resulted in the highest turnover which translates into the highest profit margins, ranging from £1,800 to £2,300 (depending on the energy costs) per 8.5 tonnes of feedstock. Despite this profitability, the 6/48 systems had the highest CapEx (£1,500) and OpEx (£1,200) values per 8.5 tonnes of feedstock, being structured with a 240-L STR and high usage of enzymes and reagents, respectively. The 6/48 configuration reduces the equipment costs compared with the other two-stage designs, as it employs only one vessel. However, higher associated costs are accounted for a 240-L STR. Interestingly, one of the reference systems (fed-batch) has the same CapEx as the 6/48 configuration, but its profitability is reduced to eightfold (∼ £500 per 1.5 tonnes of feedstock) due to lower production and high downtime costs. Despite giving the highest level of CapEx (£1,500) and OpEx (£1,200), the modified version of the 6/48 configuration generated annual revenue of £3,000 being the most profitable design per 8.5 tonnes of feedstock. The substitution of three lower volume CSTRs in series (3 × 80 L) instead of one larger vessel (1 × 230 L), increases the CapEx by £2,000 (£8 k to 10 k), due to the installment of a multi-stage system (pumps, agitators, and heating devices) (Davis et al., 2018a). This bioreactor design is advantageous from a techno-economic viewpoint, as higher profits are achieved with lower initial investment (CapEx) (De Gooijer et al., 1996). According to the economic analysis, the two-stage 12/42 configuration was the second preference, followed by the reference batch system, both with profits below £1,000 per 1.5 tonnes of feedstock at pilot scale. In contrast, the remaining three options (18/36, 24/30, and the fed-batch reference) were shown to be infeasible, leading to an operating loss.
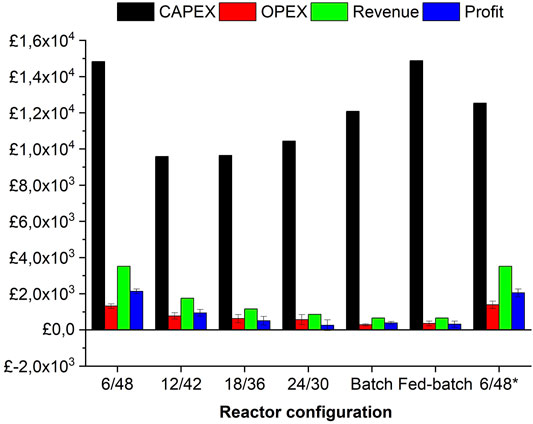
FIGURE 1. Financial analysis (CapEx, OpEx, revenue, and profit) of investigated configurations at pilot scale. Error bars represent the standard deviations between averaged OpEx and profit with and without electricity cost inputs.
Rajendran and Murthy (2017) assessed the economic viability of biorefining Bana grass and energy cane into valuable fuels, chemicals, and energy. From transportation to downstream processing, several products (ethanol, ethyl acetate, ethylene, hexane, and energy) are manufactured from Bana grass and energy cane, with capital costs and revenues ranging from £600–500 and £200–500 per tonne of feedstock, respectively. Biorefining of Bana grass or energy cane enables the co-production of gypsum, ethanol, and energy, accounting for OpEx and revenues in the range of £175–200 per tonne of feedstock. To contextualize this, we achieved OpEx and revenues in the range of £300–350 and £950–1,100 per tonne of feedstock, respectively, even in the reference systems (batch and fed-batch). However, both upstream and downstream operations are missing in the cost estimation, as well as wastewater treatment and utilities, which would greatly change the overall economics upon end-user application.
The determination of CapEx and revenue is independent of electricity cost, however, OpEx and profit are not. In Figure 1, standard deviations are included in the average OpEx and profit values depending on energy costs (£0.01 or 0 kWh). Electricity represents around 20% of operational costs, whilst the rest accounts for chemicals (pH adjusters) and enzymes, playing a significant role in economics. Of the four configurations investigated, the 18/36, batch, and fed-batch are close to viable (this is inclusive of energy costs) but not the 24/30 system. Nevertheless, the average OpEx/profit values decreased as a function of revenue per bioprocessing configuration: 6/48 (£1,500/£2,100), 6/48* (£1,400/£2050), 12/42 (£770/£940), 18/36 (£620/503), 24/30 (£560/250), batch (£280/380), and fed-batch (£353/315), respectively. Kazi et al. (2010) demonstrated that ethanol product values are poorly affected by an electricity price in the range of 0.06 to 0.04 $/kWh. In this tight range, no major differences were observed, but changes in electricity prices play an important role in the overall economy.
The ROI and PP were determined from the TEA to ascertain the viability of each configuration studied. The effect of energy costs indicated a requirement for whole-process design with internal electricity generation. Table 3 shows that energy makes an important contribution to the OpEx, making some reactor configurations feasible depending on this factor. Interestingly, the ROI and PP of both 6/48 configurations increase by 22% when excluding energy inputs. On average, a 15%–22% ROI and a 4–6 year PP are estimated in both energy scenarios. For the rest of the configurations, ROI/PP is ranked in a decreasing order as the profit results: 12/42 < batch <18/36 < fed-batch < 24/30. Negative values of both ROI and PP were determined for 18/36, 24/30, and fed-batch configuration with energy costs. On the other hand, the bioprocessing configurations with the worst economics (18/36, 24/30, batch, and fed-batch) presented both ROI and PP with 4%–7% and 13–25 years, respectively.
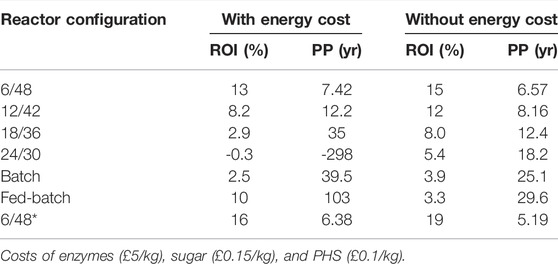
TABLE 3. Financial analysis of pilot-scale configurations.
Kazi et al. (2010) stipulated a 10% ROI for the production of 2,000 MMg day−1 cellulosic ethanol via a two-stage dilute acid and hydrolysis process coupled with fermentation. Other authors, Piccolo and Bezzo (2009), compared two lignocellulosic biorefineries (enzymatic hydrolysis and fermentation to gasification), capable of processing 700,000 tpa of dry biomass wood into ethanol. Several economic indexes were calculated for both technologies, ranging from 20.5 to 32.5% for a PP of 10 and 5 years, respectively. As indicated from these reviewed publications, ROI and PP around 10–30% and 5–10 years, respectively, are attractive enough for market investors. With this in mind, only the 6/48 configuration presents adequate economic feasibility, other configurations would need the required improvements to become more attractive options (e.g., 12/42 continuous two-stage).
3.1.3 Sensitivity Analysis
As seen in Figure 2, pilot-scale 6/48 continuous enzymatic hydrolysis of MSW pulp is infeasible from an economic perspective (ROI ≤ 0) at different sugar/PHS cost combinations: £0.1 kg−1/£0.025 kg−1, £0.1 kg−1/£0.1125 kg−1, and £0.2/£0.025 kg−1 (Figure 2). Despite horizontal reactor costs, the process becomes viable at enzyme costs ranging £1–1.6 kg−1 and £1–4.25 kg−1 when sugar/PHS revenues are from £0.3 kg−1 to £0.025–0.1125 kg−1 (Figures 3D–H). Similar contour plots are mapped in Figures 3A–F, which show 5% ROIs are achieved at horizontal reactor and enzyme costs below £25,000/unit and £3/kg, respectively. In this study, a wide range of enzyme costs (£1–4/kg) were used to investigate their economic impact. As expected, higher ROIs are found at £0.3–0.5 kg−1 sugar costs at least at PHS £0.25/kg (Supplementary Figures S2B, C). The highest ROI (15%) is predicted at £1–2.75/kg of enzyme cost, when revenue streams are affected by the maximum commercial prices (£0.5/kg and £0.25/kg for sugar and PHS, respectively). Rajendran and Murthy (2017) carried out a sensitivity analysis of important processes within different lignocellulosic biorefineries, using Bana grass and energy cane as feedstock. Depending on the conversion pathway, the ROI fluctuates from 5% to 10% ROI. Product selling prices, equivalent to the sugar and PHS costs in this study, followed by plant capacity, are considered the most important factors. Interestingly, the ROI fluctuated little with the enzyme cost (3%–6%) in comparison with ethanol price (0%–10%). Moreover, the choice of Hawaii, with its isolated location, may incur additional costs in transportation and processing. Therefore, plant capacity is a key factor in enhancing the profitability of the processes.
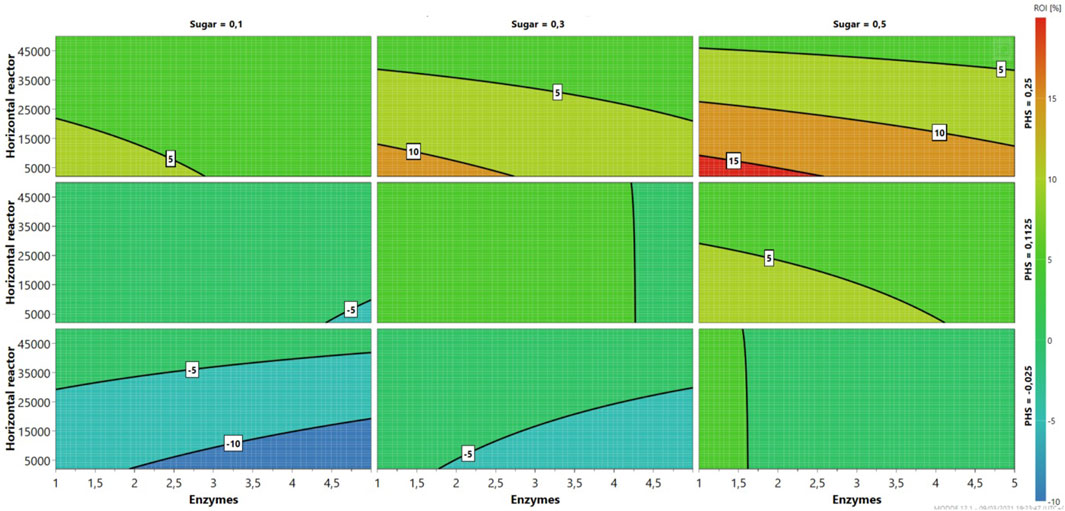
FIGURE 2. Sensitivity analysis (4D contour plots) of the 6/48 pilot-scale configuration, mapping profits as a function of enzymes and sugar costs for three levels.
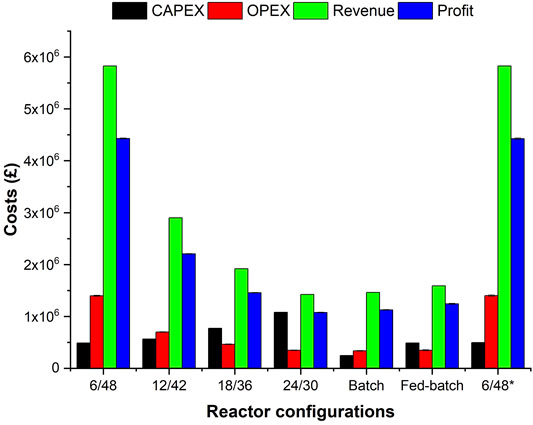
FIGURE 3. Financial analysis (CapEx, OpEx, revenue, and profit) of investigated configurations at demonstraition-scale. Error bars represent the standard deviations between averaged OpEx and profit with and without electricity cost inputs.
3.2 Techno-Economic Assessment at Demonstration Scale
A TEA study was performed at a scale more than ×100 times the pilot-case version, 30 L. The same methodology was used for conducting the material/energy balances and financial analysis, with the corresponding increase in bioengineering equipment capital costs. The sensitivity analysis was performed as described previously.
3.2.1 M&E Balances
A summary of M&E balances can be seen in Table 4, showing the main inlet and outlet flows. The 6/48 M&E balances are comparable with a cellulosic biorefinery plant that processes 20 kt per annum (kta) of dry forestry residues to ethanol (Frankó et al., 2016). Similar inputs of enzymes (0.8–1.2 tonnes per h) to this study were used for degrading various forestry residues into fermentable sugars. The techno-economic study by Frankó et al. (2016) can be used as a reference; this includes additional engineering processes (pretreatment, fermentation, combustion, and anaerobic digestion). Annual material balances for the two-stage continuous configurations (12/42, 18/36, and 24/30) are approximately a half (28.0 kta), a third (18.5 kta), and a fifth (13.7 kta) of 6/48 lignocellulosic processing, which is 56.4 kta. These trends are constant with respect to the other material balances, such as water, enzymes, and reagents, despite their normalization per total mass. In batch and fed-batch (two-stage) systems, a similar difference to the 6/48 case (13.1–56.4 kt per year) is observed, showing the advantages of a two-stage continuous system with shorter liquefaction (6 h) and longer saccharification (48 h). Regarding electricity consumption, the alternative two-stage continuous system, 6/48*, consumes 3/4 (1.46 GW) and 4/5 (1.62 GW) of that of the 6/48 case (2.01 GW). Likewise, the batch reference system also needs around 4/5 parts (1.64 GW) of bioprocessing energy. Surprisingly, the two-stage fed-batch system is the worst configuration, displaying the highest energy requirement (2.64 GW) and poor lignocellulosic processing (13.4 kta). In the outlet stream, the same differences in processing capabilities are observed between the 6/48 configuration (5.22 kta sugar) and the other designs: 12/32 (2.60 kta sugar), 18/36 (1.72 kta sugar), 24/30 (1.27 kta sugar), batch (1.44 kta sugar), and fed-batch (1.73 kta sugar) configurations. Likewise, PHS and wastewater are yielded in the same proportion, compared with the 6/48 configuration (Table 4), e.g., 11.3 and 5.6 kt of PHS or 45.5 and 22.7 kta of wastewater for 6/48 and 12/42, respectively.
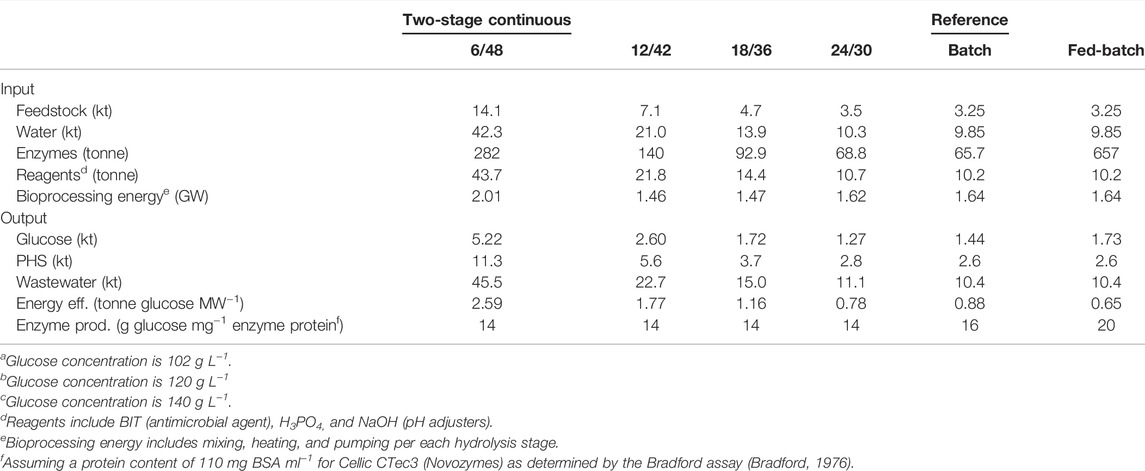
TABLE 4. Summary of M&E balances of the demonstration-scale configurations.
Energy and enzyme efficiency were also determined as key indicators of process cost-effectiveness. In industrial bioprocessing, high energy efficiencies are targeted to use less energy, leading to lower operational costs and environmental impact (MacRelli et al., 2012). Process design has a huge impact on this, dictated by the size of the equipment and associated energy demand. The calculated energy efficiencies of each configuration are 6/48 (2.59 kt glucose GW−1), 12/42 (1.77 kt glucose GW−1), 18/36 (1.16 kt glucose GW−1), 24/30 (0.78 kt glucose GW−1), batch (0.88 kt glucose GW−1), and fed-batch (0.65 kt glucose GW−1). As expected, the highest energy efficiency was the 6/48 configuration, exhibiting the highest sugar production with moderate energy requirements. In contrast, the fed-batch systems have the lowest energy efficiency despite using the same reactor configuration. The low productivity (1.73 tpa), in conjunction with the highest energy demand (2.64 GW), leads to a ratio of less than 1 kt glucose per GW consumed (0.65). The other configurations were at least 60% lower in energy efficiency, decreasing linearly as a function of decreasing sugar production. Interestingly, the 24/30 configuration consumes as much energy as the reference systems for producing the same quantity of lignocellulosic sugars per mass unit. This phenomenon might be attributed to longer residence times per step, with little or no flow rate, compared with other designs. Such poor processing capacity leads to high energy consumption, as all energy-demanding components of the bioprocess still function (mixing, heating, and pumping). A two-stage batch reactor design has a detrimental effect on the energy efficiency of the processes, as lower quantities of lignocellulosic feedstock are converted, needing high energy inputs. On the other hand, enzyme efficiencies remain constant for all the two-stage continuous configurations (1.85 tonne glucose/tonne enzyme), but higher ratios are reported for the batch and fed-batch systems: 2.1 and 2.62 tonne glucose/tonne enzyme, respectively.
Different Swedish researchers (Frankó et al. (2016; Wingren et al. (2003; Joelsson et al. (2015) have investigated the techno-economic viability of forestry-based biorefineries for manufacturing ethanol, electricity, and biogas. Ethanol is produced after SO2 pre-treatment and simultaneous saccharification and fermentation, with on-site yeast cultivation from softwood residues, at scales ranging from 150 to 250 kta. Despite using a shared model for process simulation, each author has adapted it accordingly. The energy demand, defined as energy input per volume of ethanol produced, has been determined in three studies, reporting values of 13.5–34.6 (Frankó et al., 2016), -0.9–21.3 (Wingren et al., 2003), and 11–14 (Joelsson et al., 2015) MJ per kg or L of ethanol. Franko et al. (2016) depicted energy demands with high variability according to the raw material used (sawdust/shavings to hog fuel), which are equivalent to ∼1–2 kt per GW−1. Although these biorefinery models are not directly comparable, they show that three of our two-stage continuous systems (6/48, 12/42, and 18/36) are as energy-efficient as robust biorefinery models.
3.2.2 Economic Analysis
Economic analysis of each configuration was investigated at demonstration scale (Figure 3). The CapEx increases as a function of the number of engineering components, driven mainly by the higher costs of the horizontal reactor (£200 k) in comparison with the rest of the equipment. Generally, the CapEx slightly exceeds £1 m (24/30 two-stage configuration) but diminishes in continuous systems as a function of liquefaction time: £772 k (18/36), £556 k (12/42), and £489 k (6/48). Splitting one CSTR (400 m3) into three smaller CSTRS (133 m3) does not reduce the CapEx (£497 k), as additional costs on heating and pumping equipment are incurred. Davis et al. (2018a) demonstrated that using CSTRs in series accounts for a higher capital cost than using a single reactor, and they estimated a difference of more than £30 m depending on whether batch (£10 m) or continuous (£43 m) for enzymatic hydrolysis to produce lignocellulosic sugars for manufacturing butyric acid and 2,3-butanediol, respectively. The batch system is more economic than the other configurations (£244 k) due to its simplicity (one 400 m3 STR) and absence of a transfer pump between stages. The two-stage fed-batch system shows the same CapEx as the 6/48 configuration (£489 k) for an identical design of 50 m3 (liquefaction reactor) and 400 m3 (saccharification reactor).
Humbird et al. (2011a) included a list of vendors’ quotes on mechanical equipment, showing that the hydrolysis and fermentation stages cost around £21 m, for converting 773 kt per annum of corn stover into ethanol. Amongst these, the saccharification tank (250,000 gallons) and transfer pump (352 gallons per minute) account for £5.6 m and £80,000, respectively. In our case, the 6/48 configuration costs consider only the 400 m3 STR connected with a purged pump (6.6 m3 h−1), approx. £500,000 in total. A lower CapEX, per processed biomass ratio, is seen in Humbird’s study (£7,200/kta) compared to our study (£10,000/kta). Our equipment figures were taken from alibaba.com and refactored for scale-up. A more accurate assessment requires contacting vendors or using cost estimation tools (e.g., Aspen Plus) and is beyond the scope of this research.
In contrast to CapEx, the OpEx increases with overall M&E balances for each configuration (Figure 3): £1.4 m per 14.1 kta (6/48), £706 k per 7.1 kta (12/42), £472 k per 4.7 kta (18/36), and £355 k per 3.5 kta (24/30), £350 k (fed-batch) and £340 k (fed-batch) both per 3.2 kta of feedstock. The modified version 6/48* has similar OpEx values to the conventional design (£1.4 m per 14.1 kta of feedstock). Only a 2% increase is seen by including electricity costs, e.g., £1.41 m to £1.39 m for 6/48, with and without energy costs per 14.1 kta of feedstock. The OpEx of lignocellulosic biorefineries is affected mainly by the cost of enzymes, representing around 16–20% of the total OpEx. Despite their elevated OpEx values, the superior processing capacity of the 6/48 and 6/48* configurations, translates to a higher revenue stream (£5.8 m per 14.1 kta feedstock), double the 12/42 system (£2.9 m per 7.1 kta feedstock). Revenues are less for the other configurations, £1.9 m (18/36) and £1.42 m (24/30). In the reference systems, the revenues vary for the same sugar production, depending upon the final glucose concentrations. The fed-batch strategy yields higher glucose titers (140 g L−1) than batch hydrolysis (120 g L−1), resulting in a higher revenue stream (£1.6 m to £1.5m, respectively) per 3.2 kta of feedstock. These revenue streams are calculated at favorable market conditions for the sugar and PHS prices but are within the commercial ranges. As the most lignocellulosic slurry is made of water, additional downstream processing and purification are needed to produce the concentrated sugar syrups. The PHS constitutes around 25% of the output, and the feasibility of selling it would have a significant impact on the overall revenues.
Rajendran and Murthy (2017) reported OpEx in the range of £10–35 m for biorefining 60 kta of Bana grass and energy cane into bioproducts including ethanol, ethyl acetate, dodecane, hexane, and electricity. For an SSF-based conversion platform, the OpEx was approx. £10m, equal to £16,000 per kta of processed feedstock. In our systems, maximal OpEx to feedstock ratios of £100,000 per kta were calculated, which is a sixfold increase in the Bana grass/energy cane ethanol production. These great differences can be attributed to an unrealistic enzyme cost, £0.36/kg, set by Rajendran and Murthy (2017). Yang et al. (2014) highlighted that the Department of Energy Biomass Program hopes to meet an enzyme cost of £1.5/kg at a minimum. It seems unlikely that enzyme manufacturers could go down these prices, so the OpEx will not be accurate at this point.
For continuous streams, the profit decreases £4.4 m per 5.2 kta (6/48), £2.2 m per 2.6 kta (12/42), £1.4 m per 1.7 kta (18/36), and £1.07 m per 1.2 kta of glucose (24/30). A considerable economic advantage is observed in fed-batch (£1.23 m) instead of batch processing (£1.12 m) per 1.7 and 1.4 kta of glucose, respectively. As profit is calculated based only on the enzymatic hydrolysis of biomass, it is challenging to compare with other biorefineries which encompass the whole process (Davis et al., 2018a; Davis et al., 2018b). Notwithstanding, the profitability of the process is driven mainly by enzyme costs that are affected by, for example, commercial agreements, choice of formulation, volume required, and frequency of supply. The commercialization of co-products such as lignocellulosic sugar and PHS have wide margins which can impact significantly upon profitability. The other materials are used in less quantity and do not affect the profitability. Depending upon the enzyme, sugar, and PHS costs, the profitability varies, and this was assessed using a sensitivity analysis. SSF-based forestry residue biorefineries generate profit by selling ethanol and co-products (pellets, biogas, and electricity), and profit margins range from £280–425 m over 20 years as a function of the raw materials used (e.g., sawdust/shaving) (Frankó et al., 2016). A 200 kt per annum cellulosic ethanol biorefinery makes ∼£100,000 per kt dry biomass, 3 times less than our best-performing system (6/48, £300,000/kt MSW pulp). So far, the MSW-to-sugars process is more profitable than the SSF-based forestry biorefinery, but the inclusion of further financial parameters and more detailed techno-economic assessment are needed to make final conclusions.
From the economic analysis in Figure 3, the ROI and PP were determined by including the electricity costs (Table 5). Both parameters affect the capital costs of each process configuration. Since unrealistic values were determined using the costs in Table 5, these were modified to give more realistic market results. Generally, higher ROI and lower PP values are reported in process designs with higher profits but lower CapEx ratios and vice versa: 42%/2.39 years (6/48), 17%/5.82 years (12/42), 8%/13.0 years (18/36), and 4.00%/27.9 years (24/30). For the reference systems, two well-defined results are found: 30%/3.33 years (batch) and 22%/4.52 years (fed-batch). From an investor perspective, only the 6/48 and 6/48* configurations are more attractive than the reference batch system (ROI = 30% and PP = 3.33 years), even including energy costs, as these represent higher ROIs (42 and 39%) and lower PPs (2.39 and 2.54), respectively. As with profitability, a supplementary sensitivity analysis is required for studying ROI and PP values across a wider range of conditions, including the worst-case scenarios (i.e., highest enzymes but lower sugar/PHS costs). Under advantageous economic conditions, e.g., £0.35/kg of enzymes, Rajendran and Murthy (2017) estimated that utilizing hexoses and pentoses for ethyl acetate production from Bana grass led to ROI and PP of 8.93% and 11.2 years, respectively. Even in the worst economic case for enzymes and product costs, all the configurations investigated improved ROI (20%–42%) and PP (5–10 years) more than the Rajendran and Murthy example. Inclusion of other factors, such as labor costs and interest rates, in refinement studies would impact the ROI and PP and may provide a more realistic picture.
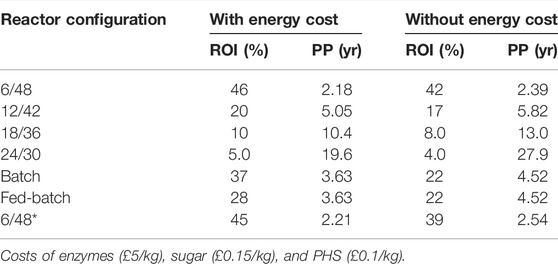
TABLE 5. Financial analysis of demonstration-scale configurations.
3.2.3 Sensitivity Analysis
As seen in Figure 4, the profitability of the 6/48 two-stage configuration at the demonstration scale is a function of enzymes, sugar, and PHS costs. In the worst case, with PHS prices of £0/kg, the enzymatic hydrolysis of MSW pulp starts to be viable at sugar prices of at least £0.24/kg and minimal enzyme costs (£1/kg). However, this scenario is unrealistic with such low enzyme costs and highlights the need to use the PHS stream. An intermediate case, where the PHS price is £0.125/kg, offers more flexibility with the financial case being more robust. The profit is less dependent upon the enzyme cost and sugar price, with profits observed throughout the contour plot. Sensible market prices for the enzymes (£4/kg) and glucose (£0.3/kg) result in profits of over £2 m. With more advantageous conditions, PHS price of £0.25/kg, a minimum profit of £3 m is achieved independently of all costs. Further improvements in manufacturing and increased market competition are necessary to decrease the prices of enzymes to £1.5/kg. Furthermore, if PHS were used as a fuel, it would further improve profitability.
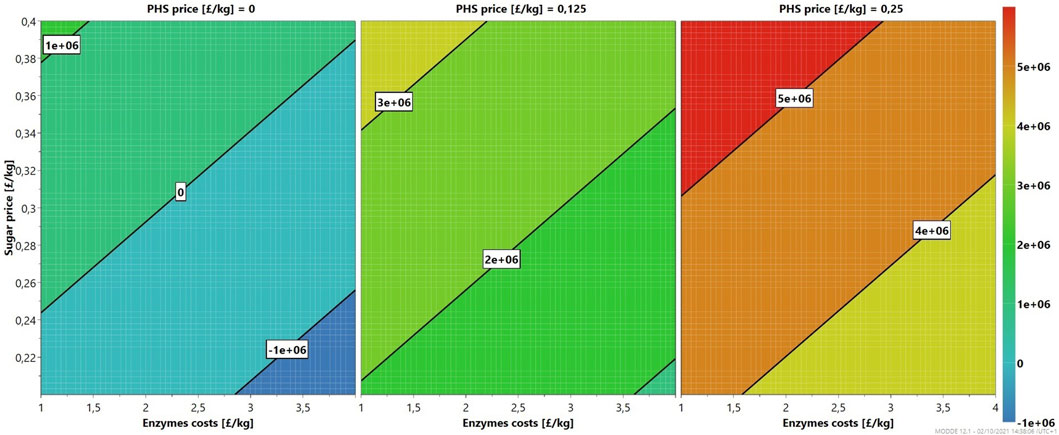
FIGURE 4. Sensitivity analysis (4D contour plots) of the 6/48 demonstration-scale configuration, mapping profits as a function of enzymes and sugar costs for three levels.
Conclusion
Process modeling and simulation, based on experimental reaction kinetics, have enabled a TEA of batch, fed-batch, and continuous modes of operation. By operating in continuous mode, productivity advantages have been validated. The TEA identified a preferred option involving a 6/48 two-stage hydrolysis. Furthermore, the prediction of reaction parameters (glucose yields, glucose rates, and energy efficiency) has provided optimum settings for the design of a continuous system. This study suggests that residence times of 54 h and 25% total solids are required and that these meet industrial requirements and can outperform conventional batch or fed-batch processes. Based on commercial costs, the financial analysis was evaluated at pilot and semi-industrial scales for each configuration, showing that the two-stage continuous system outperforms the other designs. The annual production of lignocellulosic sugars was enhanced by a factor of seven against a reference system and achieved net profits of around £1 m per 5.2 kt of glucose at the demonstration scale.
Data Availability Statement
The original contributions presented in the study are included in the article/Supplementary Material; further inquiries can be directed to the corresponding author.
Author Contributions
FCB and OG co-wrote the manuscript; FCB performed all experimentation and data processing; JB supervised the project. All authors (FCB, OG, DP, and JB) reviewed and approved the final manuscript.
Funding
The Biotechnology and Biological Sciences Research Council granted AB for the Newton Bhabha Industrial Waste: Bio-integrated Valorization of India’s Municipal Solid Waste to Renewable Feedstocks project. More information can be found at: https://gtr.ukri.org/projects?ref = BB%2FS011986%2F1.
Conflict of Interest
Author DP was employed by the company Fiberight Ltd.
The remaining authors declare that the research was conducted in the absence of any commercial or financial relationships that could be construed as a potential conflict of interest.
Publisher’s Note
All claims expressed in this article are solely those of the authors and do not necessarily represent those of their affiliated organizations, or those of the publisher, the editors, and the reviewers. Any product that may be evaluated in this article, or claim that may be made by its manufacturer, is not guaranteed or endorsed by the publisher.
Acknowledgments
The authors would like to thank Fiberight Ltd. for supplying materials and research support, with a special mention to Simone Cinquepalmi and Jamie Sargant. This work was funded in part under the research grant “Newton Bhabha Industrial Waste: Bio-integrated Valorisation of India’s Municipal Solid Waste to Renewable Feedstocks” (BB/S011986/1) and the EPSRC Centre for Doctoral Training in Bioenergy grant (EP/L014912/1).
Supplementary Material
The Supplementary Material for this article can be found online at: https://www.frontiersin.org/articles/10.3389/fenrg.2022.788534/full#supplementary-material
References
Andrić, P., Meyer, A. S., Jensen, P. A., and Dam-Johansen, K. (2010). Reactor Design for Minimizing Product Inhibition during Enzymatic Lignocellulose Hydrolysis: II. Quantification of Inhibition and Suitability of Membrane Reactors. Biotechnol. Adv. 28 (3), 407–425. doi:10.1016/j.biotechadv.2010.02.005
Argo, E., and Keshwani, D. R. (2019). Techno-economic Implications of Fed-Batch Enzymatic Hydrolysis. Processes 7, 847. doi:10.3390/pr7110847
Bradford, M. M. (1976). A Rapid and Sensitive Method for the Quantitation of Microgram Quantities of Protein Utilizing the Principle of Protein-Dye Binding.
Brethauer, S., and Wyman, C. E. (2010). Review: Continuous Hydrolysis and Fermentation for Cellulosic Ethanol Production. Bioresour. Technol. 101 (13), 4862–4874. doi:10.1016/j.biortech.2009.11.009
Climent Barba, F., Chacón, M. G., Reynolds, W. R., Puri, D. J., Bourne, R. A., and Blacker, A. J. (2021). Improved Conversion of Residual MSW Biomass Waste to Sugars Using Online Process Monitoring and Integrated Contamination Control. Bioresour. Technol. Rep. 13, 100612. doi:10.1016/j.biteb.2020.100612
Correâ, L. J., Badino, A. C., and Cruz, A. J. G. (2016). Power Consumption Evaluation of Different Fed-Batch Strategies for Enzymatic Hydrolysis of Sugarcane Bagasse. Bioprocess Biosyst. Eng. 39 (5), 825–833.
da Silva, A. S. A., Espinheira, R. P., Teixeira, R. S. S., de Souza, M. F., Ferreira-Leitão, V., and Bon, E. P. S. (2020). Constraints and Advances in High-Solids Enzymatic Hydrolysis of Lignocellulosic Biomass: A Critical Review. Biotechnol. Biofuels 13 (1), 58. doi:10.1186/s13068-020-01697-w
Dasari, R. K., Dunaway, K., and Berson, R. E. (2009). A Scraped Surface Bioreactor for Enzymatic Saccharification of Pretreated Corn Stover Slurries. Energy fuels. 23 (1), 492–497. doi:10.1021/ef800434u
Dasari, R. K. (2008). High-solids Saccharification and Viscosity Studies in a Scraped Surface Bio-Reactor. [Online]. Available at: http://ir.library.louisville.edu/cgi/viewcontent.cgi?article=1312&context=etd.
Davis, R., Bartling, A., and Tao, L. (2018). Biochemical Conversion of Lignocellulosic Biomass to Hydrocarbon Fuels and Products: 2019 State of Technology and Future Research.
Davis, R., Grundl, N., Tao, L., Biddy, M. J., Tan, E. C. D., Beckham, G. T., et al. (2018). Process Design and Economics for the Conversion of Lignocellulosic Biomass to Hydrocarbon Fuels and Coproducts. 2018 Biochem. Des. Case Update.
Davis, R., Tao, L., Scarlata, C., and Tan, E. C. D. (2015). Process Design and Economics for the Conversion of Lignocellulosic Biomass to Hydrocarbons: Dilute-Acid and Enzymatic Deconstruction of Biomass to Sugars and Catalytic Conversion of Sugars to Hydrocarbons. Golden, CO, USA: NREL. doi:10.1021/ed060p574
Davis, R., Tao, L., Tan, E. C. D., Biddy, M. J., Beckham, G. T., Scarlata, C., et al. (2013). Process Design and Economics for the Conversion of Lignocellulosic Biomass to Hydrocarbons: Dilute-Acid and Enzymatic Deconstruction of Biomass to Sugars and Biological Conversion of Sugars to Hydrocarbons. Golden, CO, USA: NREL. doi:10.2172/1107470
De Gooijer, C. D., Bakker, W. A. M., Beeftink, H. H., and Tramper, J. (1996). Bioreactors in Series: An Overview of Design Procedures and Practical Applications. Enzyme Microb. Technol. 18 (3), 202–219. doi:10.1016/0141-0229(95)00090-9
Frankó, B., Galbe, M., and Wallberg, O. (2016). Bioethanol Production from Forestry Residues: A Comparative Techno-Economic Analysis. Appl. Energy 184, 727–736. doi:10.1016/j.apenergy.2016.11.011
Ghorbanian, M., Russ, D. C., and Berson, R. E. (2014). Mixing Analysis of PCS Slurries in a Horizontal Scraped Surface Bioreactor. Bioprocess Biosyst. Eng. 37 (10), 2113–2119. doi:10.1007/s00449-014-1189-2
Ghorbanpour Khamseh, A. A., and Miccio, M. (2012). Comparison of Batch, Fed-Batch and Continuous Well-Mixed Reactors for Enzymatic Hydrolysis of Orange Peel Wastes. Process Biochem. 47 (11), 1588–1594. doi:10.1016/j.procbio.2011.10.018
Gnansounou, E., and Dauriat, A. (2010). Techno-economic Analysis of Lignocellulosic Ethanol: A Review. Bioresour. Technol. 101 (13), 4980–4991. doi:10.1016/j.biortech.2010.02.009
Gurram, R. N., and Menkhaus, T. J. (2014). Continuous Enzymatic Hydrolysis of Lignocellulosic Biomass with Simultaneous Detoxification and Enzyme Recovery. Appl. Biochem. Biotechnol. 173 (6), 1319–1335. doi:10.1007/s12010-014-0873-7
Humbird, D., Davis, R., Tao, L., Kinchin, C., Hsu, D., and Aden, A. (2011). Process Design and Economics for Biochemical Conversion of Lignocellulosic Biomass to Ethanol. Renew. Energy 303, 147.
Humbird, D., Davis, R., Tao, L., Kinchin, C., Hsu, D., and Aden, A. (2011). Process Design and Economics for Biochemical Conversion of Lignocellulosic Biomass to Ethanol: Dilute-Acid Pretreatment and Enzymatic Hydrolysis of Corn Stover. Tech. Rep. 2011, 153–170. doi:10.4324/9780429290602-8
Joelsson, E., Wallberg, O., and Börjesson, P., (2015). Integration Potential, Resource Efficiency and Cost of Forest-Fuel-Based Biorefineries. Comput. Chem. Eng. 82, 240–258. doi:10.1016/j.compchemeng.2015.07.011
Jørgensen, H., Vibe-Pedersen, J., Larsen, J., and Felby, C. (2007). Liquefaction of Lignocellulose at High-Solids Concentrations. Biotechnol. Bioeng. 96 (5), 862–870. doi:10.1002/bit.21115
Kadić, A., Palmqvist, B., and Lidén, G. (2014). Effects of Agitation on Particle-Size Distribution and Enzymatic Hydrolysis of Pretreated Spruce and Giant Reed. Biotechnol. Biofuels 7 (1), 77. doi:10.1186/1754-6834-7-77
Kazi, F. K., Fortman, J. A., Anex, R. P., Hsu, D. D., Aden, A., Dutta, A., et al. (2010). Techno-economic Comparison of Process Technologies for Biochemical Ethanol Production from Corn Stover. Fuel 89 (Suppl. 1), S20–S28. doi:10.1016/j.fuel.2010.01.001
Lindberg, T. (2010). An Application of DOE in the Evaluation of Optimization Functions in a Statistical Software. [Online]. Available at: http://www.diva-portal.se/smash/get/diva2:393126/FULLTEXT01.pdf (Accessed Feb 23, 2021).
Lischeske, J. J., and Stickel, J. J. (2019). A Two-phase Substrate Model for Enzymatic Hydrolysis of Lignocellulose: Application to Batch and Continuous Reactors. Biotechnol. Biofuels 12 (1). doi:10.1186/s13068-019-1633-2
Longati, A. A., Lino, A. R. A., Giordano, R. C., Furlan, F. F., and Cruz, A. J. G. (2018). Defining Research & Development Process Targets through Retro-Techno-Economic Analysis: The Sugarcane Biorefinery Case. Bioresour. Technol. 263, 1–9. doi:10.1016/J.BIORTECH.2018.04.102
MacRelli, S., Mogensen, J., and Zacchi, G. (2012). Techno-economic Evaluation of 2nd Generation Bioethanol Production from Sugar Cane Bagasse and Leaves Integrated with the Sugar-Based Ethanol Process. Biotechnol. Biofuels 5 (1), 22. doi:10.1186/1754-6834-5-22
Mesa, L., López, N., Cara, C., Castro, E., González, E., and Mussatto, S. I. (2016). Techno-economic Evaluation of Strategies Based on Two Steps Organosolv Pretreatment and Enzymatic Hydrolysis of Sugarcane Bagasse for Ethanol Production. Renew. Energy 86, 270–279. doi:10.1016/J.RENENE.2015.07.105
Mosier, N., Wyman, C., Dale, B., Elander, R., Lee, Y. Y., Holtzapple, M., et al. (2005). Features of Promising Technologies for Pretreatment of Lignocellulosic Biomass. Bioresour. Technol. 96 (6), 673–686. doi:10.1016/j.biortech.2004.06.025
Nguyen, Q. A., Dickow, J. H., Duff, B. W., Farmer, J. D., Glassner, D. A., Ibsen, K. N., et al. (1996). NREL/DOE Ethanol Pilot-Plant: Current Status and Capabilities. Bioresour. Technol. 58 (2), 189–196. doi:10.1016/S0960-8524(96)00098-3
Noorman, H. J., Van Winden, W., Heijnen, J. J., and Van Der Lans, R. G. J. M. (2018). CHAPTER 1. Intensified Fermentation Processes and Equipment. Intensif. Biobased Process. 2018, 1–41. doi:10.1039/9781788010320-00001
Olivieri, G., Wijffels, R. H., Marzocchella, A., and Russo, M. E. (2021). Bioreactor and Bioprocess Design Issues in Enzymatic Hydrolysis of Lignocellulosic Biomass. Catalysts 11 (6), 680. doi:10.3390/catal11060680
Palmqvist, B., Kadić, A., Hägglund, K., Petersson, A., and Lidén, G. (2016). Scale-up of High-Solid Enzymatic Hydrolysis of Steam-Pretreated Softwood: the Effects of Reactor Flow Conditions. Biomass Conv. bioref. 6 (2), 173–180. doi:10.1007/s13399-015-0177-3
Park, S., Baker, J. O., Himmel, M. E., Parilla, P. A., and Johnson, D. K. (2010). Cellulose Crystallinity Index: Measurement Techniques and Their Impact on Interpreting Cellulase Performance. Biotechnol. Biofuels 3 (1), 10. doi:10.1186/1754-6834-3-10
Piccolo, C., and Bezzo, F. (2009). A Techno-Economic Comparison between Two Technologies for Bioethanol Production from Lignocellulose. Biomass Bioenergy 33 (3), 478–491. doi:10.1016/j.biombioe.2008.08.008
Puri, D. J., Heaven, S., and Banks, C. J. (2013). Improving the Performance of Enzymes in Hydrolysis of High Solids Paper Pulp Derived from MSW. Biotechnol. Biofuels 6 (1), 107. doi:10.1186/1754-6834-6-107
Rajendran, K., and Murthy, G. S. (2017). How Does Technology Pathway Choice Influence Economic Viability and Environmental Impacts of Lignocellulosic Biorefineries? Biotechnol. Biofuels 10 (1), 268. doi:10.1186/s13068-017-0959-x
Rao, N. N., Lütz, S., Würges, K., and Minör, D. (2009). Continuous Biocatalytic Processes. Org. Process Res. Dev. 13 (3), 607–616. doi:10.1021/op800314f
Rosales-Calderon, O., and Arantes, V. (2019). Biotechnology for Biofuels A Review on Commercial - Scale High - Value Products that Can Be Produced Alongside Cellulosic Ethanol. Biomed. Cent. 12, 240. doi:10.1186/s13068-019-1529-1
Sluiter, A., Hames, B., Ruiz, R., Scarlata, C., Sluiter, J., Templeton, D., et al. (2012). Determination of Structural Carbohydrates and Lignin in Biomass. Lab. Anal. Proced. Lap. 2008, 17.
Sotaniemi, V.-H., Taskila, S., Ojamo, H., and Tanskanen, J. (2016). Controlled Feeding of Lignocellulosic Substrate Enhances the Performance of Fed-Batch Enzymatic Hydrolysis in a Stirred Tank Reactor. Biomass Bioenergy 91, 271–277. doi:10.1016/j.biombioe.2016.05.037
Stickel, J. J., Adhikari, B., Sievers, D. A., and Pellegrino, J. (2018). Continuous Enzymatic Hydrolysis of Lignocellulosic Biomass in a Membrane‐reactor System. J. Chem. Technol. Biotechnol. 93 (8), 2181–2190. doi:10.1002/jctb.5559
Tao, L., Schell, D., Davis, R., Tan, E., Elander, R., and Bratis, A. (2014). NREL 2012 Achievement of Ethanol Cost Targets : Biochemical Ethanol Fermentation via Dilute-Acid Pretreatment and Enzymatic Hydrolysis of Corn Stover. Tech. Rep. 43.
Tribe, M. A., and Alpine, R. L. W. (1986). Scale Economies and the "0.6 Rule". Eng. Costs Prod. Econ. 10 (4), 271–278. doi:10.1016/S0167-188X(86)80025-8
Visser, E. M., Leal, T. F., De Almeida, M. N., and Guimarães, V. M. (2015). Increased Enzymatic Hydrolysis of Sugarcane Bagasse from Enzyme Recycling. Biotechnol. Biofuels 8 (1), 5. doi:10.1186/s13068-014-0185-8
Wingren, A., Galbe, M., and Zacchi, G. (2003). Techno-economic Evaluation of Producing Ethanol from Softwood: Comparison of SSF and SHF and Identification of Bottlenecks. Biotechnol. Prog. 19 (4), 1109–1117. doi:10.1021/bp0340180
Keywords: techno-economical assessment, process modeling, enzymatic hydrolysis, scale-up, municipal solid waste
Citation: Climent Barba F, Grasham O, Puri DJ and Blacker AJ (2022) A Simple Techno-Economic Assessment for Scaling-Up the Enzymatic Hydrolysis of MSW Pulp. Front. Energy Res. 10:788534. doi: 10.3389/fenrg.2022.788534
Received: 02 October 2021; Accepted: 16 16 May 20222022;
Published: 28 June 2022.
Edited by:
Anuj Kumar Chandel, University of São Paulo, BrazilReviewed by:
Yogendra Shastri, Indian Institute of Technology Bombay, IndiaJuan Gabriel Segovia Hernandez, University of Guanajuato, Mexico
Copyright © 2022 Climent Barba, Grasham, Puri and Blacker. This is an open-access article distributed under the terms of the Creative Commons Attribution License (CC BY). The use, distribution or reproduction in other forums is permitted, provided the original author(s) and the copyright owner(s) are credited and that the original publication in this journal is cited, in accordance with accepted academic practice. No use, distribution or reproduction is permitted which does not comply with these terms.
*Correspondence: A. John Blacker, Si5CbGFja2VyQGxlZWRzLmFjLnVr