 Kristian Melin
 Harri Nieminen2
 Daniel Klüh
 Arto Laari
 Tuomas Koiranen
- 1LUT School of Engineering Science, LUT University Lahti Campus, Lahti, Finland
- 2LUT School of Engineering Science, LUT University Lappeenranta Campus, Lappeenranta, Finland
- 3Technical University of Munich, Campus Straubing for Biotechnology and Sustainability, Professorship of Regenerative Energy Systems, Straubing, Germany
In order to limit climate change, fast greenhouse gas reductions are required already before 2030. Ethanol commonly produced by fermentation of sugars derived either from starch-based raw material such as corn, or lignocellulosic biomass is an established fuel decarbonizing the transport sector. We present a novel selective and flexible process concept for the production of ethanol with electricity and lignocellulosic biomass as main inputs. The process consists of several consecutive steps. First synthesis gas from gasification of biomass is purified by filtration and reforming and fed to methanol synthesis. The produced methanol is fed to acetic acid synthesis, together with a carbon monoxide-rich stream separated from the synthesis gas by membranes. Finally, acetic acid is hydrogenated to yield ethanol. With the exception of acetic acid hydrogenation, the overall process consists of technically mature subprocesses. Each process step was modelled in Aspen Plus to generate the mass and energy balances for the overall process. Additionally, the CO2 emissions and economic feasibility were assessed. Three separate cases were investigated. In the first two cases, the syngas carbon (CO and CO2) was split between methanol and acetic acid synthesis. The cases included either allothermal (case A) or electrically heated reforming (case B). In case C, maximum amount of CO was sent to acetic acid synthesis to maximize the acetic acid output, requiring a small additional carbon dioxide input to methanol synthesis. In all cases, additional hydrogen to methanol synthesis was provided by water electrolysis. Each case was designed at biomass input of 27.9 MW and the electrolyzer electricity requirement between 36 and 43.5 MW, depending on the case. The overall energy efficiency was calculated at 53–57%, and carbon efficiencies were above 90%. The lowest levelized cost of ethanol was 0.65 €/l, at biomass cost of 20 €/MWh and electricity cost of 45 €/MWh and production scale of approximately 42 kt ethanol per year. The levelized cost is competitive with the current biological route for lignocellulosic ethanol production. The ethanol price is very sensitive to the electricity cost, varying from 0.56 to 0.74 €/l at ±30% variation in electricity cost.
Introduction
Drastic reduction of CO2 emissions is needed to limit the consequences of climate change, according to the latest sixth assessment report by the Intergovernmental Panel on Climate Change (IPCC, 2021). One way to reduce the carbon emissions of the transportation sector is to produce fuels based on renewable sources such as wood and straw residues, or renewable electricity.
One pathway for the conversion of lignocellulosic biomass into biofuels is via gasification, followed by gas cleaning and chemical synthesis into liquid fuels such as methanol or Fisher -Tropsch (FT) liquids, or into gaseous fuels such as hydrogen or synthetic natural gas. Usually, the fuel produced via gasification can be either mixed in low amounts (e.g., 3 wt% of methanol) in gasoline, or alternatively they require new infrastructure for distribution, which is the case for hydrogen, for example. Drop-in fuel production from FT-liquids typically requires additional processing steps such as isomerisation or hydrocracking after production. In the EU, ethanol is already mixed with gasoline at up to 10 wt% or in RE-85 at up to 85 wt%. In addition, up to 90% ethanol has been used in ED95 fuel suitable for special heavy transport diesel engines (Neot Group, 2021). Compared to methanol, ethanol is more compatible with existing fuel infrastructure. It has also a higher energy density 27 MJ/kg vs. 20 MJ/kg (Iliev, 2018). However, produced via gasification of biomass followed by chemical synthesis from synthesis gas, production of ethanol requires more synthesis steps compared to methanol. Commercial production of ethanol involves fermentation of sugars produced by hydrolysis of cellulose and hemicelluloses. The energy yield of liquid fuel obtained through this pathway has been estimated at only 25–30% of the forest biomass energy content (Frankó et al., 2016). Another author Barta et al. (2010) report higher energy yield of bioethanol 33–34% and if also the co-product upgraded biogas is used as transportation fuel the energy yield can reach 51–58%. The fuel yield of liquid fuel is significantly lower compared to typical energy yields in liquid fuels production via gasification. For instance, the energy yield has been estimated at 50–60% for biomass gasification and conversion to methanol, FT or gasoline produced via methanol-to-gasoline (MTG) (Hannula and Kurkela, 2013).
Ethanol can also be produced from syngas through mixed alcohol synthesis; however, this process has not yet been applied at commercial scale. Mixed alcohol synthesis is not selective to ethanol, and in order to maintain a high selectivity to ethanol, the per-pass conversion should be limited (Dutta et al., 2012). Furthermore, syngas can be used in a gas fermentation process as already commercialized by LanzaTech (Köpke et al., 2011). Enerkem has constructed a plant for the conversion of waste to methanol/ethanol in Edmonton, Canada, at ethanol output of approximately 30 MW. This plant uses assorted wastes as feedstock (Brown et al., 2020). Additionally, biochemical conversion paths based on cellulosic biomass are investigated. An example is the commercialized Sunliquid process by Clariant (Hortsch and Corvo, 2020). Recent demonstration and commercial scale plants producing cellulosic bioethanol are listed by Brown et al. (2020).
An alternative pathway consisting of methanol and acetic acid production followed by hydrogenation of acetic acid into ethanol has been studied by Zhu and Jones (2009). Later, Brown (2015) reviewed this process route and other cellulosic fuel production pathways based on their technical challenges and techno-economic performance. Although acetic acid hydrogenation to ethanol has not been implemented at commercial scale, it has been demonstrated as part of a process operated by ZeaChem, producing approximately 190 L of ethanol per hour (Eggeman and O’Neill, 2016). An approach used by the Enerkem company is to convert methanol into ethanol via carbonylation producing methyl acetate as intermediate product. Subsequently, methyl acetate is converted by hydrogenolysis into ethanol and methanol, which is recycled back to a previous step in the process (Stéphane et al., 2011).
One challenge with using biomass as raw material is the availability of biomass and required transport of huge volumes of biomass to a large-scale industrial plant. Hannula (2015) studied hybrid production of biofuel using both electricity and biomass. Electrolytic hydrogen-supplemented biofuel production resulted in more cost-efficient production of biofuel compared to non-biomass synfuels (electrofuels) under a wide range of economic assumptions. Later Isaacs et al. (2021) compared the economic and environmental performance of several electrofuel and hybrid biomass fuel pathways in the United States. They found the hybrid electricity- and biomass-based pathway to liquid fuels the most competitive and sustainable option. However, the results were sensitive to the electricity source characteristics, most importantly the cost and emissions. Lately, the company Enerkem has announced an investment into a 87 MW electrolyser in connection with their new planned plant in Varennes that will convert 200,000 tonnes of non-recyclable waste and wood waste into nearly 125 million litres of biofuels annually (Enerkem, 2020).
The advantage of the hybrid approach is that the fuel and carbon yield can be significantly increased compared to using only biomass. When the hydrogen needed to produce fuel is supplemented instead of produced via water gas shift reaction from carbon monoxide, all the carbon in the synthesis gas present as carbon monoxide and carbon dioxide can be converted into fuel products, increasing the yield significantly. According to Hannula (2016), the biofuel yield could be increased by up to 2.6, for biogasoline and 3.1-fold for methane production over reference biomass-only plant configurations when oxygen gasification was used and all the gasification derived CO2 was hydrogenated into synthetic fuels.
Another advantage of hydrogen enrichment of biofuel production is that the process can be operated in a flexible way balancing the production and consumption of electricity: the hydrogen enrichment ‘storing’ power in the form of fuels can be performed when excess renewable power is available from wind or solar sources. When excess electricity is not available, biofuel can still be produced without hydrogen supplementation but at lower yield.
In the pathway studied here, biomass carbon can be converted via gasification, organic chemical synthesis and additional hydrogen supplementation with a high carbon efficiency into the fuel product. Furthermore, even extra carbon as CO2 could be added and converted into methanol, increasing the fuel yield above 100% based on the biomass carbon input. The studied pathway differs from the Enerkem process as acetic acid and not methyl acetate is produced as an intermediate. The benefit of the present process alternative is that methanol does not need to be recycled from the hydrogenation back to the acetic acid production step. Furthermore, the last hydrogenation step can be performed flexibly at a different location from acetic acid production, using hydrogen produced from renewable electricity. With the exception of the final acetic acid conversion to ethanol, the process stages considered in the overall process represent high-technical readiness level, commercially available technology. In one of the process configurations, we consider electrical reforming leading to higher conversion efficiency, as recently demonstrated for steam methane reforming (Wismann et al., 2019).
In this study, the objective is to provide a first estimate of the yield and cost of fuel produced via the suggested hybrid biomass/power-to-ethanol route via acetic acid hydrogenation, and to compare the cost against other hybrid biomass and state of art electrofuel pathways. It is also investigated how different levels of hydrogen supplementation influence the yield, carbon efficiency and cost of ethanol produced. Additionally, the options of traditional allothermal reforming with oxygen feed or electrically heated reforming of biomass-derived synthesis gas were compared. To estimate the potential for emission reduction, the process carbon balance and resulting emission factor for the ethanol product was calculated for each process configuration and for different electricity sources.
Materials and Methods
In this section, the investigated processes and cases are introduced and the assumptions and methodology for calculating the mass and energy balances and estimating the process economics are presented.
Process Description and Investigated Cases
Three different cases (A–C) for the production of ethanol were investigated in this study. In all three cases, synthesis gas is produced via gasification of forest residues, and additional hydrogen is supplied from water electrolysis in order to achieve a high carbon conversion from biomass. The idea is to produce the needed carbon monoxide via biomass gasification, which has a relatively high conversion efficiency on energy basis and the needed additional hydrogen with water electrolysis. Additional carbon monoxide could be produced by feeding additional carbon dioxide and hydrogen to the reforming step however this would lead to lower conversion efficiency compared to the studied concept. The cases differ in terms of the type of reformer, and the split of carbon from the gasification syngas into the methanol and acetic acid synthesis steps. The modelling cases are summarized as follows, and the process configuration in different cases is illustrated in Figure 1.
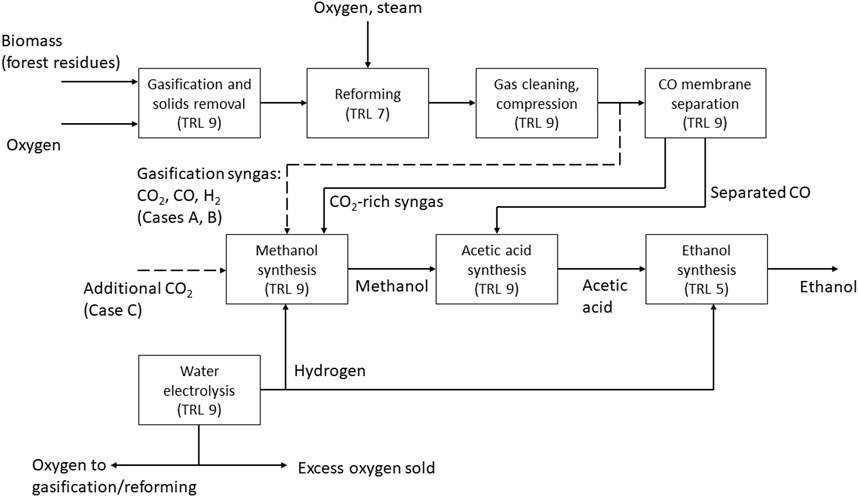
FIGURE 1. Block diagram of the process in Cases A–C, with technical readiness levels (TRL) for the process steps. Solid lines represent connections valid for all cases, dashed lines represent specific connections.
Case A: The reformer is fed with oxygen to reach a temperature of 950 °C. The split of syngas is adjusted to meet the carbon demand of methanol and acetic acid synthesis.
Case B: The reforming is heated with electricity to 950 °C. The split of syngas is adjusted to meet the carbon demand of methanol and acetic acid synthesis.
Case C: The reformer is fed with oxygen like in case A. All syngas is processed in the membrane separation to reach a maximum CO stream to acetic acid synthesis. Additional carbon dioxide is supplied to the methanol synthesis.
The process is based on the oxygen blown gasification of biomass (forest residues) which is dried before gasification. After reforming and gas cleaning, the syngas stream is split into a fraction directly routed to methanol synthesis and a fraction continuing to two-stage membrane separation. The membrane separation step yields a high purity carbon monoxide stream (retentate) that is sent to acetic acid synthesis. The permeate (mostly CO2 and H2) from the first membrane separation stage is fed to methanol synthesis together with the split fraction mentioned above. Additional hydrogen from water electrolysis is added to methanol synthesis to adjust the carbon/hydrogen ratio.
In Cases A and B, the split syngas stream to methanol synthesis is adjusted to maintain an even split of total carbon (CO and CO2) between methanol and acetic acid synthesis. Thus, all the methanol produced can be converted into acetic acid, maximizing the acetic acid output. In case C the amount of CO fed to acetic acid synthesis is maximized within the capability of the membrane separation. Supplementary CO2 is fed to methanol synthesis in order to match the amount of methanol produced to the CO input routed to acetic acid synthesis.
In all cases, the produced acetic acid is further hydrogenated to ethanol. Hydrogen for acetic acid hydrogenation is also produced by water electrolysis. Here, alkaline electrolysis is assumed due to high technical maturity and relatively low costs compared to alternative technologies IRENA (2020). It is noted that the added dynamic and part-load operation capabilities of polymer electrolyte membrane (PEM) electrolyzers could be an advantage in the present concept based on the flexible use of variable electricity sources based on availability. However, details on electrolyzer operation are outside the scope of the present study. Oxygen from water electrolysis is used in gasification, with excess oxygen sold for other uses.
It is noted that additional carbon monoxide could be produced by feeding extra hydrogen and CO2 to the reformer, further increasing the acetic acid and ethanol yield based on the biomass input. However, this option was not investigated in this study.
Key Performance Indicators for Efficiency and Cost
The performance of the process was evaluated based on key performance indicators including carbon efficiency (CE) and power/biomass-to-ethanol to ethanol efficiency. For economic evaluation, the levelized cost of ethanol is estimated.
Carbon Efficiency
The CE is calculated as shown in Eq. 1:
where
Power/Biomass-to-Ethanol Energy Efficiency
The overall energy efficiency from biomass and electricity to ethanol is calculated using Eq. 2. The efficiency is based on the ratio of the energy content of ethanol product to the combined energy content of biomass input and electrical energy used in electrolysis, pumps and compressors. Resulting figures can be compared to other studies and processes presented in the literature.
where
CO2 Balance
The emission factor for the ethanol product (g CO2 per MJ of fuel) is calculated according to Eq. 3. For a rough calculation, only upstream emissions related to biomass, emissions from the electricity consumption, and a credit for bound CO2 are considered. The process itself is self-sufficient on heat.
The consumption-based emission factors used are shown in Table 1. The system boundary for the calculation is the production site including scope one and two emissions. For the emission factor for electricity, two scenarios based on the German and Finnish grid mix are calculated. For case C, additional carbon dioxide can be added to the process. The added CO2 is of biogenic origin, which is consumed and bound to the ethanol product and can therefore be considered with negative emissions in the calculation as it is a sink for CO2.
where
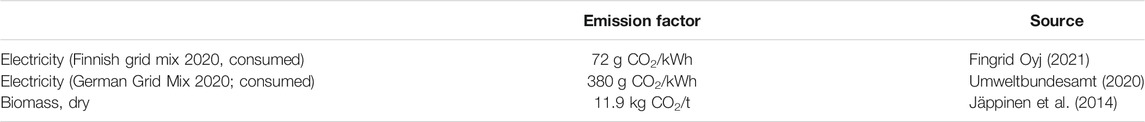
TABLE 1. Emission factors used in calculation of the CO2 balance.
Pel electrical power requirement, MW.
Economics
The levelized cost of ethanol production per energy unit of ethanol (lower heating value basis) is based on Eq. 4:
where.
Nox Amount of surplus O2 ton/dry biomass.
NCO2 Amount of CO2 imported ton/ton dry biomass.
The economic parameters presented in Table 2 are used in the calculations. The economics were evaluated for mature technology using so called Nth plant cost estimate. In addition, a separate case with a 6-fold production capacity (case A 6x) was calculated to illustrate the effect of scale on the production cost. Investment costs were scaled according to Eq. 5, using specific capacity exponents for a particular process section or type of equipment, based on reference data. The reference data, together with the scaled capital costs shown for case A as example, are presented in Table 17 in the Supplementary information.
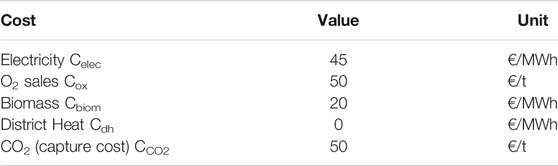
TABLE 2. Economic parameters used in calculations.
The investment cost for the first plant is usually significantly higher and therefore another separate case (case A first) was calculated based on reported cost by the Enerkem methanol/ethanol plant (Brown et al., 2020). The CAPEX can, however, be expected to be lowered over time by the well-known learning curve mechanisms such as process improvements based on previous operating experiences for previous plants, improved and more (cost-) effective plant configurations and plant size (economies of scale) (Irena and methanol institute, 2021).
Process Modelling
All sub-processes were modelled in the chemical process simulation software Aspen Plus to generate the mass and energy balances. The assumptions and methodology used in the modelling of each sub-process are described in detail below. The Aspen Plus flowsheet, together with model specifications and stream tables, for every subprocess and case are presented in the Supplementary Material. The electrolysis was modelled as a black box with an efficiency of 60% based on the LHV of hydrogen. Electrolysis is assumed to be operated at 30 bar and 80 C. The efficiency and operating conditions are within the reference range for alkaline electrolyzer systems (Buttler and Spliethoff, 2018).
Gasification, Reforming and Membrane Separation
In this case, pressurized oxygen-based gasification is used because more oxygen than needed can be produced as by-product in water electrolysis. This pressurized biomass gasification process, including steam and oxygen gasification and gas cleaning to reach sufficient purity for FT or methanol synthesis, has been demonstrated by VTT (Simell et al., 2014; Kurkela et al., 2016; Frilund et al., 2021). Usually, oxygen production requires an additional air separation unit. Formation of carbon on the catalyst is known to occur in reforming of hydrocarbons particularly at elevated pressures, if too low amount of steam is present compared to the hydrocarbons. Although carbon formation is included in the simulation model, confirmation that carbon is not formed at particular process conditions would require experimental work. The details of the gasification process are illustrated in Figure 2. Specifications of the biomass used for gasification is in Table A1 in the Appendix. As property method, the Redlich- Kwong-Soave equation of state was used. The process step and key model parameters are the following: First, forest residues are dried from 50 wt% to approximately 13 wt% moisture content. The biomass is gasified with oxygen fed to the gasifier together with low-pressure steam. The gasifier was modelled with a corrected equilibrium model where the methane content was specified to be approximately 10 mol% corresponding to a realistic gas composition. After the gasifier, the gas is filtered and fed to the catalytic reformer that is operated allothermally (cases A and C) or heated electrically (case B). The catalytic reformer was modelled with an equilibrium model and the electrical reformer was assumed to have 100% efficiency from electricity to heat.
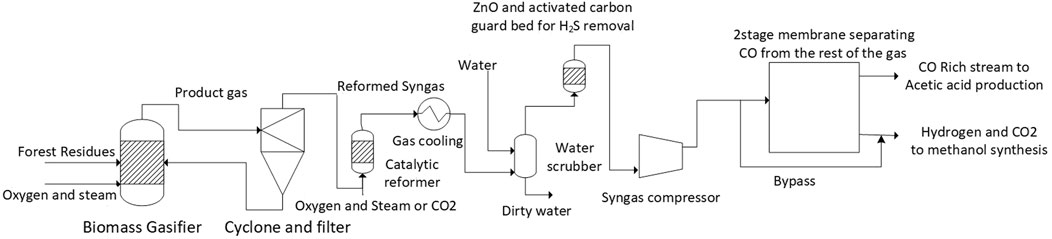
FIGURE 2. Flowsheet of the gasification and reforming section.
After the reforming step the gas is cooled and remaining tar components, sulfur impurities (H2S, COS), ammonia and HCl are removed in a ZnO and activated carbon bed and water scrubber modelled with a component separator in the model. The clean gas is then compressed and separated using a two-stage membrane process in which the gas mixture is separated into two streams. The first stream contains >99 vol% CO and is fed to the acetic acid synthesis. The second stream, fed to the methanol synthesis, contains the major part of hydrogen and carbon dioxide, as well as some residual CO and methane.
Separation of carbon monoxide from the product gas stream is performed with a two-stage membrane separation process. Membrane separation was modelled as a splitter with fixed split ratios for the different components. This separation concept has been used in industry and the reported mole purity is in line with the outcome of our simplified membrane separation model (Teuner et al., 2001).
Methanol Production
As illustrated in Figure 2, there are two separate feed streams to the methanol synthesis stage. The major component of total feed consists of the tail gas from the membrane separation section. The second feed stream is directly split from the purified gasification gas prior to the membrane separation. Furthermore, additional hydrogen is input from water electrolysis to adjust the syngas composition, setting the stoichiometric number (Eq. 6) to the value of 2.05.
where
The methanol synthesis process is based on the conversion of syngas on Cu/ZnO catalyst, corresponding to the industrial practice (Ott et al., 2010). Methanol is formed via hydrogenation of CO2 and CO as described by Eqs 7–9. Eq. 9 represents the reverse water gas shift side reaction that is also activated on the Cu/ZnO catalyst. The process flowsheet is presented in Figure 3. The process is modelled using RKSMHV2 property method based on the modified Redlich-Kwong-Soave equation of state for the high-pressure (>10 bar) sections, and the Non-random two-liquid (NRTL) activity coefficient-based model for low-pressure sections (Van-Dal and Bouallou, 2013).
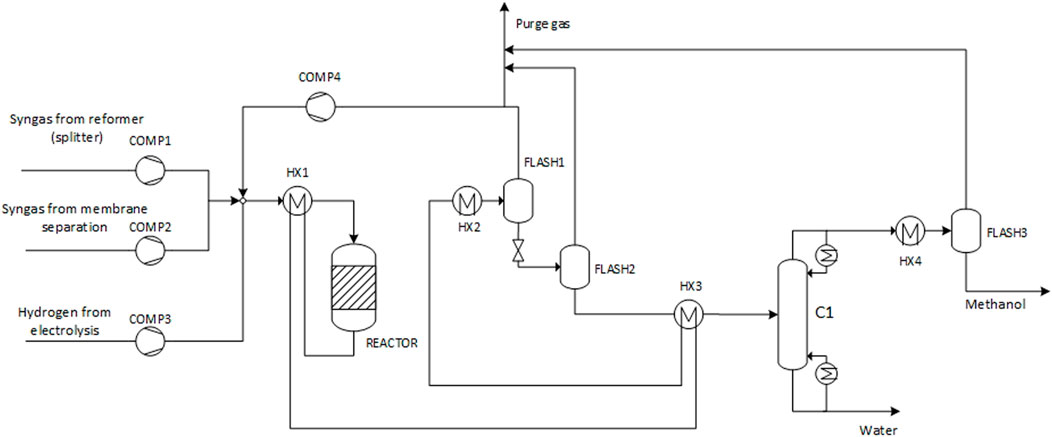
FIGURE 3. Flowsheet of the methanol synthesis process (case A).
The fresh feed is mixed with the recycle gases and pre-heated to the temperature of 215 C by transfer of heat from the hot reactor outlet gas. The feed is converted in an isothermal, water-cooled reactor operated at 250 C. The reactor is modelled using the kinetic model by Vanden Bussche and Froment (1996), with readjusted parameters as given in Mignard and Pritchard (2008). The reacting mixture reaches chemical equilibrium in the reactor. Reaction heat is utilized by generation of steam at the reactor temperature, assuming 85% efficiency. Pressure drop over the reactor is calculated by the Ergun equation. An additional pressure drop of 1 bar is assumed on both hot and cold sides in the pre-heater, resulting in an overall pressure drop of approximately 2 bar over the reactor loop.
The reactor outlet gas is successively cooled in the reactor pre-heater, the distillation column pre-heater, and a final condenser. Methanol and water produced in the reactor are mostly condensed at the final temperature of 32 °C and separated from the unreacted gases in a high-pressure gas-liquid separator. The separated gases are recycled to the reactor feed following a 0.5% purge. The pressure of the liquid stream is reduced to atmospheric, and residual light components are removed in a successive low-pressure gas-liquid separator.
The liquid product stream then enters the methanol/water distillation column following pre-heat in the heat exchanger. Heat (at 99 C) to the column reboiler is supplied by steam, generated in the reactor and by waste heat (purge) combustion. Water is removed from the bottom of the column. The top product consists of methanol at the purity required to meet the requirement of the following acetic acid production process. Besides residual water, the stream contains a small fraction of dissolved gases. Following cooling and condensation, the final methanol product is yielded after flashing of gases. The purity is 95.2 w-% as required by the acetic acid synthesis process. Purged combustible gases from the recycle and gas-liquid separators are routed to waste heat combustion to provide high-grade heat.
Acetic Acid Production
In industrial scale, 85% of the worldwide acetic acid production is based on the carbonylation of methanol as shown in Eq. 10 (Kalck et al., 2020). The early development of the carbonylation process driven by Monsanto used a rhodium catalyst (Jones, 2000). Later, the Cativa process was established which uses an iridium catalyst (Jones, 2000). The Cativa process is the industrially established process for the production of acetic acid. Further development of processes for acetic acid production was undertaken and is ongoing for example on the raw material basis and on immobilized catalysts (Le Berre et al., 2010; Yoneda et al., 2010).
In this paper the Cativa process was modelled. NRTL with the Hayden-O'Connell equation of state for the vapor phase was used. The Hayden-O'Connell model takes into account the dimerization of carboxylic acids. The following compounds were imported to the simulation: CO, CO2, CH3I (methyl iodide), CH3COOH (acetic acid), H2O, CH3OH (methanol), CH4, CH3CH2COOH (propionic acid), H2 and CH3COOCH3 (methyl acetate). The catalyst was not explicitely modelled. Figure 4 shows the flowsheet as modelled in Aspen Plus based on Torrence et al. (2013). The process can be divided into the reaction section and the purification section.
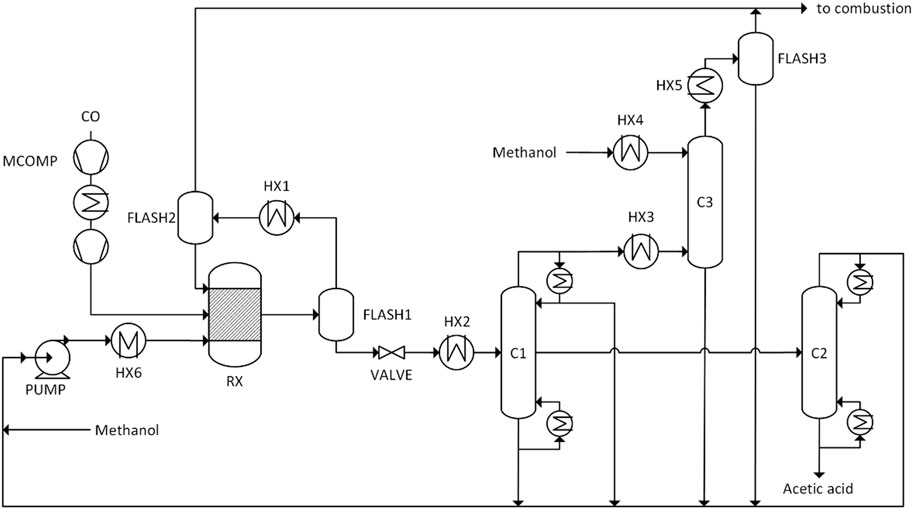
FIGURE 4. Flowsheet of the Cativa process for the production of acetic acid.
The feed to the reactor is composed of the reactant species methanol and carbon monoxide as well as catalyst and auxiliary materials. The carbon monoxide is compressed in a two-stage compressor to reach the reaction pressure of 35 bar. The liquid feed to the reactor is composed of 9.7 wt% methyl iodide, 11.9 wt% acetic acid, 4.8 wt% water, 59.0% methanol and 14.5% methyl acetate which is in line with patents (Ditzel et al., 1997) (Torrence et al., 2013). The reactor is modelled as a RStoic reactor with a temperature of 200 °C and a pressure of 35 bar. After the reactor the mixture is split in a gas-liquid splitter. Gaseous compounds undergo condensation at 5°C in HX1. In a subsequent flash the liquid stream is recycled to the reactor and the gaseous phase is sent to incineration. The valve reduces the pressure of the reaction mixture to 1 bar.
In heat exchanger HX2 the product stream is vaporized and fed to distillation column C1. The side draw is further sent to column C2 for water removal. The vapor head stream of column C1 is sent to the absorber C3 to recover most of the light components like methyl iodide. The gas stream is scrubbed with methanol. The flow rate of methanol is adjusted so that the concentration of methyl iodide in the gaseous exit stream of the absorber is below 50 ppm. Another condensation at 5 °C and liquid gas separation FLASH3 is necessary to recover valuable compounds like methayl iodide and methanol after the absorber C3. The bottom stream of column C1 contains the catalyst, water and acetic acid and is recycled back together with the other liquid streams to the reactor. In column C2 light components and water are removed to yield an acetic acid stream with 97 wt% purity. The recycle stream is mixed with fresh methanol, pumped to 25 bar and preheated.
Acetic Acid Hydrogenation to Ethanol
Compared to methanol and acetic acid synthesis, the further hydrogenation of acetic acid to ethanol is of lower technological readiness (TRL 5). Direct hydrogenation of acetic acid to ethanol (Eq. 11) can be performed using transition metal catalysts, most importantly noble metals including Ru, Rh and Pt, via both-two or three-phase reactions (Olcay et al., 2010; Olcay et al., 2014).
In the present case, data from Rakshit et al. (2020) is employed to suggest a process based on gas-phase hydrogenation of anhydrous acetic acid to ethanol on a bimetallic Pt-Sn catalyst. Studying this reaction in the temperature and pressure ranges of 240–280°C and 10–35 bar, respectively, and at hydrogen to acetic acid feed ratios (H2:Ac) of 4–20, they found the optimal conditions at 270°C, 20 bar and H2:Ac = 10. Under these conditions, the ethanol selectivity was 95% at 83% acetic acid conversion. The reaction was kinetics-controlled as the equilibrium conversion approached 100% under the studied reaction conditions. The main by-product was identified as ethyl acetate, formed via esterification of ethanol with acetic acid (Eq. (12)).
Adapting the findings of Rakshit et al. (2020), the acetic acid hydrogenation reactor was modelled as a stoichiometric reactor operated isothermally at 240 °C and 30 bar, with the conversion of the main reaction (Eq. 11) set to 75% as a conservative estimate. These conditions were selected to maximize the ethanol selectivity. For simplification, the formation of ethyl acetate as a by-product was neglected. This assumption is supported by the relatively low conversion level, as Rakshit et al. (2020) showed that the degree of esterification, as a consecutive reaction to the main reaction, can be reduced at lower conversion levels.
The flowsheet of the modelled process is presented in Figure 5. The reactor section was modelled using the Soave-Redlich-Kwong equation of state, and the separation section uses the NRTL activity coefficient model. Acetic acid (97 w-%) from the Cativa process is pumped to the reaction pressure of 30 bar, while hydrogen is supplied at 30 bar from water electrolysis. The fresh acid and hydrogen streams are mixed with the gas and liquid recycles, and the feed mixture is heated to the reaction temperature of 240 °C. The makeup hydrogen rate is adjusted to set the H2:Ac ratio to 5, which equals the minimum suggested by Rakshit et al. (2020).
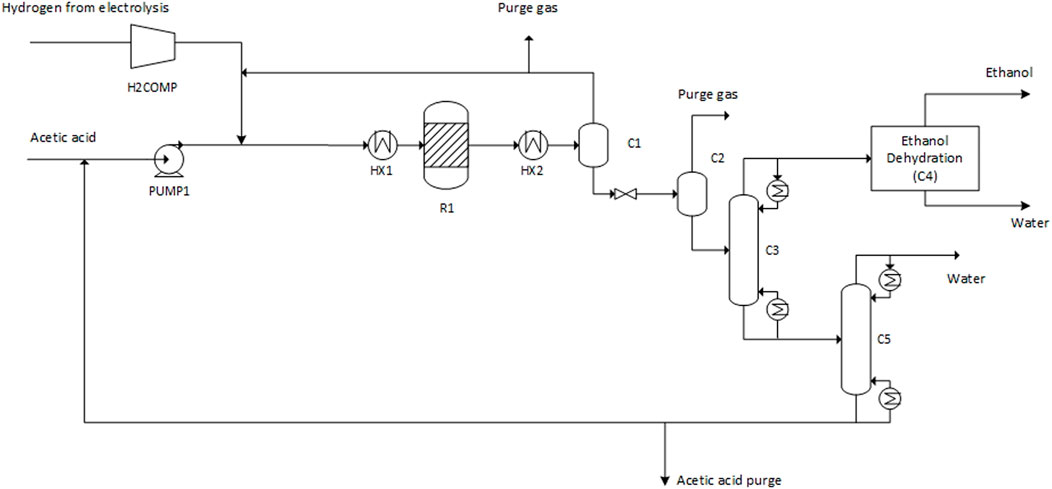
FIGURE 5. Flowsheet of the acetic acid hydrogenation to ethanol process.
Following the reactor, acetic acid, ethanol and water are condensed at 50 C and separated in a gas-liquid separator. Separated unreacted hydrogen is recycled to the reactor following a 1% purge. After expansion to 1 bar, residual gases are purged from a second gas-liquid separator. The azeotropic ethanol-water mixture (∼94 w-% ethanol) is distilled in the C1 column, with the bottom product consisting of 51 w-% acetic acid with water. The bottom mixture is separated in the C2 column, with water removed as distillate, and acetic acid as bottom product which is recycled following a 1% purge.
Separation of the azeotropic ethanol-water mixture is not modelled in detail in this work. Options for this separation include azeotropic or extractive distillation (e.g.using pentane, cyclohexane or propylene glycol), pressure-swing adsorption, or membrane separation. For example, the corresponding energy consumption has been estimated at 10 MJ/kg of ethanol for azeotropic distillation using pentane as entrainer, or 5 MJ/kg for membrane pervaporation (Kumar et al., 2010). To estimate the energy consumption for the present process, the low value in this range, 5.0 MJ/kg, is used. In the present model, the ethanol-water separation is incorporated by setting components splits to the product streams.
Results
Key Performance of the Process Concepts
Table 3 summarizes the key performance indicators. The biomass gasification and electrolysis, which accounts for the majority of the electrical power requirement, are both at reasonable scale for a future decentralized production facility. The biomass feed composition and flow rate is identical in all cases. In case C, the output of ethanol is maximized by adding additional CO2 to methanol synthesis. However, the increased requirement of hydrogen in methanol synthesis and acetic acid hydrogenation leads to a higher electrical input to electrolysis.
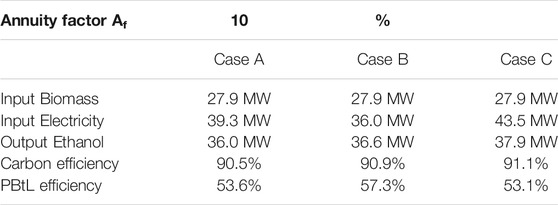
TABLE 3. Key performance indicators of the process in cases A–C.
Compared to case A, the electrical power in case B is substantially reduced due to more efficient conversion of the syngas to carbon monoxide in the electrically heated reformer. The split fraction of the syngas directed to methanol synthesis prior to membrane separation is higher, and the composition of that stream is very rich in carbon monoxide, leading to a lower hydrogen consumption in the methanol process. A lower hydrogen consumption can be explained by the stoichiometry of the conversion of CO2 and CO to methanol, the molar ratio of carbon to hydrogen for methanol synthesis equal to 3:1 and 2:1, respectively. Therefore, in case B less hydrogen is required. The more efficient conversion of carbon monoxide to methanol in the reactor leads to a lower purge stream from the recycled unreacted gas which results in a slightly higher CE in comparison to case A.
The CE is above 90% for all investigated cases. The highest CE is found for case C, at 91.1%. Major losses in the process chain are purge streams, unconverted carbon in gasification and undesired side products including char and ash. Nevertheless, the losses are very small throughout all process steps. The high CE represents efficient utilization of carbon contained in the biomass feed. The CE in case C, calculated in terms of the biomass input, is increased by the additional CO2 input to methanol synthesis, resulting in increased formation of methanol, acetic acid, and finally ethanol.
The highest PBtL efficiency was reached in case B. The efficiency in case C and A is lower than in case B since more hydrogen is required in methanol synthesis. Compared to case B, more CO2-rich synthesis gas is input to methanol synthesis in the other cases, leading to higher hydrogen requirement following the methanol synthesis stoichiometry.
Mass Balance
The calculated mass balances are summarized in Table 4. All flows are scaled to a product output of 1 t ethanol. It can be seen that the upstream mass flows to the Cativa process differ substantially, while the mass flows after the Cativa process are similar since the technologies and settings of the models used are equal for all three cases.
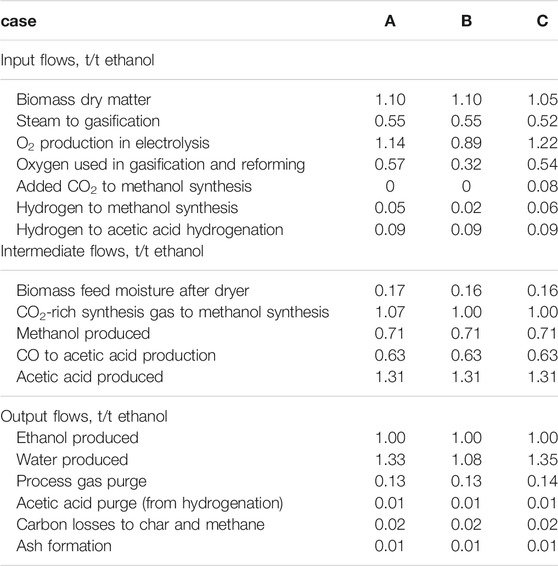
TABLE 4. Mass balance of case A–C (t per t of ethanol produced).
It can be observed that for t of ethanol 1.1–1.05 t dry biomass is required, which equals 1,350–1,410 L of ethanol produced per t of biomass. This is considerably higher than typical yields (200–300 L per dry t of biomass) in forest biomass based bioethanol production (Frankó et al., 2016).
In all cases, there is enough oxygen produced in electrolysis for the operation of the gasification process. Excess oxygen can be sold. The oxygen surplus is 0.58 t per t ethanol in case A and B and 0.68 t per t of ethanol for case C. Case C has the lowest biomass input of all three cases. However, to compensate for the lack of carbon in case C, additional carbon dioxide is fed to methanol synthesis. An obvious trait of case B is the lower hydrogen consumption in methanol synthesis. This is due to the fact that in electrical reforming no combustion reaction takes place, resulting in higher yields of hydrogen and carbon monoxide. This results also in a lower water production as side product compared to Cases A and C.
Energy Balance
The Sankey diagrams presented in Figure 6 illustrate the energy content of feedstock, product and intermediate streams for each case. In the diagrams, electricity for electrolysis is included but electrical energy required for pumping or compression are neglected. Heat used in the different process steps is balanced and only one input or output heat stream is shown. In the diagram also the losses i.e. conversion of the chemical energy content of the streams into heat can be seen in each process step and it can be noted that the losses in the last step acetic acid hydrogenation appear to be small compared to the previous steps. More detailed results related to the heat balance and power consumption can be found in the Supplementary Material. A simplified analysis shows that enough heat can be recovered to make the process self-sufficient in heat. It can be observed that there is considerable amount of high temperature heat available (Supplementary Table S19 in the Supplementary Material). This heat could be used for production of high-pressure steam for power generation, for instance. Such integration of the process to a power plant could increase the overall efficiency but was not considered here.
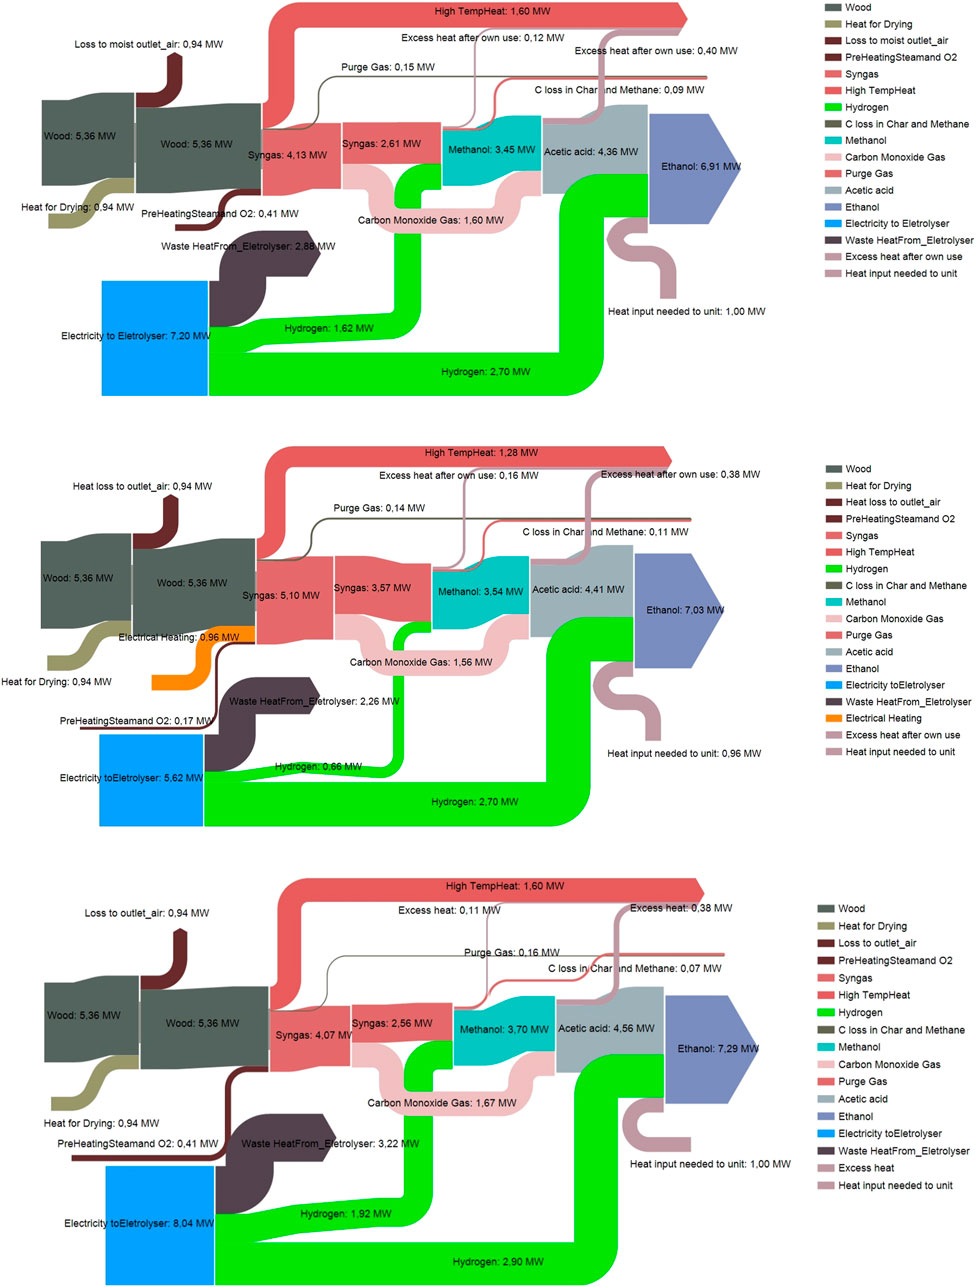
FIGURE 6. Sankey diagram illustrating energy flows and losses for case A-C.
Economics
Based on the economic evaluation of the plant, the resulting levelized cost of ethanol is depicted in Figure 7. The exact values corresponding to the figure can be found in the Supplementary Material. The production cost for the cases ranges from 85.8 €/MWh for case A 6x to 141.9 €/MWh for case A 1st. These values correspond to 0.51 €/l and 0.86 €/l, respectively. Case B shows the lowest levelized cost of the cases A–C, while the highest levelized cost is found for case C. In all scenarios, electricity consumption has the highest impact on the levelized cost. The fixed capital investment has been estimated to be approximately 78 M€ for case A. It should be noted that the capital cost estimate is only intended as order-of-magnitude estimate with ± 50% accuracy.
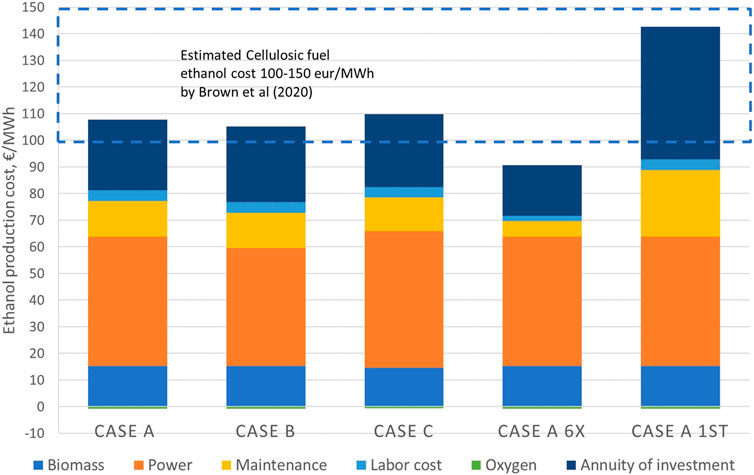
FIGURE 7. Levelized cost of ethanol for the cases A, B and C, and additional cases A 6x (6-fold production capacity of case A) and case A first (cost estimate corresponding to first-of-kind plant.).
The sensitivity analysis in Figure 8 shows the effect of key parameters on the ethanol production cost. The analysis is only shown for case A but similar results are found for Cases B and C. The electricity price shows the highest influence on the ethanol cost. With a 30% increase in electricity price, the ethanol cost is increased by 14% to 122 €/MWh. Compared to the electricity cost, the impact of investment cost and biomass cost less significant. For instance, increase of 30% in the investment cost results in a 7% increase in the ethanol price. The effect of oxygen sales price is negligible.
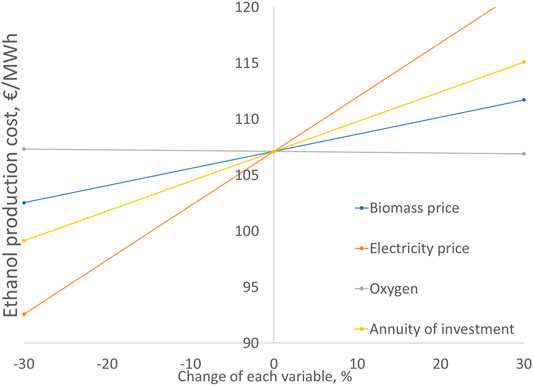
FIGURE 8. Ethanol cost sensitivity analysis for case A. Base ethanol cost 107 €/MWh. Base parameter values: Cbiom = 20 €/MWh, Celec = 45 €/MWh, Cox = 50 €/t, annuity of investment 7.7 M€/a (fixed capital investment 78 M€).
CO2 Balance
The calculated emissions for ethanol are based on the CO2 emissions from electricity and biomass supply, and a credit for added CO2. The results are presented in Table 5. Obviously, the emission factor of the utilized electricity has a major impact on the CO2 emissions as it can be seen in the difference between the results for the German and Finnish electricity mix. Case A reaches the lowest emissions for the Finnish grid mix. For the German grid mix, case B reaches the lowest CO2 emissions.
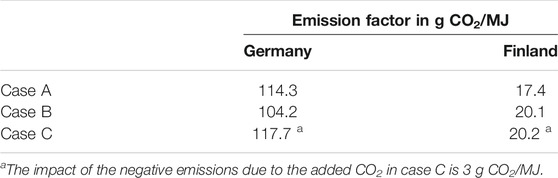
TABLE 5. Calculated emission factors for produced ethanol.
For gasoline, the emission factor is 69.3 g CO2/MJ (IPCC, 2006). The utilization of the German grid mix would lead to considerably higher greenhouse gas emissions compared to gasoline. However, with the Finnish electricity mix, a reduction of up to 75% in greenhouse gas emissions in comparison to fossil gasoline is reached in case A. In case C, the reduction is slightly less, at 70%.
The marginal emission factor for electricity is calculated as the maximum emission factor for electricity to stay below a certain emission factor for the ethanol. For the CO2 emissions to be equal to fossil gasoline, marginal emission factors of 230, 252, and 217 g CO2/kWh for the Cases A–C are calculated, respectively. In order to reach a 70% reduction in the emission factor of ethanol compared to fossil gasoline, the marginal electricity emission factors for Cases A–C are 68, 74 and 64 g CO2/kWh.
Discussion
Variable Geographic Operation of Subprocesses
In this paper we presented a process for the production of ethanol based on successive subprocesses located at the same site. The concept offers the possibility to separate the production processes at two sites. For instance, the biomass gasification, methanol production and acetic acid synthesis can be located at one site. A requirement for this site is good availability of biomass. As synthesis gas with a 1:1 ratio of H2/CO is needed for methanol and subsequent acetic acid production, a high carbon efficiency for the conversion to acetic acid can be achieved with low additional hydrogen input. For successive hydrogenation, acetic acid would be transported to another facility with good availability of renewable electricity for electrolysis. Because acetic acid hydrogenation only involves low loss losses of chemical energy as seen in Figure 6 the ‘hydrogen to fuel’ and ‘power to fuel’ efficiency would be high for acetic acid hydrogenation using water electrolysis into ethanol. Furthermore storage of acetic acid as intermediate product would enable flexible production of ethanol when and where cheap, renewable power would be available.
In addition, acetic acid for hydrogenation to ethanol could be retrieved from different sources including biotechnological processes. Another option would be the use of acetic acid- or methanol-containing evaporator condensates from chemical Kraft pulp mills as co-feedstock, as described by Driessen et al. (2000). It should be noted that carrying out hydrogenation at separate location would affect heat availability within the overall process as calculated in this paper, and external heat would be needed to satisfy the heat demands of ethanol separation and purification.
Comparison With Other Production Routes for Renewable Fuels
The results of this study are compared with literature data on other processes for the production of ethanol (Table 6) (Comparison With Other Production Routes for Renewable Fuels), and with other processes for the production of fuels based on biomass gasification and hydrogen from water electrolysis (Comparison With Other PBtL Routes).
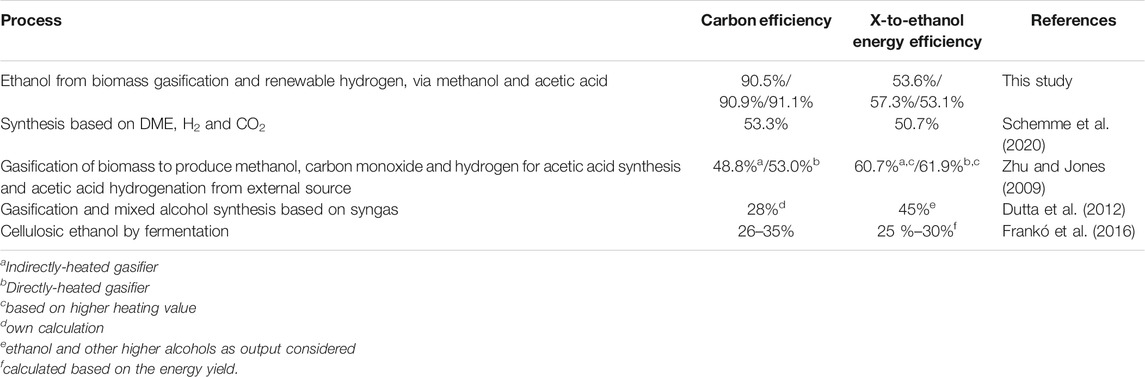
TABLE 6. Comparison with alternative ethanol production routes.
Comparison With Other Production Routes for Renewable Fuels
In Table 6, the results are compared with alternative ethanol production routes. The comparison includes two processes based on gasification, one process based on fermentation and one process based on chemical conversion of dimethyl ether (DME). The CE of every alternative process is far below the CE of the process configuration presented here. The lowest CE of 26% is reported for fermentation of cellulosic biomass. However, as described in the introduction section by-products for example upgraded biogas (biomethane) production can increase the transportation fuel yield significantly. Higher efficiencies into liquid fuel were reported for the hydrogen- and CO2 based process presented by Schemme et al. (2020). The CE of the process presented here is above 90%, representing tremendous improvement compared to the referenced ethanol production processes.
Frankó et al. (2016) present a fermentation process based on forest biomass feedstock such as sawdust and shaving, fuel logs, or early thinnings, with an energy yield of 25–30%. The relatively low efficiency including only the energy yield of the ethanol product is explained by the significant recovery of biomass energy content in by-products such as biogas and pellets. The energy yield of mixed alcohol synthesis, as reported by Dutta et al. (2012) is also relatively low. Compared to these routes, higher energy efficiencies can be reached by the gasification-based process as presented by Zhu and Jones (2009). In line with the high CE, the energy yield of the present process is also high compared to the referenced processes.
Brown et al. (2020) estimate the production cost of cellulosic ethanol in a range from 103 to 158 €/MWh. For ethanol from lignocellulosic biomass, the production cost ranges from 85 to 158 €/MWh. Future prices are optimistically estimated to be as low as 71 €/MWh. Compared to the production costs reported there, the process concepts presented in this study appears very competitive. The worst case calculated here is case A based on the first plant cost, with a production cost of 141.9 €/MWh. That cost would still be in the range of costs for ethanol produced from cellulosic or lignocellulosic biomass. The cost of conventional first-generation ethanol, for US-based production that is strongly linked to corn prices, has varied approximately between 45 €/MWh and 60 €/MWh in recent years (Iowa State University, 2019).
Comparison With Other PBtL Routes
Table 7 gives an overview of studies investigating the production of fuels based on combined biomass and electricity feedstock. All studies are based on the gasification of biomass. Most often, the syngas is converted via FT synthesis. One study considers the production of methane and gasoline via methanol. Because of varying assumptions and boundaries, a direct comparison between these studies is difficult. Nevertheless, some general conclusions can be drawn.
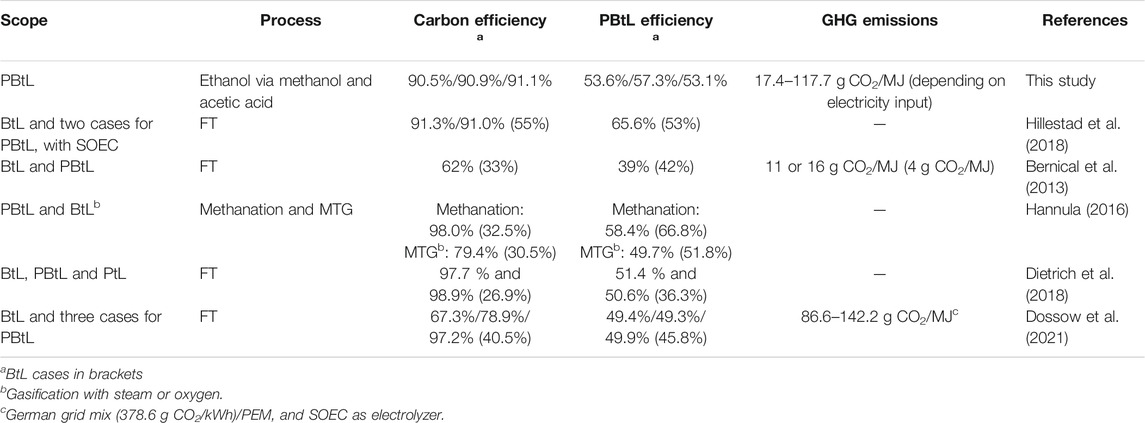
TABLE 7. Reference studies of combined biomass/power to fuel processes.
First of all, the CE of the BtL process can be tremendously increased by the addition of supplemental hydrogen from electrolysis, following the PBtL scheme. In some studies, the amount of hydrogen added to the process has been varied, and higher hydrogen addition has been found to lead to a higher CE with hydrogenation of CO2 instead of removal from the process. Consistent results are found here, as the CE of all three cases presented, at above 90%, indicate efficient utilization of biogenic carbon. The losses due to side products and purge streams are very low. Compared to referenced PBtL routes, the CE is in the range of FT processes with maximum hydrogen input. FT processes with below maximum hydrogen input have remarkably lower carbon efficiencies. The methanol-to-gasoline (MTG) process based on oxygen gasification studied by Hannula (2016) only reaches a CE of 79.4%.
The process efficiencies calculated in this paper range from 53.6 to 57.3%. In reference studies, the highest PBtL efficiency of 65.6% was reported by Hillestad et al. (2018) but at assumed electrolysis efficiency of 100%, compared to 60% in the present study. Compared to the present study, the higher overall efficiency of the referenced process is explained by the higher electrolyzer efficiency.
However, the economics of BtL process configurations have been found more viable compared to PBtL concepts under present conditions. In direct comparisons between BtL and PBtL, Bernical et al. (2013), Hannula (2016) and Dietrich et al. (2018) report higher fuel cost for the PBtL process. However, fuel cost from a PBtL process was found lower compared to a PtL process without biomass input (Dietrich et al., 2018). Thus, it appears likely that the relative competitiveness between BtL, PBtL and PtL schemes is largely driven by the difference in feedstock costs, i.e., the cost of biomass and renewable electricity. At present, the lower cost of biomass seems to overweigh the efficiency and yield benefits provided by electricity-powered hydrogen supplementation. In addition to renewable electricity cost, the competitiveness of PBtL is also affected by electrolysis costs. With continuing decreases in both (IRENA, 2020), the economic feasibility of PBtL processes is expected to improve.
Dossow et al. (2021) calculated CO2 emissions for using the German electricity mix. The values are in the same range than the values we reported in this paper for German grid mix.
Outlook
The proposed production route has already a very high carbon efficiency. General improvements in the established synthesis steps considered within the overall process cannot be expected, with the exception of acetic acid hydrogenation. This subprocess has a relatively low maturity level compared to the other process sections. Due to the resulting limited data availability, only a simplified and non-optimized process model was developed for the acetic acid hydrogenation step in the present study. More detailed process modelling and optimization could further improve the results in terms of energy efficiency and costs; on the other hand, these improvements could be offset by more detailed consideration of side reactions and other process details.
Additionally, efficiency gains can be expected for the production of hydrogen from water electrolysis. The efficiency of alkaline and proton exchange membrane electrolyzers is expected to increase in the future (IRENA, 2020). Another upcoming technology in the field is solid oxide electrolysis (SOEC) that operates at higher temperatures (700–900 °C). The gasification and reforming process can provide the required high temperature heat by-product. SOEC has a high efficiency for hydrogen production. The stack efficiency, not including auxiliary electrolyze components, can reach 100% which is significantly higher than 63–71% efficiency in alkaline electrolysis (Buttler and Spliethoff, 2018). However, the downside of SOEC is currently the low maturity, high investment costs (>2000 €/kW), and problems related to stack degradation (Buttler and Spliethoff, 2018), which cause a barrier for utilization of the technology in large-scale operation.
SOEC electrolyzer was employed in the PBtL study by Hillestad et al. (2018) (Table 7). The overall energy efficiency of the FT process presented there is significantly higher than in comparable studies. Koponen and Hannula (2017) also showed that the CO2 balance can be improved at higher electrolyzer efficiency. In general, they showed that the combination of biomass and electricity as feedstock is superior in terms of CO2 emissions compared to comparable processes only based on electricity. The lower CO2 emissions of the PBtL path compared to the PtL path were also confirmed by Dossow et al. (2021).
Overall it can be concluded that second generation bioethanol produced by fermentation or via gasification from lignocellulosic raw material which is available in bigger quantities than first generation starch based materials, generally produce fuel with lower carbon footprint but has higher production cost than first generation fuels such as ethanol. The PBtL process in this study can increase biofuel yield per ton of dry biomass even five-fold compared to second generation ethanol production by fermentation. Furthermore the production cost is similar, when electricity with a reasonable price is available. In the future society with limited amount of lignocellulosic biomass, but increasing amount of renewable electricity available PBtl process can help to overcome the raw material limitations of lignocellulosic biomass based fuel production. It can also produce fuel with a low carbon footprint when low carbon footprint power is available. The PBtL production process studied here require more process step compared to for example biomethanol production however it can produce acetic acid as intermediate product with a high carbon efficiency from biomass. Acetic acid can subsequently be converted with a high efficiency at different location and/or different time into ethanol using for example hydrogen derived from wind or solar power, which help balancing the production and consumption of renewable power. Additionally, if all the carbon is originated from biomass no CO2 capture process is needed. A benefit in this process the synenergy between oxygen gasification and electrolysis, because all the needed oxygen for gasification and reforming can be produced as by-product in the electrolysis.
The overall economics of PBtL, and the optimum degree of hydrogen supplementation, are largely dependent on the cost of electricity. The emissions profile of such processes would be the most favorable when powered by renewable electricity only. However, full or partial operation based on non-variable electricity sources (e.g., grid) can reduce the present-day costs and relax the requirements on system flexibility that might be incurred on renewable-only based PBtL processes.
The calculation of the marginal emission factor shows which emission factor for electricity is required to reach a given emission reduction. The marginal emission factor can be compared to the emission factor for a particular electricity source and location to identify favorable implementation options. The electricity supply in many countries is already based on low greenhouse gas emission technologies and further reductions in specific emissions are expected, increasing the applicable locations for the presented process concept. Already nowadays, the emission factor of electricity in many countries [for example Sweden with 9 g CO2/kWh and France with 51 g CO2/kWh for the years 2020 (European Environmental Agency, 2021)] is below the marginal emission factor calculated here.
Conclusion
The paper presented a production process forethanol based on biomass gasification and hydrogen from electricity. Three cases were investigated. Most technologies used in the process concept can be considered mature technologies. Besides mass and energy balance we performed an economic evaluation and CO2 balance calculation. The main findings are:
− The production route has a very high selectivity towards ethanol. Since by-product formation is low and material purges are small, the carbon efficiency of all cases is above 90%. The carbon efficiency is competitive with other hydrogen assisted processes based on biomass, such as FT synthesis.
− Case B with electrically heated reformer shows the highest PBtL efficiency since the conversion of biomass input to carbon monoxide is the most efficient. As a result, the hydrogen demand is lower, reducing the power required for electrolysis by 8% compared to case A. Electrolysis is an inefficient conversion step with a significant influence on the energy efficiency of the overall system. In general, the energy efficiency of all cases is comparable to other biomass and hydrogen-based production routes. Electrical reforming is an important technology for higher efficiency syngas conversion. Therefore, this technology should be investigated further.
− Case A and C use more proven technology for reforming of tars and methane and case B would need more verification that the tar content in the produced synthesis gas would be low enough for further synthesis.
− Case B can produce maximum yield of ethanol with the illustrated concept, without additional CO2 addition and needing less input of hydrogen from electrolysis, On the opposite in case C somewhat more ethanol can be produced but additional CO2 input and more hydrogen from electrolysis are needed.
− The calculated product price of ethanol was evaluated to range from 90 to 109 €/MWh or 0.53–0.67 eur/L. Due to the electricity demand of the electrolyzer, electricity accounts for roughly 42.3%–47% of the production cost. Added revenues from sales of excess oxygen are negligible. The second largest fraction of the production cost is the annuity of investment. The production cost for a first-of-its-kind plant is expected to be higher, and was calculated at 143 €/MWh or 0.86 €/L. It can be concluded that: the production cost is on competitive level compared to lignocellulosic fuels however the cost is sensitive toward the price of electricity
− Economies of scale were investigated by evaluating the economics for a case A configuration plant with a 6-fold production capacity. As a result, the production cost was reduced by 20% to 90 €/MWh or 0.55 €/L. This is even below the typical cost range of cellulosic ethanol production according to Brown (2015) (100-150 €/MWh)
− The process concept offers the possibility to split the production process in two separate plants at two different locations. The first plant produces the acetic acid at a location of high biomass availability. At the other location, the hydrogenation is performed at a site with high availability of electricity, and/or demand for fuel.
− An assessment of CO2 emissions for ethanol showed that with the Finnish grid mix, the emission factor can be tremendously decreased compared to fossil gasoline. Using the grid mix also offers the option to have high full load hours for the electrolysis which improves the economics of the process. With high emission grid mix for example German grid mix currently the process cannot produce lower fuel with lower emissions compared to fossil gasoline. In such case grid mix has to become greener in order to effectively avoid emissions or alternative only green electricity from wind or solar power could be used.
− Competitiveness of the process based on renewable electricity only, representing the most favorable option in terms of the emission factor, is expected to improve with decreases in generation costs. However, such operation may increase the flexibility demands for the overall system.
Data Availability Statement
The original contributions presented in the study are included in the article/Supplementary Material, further inquiries can be directed to the corresponding author.
Author Contributions
KM, HN and DK performed the process modelling in Aspen Plus, wrote the manuscript, developed the methodology, calculated and organized the presented data, and revised the manuscript. AL and TK revised the manuscript and supervised the work. MG supervised the work.
Conflict of Interest
The authors declare that the research was conducted in the absence of any commercial or financial relationships that could be construed as a potential conflict of interest.
Publisher’s Note
All claims expressed in this article are solely those of the authors and do not necessarily represent those of their affiliated organizations, or those of the publisher, the editors and the reviewers. Any product that may be evaluated in this article, or claim that may be made by its manufacturer, is not guaranteed or endorsed by the publisher.
Supplementary Material
The Supplementary Material for this article can be found online at: https://www.frontiersin.org/articles/10.3389/fenrg.2022.796104/full#supplementary-material
Abbreviations
BtL, Biomass-to-Liquid; CE, Carbon efficiency; DME, Dimethyl ether; FCI, Fixed capital investment; FT, Fischer-Tropsch; NRTL, Non-random two-liquid; MTG, Methanol-to-gasoline; PBtL, Power/Biomass-to-Liquid; PEM, Polymer electrolyte membrane; PtL, Power-to-Liquid; SOEC, Solid oxide electrolyzer cell; TRL, Technology Readiness Level.
References
Barta, Z., Reczey, K., and Zacchi, G. (2010). Techno-Economic Evaluation of Stillage Treatment with Anaerobic Digestion in a Softwood-To-Ethanol Process. Biotechnol. Biofuels 3, 21. Available at: http://www.biotechnologyforbiofuels.com/content/3/1/21 (Accessed December 27, 2021). doi:10.1186/1754-6834-3-21
Bernical, Q., Joulia, X., Noirot-Le Borgne, I., Floquet, P., Baurens, P., and Boissonnet, G. (2013). Sustainability Assessment of an Integrated High Temperature Steam Electrolysis-Enhanced Biomass to Liquid Fuel Process. Ind. Eng. Chem. Res. 52, 7189–7195. doi:10.1021/ie302490y
Brown, A., Waldheim, L., Landälv, I., Saddler, J., Ebadian, M., McMillan, J. D., et al. (2020). Advanced Biofuels – Potential for Cost Reduction. Available at: https://www.ieabioenergy.com/wp-content/uploads/2020/02/T41_CostReductionBiofuels-11_02_19-final.pdf (Accessed October 13, 2021).
Brown, T. R. (2015). A Techno-Economic Review of Thermochemical Cellulosic Biofuel Pathways. Bioresour. Technol. 178, 166–176. doi:10.1016/j.biortech.2014.09.053
Buttler, A., and Spliethoff, H. (2018). Current Status of Water Electrolysis for Energy Storage, Grid Balancing and Sector Coupling via Power-To-Gas and Power-To-Liquids: A Review. Renew. Sustain. Energ. Rev. 82, 2440–2454. doi:10.1016/j.rser.2017.09.003
Dietrich, R.-U., Albrecht, F. G., Maier, S., König, D. H., Estelmann, S., Adelung, S., et al. (2018). Cost Calculations for Three Different Approaches of Biofuel Production Using Biomass, Electricity and CO2. Biomass and Bioenergy 111, 165–173. doi:10.1016/j.biombioe.2017.07.006
Ditzel, E. J., Sunley, J. G., and Watt, R. J. (1997). Iridium-Catalyzed Carbonylation Process for the Production of Acetic Acid. US 5,877,348.
Driessen, W., Tielbaard, M., Habets, L., and Yspeert, P. (2000). “Anaerobic Treatment of Evapor Condensates from the Chemical Pulp Industry,” in Proceedings of the VI.
Dossow, M., Dieterich, V., Hanel, A., Spliethoff, H., and Fendt, S. (2021). Improving Carbon Efficiency for an Advanced Biomass-To-Liquid Process Using Hydrogen and Oxygen from Electrolysis. Renew. Sustain. Energ. Rev. 152, 111670. doi:10.1016/j.rser.2021.111670
Dutta, A., Talmadge, M., Hensley, J., Worley, M., Dudgeon, D., Barton, D., et al. (2012). Techno-Economics for Conversion of Lignocellulosic Biomass to Ethanol by Indirect Gasification and Mixed Alcohol Synthesis. Environ. Prog. Sustain. Energ. 31, 182–190. doi:10.1002/ep.10625
Eggeman, T., and O'Neill, B. (2016). High‐Yield Hybrid Cellulosic Ethanol Process Using High‐Impact Feedstock. Available at: https://www.osti.gov/servlets/purl/1296859/(Accessed October 13, 2021).
Enerkem (2020). CAD$875 Million Biofuel Plant in Varennes, Québec Enerkem Proposed Partnership with Shell, Suncor and Proman with the Leadership of the Québec Government and Support from the Canadian Government. Available at: https://enerkem.com/news-release/cad875-million-biofuel-plant-in-varennes/(Accessed October 13, 2021).
European Environmental Agency (2021). Greenhouse Gas Emission Intensity of Electricity Generation in Europe. Available at: https://www.eea.europa.eu/ims/greenhouse-gas-emission-intensity-of-1 (Accessed December 16, 2021).
Fingrid Oyj (2021). Real-Time CO2 Emissions Estimate. Available at: https://www.fingrid.fi/en/electricity-market/electricity-market-information/real-time-co2-emissions-estimate/(Accessed October 13, 2021).
Frankó, B., Galbe, M., and Wallberg, O. (2016). Bioethanol Production from Forestry Residues: A Comparative Techno-Economic Analysis. Appl. Energ. 184, 727–736. doi:10.1016/j.apenergy.2016.11.011
Frilund, C., Kurkela, E., and Hiltunen, I. (2021). Development of a Simplified Gas Ultracleaning Process: Experiments in Biomass Residue-Based Fixed-Bed Gasification Syngas. Biomass Conv. Bioref. doi:10.1007/s13399-021-01680-x
Hannula, I. (2015). Co-production of Synthetic Fuels and District Heat from Biomass Residues, Carbon Dioxide and Electricity: Performance and Cost Analysis. Biomass and Bioenergy 74, 26–46. doi:10.1016/j.biombioe.2015.01.006
Hannula, I. (2016). Hydrogen Enhancement Potential of Synthetic Biofuels Manufacture in the European Context: A Techno-Economic Assessment. Energy 104, 199–212. doi:10.1016/j.energy.2016.03.119
Hannula, I., and Kurkela, E. (2013). Liquid Transportation Fuels via Large-Scale Fluidised-Bed Gasification of Lignocellulosic Biomass. Espoo: VTT.
Hillestad, M., Ostadi, M., Alamo Serrano, G. d., Rytter, E., Austbø, B., Pharoah, J. G., et al. (2018). Improving Carbon Efficiency and Profitability of the Biomass to Liquid Process with Hydrogen from Renewable Power. Fuel 234, 1431–1451. doi:10.1016/j.fuel.2018.08.004
Hortsch, R., and Corvo, P. (2020). The Biorefinery Concept: Producing Cellulosic Ethanol from Agricultural Residues. Chem. Ingenieur Technik 92, 1803–1809. doi:10.1002/cite.202000203
Iliev, S. (2018). “A Comparison of Ethanol, Methanol and Butanol Blending with Gasoline and Relationship with Engine Performances and Emissions,” in Proceedings of the 29th DAAAM International Symposium. Editor B. Katalinic (Vienna, Austria: Published by DAAAM International), 0505–0514. 978-3-902734- 20-4. ISSN 1726-9679. doi:10.2507/29th.daaam.proceedings.073
Iowa State University (2019). Historical Ethanol Operating Margins. Available at: https://www.card.iastate.edu/research/biorenewables/tools/hist_eth_gm.aspx (Accessed October 15, 2021).
IPCC (2006). 2006 IPCC Guidelines for National Greenhouse Gas Inventories. Available at: https://www.ipcc-nggip.iges.or.jp/public/2006gl/(Accessed October 08, 2021).
IPCC (2021). Climate Change 2021: The Physical Science Basis. Available at: https://www.ipcc.ch/report/ar6/wg1/downloads/report/IPCC_AR6_WGI_Full_Report.pdf (Accessed October 08, 2021).
Irena and methanol institute (2021). Innovation Outlook: Renewable Methanol. Available at: https://www.irena.org/-/media/Files/IRENA/Agency/Publication/2021/Jan/IRENA_Innovation_Renewable_Methanol_2021.pdf (Accessed October 14, 2021).
IRENA (2020). Green Hydrogen Cost Reduction: Scaling up Electrolysers to Meet the 1.5⁰C Climate Goal. Available at: https://www.irena.org/-/media/Files/IRENA/Agency/Publication/2020/Dec/IRENA_Green_hydrogen_cost_2020.pdf (Accessed October 15, 2021).
Isaacs, S. A., Staples, M. D., Allroggen, F., Mallapragada, D. S., Falter, C. P., and Barrett, S. R. H. (2021). Environmental and Economic Performance of Hybrid Power-To-Liquid and Biomass-To-Liquid Fuel Production in the United States. Environ. Sci. Technol. 55, 8247–8257. doi:10.1021/acs.est.0c07674
Jäppinen, E., Korpinen, O.-J., Laitila, J., and Ranta, T. (2014). Greenhouse Gas Emissions of forest Bioenergy Supply and Utilization in Finland. Renew. Sustain. Energ. Rev. 29, 369–382. doi:10.1016/j.rser.2013.08.101
Jones, J. H. (2000). The Cativa'"' Process for the Manufacture Plant of Acetic Acid. Platinum Metal Rev. 44, 94–105.
Kalck, P., Le Berre, C., and Serp, P. (2020). Recent Advances in the Methanol Carbonylation Reaction into Acetic Acid. Coord. Chem. Rev. 402, 213078. doi:10.1016/j.ccr.2019.213078
Köpke, M., Mihalcea, C., Bromley, J. C., and Simpson, S. D. (2011). Fermentative Production of Ethanol from Carbon Monoxide. Curr. Opin. Biotechnol. 22, 320–325. doi:10.1016/j.copbio.2011.01.005
Koponen, K., and Hannula, I. (2017). GHG Emission Balances and Prospects of Hydrogen Enhanced Synthetic Biofuels from Solid Biomass in the European Context. Appl. Energ. 200, 106–118. doi:10.1016/j.apenergy.2017.05.014
Kumar, S., Singh, N., and Prasad, R. (2010). Anhydrous Ethanol: A Renewable Source of Energy. Renew. Sustain. Energ. Rev. 14, 1830–1844. doi:10.1016/j.rser.2010.03.015
Kurkela, E., Kurkela, M., and Hiltunen, I. (2016). Steam–oxygen Gasification of forest Residues and Bark Followed by Hot Gas Filtration and Catalytic Reforming of Tars: Results of an Extended Time Test. Fuel Process. Technol. 141, 148–158. doi:10.1016/j.fuproc.2015.06.005
Le Berre, C., Serp, P., Kalck, P., and Torrence, G. P. (2010). “Acetic Acid,” in Ullmann's Encyclopedia of Industrial Chemistry (Weinheim: Wiley online library: Wiley-VCH), 1–34.
Mignard, D., and Pritchard, C. (2008). On the Use of Electrolytic Hydrogen from Variable Renewable Energies for the Enhanced Conversion of Biomass to Fuels. Chem. Eng. Res. Des. 86, 473–487. doi:10.1016/j.cherd.2007.12.008
Neot Group (2021). Available at: https://www.neot.fi/en/products/ethanol-diesel-ed95/(accessed 12 27, 2021).
Olcay, H., Xu, L., Xu, Y., and Huber, G. W. (2010). Aqueous-Phase Hydrogenation of Acetic Acid over Transition Metal Catalysts. ChemCatChem 2, 1420–1424. doi:10.1002/cctc.201000134
Olcay, H., Xu, Y., and Huber, G. W. (2014). Effects of Hydrogen and Water on the Activity and Selectivity of Acetic Acid Hydrogenation on Ruthenium. Green. Chem. 16, 911–924. doi:10.1039/C4GC00011K
Ott, J., Gronemann, V., Pontzen, F., Fiedler, E., Grossmann, G., Kersebohm, D. B., et al. (2010). “Methanol,” in Ullmann's Encyclopedia of Industrial Chemistry (Chichester: Wiley).
Rakshit, P. K., Pathak, S., Voolapalli, R. K., and Upadhyayula, S. (2020). Thermodynamic Analysis, Kinetics Modeling, and Reactor Model Development for Acetic Acid Hydrogenation Reaction over Bimetallic Pt-Sn Catalyst. Energy Fuels 34, 3640–3648. doi:10.1021/acs.energyfuels.9b04070
Schemme, S., Breuer, J. L., Köller, M., Meschede, S., Walman, F., Samsun, R. C., et al. (2020). H2-Based Synthetic Fuels: A Techno-Economic Comparison of Alcohol, Ether and Hydrocarbon Production. Int. J. Hydrogen Energ. 45, 5395–5414. doi:10.1016/j.ijhydene.2019.05.028
Simell, P., Hannula, I., Tuomi, S., Nieminen, M., Kurkela, E., Hiltunen, I., et al. (2014). Clean Syngas from Biomass—Process Development and Concept Assessment. Biomass Conv. Bioref. 4, 357–370. doi:10.1007/s13399-014-0121-y
Stephane, C., Lemieux, A., and Lavoie, J.-M. (2011). “Conversion of Non-Homogeneous Biomass to Ultraclean Syngas and Catalytic Conversion to Ethanol,” in Biofuel's Engineering Process Technology. Editor M. A. D. S. Bernardes (Rijeka, Croatia: IntechOpen).
Teuner, St. C., Neumann, P., and von Linde, F. (2001). CO through CO2 Reforming - The Calcor Standard and Calcor Economy Processes. OIL Gas Eur. Mag. 27 (3), 44–46.
Torrence, G. P., Hokkanen, B. W., Nutt, M. O., Pan, T., and Shaver, R. D. (2013). Production of Acetic Acid with High Conversion Rate. US 8,394,988 B2.
Umweltbundesamt (2020). Entwicklung der spezifischen Kohlendioxid-Emissionen des deutschen Strommix in den Jahren 1990 - 2019. Available at: https://www.umweltbundesamt.de/sites/default/files/medien/1410/publikationen/2020-04-01_climate-change_13-2020_strommix_2020_fin.pdf (Accessed October 15, 2021).
Van-Dal, É. S., and Bouallou, C. (2013). Design and Simulation of a Methanol Production Plant from CO2 Hydrogenation. J. Clean. Prod. 57, 38–45. doi:10.1016/j.jclepro.2013.06.008
Vanden Bussche, K. M., and Froment, G. F. (1996). A Steady-State Kinetic Model for Methanol Synthesis and the Water Gas Shift Reaction on a Commercial Cu/ZnO/Al2O3Catalyst. J. Catal. 161, 1–10. doi:10.1006/jcat.1996.0156
Wismann, S. T., Engbæk, J. S., Vendelbo, S. B., Bendixen, F. B., Eriksen, W. L., Aasberg-Petersen, K., et al. (2019). Electrified Methane Reforming: A Compact Approach to Greener Industrial Hydrogen Production. Science 364, 756–759. doi:10.1126/science.aaw8775
Yoneda, N., Minami, T., Weiszmann, J., and Spehlmann, B. (2010). “The Chiyoda/uop Acetica™ Process: A Novel Acetic Acid Technology,” in Science and technology in catalysis, 1998: Proceedings of the third Tokyo Conference on Advanced Catalytic Science and Technology, Tokyo, July 19-24, 1998. Editors H. Hattori, and K. Ōtsuki (Tokyo, Amsterdam, New York: Kodansha), 93–98.
Keywords: hybrid, biomass, eletrofuels, ethanol, techno-economic analysis, power-to-fuel, biomass-to-fuel
Citation: Melin K, Nieminen H, Klüh D, Laari A, Koiranen T and Gaderer M (2022) Techno-Economic Evaluation of Novel Hybrid Biomass and Electricity-Based Ethanol Fuel Production. Front. Energy Res. 10:796104. doi: 10.3389/fenrg.2022.796104
Received: 15 October 2021; Accepted: 17 January 2022;
Published: 18 February 2022.
Edited by:
Erik Furusjö, Research Institutes of Sweden (RISE), SwedenReviewed by:
Yawer Jafri, Luleå University of Technology, SwedenHanfei Zhang, University of Pisa, Italy
Copyright © 2022 Melin, Nieminen, Klüh, Laari, Koiranen and Gaderer. This is an open-access article distributed under the terms of the Creative Commons Attribution License (CC BY). The use, distribution or reproduction in other forums is permitted, provided the original author(s) and the copyright owner(s) are credited and that the original publication in this journal is cited, in accordance with accepted academic practice. No use, distribution or reproduction is permitted which does not comply with these terms.
*Correspondence: Kristian Melin, S3Jpc3RpYW4uTWVsaW5AbHV0LmZp