 Kristin L. Brandt
 Lina Martinez-Valencia
 Michael P. Wolcott
- 1Composite Materials and Engineering Center, Washington State University, Pullman, WA, United States
- 2Biological Systems Engineering Department, Washington State University, Pullman, WA, United States
With jet fuel consumption projected to more than double by 2050, dramatic expansion of sustainable aviation fuel (SAF) use will be essential to meeting the aviation industry goal of achieving carbon neutrality in the same time frame. However, to date, the SAF price has, in part, been responsible for the lack of widespread adoption signaling the need for strong and stable policy. Multiple pathways have been developed and received ASTM approval to convert a variety of feedstocks into SAF, each with strengths and weaknesses that vary with conversion technology, feedstock, and production location. To assist researchers and governments in understanding the role of policy on fuel pricing, a set of harmonized, techno-economic analyses (TEAs) were developed to assess three ASTM-qualified production pathways: hydroprocessed esters and fatty acids (HEFAs), alcohol to jet (ATJ), and Fischer–Tropsch (FT), with multiple feedstock options. These decision support tools were used to assess the minimum selling price (MSP) for fuel distillates. Both mature (nth) plants and first of a kind (pioneer plants) were assessed using TEAs. Existing and proposed U.S. incentives, at both the federal and state levels, were integrated into the tools to determine the impact on the MSP. Considering the existing federal policies, analysis indicated that HEFAs could achieve a SAF price that would be competitive to conventional fuels when using waste lipid feedstocks, making this the most viable near-term option. However, this feedstock for HEFAs is limited and unlikely to support the production of large quantities of SAF. After stacking federal and state programs, SAF produced using FT with municipal solid waste (MSW) has the lowest MSP, although FT forest residuals, FT agricultural residues, ATJ corn ethanol, and HEFAs using second crop oilseeds all approach the historical range of traditional jet fuel prices for nth plants. Pioneer plants are viable for only ATJ corn ethanol; however, FT-MSW is approaching price parity.
1 Introduction
In an effort to reduce the climate impact of aviation, the Air Transport Action Group (ATAG), the International Air Transportation Association (IATA), Airlines for America (A4A), and the U.S. government have recently announced an updated goal of achieving net-zero carbon emissions by 2050. This time frame also coincides with a predicted doubling of global aviation fuel demand (Holladay et al., 2020; Airlines for America, 2021; Air Transportation Action Group (ATAG), 2021; Federal Aviation Administration, 2021; International Air Transportation Association (IATA), 2021). Simultaneously, the International Civil Aviation Organization (ICAO) is instituting the Carbon Offsetting and Reduction Scheme for International Aviation (CORSIA) to reach carbon neutral growth at 2019 emissions levels from 2021 through 2035 (International Civil Aviation Organization (ICAO), 2020; Petsonk, 2020). Although U.S. airlines are introducing operations and technologies that decrease fuel burn, these actions are insufficient to meet targets (A4A 2020). Instead, a suite of actions will likely be needed to meet the carbon reduction goals, with widespread use of sustainable aviation fuel (SAF) being essential. Drop-in SAF that does not require modifications of aircraft or infrastructure presents an opportunity to make significant progress toward the emission reduction goals in the near term using existing aircraft fleets. Major U.S. airlines are working with governmental agencies to reach the net-zero carbon emissions goal by 2050, pledging to support the production of 3 billion gallons of SAF for U.S. consumption by 2030 (Airlines for America, 2021) as outlined by the U.S. SAF Grand Challenge (Federal Aviation Administration, 2021).
Since 2009, seven conversion and two co-processing pathways have received ASTM D7566 qualification with additional methodologies currently in the qualification process. However, of these methods, only three are approaching commercial production. With over a decade of approval and certification, the worldwide SAF use is only 0.01% of the aviation fuel consumed (Air Transportation Action Group (ATAG), 2020). The low production volume is likely a result of SAF’s high minimum selling price (MSP) caused by sizable capital costs, high risk of the unproven technologies, the high cost to gain certification for a new fuel pathway, and a current policy that favors road transportation over aviation (Ghatala, 2020; Dodd and Yengin, 2021). However, European countries are issuing mandates that will soon require large quantities of SAF, some as high as 30% in 2030 (Finland and Sweden) (Royal Netherlands Aerospace Center (NLR) and Amsterdam Economics (SEO), 2021). In the United States, the policy support is under consideration by Congress, and commitment by federal agencies to a SAF Grand Challenge will support U.S. SAF production expansion (The White House, 2021) Although mandates and policy support will begin moving SAF production forward, high prices will continue to impede progress. In 2019, fuel costs were nearly a quarter of global airline operating costs, making price parity imperative for long-term success (International Air Transportation Association (IATA), 2019).
The ability for SAF to meet price parity with conventional jet fuel is well understood to be a challenge (de Jong et al., 2015; Chao et al., 2019; Holladay et al., 2020; Airlines for America, 2021; Dodd and Yengin, 2021) and thought to be required for large-scale CO2 abatement in the aviation industry. While conventional jet fuel is valued exclusively on the energy content required to power the flight, SAF is required to meet these standards while also providing the environmental services to reduce the greenhouse gas emissions compared to conventional fuels (Martinez-Valencia et al., 2021). Government policies and corporate sustainability programs will be vital to aid the technological innovations needed to close the price gap between conventional and sustainable fuels (Moriarty et al., 2021; Wang et al., 2021).
The objective of this study is to utilize a set of harmonized techno-economic analyses (TEAs) to assess the impact of existing and proposed U.S. clean fuel and carbon reduction programs on the minimum selling price and capital investment requirements of three SAF pathways currently under commercialization. Specifically, this analysis aims to quantify the impact of pathways, feedstocks, and plant maturity on MSP. The suite of analyses also demonstrates the effect of multiple policy incentive scenarios combined with technology maturity, and fuel carbon intensity score (CI) on SAF MSP.
2 Techno-Economic Analysis
Three SAF conversion pathways are considered in this analysis because of their role in the emerging U.S. biofuel landscape. Hydroprocessed esters and fatty acids (HEFAs) are used in the World Energy SAF facility (World Energy, 2021), and nearly two billion liters (L) of annual renewable diesel production in the United States. This volume is predicted to roughly quadruple with planned expansions and proposed new facilities and facilities already under construction (Pavlenko et al., 2019; Doliente et al., 2020; Bryan, 2021). Although the Fischer–Tropsch (FT) and alcohol to jet (ATJ) pathways are not yet fully commercialized, both technologies have facilities under construction in the United States. Red Rock Biofuels and Fulcrum BioEnergy plan to use FT to make liquid fuels or liquid fuel intermediates, while LanzaJet is currently constructing an ATJ facility (Fulcum Bioenergy, 2021; LanzaJet, 2021; Red Rocks Biofuel, 2021). Additional details on each pathway are provided in Supplementary Information S1.
While proprietary knowledge of processes for individual companies would be required to accurately predict economic results, generic modeling of the processes through public literature can provide valuable information regarding the relative cost performance and capital requirements of various processes. To achieve this goal, generic, open-source excel-based TEA models for the aforementioned pathways utilizing the applicable feedstock were established to generate comparative analyses. These TEAs were harmonized to assure a common set of financial assumptions, capital and operating expenditures where applicable, financial calculations, and non-SAF fuel pricing for greenfield facilities (Brandt et al., 2021a; Brandt et al., 2021b; Brandt et al., 2021c). This approach allows comparisons between technology and feedstock combinations, called “conversion pathways” in this work. Economic variables are detailed in the spreadsheet models (Brandt et al., 2021a; Brandt et al., 2021b; Brandt et al., 2021c), with a partial list provided in Table 1. The deterministic models were constructed using ratio factors to estimate outside battery limit (OSBL) costs from inside battery limit (ISBL) equipment costs (Peters et al., 2003). This method uses factors to estimate the typical costs of OSBL infrastructure based on historical data, has an estimated accuracy of ±20–30%, and has been implemented often for biofuels in the existing literature (Humbird et al., 2011; Davis et al., 2015; de Jong et al., 2015; Geleynse et al., 2018; Brandt et al., 2020; Eswaran et al., 2021; Tanzil et al., 2021). Details of the methodology can be found in Peters et al. (2003) and Brandt et al. (2020).
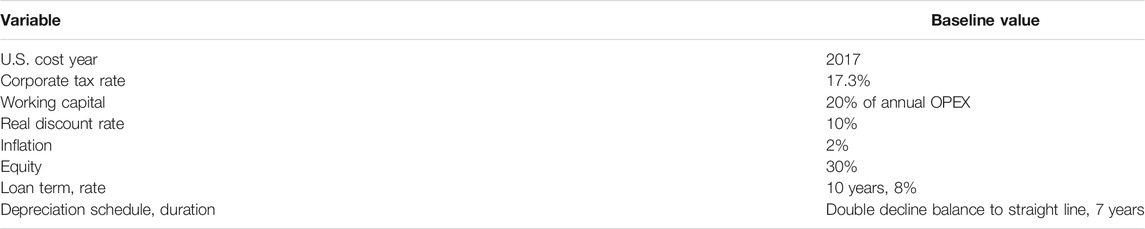
TABLE 1. Condensed list of baseline economic variables used in all models (Brandt et al., 2020).
The FT process converts syngas into an FT wax that is subsequently cracked and distilled. The model is structured to utilize various feedstocks for the required syngas. The preprocessing costs for forest residues, agricultural residuals, and municipal solid waste (MSW) to be used in gasification are included in the feedstock costs (Brandt and Wolcott, 2021; International Civil Aviation Organization (ICAO), 2021). In addition, two gaseous CO2 feedstocks [from direct air capture (DAC) and flue gas] that are subsequently converted to CO via power-to-liquid technologies are considered. Flue gas represents CO2 directly collected from industrial emissions, for example, at an ethanol production facility (Bains et al., 2017). In direct air capture, CO2 is extracted from the atmosphere. No additional processing is needed for feedstocks in the ATJ process where corn ethanol or second-generation (2G) cellulosic ethanol is assumed to be purchased as the feedstock. HEFA feedstocks include fats, oils, and grease (FOGs) that are assumed to be 75% animal tallow and 25% used cooking oil (Port of Seattle and Washington State University, 2020). Second-crop oilseeds are oilseeds that are cultivated on an existing farmland during a season where the land is normally left fallow. Baseline feedstock costs are listed in Table 2, with the understanding that these values can be controlling in the final fuel price (Tao et al., 2014; Davis et al., 2015; de Jong et al., 2015; Bann et al., 2017; Geleynse et al., 2018; Brandt et al., 2020; Doliente et al., 2020). The impact of baseline feedstock cost on SAF MSP is included in International Civil Aviation Organization (ICAO), 2021.
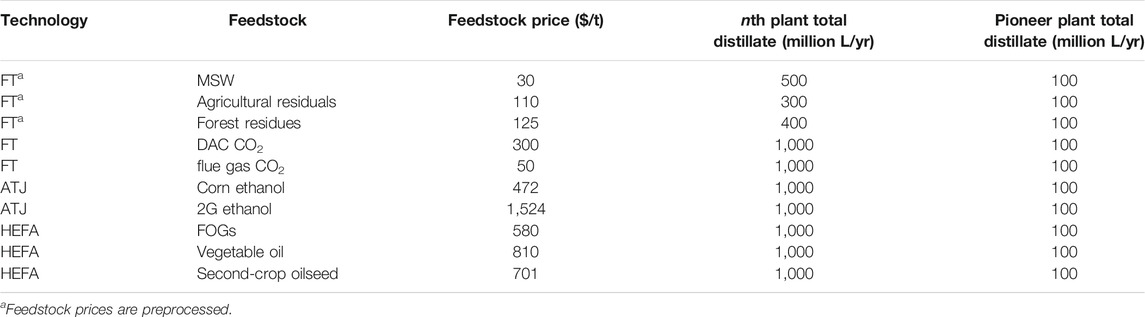
TABLE 2. Conversion pathways with feedstock price and scale for both nth and pioneer scale facilities.
In this study, two options for plant maturity are included: nth and pioneer plants. An nth plant is a technologically mature facility that is a replica of other successful facilities and is assumed to operate at a large scale. A pioneer plant is a first or near-first of its kind facility and is traditionally smaller than mature plants (Table 2) (International Civil Aviation Organization (ICAO), 2021). The small scale of a pioneer facility increases capital costs per liter of fuel and impedes the start-up ramp. Increased capital costs were modeled using cost growth factors. The production ramp for initial plant performance was calculated, and an assumed 20% per year increase was applied until full capacity was attained (Merrow et al., 1981; de Jong et al., 2015). The smaller pioneer facilities are assumed to have the same total distillate output across conversion pathways. However, this is not realistic for nth plants. Three FT feedstocks, MSW, agricultural residuals, and forest residues, are limited by the quantity of feedstock that can practically be aggregated at a single location (Table 2).
The baseline yield, feedstock price, and facility scales were selected as mid-range values from the literature (Brandt et al., 2021a; Brandt et al., 2021b; Brandt et al., 2021c). Changing these values impacts the MSP for each scenario discussed. Details on these trends, found using adaptations of the utilized models, are presented in International Civil Aviation Organization (ICAO), 2021. Increased yield decreased feedstock price, and the economies of scale for larger facilities help reduce the computed MSP.
2.1 Sustainable Fuel Programs
The purpose of many existing and proposed government programs is to either account for the environmental benefits afforded by sustainable fuels or provide economic support to this new industry. Additional programs exist that encourage the development and deployment of SAF. Understanding the financial impact of these various policy efforts is vital to differentiating the cost of the energy production for these fuels and the environmental services that they provide. Incenting domestic fuel production, decreasing the CI of liquid fuels, and securing rural jobs are a few examples of policy objectives for these programs. Additional details related to conversion pathway CI score are included in Supplementary Information S2.
Understanding the complexity and interactions of fuels, pathways, feedstocks, processing variables, and the environmental services provided by these fuels allows for a better understanding of financial viability. This is completed by considering the revenues of both the fuel sales and various government programs available for sustainable products. The impact of stacking the applicable incentives while balancing the process and feedstock costs required to qualify allows for the comparison of both fuel and environmental services revenues (Airlines for America, 2021; Wang et al., 2021). Policy support might be an effective method to incentivize SAF production in the United States, as demonstrated in renewable diesel production where the stacking of existing federal and state programs has been reported to generate enough income to cover production costs (Stratas Advisors, 2020).
2.1.1 Federal Sustainable Fuels Programs
The Renewable Fuel Standard (RFS) establishes a marketplace for the sale and purchase of renewable identification numbers (RINs) for compliance of fuel blenders to meet renewable volume obligations. This existing federal standard was designed to assist the United States in meeting long-term energy security and environmental goals by increasing the renewable fuel use through 2022. To qualify for RINs, a producer is required to meet a threshold greenhouse gas (GHG) emissions reduction. The value of a RIN is determined from the combination of production technology, feedstock, and fuel type produced (Environmental Protection Agency (EPA), 2021a). RIN values are tied to classifications, among which the producer chooses the highest value option. For example, a D3 RIN, generated for cellulosic biofuels, is often worth more than a D4, D5, or D6 RIN generated for biomass-based diesel, advanced biofuels including diesel from vegetable oil, and renewable ethanol, respectively (Environmental Protection Agency (EPA), 2021a; Environmental Protection Agency (EPA), 2021b).
A variety of existing and proposed blender’s tax credits (BTCs) exist to reduce the tax burden of a fuel blender. In the existing biomass-based BTC, the blender earns the credit as tax-free income once their tax burden has been erased (U.S. Department of Energy, 2021a; U.S. Department of Energy, 2021b). The biodiesel mixture excise tax credit, commonly called the diesel BTC, is $0.26/L BTC for biodiesel, agri-diesel, and renewable diesel. It does not have a lifecycle GHG reduction threshold or fuel use requirements. The alternative fuel excise tax credit, or gasoline blender’s tax credit, provides $0.13/L for various distillates without a CI reduction requirement (U.S. Department of Energy, 2021a). In May 2021, a proposed BTC for SAF was introduced in the Sustainable Skies Act. The bill includes an incentive of $0.40/L for SAF, with a minimum of 50% GHG emission reduction. The incentive value ramps up linearly to a maximum value of $0.53/L for SAF with 100% or greater GHG emission reduction and is proposed to be paid through 2031 (Schneider, 2021).
2.1.2 State Sustainable Fuel Programs
Selected states have created programs to encourage the production and use of sustainable fuels. The first such program is California’s low-carbon fuel standard (LCFS), which pays energy producers based on the tCO2e/MJ avoided (California Air Resources Board (CARB), 2021). Each producer’s CI is tracked with the producer being paid a premium per unit of fuel based on the quantity of the avoided carbon emissions. This model encourages continuous reductions in CI scores while also rewarding small CI changes. Similar programs have been implemented in Oregon (Oregon Department of Environmental Quality, 2021) and voted into law in Washington State (Department of Ecology, 2021).
2.1.3 Capital Grants
Investors in the alternative fuels industry weigh the massive capital requirements and the relatively immature technology against the probability of the industry succeeding. Incentives can be used to lower financial risks, which may persuade more investors to finance projects. Capital grants have been used to lower the investment requirements for biofuel plants in the United States. In 2014, Red Rock Biofuels was awarded $70 million as part of the United States Defense Production Act Title III Advanced Drop-in Biofuels project in the second phase. This followed $4.1 million from the first phase for engineering, for a total of nearly $75 million (Renewable Energy Focus.com, 2014). The same Department of Defense funding granted $70 million to Fulcrum BioEnergy for their MSW to fuel facility in Nevada (Reid, 2014). Fulcrum BioEnergy was also granted $4.7 million as funds in phase 1 of this project for engineering, bringing the total grant to $74.7 million (Schill, 2013).
2.2 Economic Impact of Federal and State Programs
To assess the relative impact of various federal and local programs on the minimum selling price and capital investment of SAF, a variety of incentive options were incorporated into harmonized TEA models. The programs modeled for all conversion pathways were categorized as 1) existing federal (EF), 2) proposed federal, 3) state, or 4) capital grants. The EF programs included the diesel BTC, the gasoline BTC, and RINs. The values used for various RINs were chosen as the median of the values from 2014 through 2020 (Environmental Protection Agency (EPA), 2021b). The sole proposed federal program was the federal SAF BTC. The California LCFS represented the state program modeled in the TEAs. We note that the LCFS values are similar to those in the Oregon CFP. After the demand in states with local incentives is met, fuel will have to be sold in markets supported by only federal incentives. Each incentive has specifications that must be met and are detailed with the calculations used to estimate the incentive value in Supplementary Material S2. For pioneer plants, $75 million capital grants were added to determine if these facilities could be de-risked enough to incent investment.
The BTC is paid to the blender of the fuel, which can be the producer or another company. Both the existing gasoline and diesel BTC require an unspecified amount of petroleum fuel to be added to the neat biofuel, a practice termed “splash blending,” which allows producers to blend without buying large quantities of petroleum diesel or the capital required for large tank farms. Given this common practice, we assume that producers are also the blender of record for diesel, gasoline, naphtha, and propane products. However, it is not apparent that splash blending would be permitted in the SAF BTC, thereby restricting producer-based blending only to large petroleum refiners. When SAF is produced and certified to meet ASTM 7566, the SAF is then blended with conventional fuels at a predetermined limit to meet ASTM 1655. As the ASTM standard is currently written, splash-blending does not meet the neat or blended SAF standards. While this could be addressed through future changes to the ASTM standards, we assume here that splash-blending of SAF is not permitted. The uncertainty surrounding blending by an SAF producer is addressed by analyzing this incentive in two ways. The first scenario assumes that the producer receives the entire incentive to reduce taxes and then as tax-free income. The second scenario assumes that the producer will receive a portion of the incentive, a variable that will be analyzed at multiple values, as taxable income. We speculate that with low volumes of and increasing demand for SAF, the producer will recover a large portion of the incentive. In all of these scenarios, we assume that the BTCs are available for the first 10 years of a facility’s 20-year production life, as is currently represented in the proposed bill.
As a means of comparison, the computed MSP for SAF is benchmarked against the mean, maximum, and minimum annual wholesale petroleum jet fuel price from 2011 through 2020 (Energy Information Administration (EIA), 2021b). MSP values calculated with incentives include incentives for all eligible liquid fuels. While the RFS does not currently include FT with either DAC or flue gas as feedstocks, for the purpose of this analysis, we assume that this conversion pathway would be eligible for advanced biofuel, D5 RINs. For determining the CI score for fuels produced with DAC and flue gas, we assumed that only renewable electricity and green hydrogen were used.
The U.S. EPA has not defined a pathway to convert ethanol RINs to RINs for other distillates or a method to not issue RINs for ethanol that is used as an intermediate in manufacturing other fuels. To address this in the ATJ pathway, it was assumed that the ethanol purchased to produce fuels is produced at the SAF facility, and the ethanol price paid is a transfer cost equal to the cost of production.
3 Results
The following subsections present the SAF MSP ($/L) for the different technologies and feedstocks. The baseline corresponds only to the MSP of the fuel’s energy content. Policies and programs are included for existing and proposed federal programs, state programs, and capital grants for comparison to the baseline. The figures include the wholesale petroleum jet fuel price from 2011 to 2020 for reference.
3.1 No Policy Support
MSP values were determined for both nth and pioneer plants without considering revenues from various government programs (Table 3). The nth plant MSP values are the baseline values to which all comparisons are made unless stated otherwise. Pioneer values for HEFA facilities were not included because the technology is sufficiently advanced to be assumed as mature (de Jong et al., 2015). However, for all other processes, MSP values from the pioneer plant were significantly higher than nth plant due to smaller plant scale and higher technology uncertainties.
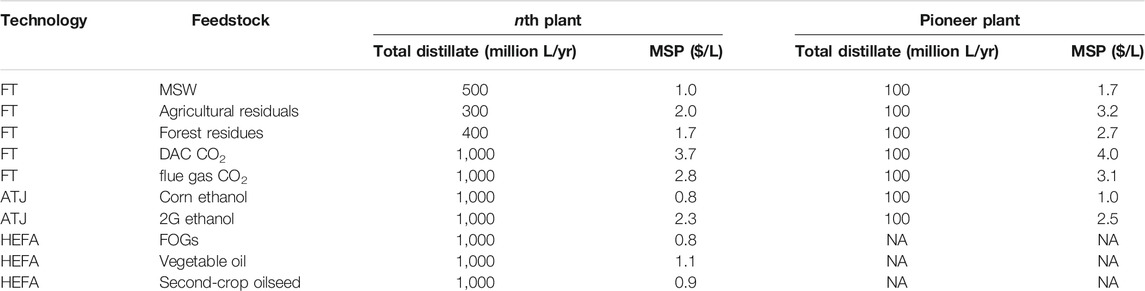
TABLE 3. Total distillate production and MSP for nth and pioneer plants for each conversion pathway using baseline assumptions, which do not include incentives.
HEFA viability is controlled by the availability of low-cost feedstock, a controlling variable in MSP for this lower capital pathway. For the ATJ SAF using 2G ethanol as the feedstock, the MSP is much higher if the feedstock is corn ethanol. It is understood that the price of 2G ethanol will likely drop over time as it becomes more widely available, which will reduce the SAF MSP. This expected price drop will be combined with a more significant GHG reduction for 2G ethanol, increasing some incentive values. FT processes are not mature, and high capital costs limit the ability of this pathway without very low-cost feedstock, for example, MSW. MSW, agricultural residuals, and forest residuals differ on the distillates yield (Brandt et al., 2021b), and all require preprocessed feedstocks that increase the resulting fuel MSP. However, the additional revenues of recyclable separation assist in reducing MSW feedstock costs.
3.2 Existing and Proposed Federal Programs
Calculated values of the existing and proposed federal incentives for each conversion pathway are listed in Table 4. The RIN type and thus RIN value are a function of the conversion pathway and meeting a minimum CI reduction, based on RFS legislation. Both the gasoline and diesel BTC do not have specific CI targets, making this a low-effort policy to earn. The lower gasoline and diesel BTC incentive values for MSW reflect a reduction taken for the non-biogenic portion of the feedstock.
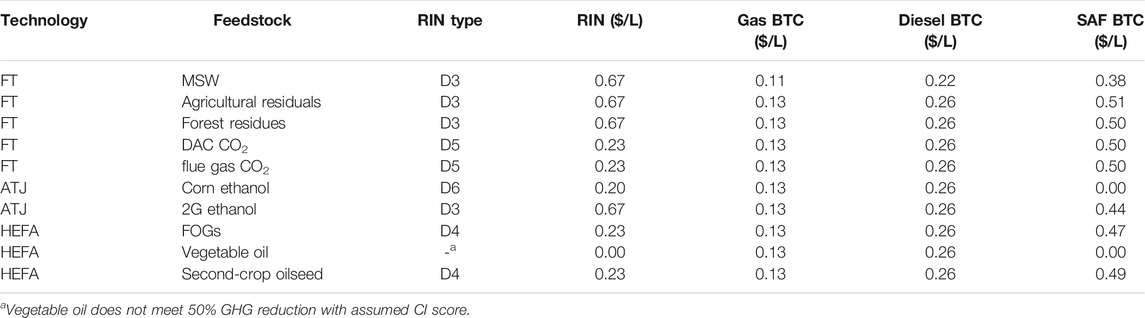
TABLE 4. Value of federal incentives for technologies and feedstocks modeled using CORSIA CI scores. RINs listed are for SAF.
The decrease in MSP from EF and the proposed SAF BTC varies with the conversion pathway. The decline is controlled by the estimated value of each incentive, the tax qualifications of the policy revenues, capital intensity of the pathway, the cost of the feedstock selected, and the scale of non-feedstock operating costs (Figures 1–3). The small decrease in SAF MSP for vegetable oil (Figure 1) results from the diesel and gasoline BTCs that do not specify CI reduction thresholds. This conversion pathway does not meet the proposed CI criteria for the proposed SAF BTC, so no benefit is realized. Both FOGs and second-crop oilseed oil meet the criteria to get RINs having more significant incentives that result in bigger MSP drops. The ability to stack program benefits combined with lower feedstock cost makes fuels produced from both of these feedstocks a more financially attractive alternative than vegetable oil. Although a competitive price can be obtained with existing and proposed federal programs, the availability of FOGs and the nascent practice of second cropping limit industry deployment using only HEFA.
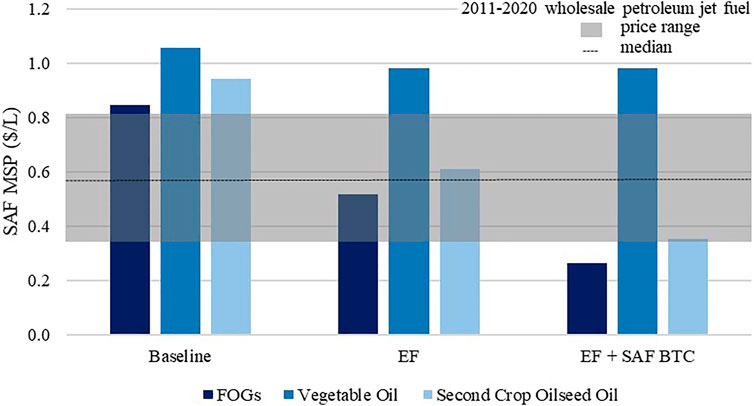
FIGURE 1. Impact of EF and proposed SAF BTC on MSP for three feedstocks using the HEFA process.
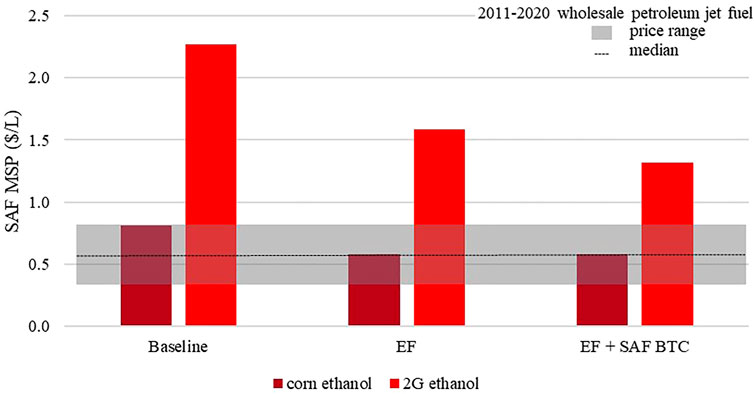
FIGURE 3. Impact of EF and proposed SAF BTC on MSP for two feedstocks using the ATJ process.
SAF produced using FT has prices above the wholesale petroleum price range from 2011 to 2020 without any program support, regardless of the feedstock selected. However, the lowest cost feedstock, MSW, may be able to overcome the high capital costs with existing federal programs. Forest residues become a possible feedstock if the existing federal programs are combined with the proposed SAF BTC. The smaller facility scale for agricultural residuals hinders this feedstock choice. Although DAC and flue gas both have low CI scores (Supplementary Information S2), the overwhelming operating and capital costs will need substantially more significant support to attain MSP value similar to other SAF conversion pathways (Figure 2).
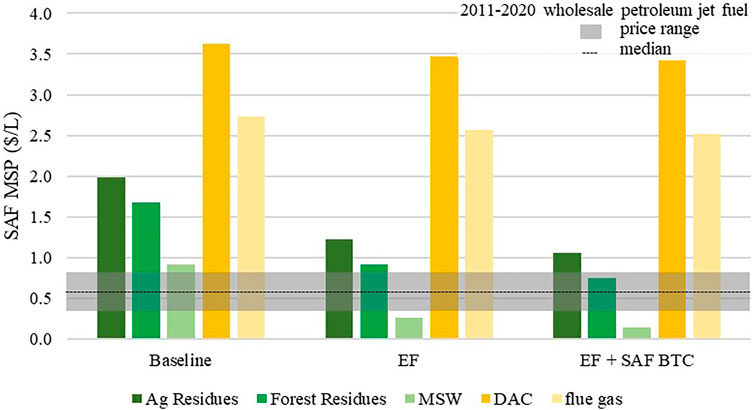
FIGURE 2. Impact of EF and proposed SAF BTC on MSP for five feedstocks using the FT process.
Using corn ethanol to manufacture SAF is attractive both from fuel cost and feedstock availability positions. However, the low CI improvement and RIN classification mean that the policy support for monetizing environmental services is low. However, for 2G ethanol to be a realistic feedstock, the ethanol cost will have to decrease, even with stacking of the existing and proposed federal programs (Figure 3).
The introduction of incentives and their respective constraints have the ability to reorder the economic viability of conversion pathways not from the value of fuel product but from the environmental services that sustainable fuels provide. Prospective producers will look at profitability with and without policy support and weigh the stability of the expected support when selecting a conversion and feedstock pathways.
3.2.1 Variations to the Proposed SAF BTC
The proposed SAF BTC could be implemented in a variety of manners, which will influence the impact of the proposed legislation on SAF production. As this legislation stands, the value reduces the blender’s tax liability to zero before becoming a tax-free income stream. Companies that can purchase or rent tank farms as well as purchase large quantities of petroleum jet fuel will likely blend SAF to be eligible for the entire proposed SAF BTC. However, this approach is likely cost-prohibitive for smaller organizations. To quantify the impact of sharing the value of the SAF BTC with a producer, three scenarios were analyzed for a subset of the feedstocks using the FT pathway with approved feedstocks. In each scenario, the value of the BTC passed to the producer ranges from 70 to 90% and is considered taxable income (Figure 4). Predictably, the SAF MSP increases when more of the incentive is kept by the blender. The increase in MSP is $0.11/L between the 100% tax-free and 70% taxable scenarios. The decreased value does not change the financial viability for fuels produced with either MSW or agricultural residues. MSW is viable without the SAF BTC, and the proposed SAF BTC value is not enough to reduce the agricultural residue MSP to a value within the 2011–2020 wholesale petroleum jet fuel price range. However, the MSP drops into the range of petroleum jet fuel for forest residues for only the producer as the blender scenario.
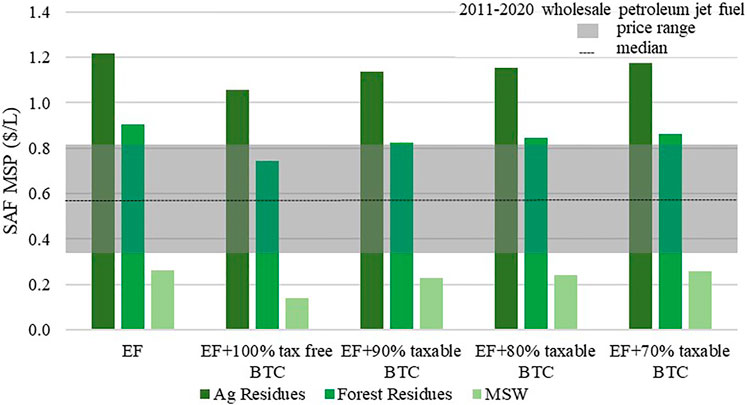
FIGURE 4. Scenarios illustrating the impact of SAF BTC implementation variables.
Monetizing the environmental benefits of SAF appears to be an effective means of increasing the financial viability of production. However, the effective duration of the government program impacts both the MSP and the likelihood of investment (Ghatala, 2020). To understand the impact that uncertainty in government programs may have on the MSP of SAF, the SAF BTC was modeled with a 20-, 10-, 5-, and 2-year life span for FT processes. As expected, maintaining the program for the effective plant life has the largest impact on MSP, especially for marginally competitive feedstocks like forest residuals (Figure 5). Given the minimal MSP improvement for short duration program, investors may likely not even consider it in building a facility.
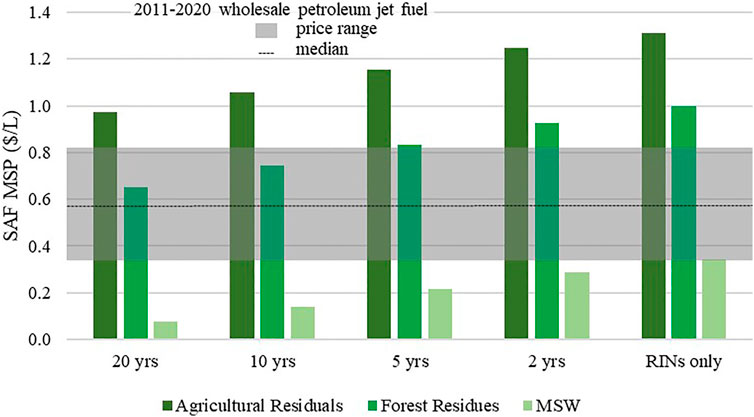
FIGURE 5. SAF MSP values with RINs and four BTC durations.
Currently, road fuel production is incentivized over SAF (Pavlenko et al., 2019). In the United States, this is most evident through the diesel BTC. In addition, SAF generally requires additional hydrogen, energy, and operating time to crack FT waxes or lipids to the lower SAF molecular weights. While some amount of middle distillate representing the SAF cut is produced in these processes, the breadth of the diesel standard allows this cut to be sold in diesel with little effect on diesel quality. Without the passage of the Sustainable Skies Act, it is unlikely that biofuel producers will choose to produce SAF at any significant quantity. Diesel currently earns a BTC of $0.26/L, regardless of CI reduction. The proposed SAF BTC value is higher at $0.40–0.53/L but requires a minimum CI reduction of 50% to be met.
To overcome the financial impetus of simply selling the SAF cut with the diesel, SAF programs need to be more favorable. Using FT with MSW as an example, Figure 6 shows the total 20-years revenue as the sum of fuel sales and policy support, for three distillate cut options and two policy scenarios: EF and EF plus SAF BTC. In these scenarios, we assume that the SAF price is equal to the mean petroleum jet fuel price from 2011 to 2020 (Energy Information Administration (EIA), 2021b). In addition, the three distillate cuts examined were 0:80:20, 40:40:20, and 50:30:20 for the assumed jet:diesel:naphtha volume fractions. This analysis was completed using the simplifying assumption that no additional equipment or operating costs are needed to complete the distillate slate change.
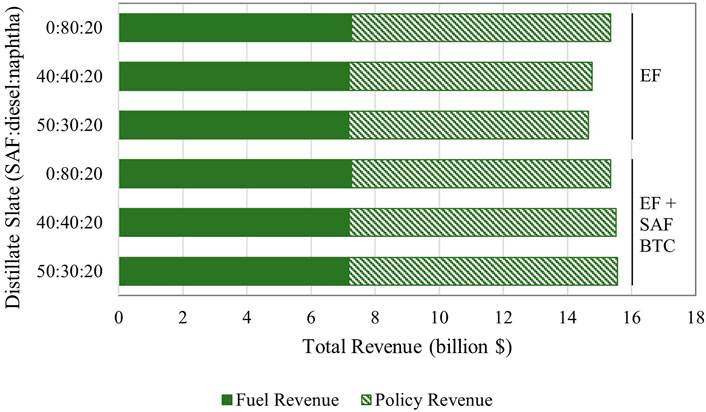
FIGURE 6. Total, fuel, and policy revenues for three distillate cut scenarios with either EF or EF plus SAF BTC policy support.
The results depicted in Figure 6 illustrate that without the SAF BTC, selling only diesel is more financially attractive than a combination of diesel and SAF. This point is evidenced by the fact that for all scenarios, the total revenue is greater when a producer sells only diesel with only EF policies. However, with the addition of the SAF BTC, although revenues from fuel sales might decrease, the total revenue, including policy support, is maximized.
3.3 State Programs
Localized state-level incentives can be stacked with federal incentives to lower estimated MSP values further. Here, we use the LCFS incentives to demonstrate this impact. Localized incentives reduce MSP values appreciably, even into negative MSP values, but are inherently limited to the fuel volumes used in the applicable region (Table 5). After stacking the LCFS program credits with existing and proposed federal programs, seven conversion pathways drop into the 2011–2020 wholesale petroleum jet fuel price range (Table 5). Three conversion pathways result in negative MSP values. Negative MSP values demonstrate that higher returns could be realized by producers than is assumed in the baseline model scenarios. States with programs that can be stacked with the federal policy will provide the most lucrative market. In 2019, California used 16.9 billion L of petroleum jet fuel, with close to 17% of the total U.S. consumption (Energy Information Administration (EIA), 2021a). If half of this fuel volume is replaced with SAF, 8.4 billion L will be needed to saturate the California market. When the volumes for both Oregon and Washington are included at the same addition rate, an additional 2 billion L/yr is required. The U.S. potential for SAF production from FOGs has been estimated to be approximately 3 billion L/yr, well short of the 10.4 billion L west coast demand (Skaggs et al., 2018; Wolff et al., 2020). Although second-crop oilseeds are a possible feedstock, it will take time to ramp up production. With the HEFA feedstock limitations, the volume of SAF demand in the west coast states may allow technology and feedstocks to be de-risked for the earliest entrants. However, this may be prevented or delayed if HEFA SAF floods the market from existing domestic and foreign renewable diesel facilities.
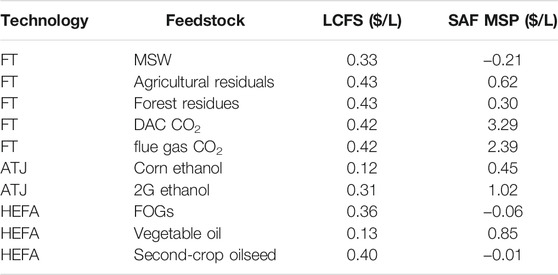
TABLE 5. Value of LCFS incentives for technologies and feedstocks modeled using CORSIA CI scores. SAF MSP values were calculated, including RINs, diesel, gasoline, and SAF BTC, in addition to LCFS.
3.4 Capital Grants
The combination of existing and proposed federal programs with state programs shift predicted MSP values to levels that appear financially attractive for nth plants (Table 5). However, the MSP values associated with pioneer plants are much higher (Table 3). One of the programs available for pioneer plants that are used to encourage new SAF facilities is capital grants. The impact of these grants depends on both the capital intensity of a conversion pathway and the relative level of operating costs. These grants are not intended for mature technology, and although pioneer plants are more expensive per volume of fuel produced, the total capital investment (TCI) can be significantly lower than that of a mature plant because of the smaller scale. To quantify the potential impact of this incentive class, a $75 million capital grant was added to the baseline pioneer plant analyses for the FT and ATJ technologies. The absolute drop in MSP is $0.09/L across all feedstocks for FT and ATJ, although the percentage drop in MSP values varies (Figure 7). For ATJ, the percentage drop in TCI is much more than that for the FT facilities. The drop in TCI de-risks a new technology facility, even if the MSP does not drop significantly and may lead to investment. None of the pioneer technology conversion pathways reach the comparative petroleum jet fuel price range with only a capital grant.
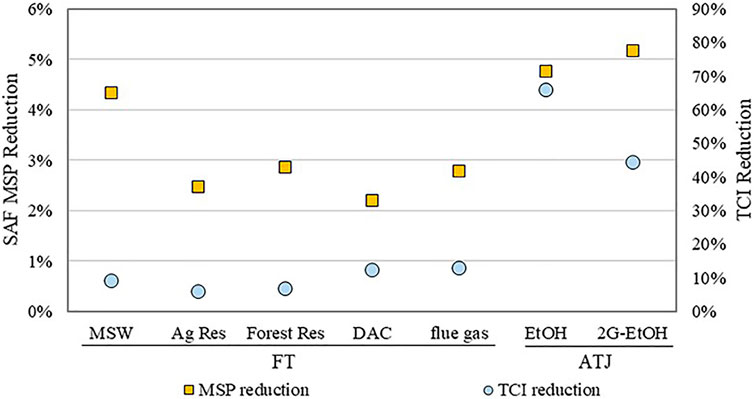
FIGURE 7. Percent reduction of baseline MSP and TCI for pioneer plants with a $75 million capital grant.
The cost reductions in Figure 7 increase with the addition of the three BTC incentives, RINs and LCFS, but only for fuels with emission reductions that meet the requirements. To illustrate the effect of each incentive on MSP, FT-MSW and FT-forest residues MSP are shown in Figure 8 and Figure 9, respectively. For a scenario with a pioneer FT-MSW facility, the combination of a $75 million capital grant, three BTC incentives, RINs, and LCFS, the SAF MSP approaches, but does not enter the traditional jet price range. Despite the stacking of incentives, the SAF MSP for forest residues is still twice the highest value in the price band for the petroleum jet fuel. However, if FT-MSW is successful, some of the learnings will apply to FT forest residues, and capital costs for the first plants could drop. This FT conversion pathway is the closest to price parity for a pioneer plant, which clarifies that a suite of incentives will be needed to aid in the maturation of this technology. Corn ethanol is cost-competitive for a pioneer plant with the stacking of policy support; however, the CI reduction is low.

FIGURE 8. Progressive impact of incentives on FT-MSW SAF MSP for pioneer plants.
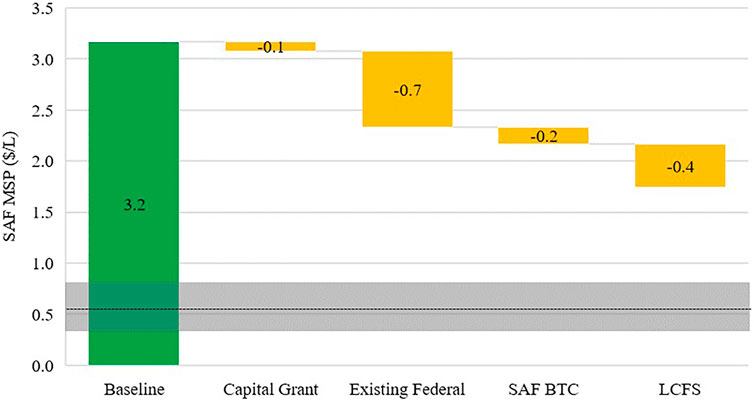
FIGURE 9. Progressive impact of incentives on FT forest residues SAF MSP for pioneer plants.
4 Conclusion
SAF is a critical product to meet local, national, and global GHG reduction targets. Policy support that monetizes the environmental benefits is vital to deploying new technologies and production capacity. The incorporation of the SAF BTC in the United States, combined with existing federal and state programs, is needed to encourage producers to add SAF into their product slate. Without the addition of the SAF BTC, producers are unlikely to sell SAF outside of offtake requirements as it generates lower revenues than diesel. Programs that correlate the monetary value with CI value favor conversion pathways with lower CI values, which in turn selectively lower MSP values for fuels that yield the most environmental services (e.g., CO2e reductions). This can change the rank order of the economic feasibility of conversion pathways, making the lowest CI fuels more profitable. ATJ-corn ethanol has the lowest MSP, tied with HEFA-FOGs without incentives. However, ATJ corn drops to fifth with the addition of incentives because of the relatively high CI score assigned to this feedstock, while HEFA-FOGs drop to the second place behind FT-MSW. The differential payment schedule of the proposed SAF BTC, the value of RIN classifications, and the state programs help steer production toward pathways with the lowest CI score.
Program values are volatile in value and duration. The impact of duration of each program should be studied further, looking at set end dates and the possibility of legislation that assures a facility of a set number of years from the end of construction. Future work should also analyze changes in program credit values. Between 2014 and 2020, if the selected RIN values were the minimum or maximum annual value, the MSP for FT-MSW or FT forest residues will change by ±$0.30/L–$0.40/L. The scale of this change is even more pronounced for LCFS, with changes as great as $0.75/L. The CI scores used in this study are general values that will change with specific processes and locations and will impact the value of the SAF BTC and LCFS. A stochastic analysis of existing and proposed incentive values is a crucial next step to understanding the potential impact of incentives on the production and sale of SAF. Stacking of policies and programs is necessary to encourage the development of a robust SAF market, especially for pioneer technology.
Data Availability Statement
The original contributions presented in the study are included in the article/Supplementary Material, further inquiries can be directed to the corresponding author.
Author Contributions
The study described in this work was designed by KB and MW and the data was largely compiled by KB and LM-V. The analysis was completed by KB. KB wrote the draft manuscript that was reviewed by MW and LM-V.
Funding
This research was funded by the U.S. Federal Aviation Administration Office of Environment and Energy through ASCENT, the FAA Center of Excellence for Alternative Jet Fuels, and the Environment, project 001A through FAA Award Number 13C-AJFE-WaSU-16 under the supervision of Nathan Brown. Any opinions, findings, conclusion, or recommendations expressed in this material are those of the authors and do not necessarily reflect the views of the FAA. LM-V is very thankful to the Fulbright-Colciencias Scholarship program for financial support of her studies and living expenses in the United States.
Author Disclaimer
The views and opinions expressed in this article are those of the authors and do not necessarily reflect the official policy or position of any corporation and any agency of the U.S. government.
Conflict of Interest
The authors declare that the research was conducted in the absence of any commercial or financial relationships that could be construed as a potential conflict of interest.
Publisher’s Note
All claims expressed in this article are solely those of the authors and do not necessarily represent those of their affiliated organizations, or those of the publisher, the editors, and the reviewers. Any product that may be evaluated in this article, or claim that may be made by its manufacturer, is not guaranteed or endorsed by the publisher.
Acknowledgments
The authors would like to acknowledge the discussions and clarifications provided by Glenn Johnston, Alex Menotti, and John Plaza. Their expertise helped shape the scenarios analyzed.
Supplementary Material
The Supplementary Material for this article can be found online at: https://www.frontiersin.org/articles/10.3389/fenrg.2022.828789/full#supplementary-material
References
Air Transportation Action Group (2021). Aviation Industry Adopts 2050 Net-Zero Carbon Goal. Available at: https://www.atag.org/component/news/?view=pressrelease&id=125 (Accessed October 28, 2021).
Air Transportation Action Group (2020). Waypoint 2050. Available at: https://aviationbenefits.org/media/167187/w2050_full.pdf.
Airlines for America (2021). U.S. Airlines Announce 3-Billion-Gallon Sustainable Aviation Fuel Production Goal. Washington, DC: News Updat.
Bains, P., Psarras, P., and Wilcox, J. (2017). CO 2 Capture from the Industry Sector. Prog. Energ. Combustion Sci. 63, 146–172. doi:10.1016/j.pecs.2017.07.001
Bann, S. J., Malina, R., Staples, M. D., Suresh, P., Pearlson, M., Tyner, W. E., et al. (2017). The Costs of Production of Alternative Jet Fuel: A Harmonized Stochastic Assessment. Bioresour. Tech. 227, 179–187. doi:10.1016/j.biortech.2016.12.032
Brandt, K., Geleynse, S., Martinez-Valencia, L., Zhang, X., Garcia-Perez, M., and Wolcott, M. P. (2021a). Alcohol to Jet Techno-Economic Analysis. doi:10.7273/000001461
Brandt, K. L., Wooley, R. J., Geleynse, S. C., Gao, J., Zhu, J., Cavalieri, R. P., et al. (2020). Impact of Co‐product Selection on Techno‐economic Analyses of Alternative Jet Fuel Produced with forest Harvest Residuals. Biofuels, Bioprod. Bioref. 14, 764–775. doi:10.1002/bbb.2111
Brandt, K., Tanzil, A. H., Martinez-Valencia, L., Garcia-Perez, M., and Wolcott, M. P. (2021b). Fischer Tropsch Techno-Economic Analysis. doi:10.7273/000001459
Brandt, K., Tanzil, A. H., Martinez-Valencia, L., Garcia-Perez, M., and Wolcott, M. P. (2021c). Hydroprocessed Esters and Fatty Acids Techno-Economic Analysis. doi:10.7273/000001460
Brandt, K., and Wolcott, M. P. (2021). Fischer Tropsch Feedstock Pre-processing Techno-Economic Analysis. doi:10.7273/000001463
Bryan, T. (2021). Renewable Diesel’s Rising Tide. Biodiesel Mag. Available at: http://www.biodieselmagazine.com/articles/2517318/renewable-diesels-rising-tide (Accessed August 25, 2021).
California Air Resources Board (2021). Data Dashboard. Available at: https://ww3.arb.ca.gov/fuels/lcfs/dashboard/dashboard.htm (Accessed July 14, 2021).
Chao, H., Agusdinata, D. B., DeLaurentis, D., and Stechel, E. B. (2019). Carbon Offsetting and Reduction Scheme with Sustainable Aviation Fuel Options: Fleet-Level Carbon Emissions Impacts for U.S. Airlines. Transportation Res. D: Transport Environ. 75, 42–56. doi:10.1016/j.trd.2019.08.015
Davis, R., Tao, L., Scarlata, C., Tan, E. C. D., Ross, J., Lukas, J., et al. (2015). Process Design and Economics for the Conversion of Lignocellulosic Biomass to Hydrocarbons: Dilute-Acid and Enzymatic Deconstruction of Biomass to Sugars and Catalytic Conversion of Sugar to Hydrocarbons. Golden, CO, United States: NREL. Available at: https://web.archive.org/web/20200623200535id_/https://www.nrel.gov/docs/fy15osti/62498.pdf.
de Jong, S., Hoefnagels, R., Faaij, A., Slade, R., Mawhood, R., and Junginger, M. (2015). The Feasibility of Short-Term Production Strategies for Renewable Jet Fuels - a Comprehensive Techno-Economic Comparison. Biofuels, Bioprod. Bioref. 9, 778–800. doi:10.1002/bbb.1613
Department of Ecology, S. of W (2021). Clean Fuel Stadard. Reducing Greenh. Gases. Available at: https://ecology.wa.gov/Air-Climate/Climate-change/Reducing-greenhouse-gases/Clean-Fuel-Standard (Accessed December 1, 2021).
Dodd, T., and Yengin, D. (2021). Deadlock in Sustainable Aviation Fuels: A Multi-Case Analysis of agency. Transportation Res. Part D: Transport Environ. 94, 102799. doi:10.1016/j.trd.2021.102799
Doliente, S. S., Narayan, A., Tapia, J. F. D., Samsatli, N. J., Zhao, Y., and Samsatli, S. (2020). Bio-aviation Fuel: A Comprehensive Review and Analysis of the Supply Chain Components. Front. Energ. Res. 8, 38. doi:10.3389/fenrg.2020.00110
Energy Information Administration (2021a). Table F1: Jet Fuel Consumption, price and Expenditure Estimates, 2019U.S. States, State Profile Energy Estim. Available at: https://www.eia.gov/state/seds/data.php?incfile=/state/seds/sep_fuel/html/fuel_jf.html&sid=CA (Accessed October 14, 2021).
Energy Information Administration (2021b). U.S. Kerosene-type Jet Fuel Wholesale/Resale Price by Refiners. Pet. Other Liq. Available at: https://www.eia.gov/dnav/pet/hist/LeafHandler.ashx?n=PET&s=EMA_EPJK_PWG_NUS_DPG&f=M (Accessed September 28, 2021).
Environmental Protection Agency (2021a). Approved Pathways for Renewable Fuel. Renew. Fuel Stand. Progr. Available at: https://www.epa.gov/renewable-fuel-standard-program/approved-pathways-renewable-fuel (Accessed July 14, 2021).
Environmental Protection Agency (2021b). Renewable Fuel Standard Program. Available at: https://www.epa.gov/renewable-fuel-standard-program (Accessed July 14, 2021).
Eswaran, S., Subramaniam, S., Geleynse, S., Brandt, K., Wolcott, M., and Zhang, X. (2021). Techno-economic Analysis of Catalytic Hydrothermolysis Pathway for Jet Fuel Production. Renew. Sust. Energ. Rev. 151, 111516. doi:10.1016/j.rser.2021.111516
Federal Aviation Administration (2021). Aviation Climate Action Plan. Sustainability. Available at: https://www.faa.gov/sustainability/aviation-climate-action-plan (Accessed March 12, 2021).
Fulcum Bioenergy (2021). Our Process. Technology. Available at: https://fulcrum-bioenergy.com/technology/our-process/ (Accessed August 25, 2021).
Geleynse, S., Brandt, K., Garcia-Perez, M., Wolcott, M., and Zhang, X. (2018). The Alcohol-To-Jet Conversion Pathway for Drop-In Biofuels: Techno-Economic Evaluation. ChemSusChem 11, 3728–3741. doi:10.1002/cssc.201801690
Ghatala, F. (2020). Sustainable Aviation Fuel Policy in the United States: A Pracmatic Way Forward. Washington D.C. Available at: https://www.atlanticcouncil.org/wp-content/uploads/2020/04/AC_SAF_0420_v8.pdf.
Holladay, J., Abdullah, Z., and Heyne, J. (2020). Sustainable Aviation Fuel, Review of Technical Pathways. Available at: https://www.energy.gov/sites/prod/files/2020/09/f78/beto-sust-aviation-fuel-sep-2020.pdf.doi:10.2172/1660415
Humbird, D., Davis, R., Tao, L., Kinchin, C., Hsu, D., Aden, A., et al. (2011). Process Design and Economics for Biochemical Conversion of Lignocellulosic Biomass to Ethanol: Dilute-Acid Pretreatment and Enzymatic Hydrolysis of Corn Stover. United States: Golden, CO. doi:10.2172/1013269
International Air Transportation Association (2019). Fuel Fact Sheet. Available at: https://www.iata.org/contentassets/25e5377cf53c4e48bbaa49d252f3ab03/fact-sheet-fuel.pdf.
International Air Transportation Association (2021). Net-Zero Carbon Emissions by 2050. 2021 Press. Releases. Available at: https://www.iata.org/en/pressroom/2021-releases/2021-10-04-03/ (Accessed May 6, 2021).
International Civil Aviation Organization (2020). Carbon Offsetting and Reduction Scheme for International Aviation (CORSIA). Available at: https://www.icao.int/environmental-protection/CORSIA/Documents/CORSIA_FAQs_December 2020_final.pdf.
International Civil Aviation Organization (2021). SAF Rules of Thumb. Environ. Prot. Available at: https://www.icao.int/environmental-protection/Pages/SAF_RULESOFTHUMB.aspx (Accessed November 9, 2021).
LanzaJet, (2021). Georgia - Freedom Pines Fuels. Where We Oper. Available at: https://www.lanzajet.com/where-we-operate/#georgia (Accessed August 25, 2021).
Martinez-Valencia, L., Garcia-Perez, M., and Wolcott, M. P. (2021). Supply Chain Configuration of Sustainable Aviation Fuel: Review, Challenges, and Pathways for Including Environmental and Social Benefits. Renew. Sust. Energ. Rev. 152, 111680. doi:10.1016/j.rser.2021.111680
Merrow, E. W., Phillips, K., and Myers, C. W. (1981). Understanding Cost Growth and Performance Shortfalls in Pioneer Process Plants. Santa Monica, CA: RAND Corporation PP - Santa Monica, CA. Available at: https://www.rand.org/pubs/reports/R2569.html.
Moriarty, K., Milbrandt, A., and Tao, L. (2021). Port Authority of New York and New Jersey Sustainable Aviation Fuel Logistics and Production Study. United States. doi:10.2172/1827314Port Authority of New York and New Jersey Sustainable Aviation Fuel Logistics and Production Study
Oregon Department of Environmental Quality (2021). Clean Fuel Program Overview. Oreg. Clean Fuels Progr. Available at: https://www.oregon.gov/deq/ghgp/cfp/Pages/CFP-Overview.aspx (Accessed July 14, 2021).
Pavlenko, N., Searle, S., and Christen, A. (2019). The Cost of Dupporting Alternative Jet Fuels in the European Union. Available at: https://theicct.org/sites/default/files/publications/Alternative_jet_fuels_cost_EU_20190320.pdf.
Peters, M. S., Timmerhaus, K. D., and West, R. E. (2003). Plant Design and Economics for Chemical Engineers. 5 th. New York, NY: McGraw-Hill.
Petsonk, A. (2020). ICAO Council Bows to Aviation Industry Request to Rewrite First Three Years of Climate Program Rules. Press release Arch. Washington, DC: Environmental Defense Fund. Available at: https://www.edf.org/media/icao-council-bows-aviation-industry-request-rewrite-first-three-years-climate-program-rules (Accessed October 28, 2021).
Port of SeattleWashington State University (2020). Potential Northwest Regional Feedstock and Production of Sustainable Aviation Fuel. Seattle. Available at: https://www.portseattle.org/sites/default/files/2020-08/PofSeattleWSU2019updated_appendix.pdf.
Red Rocks Biofuel (2021). Technology. Available at: https://www.redrockbio.com/(Accessed August 25, 2021).
Reid, H. (2014). Reid Announces $70 Million for Dulcrum BioEnergy. 2. Available at: https://fulcrum-bioenergy.com/documents/2014-09-19ReidAnnouncesDoDGranttoFulcrumBioEnergy.pdf.
Renewable Energy Focus.com (2014). Red Rock Biofuel Wins $70 Million Grabt for Biomass Project. Renew. Energ. Focus. Available at: http://www.renewableenergyfocus.com/view/40077/red-rock-biofuels-wins-70-million-grant-for-biomass-project/.
Royal Netherlands Aeroespace Centre, and Amsterdam Economics (2021). Destination 2050: A Route to Net Zero European Aviation. Available at: https://www.destination2050.eu/wp-content/uploads/2021/02/Destination2050_Report.pdf.
Schill, S. R. (2013). Fulcrum Lands Phase 1 Defense grant for MSW-To-Jet Fuel Plant. Ethanol Prod. Mag. Available at: http://ethanolproducer.com/articles/9906/fulcrum-lands-phase-1-defense-grant-for-msw-to-jet-fuel-plant.
Schneider, B. S. (2021). Sustainable Skies Act. Washington D.C. House of Representatives. Available at: https://www.congress.gov/117/bills/hr3440/BILLS-117hr3440ih.pdf.
Skaggs, R. L., Coleman, A. M., Seiple, T. E., and Milbrandt, A. R. (2018). Waste-to-Energy Biofuel Production Potential for Selected Feedstocks in the Conterminous United States. Renew. Sust. Energ. Rev. 82, 2640–2651. doi:10.1016/j.rser.2017.09.107
Stratas Advisors (2020). Overcapacity Looms as More and More US Refiners Enter Renewable Diesel Market. Insight, 6. Available at: https://stratasadvisors.com/Insights/2020/06112020LCFS-RD-Investment (Accessed August 25, 2021).
Tanzil, A. H., Brandt, K., Wolcott, M., Zhang, X., and Garcia-Perez, M. (2021). Strategic Assessment of Sustainable Aviation Fuel Production Technologies: Yield Improvement and Cost Reduction Opportunities. Biomass and Bioenergy 145, 105942. doi:10.1016/j.biombioe.2020.105942
Tao, L., Tan, E. C. D., McCormick, R., Zhang, M., Aden, A., He, X., et al. (2014). Techno‐economic Analysis and Life‐cycle Assessment of Cellulosic Isobutanol and Comparison with Cellulosic Ethanol and N‐butanol. Biofuels, Bioprod. Bioref. 8, 30–48. doi:10.1002/bbb.1431
The White House (2021). FACT SHEET: Biden Administration Advances the Future of Sustainable Fuels in American Aviation. Statements and Releases. Available at: https://www.whitehouse.gov/briefing-room/statements-releases/2021/09/09/fact-sheet-biden-administration-advances-the-future-of-sustainable-fuels-in-american-aviation/ (Accessed December 3, 2021).
U.S. Department of Energy (2021a). Alternative Fuel Excise Tax Credit. Altern. Fuels Data Cent. Available at: https://afdc.energy.gov/laws/319 (Accessed October 14, 2021).
U.S. Department of Energy (2021b). Biodiesel Laws and Incentives. Altern. Fuels Data Cent. Available at: https://afdc.energy.gov/fuels/laws/BIOD?state=US (Accessed July 22, 2021).
Wang, Z. J., Staples, M. D., Tyner, W. E., Zhao, X., Malina, R., Olcay, H., et al. (2021). Quantitative Policy Analysis for Sustainable Aviation Fuel Production Technologies. Front. Energ. Res. 9, 10. doi:10.3389/fenrg.2021.751722
Wolff, C., Soubly, K., Delasalle, F., and Pinnel, L. (2020). Join Policy Proposal to Accelerate the Development of Sustainable Aviation Fuels in Europe. Geneva, Switzerland. Available at: https://www3.weforum.org/docs/WEF_CST_Policy_European_Commission_SAF_2020.pdf.
World Energy (2021). The Future of Aviation. Products. Available at: https://www.worldenergy.net/products/sustainable-aviation-fuel-saf/ (Accessed October 20, 2021).
Keywords: policy, sustainable aviation fuel, techno-economic analysis, hydroprocessed esters and fatty acids, alcohol to jet, Fischer–Tropsch
Citation: Brandt KL, Martinez-Valencia L and Wolcott MP (2022) Cumulative Impact of Federal and State Policy on Minimum Selling Price of Sustainable Aviation Fuel. Front. Energy Res. 10:828789. doi: 10.3389/fenrg.2022.828789
Received: 04 December 2021; Accepted: 31 January 2022;
Published: 10 March 2022.
Edited by:
Sgouris Sgouridis, Dubai Electricity and Water Authority, United Arab EmiratesReviewed by:
Christopher Michael Saffron, Michigan State University, United StatesArnaldo Walter, State University of Campinas, Brazil
Copyright © 2022 Brandt, Martinez-Valencia and Wolcott. This is an open-access article distributed under the terms of the Creative Commons Attribution License (CC BY). The use, distribution or reproduction in other forums is permitted, provided the original author(s) and the copyright owner(s) are credited and that the original publication in this journal is cited, in accordance with accepted academic practice. No use, distribution or reproduction is permitted which does not comply with these terms.
*Correspondence: Kristin L. Brandt, a3Jpc3Rpbi5icmFuZHRAd3N1LmVkdQ==