 Omid Karami
 Puneet Dwivedi
 Marshall Lamb3
 John L. Field
- 1Department of Agricultural Economics, Purdue University, West Lafayette, IN, United States
- 2Warnell School of Forestry and Natural Resources, University of Georgia, Athens, GA, United States
- 3National Peanut Research Laboratory, USDA Agricultural Research Services, Dawson, GA, United States
- 4Bioresource Science and Engineering Group, Environmental Sciences Division, Oak Ridge National Laboratory, Oak Ridge, TN, United States
In 2019, the aviation sector in the United States emitted 255 million metric tons of carbon dioxide (CO2) emissions, i.e., about five percent of the total domestic CO2 emissions from the energy sector. The sustainable aviation fuel (SAF) derived from carinata (Brassica carinata) could reduce CO2 emissions of the aviation sector in the United States. Therefore, it is important to estimate changes in farm economics with and without carinata for ascertaining its production feasibility. In this context, the current study first assesses a combination of 12 popular rotations of corn, cotton, peanut, and soybean with winter crops of winter wheat and carinata in South Georgia over 4 years. Then, the net present values (NPVs) of 292 feasible cropping systems over 4 years are calculated. Finally, this study develops a risk model for ascertaining the probability distributions of NPVs for selected cropping systems subject to uncertainties related to prices and yields of summer and winter crops. Carinata in the corn-corn-soybean rotation has the highest NPV ($2,996/ha). The least risky rotation is cotton-cotton-peanut, with a 58.9% probability of a positive NPV. Carinata can decrease the risk level of crop rotations by 8.1%, only if a contract price of $440.9/t is offered. Therefore, a risk averse, risk neutral, or risk acceptant farmer can potentially include carinata in the rotation. Overall, carinata would increase the profitability of farm operations and decrease risk in the SE United States, and therefore, a high likelihood exists, that farmers would adopt it for meeting the growing demand for SAF in the United States.
Introduction
In 2019, the global aviation industry emitted 785 million metric tons of carbon dioxide (CO2), i.e., about 2% of all human-induced CO2 emissions (Graver et al., 2020). In the United States, CO2 emitted by the aviation sector (international and domestic flights) in the same year was 255 million metric tons, i.e., almost 5% of total energy-related CO2 emissions (EIA, 2019). A comparison of CO2 emissions across national and international levels suggests that the United States emits almost 23% of the global aviation-related CO2 emissions (Graver et al., 2020). This high contribution could be ascribed to the total conventional aviation fuel consumed across domestic and international flights countrywide. The consumption of conventional aviation fuel in the United States rose from 63.86 billion liters to 69.16 billion liters between 2003 and 2019. This increase in conventional aviation fuel consumption could be easily related to a surge in demand for air travel in the United States, as available seat-miles for domestic and international flights increased by 30.2 and 100.0% for domestic and international flights between 2003 and 2019, respectively (U.S. Department of Transportation, 2019).
The aviation industry adopted a set of ambitious targets in 2008 to reduce its carbon footprint, including 1) an average annual improvement in fuel efficiency of 1.5% between 2009 and 2020; 2) a cap on net aviation carbon emissions from 2020 (carbon-neutral growth); and 3) a reduction in net aviation carbon emissions of 50% by 2050, relative to 2005 levels (European Aviation Safety Agency, 2016). In addition, the aviation industry has implemented a four-pillar policy to accomplish CO2 reduction goals, including but not limited to technology development, operational efficiencies, infrastructure improvements, and market-based economic measures.
Sustainable Aviation Fuel (SAF) development is vital for meeting the aviation sector’s carbon reduction goal. Existing studies suggest that the use of SAF can mitigate up to 80% of CO2 emissions (IATA, 2020). Cox et al. (2014) concluded that using microalgae, Pongamia pinnata, and sugarcane molasses as feedstocks for SAF production could save between 43 and 50% GHG emissions. Tanzil et al. (2021) found that the SAF derived from corn ethanol can mitigate GHG emissions ranging from 13 to 93% across different scenarios. Many other studies, such as Hayward et al. (2015), McGrath et al. (2017), Michailos (2018), and Capaz et al. (2021), also report that there are significant carbon benefits related to the production of SAF from biomass-based feedstocks. On the other hand, several studies exploring the production cost of biomass-based SAF throughout the supply chain have found that the production cost of SAF is higher than conventional aviation fuel. Perkis and Tyner (2018) concluded that SAF supply chain production costs vary between $0.84/L to $0.97/L. Huang et al. (2019) found that the SAF production cost can be as low as $0.74/L but still it will be about 47% higher than conventional aviation fuel. Reimer and Zheng (2017) suggested that a 17% subsidy on SAF, a 20% tax on the conventional aviation fuel, or a combination 9% subsidy on SAF and 9% tax on the conventional aviation fuel are needed for supporting SAF production.
The majority of the existing studies assume that SAF production would start once economic incentives are in place. This assumption may not be valid as risk plays a crucial role in determining the overall economic feasibility of SAF production. Only a handful of studies have incorporated risks into their economic analysis for SAF production. Richardson et al. (2014) addressed price- and technology-related risks for bio-crude oil production from two projected algae farms. They found that neither cultivation system offers a reasonable probability of economic success with current prices and technology. Chu et al. (2017) assessed the financial risk analysis of SAF production from camelina, carinata, and used cooking oil. They found that probabilities of having a positive net present value (NPV) are 29, 18, and 8% for the SAF produced using camelina, carinata, and used cooking oil, respectively. Hansen et al. (2019) analyzed cost and risk in herbaceous feedstock supply chains in Virginia and Iowa. After accounting for risks, they found that the logistics cost for switchgrass and corn stover could range between $50/t and $74/t, respectively. Mamun et al. (2020) found that an approach where deposts are distributed over space may reduce the operational and market risks by 17.5 and 5%, respectively, for a cellulosic biorefinery located in the Great Plains of the United States.
Existing studies typically assume that farmers will immediately adopt a bioenergy crop. However, the adoption decision is complicated and is affected by several factors. Bocquého and Jacquet (2010) analyzed the effect of farmers’ liquidity constraints and risk preferences in central France. They found that switchgrass and miscanthus make farms less profitable in terms of an annualized net margin than the usual rape/wheat/barley rotation. They also found that switchgrass and miscanthus can be highly competitive as diversification crops when appropriate contracts are offered to farmers, despite the additional liquidity they require. Clancy et al. (2012) used a stochastic budgeting model and reported that miscanthus is a less risky option than willow at Irish farms. Alexander and Moran (2013) developed a farm-level mathematical programing model and found that miscanthus was the best option for risk-averse farmers between all perennial energy crops in the United Kingdom. They also found that the inclusion of risk reduced the energy crop prices required to adopt these crops. Skevas et al. (2016) developed an economic model with stochastic prices and yields. They found that perennial bioenergy crops have a higher potential to successfully compete with corn under marginal crop production conditions in Florida. Hauk et al. (2017) reported that the inclusion of Short Rotation Woody Crops (SRWCs) at the farm level had the lowest economic risk between all crops. They also found that there is a correlation between the gross margins of SRWC and other crops. Spiegel et al. (2018) found that a guaranteed biomass price can stimulate farmers to adopt a short rotation coppice in Germany.
Another factor affecting farmers’ adoption decisions is the suitability of a bioenergy crop in existing crop rotation systems. Styles et al. (2008) compared the economic performances of conventional agricultural systems with the cases having willow or miscanthus in the crop rotation in Ireland. Faasch and Patenaude (2012) examined the profitability of existing crop rotations with and without short rotation coppice in Germany. They found that without any subsidies, the short rotation coppice made less profit than the conventional crops. Moore et al. (2020) suggested that bioenergy crops can diversify corn-soybean rotation in the Midwestern United States and has the potential to clean water and protect the soil.
A review of current studies shows that the use of SAF could save significant carbon emissions, suitable economic incentives are needed for encouraging the production of biomass-based SAF, there are inherent risks involved in the production of biomass-based SAF, and most importantly, the production of bioenergy crops could alter the farm economics. Most of the studies focusing on farm-level economics with and without bioenergy crops focus on perennial cellulosic bioenergy feedstocks. Thus, there is a gap in the literature on understanding the farm-level economics of those potential bioenergy crops that could be grown in the winter months. This study addresses the gap by developing a farm-level risk analysis model by incorporating carinata into existing crop rotations in South Georgia in the SE United States. Accordingly, the first objective determines the possible crop rotations with and without winter crops (winter wheat and carinata). The second objective ascertains the profitability of farm operations for identified crop rotations in the first objective. The third objective determines the inherent risks related to the profitability of crop rotations subject to uncertainties related to prices and yields of selected summer and winter crops. This study will better situate the use of carinata-based SAF production in the Southern United States for achieving policy goals of mitigating climate change, developing rural economies, and supporting bio-economy development. This is especially true as the thirteen southern states together consume about 35% of the overall conventional aviation fuel consumed in the United States (Dwivedi, 2021).
Materials and Methods
Carinata
The oil obtained from the seeds of Brassica carinata, also known as Ethiopian mustard, could be refined to produce SAF. The use of carinata for producing SAF provides several advantages relative to other potential crops. First, it is not fit for human consumption due to the high content of erucic acid, and therefore, it avoids any fuel versus food issues (Seepaul et al., 2019). Second, it is an off-season crop and does not interfere with the main crops such as corn, thereby providing additional income to farmers. Third, it reduces soil erosion, builds soil carbon, and reduces instances of nematodes (Seepaul et al., 2019). Moreover, carinata has high protein content and low fiber content. It makes it possible for carinata meal, which is left over after extracting oil from the seed, to be a good source for animal feed (Iboyi et al., 2021), such as poultry (Yadav et al., 2022) and beef (Schulmeister et al., 2019). Alam and Dwivedi (2019) found that up to 1.2 million hectares of land are available for growing carinata across Georgia, Florida, and Alabama, which could potentially produce up to two billion liters of SAF, sufficient enough to replace 2.3% of the total conventional aviation fuel consumed in the United States. Recently, Alam et al. (2021) found that the use of carinata-based SAF could save up to 68% of CO2 emissions in the Southern United States and the cost of the produced SAF could potentially compete with the price of conventional aviation fuel in the presence of existing financial support.
Study Area
The state of Georgia was selected as a case study for this study for several reasons. Agriculture is an important sector of the state’s economy. In 2019, the agricultural sector cash receipt was $8.4 billion in Georgia, making it the 16th state in overall agricultural cash receipts (U.S. Department of Agriculture, 2020). The state holds the top position in broilers and peanuts production nationwide with cash receipts of $4.03 billion and $556 million, respectively (U.S. Department of Agriculture, 2020). The state is second among all the states in cash receipts ranking for cotton lint and seed, chicken eggs, and pecans (U.S. Department of Agriculture, 2020). Figure 1 illustrates the agricultural land present in each county of the state. The majority of agricultural land in the state is located in the southern part of the state, as a result, we specifically focused on South Georgia in this study (NASS, 2020). In 2019, about 755 thousand hectares of the land across selected counties were devoted to corn, cotton, and peanuts, which amounted to 98.5% of the total croplands in South Georgia and 56.4% of total cropland in the state (NASS 2020).
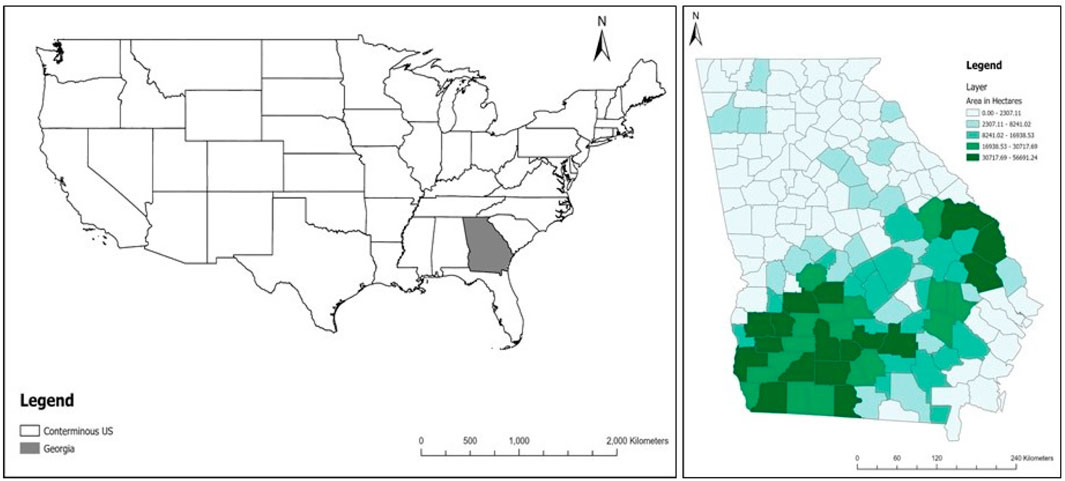
FIGURE 1. Countywise distribution of agricultural land in Georgia (NASS, 2020).
Possible Crop Rotations (With/Without Carinata)
Since it is an annual plant, the carinata production process could be rotated with the other crops. This study considered rotations of cotton-cotton-peanut, cotton-cotton-corn-peanut, corn-corn-peanut, cotton-cotton-cotton-peanut, corn-corn-corn-peanut, and cotton-corn-peanut—the most popular crops in South Georgia (Bullock, 1992). A 4 year timeline can have 972 rotations by choosing either fallow or winter crops of either winter wheat or carinata. However, there are three primary constraints when it comes to carinata production. First, growing carinata after peanut is currently not recommended due to residual herbicide effects (Seepaul et al., 2019). Second, there should be at least a gap of 2 years between two successive carinata crops (Seepaul et al., 2019). Finally, carinata and wheat are harvested in late May/early June, resulting in a situation where one cannot grow corn after carinata or wheat. Taking all the constraints together, the feasible crop rotations were 292, i.e., crop rotations with only winter fallow (#12), crop rotations with carinata and winter fallow only (#35), crop rotations with winter wheat and winter fallow only (#100), and crop rotations with winter carinata and winter wheat only (#145). Regarding the constraints related to the other crops, there is the main concern related to summer crops: continuous corn and continuous cotton make yield penalties of 10 and 15%, respectively (Salassi et al., 2013). Therefore, this study considered a yield penalty for continuous corn and cotton. Table 1 presents the timeline of each crop to ascertain crop planting and harvesting schedules.
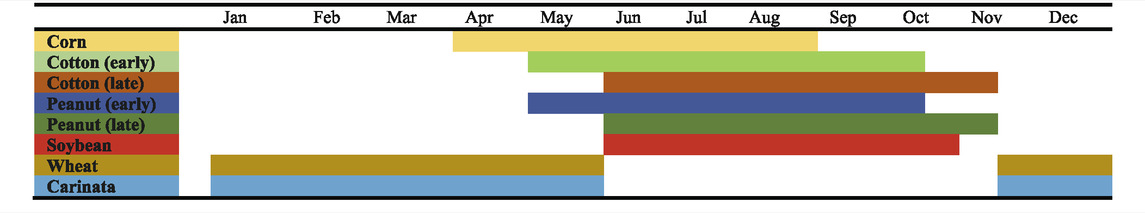
TABLE 1. Crop planting windows in South Georgia.
Carinata Yield Simulation
Carinata yield was simulated with a process-based agro-ecosystem model, as described in Field et al. (2022). The DayCent model (Parton et al., 1998) was calibrated using data on aboveground biomass, root biomass, and tissue carbon:nitrogen ratios for carinata grown at the University of Florida North Florida Research and Education Center in Quincy, Florida for one season (winter 2015–2016) at four different nitrogen (N) fertilizer application rates (Seepaul et al., 2019). The resulting model was validated against data collected during subsequent field trials at Quincy as well as the University of Florida West Florida Research and Education Center in Jay, Florida (Bashyal et al., 2021; Boote et al., 2021), and five private farms across southern Georgia collected between 2016 and 2019. In this independent validation, DayCent reproduced 34% of the observed variability in carinata seed yield across sites and years, with a normalized root mean square error of 0.26 (Field et al., 2022).
Carinata was simulated across 95 counties in South Georgia with a milder climate where the risk of carinata crop failure from frost is minimized per Alam and Dwivedi (2019). Data inputs and methods for high-resolution DayCent simulation were modified from those described previously in the context of simulations of other dedicated bioenergy crops (Field et al., 2018). Those prior methods were updated such that carinata production was simulated on all cultivated annual cropland per the 2016 National Land Cover Database (Homer et al., 2020), and to use historical weather data from the Parameter-elevation Regressions on Independent Slopes Model (PRISM; PRISM Climate Group, 2015), which results in low-bias DayCent yield simulations (Zhang et al., 2019). The DayCent simulations assumed that carinata is grown as a winter cover crop between the two cotton cash crops of a 3 year cotton–cotton–peanut rotation, with moderate-intensity field preparation and planting in mid-November, fertilizer application at an annual rate of 90 kg N/ha, plant physiological maturity in early May, and seed harvest in late May. The model was initialized to reflect historic cropping patterns in the region, and the carinata-containing rotation was simulated 30 years into the future, from 2020 to 2050. DayCent simulations were set up to loop through the PRISM dataset of daily weather data over the years 1981–2018 to represent weather variability during both the model initializtion period and for simulations of the future period (e.g., simulation year 2018 used 2018 PRISM data, but simulation year 2019 reused 1981 PRISM data, simulation year 2020 reused 1982 PRISM dat, etc.). DayCent simulation output was then post-processed for area-weighted aggregation of simulated yields and environmental impacts to the county scale.
Farm-Level Economics
The production cost data for all summer crops and winter wheat are from the University of Georgia Cooperative Extension (2019). In addition, the production cost data related to carinata are from the Whole Farm report by the National Peanut Research Laboratory (2020). This study only considered the variable costs for all crops because farmers cannot change fixed costs in the short term. Since carinata is a new crop in the region, there are no historical data of yields and prices. Therefore, there are two scenarios for carinata prices in this study. Scenario 1 (S1) uses a price of $440.9/t for carinata seeds based on the original contracted price by Agrisoma Biosciences in the study area. Scenario 2 (S2) uses a price of $320/t for carinata seed based on the average canola price between 2014 and 2019 in the study area (NASS, 2020). For carinata yield, this study uses the average yield across different counties in Georgia obtained from DayCent modeling. For all other crops, except carinata, the historical price and yield data from 1988 to 2019 are from the National Agricultural Statistics Services database (NASS, 2020).
All production costs and incomes for a hectare of farmland for carinata, corn, cotton, peanut, soybean, and wheat are in Supplementary Materials (Supplementary Tables S1–S6). The table gives information about breakeven yields and prices also for all crops. According to Supplementary Table S1, the breakeven price for carinata is $311.1/t. The price is lower than the prices in both scenarios ($440.9/t and $320/t). The breakeven yields for S1 and S2 are 2,007.7 kg/ha and 2,766.3 kg/ha, respectively.
There is a 4 year timeline examining winter crops of winter wheat and carinata for all 12 rotations of cotton-cotton-peanut, cotton-cotton-corn-peanut, corn-corn-peanut, cotton-cotton-cotton-peanut, corn-corn-corn-peanut, cotton-corn-peanut, cotton-cotton-soybean, cotton-cotton-corn-soybean, corn-corn-soybean, cotton-cotton-cotton-soybean, corn-corn-corn-soybean, and cotton-corn-soybean. NPV is a standard criterion to assess economic decisions. It can be calculated by the current value of Annual Cash Flow in different years (ACFt), which means adjusting ACFt by discount rate rd over the timeline of T (Zore et al., 2018):
In the case of crop rotation, both cash flow of summer and winter crops should be in NPV calculation:
In which SCFt and WCFt are summer and winter crops cash flows, respectively. Here the inflation and interest rates are 2 and 6% respectively; both are the average of the past 30 years (U.S. Department of Labor, 2019).
Financial Risk Analysis and Sensitivity Analysis
The study of risk analysis in financial investment projects is possible by using the stochastic Monte Carlo method (Simões et al., 2016). This study uses @Risk 8.1 (Copyright © 2020 Palisade Corporation) for risk analysis. The input variables of the stochastic simulation model are the crop incomes which in turn are dependent upon stochastic crop prices ($/kg) and yields (kg/ha). The former represents the market risks, and the latter represents the stochasticity related to technology and the weather. Instead of using random numbers to fit the distribution functions, the historical data between 1988 and 2019 for both price and yield data of corn, cotton, peanut, soybean, and winter wheat were used. As mentioned before, this study used high-resolution DayCent simulation to estimate carinata yield across Georgia’s counties. Both S1 ($440.9/t) and S2 ($320/t) scenarios considered canola price distribution as a proxy for carinata prices due to the lack of historical data. To analyze the impact of a fixed contract price from Agrisoma Biosciences on the economic risk, this study considers another scenario. In the third scenario (S3), the price is equal to the S1 price ($440.9/t), however, there is a fixed price distribution. NPV was used as the output when the variables change according to the historical data distributions. Table 2 gives the information about the price and yield status, both for risk analysis and NPV calculations.
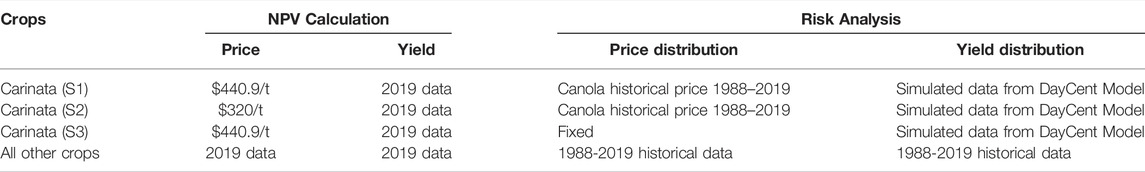
TABLE 2. Price and yield status in NPV calculations and risk analysis for carinata scenarios and all other crops.
Results
Profitability of Carinata and Other Crops
Figure 2 shows the annual profitability of selected crops in South Georgia on a per-unit area basis. Corn has the highest profit of $706.2/ha, whereas carinata under S2 with $25.2/ha has the lowest profit. Soybean produces lower income ($1,327/ha) than the other crops, but relatively costs were lower ($707.5/acre). This led to a situation where the profitability of soybean was even higher than cotton and peanut in this study. Profitability related to the carinata (S1 and S3) was $369.3/ha, which in turn was higher than the profitability related to winter wheat in South Georgia. Soybean and corn have the highest profit in this study, still, they are not major crops in Georgia (Lee, 2019; Bryant, 2021). Georgia soybean acreage decreased from 325,000 in 2015 to a low of 100,000 acres planted in the last 2 years (Bryant, 2021). The cause for this decline is the decrease in the profitability of soybeans. Many Georgia peanut growers shifted to non-soybean rotations when prices declined below $0.37/kg (Bryant, 2021). In the same period, cotton and peanut prices have not changed dramatically (NASS, 2020). They hovered around $1.44/kg and $46/kg for cotton and peanut, respectively (NASS, 2020).
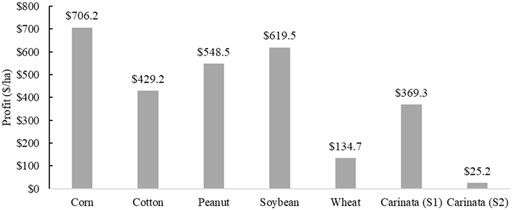
FIGURE 2. Profitability of selected crops on per unit area basis in South Georgia. For Scenario 1 (S1) and Scenario 3 (S3), carinata price is $440.9/t. In Scenario 2 (S2), carinata price is $320/t.
Potential Profitability
Table 3 presents the top 20 rotations with the highest NPVs when carinata prices are higher (S1 and S3). The majority of the top 20 rotations (17 out of 20) are with carinata. Corn-fallow-corn-carinata-soybean-fallow-corn-wheat with an NPV of $2,996/ha is the most profitable. Few rotations with either cotton or peanut are among rotations with the highest NPV because of the higher profit of corn and soybean. It means carinata does better in rotation with corn and soybean in the context of higher profits. Considering all 292 rotations and comparing the rotations with and without carinata, the energy crop could increase 4-year rotation NPV by $259.6/ha on average. Table 4 reports the top 20 rotations with the highest NPVs when carinata prices are lower (S2). Corn-fallow-corn-wheat-soybean-fallow-corn-wheat has the highest NPV with $2,838.2/ha. However, the carinata has a lower profit in S2 ($369.3/ha versus $25.2/ha); there are still eight rotations with carinata among the top 20 crop rotations. The difference between the rotations with and without carinata is -$90.7/ha for the S2 because carinata rotations have a lower NPV compared to the others.
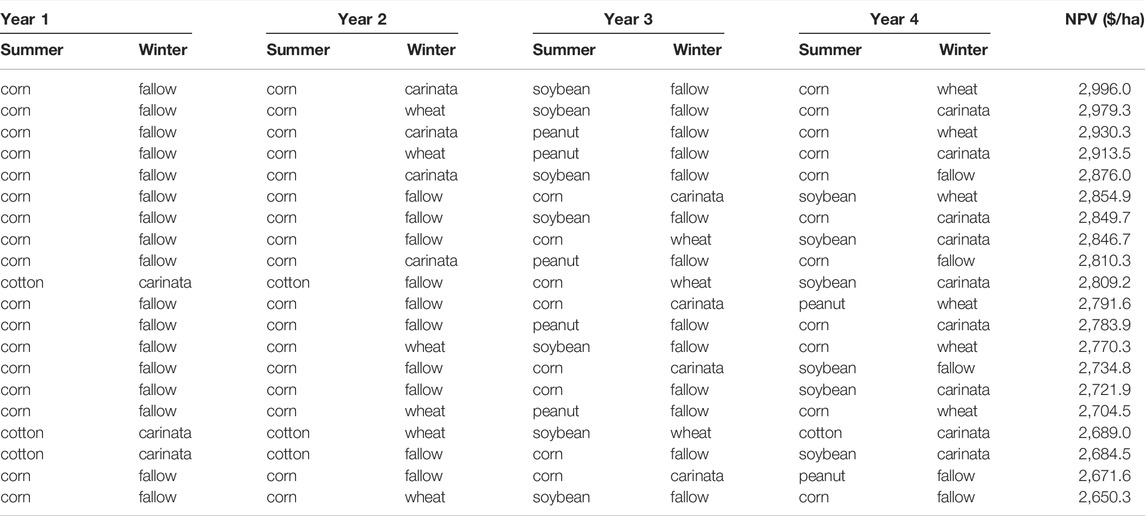
TABLE 3. Top 20 crop rotations with the highest NPV under S1 and S3 when carinata prices are higher.
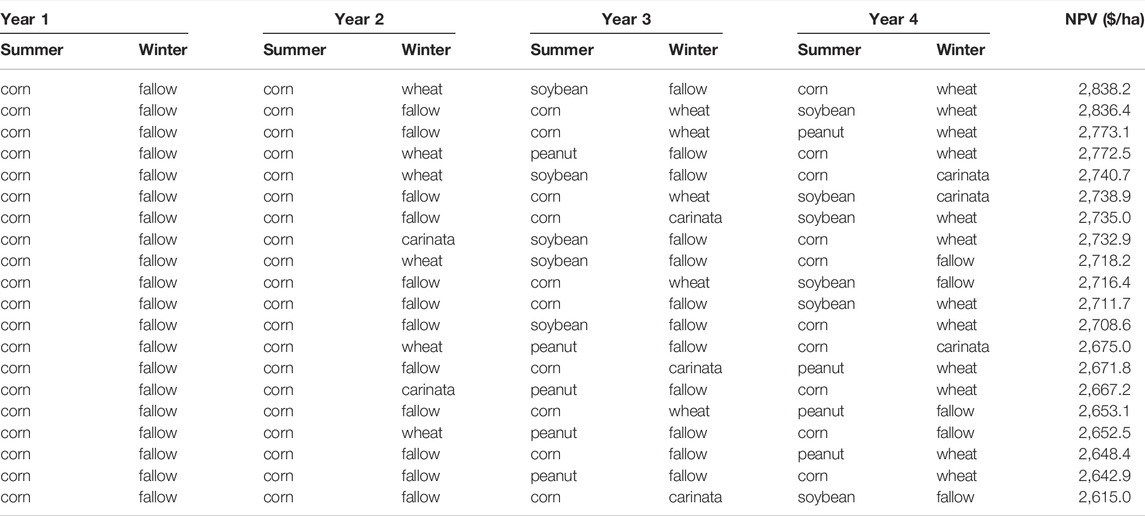
TABLE 4. Top 20 crop rotations with the highest NPV under S2 when carinata prices are lower.
Risk Assessment
The risk sources are crop price and yield variations. Figures 3, 4 illustrate price and yield variations for different crops, respectively. The yield and price data for corn, cotton, peanut, soybean, and wheat are from 1988 to 2019. Cotton has the highest price variations (Figure 3). It also has one of the lowest yield variations (Figure 4). Figure 4 also indicates that corn has the highest yield variations. Carinata has a lower yield variation (Figure 4) than price variation under S1 and S2 (Figure 3). Both yield and price variations are low for the other winter crop of wheat (Figures 3, 4).
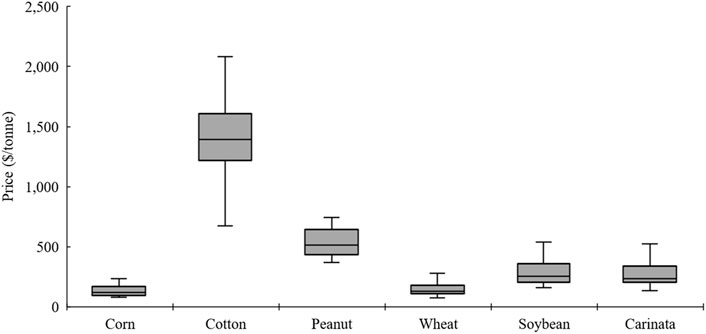
FIGURE 3. Price variability for different crops in South Georgia between 1988 and 2019 (carinata under S1 and S2).
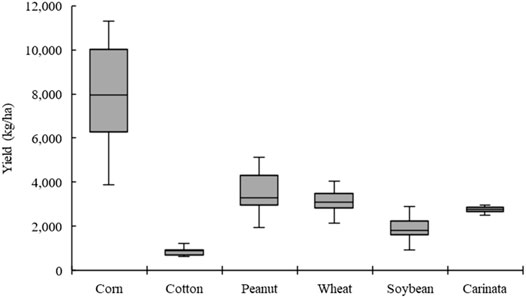
FIGURE 4. Yield variability for different crops in South Georgia between 1988 and 2019. For carainata, simulated spatial yield variability across counties is used as a proxy for temporal variability.
Following Anderson (2008), this study fitted suitable distribution forms to the price and yield data for undertaking the risk analysis (Table 5). Akaike Information Criterion (AIC) was used for selecting appropriate distribution forms across all the possible distribution forms for each series of price and yield for each crop. Using the Monte Carlo simulation method with 1,000 iterations, the current study simulated NPVs of all 292 rotations. Figures 5–7 show the relative distribution and cumulative frequency of simulated NPV for the top six rotations of S1, S2, and S3, which have the highest probability for a positive NPV. In S1, cotton-fallow-cotton-fallow-peanut-fallow-cotton-fallow is the rotation with the lowest risk with a positive NPV of 34.0% (Table 6). The same rotation is the least risky rotation in the S2, and the possibility of a positive NPV is 34.1% (Table 7). The situation is better for the third scenario due to the lower risk price for carinata. In S3, cotton-carinata-cotton-fallow-peanut-fallow-cotton-carinata with the possibility of positive NPV of 58.9% is the lowest risky rotation (Table 8).
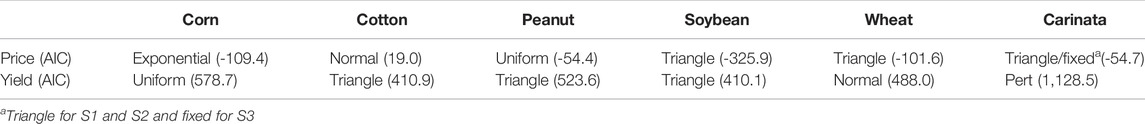
TABLE 5. Fitted distribution forms for the price and yield of different crops.
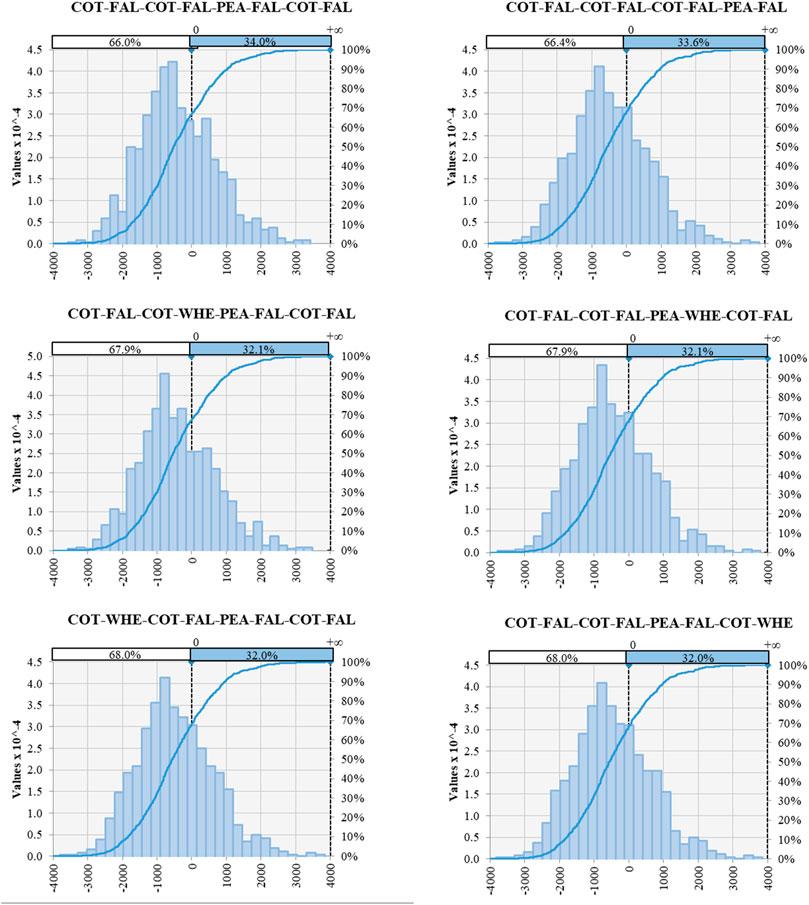
FIGURE 5. Relative distribution and cumulative frequency of top-six rotations under S1 with the highest chance of positive NPVs.
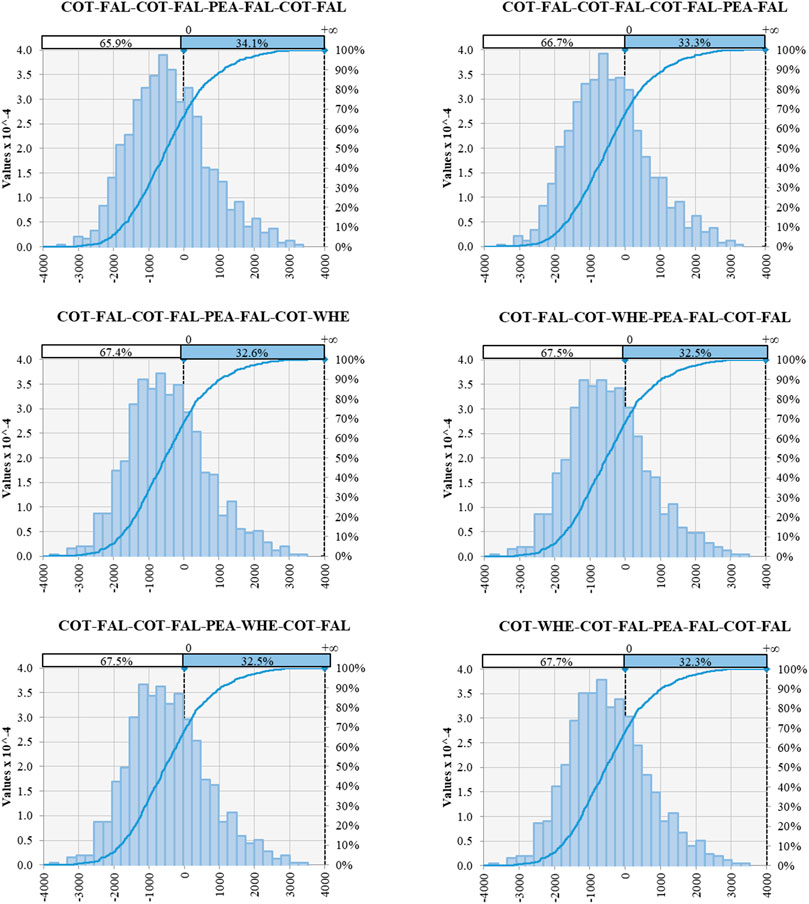
FIGURE 6. Relative distribution and cumulative frequency of top-six rotations under S2 with the highest chance of positive NPVs.
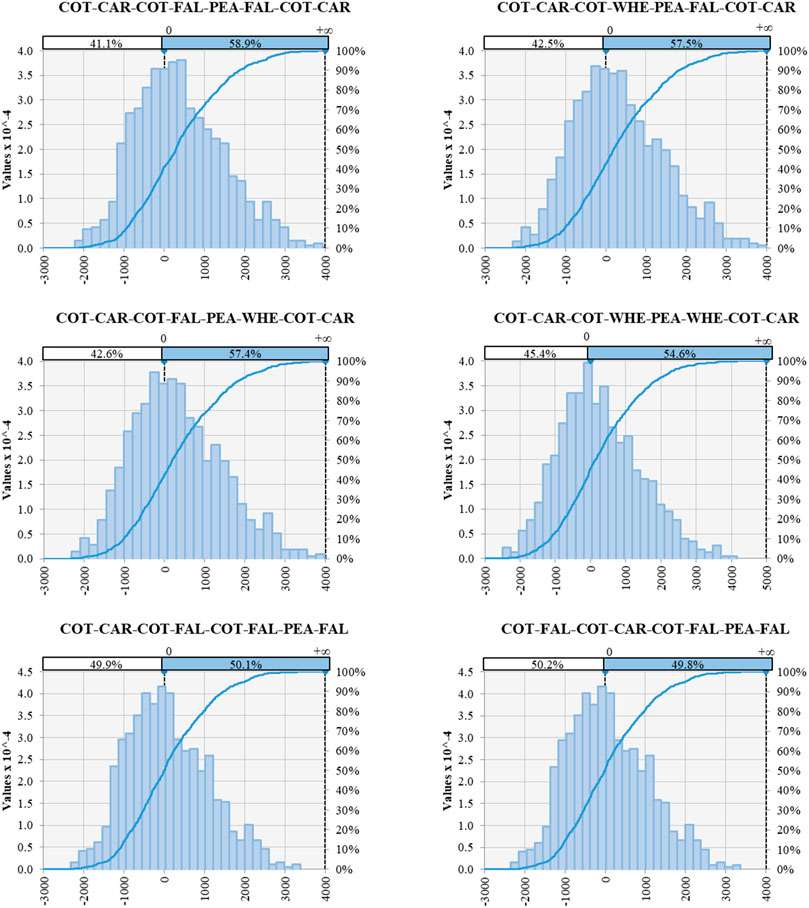
FIGURE 7. Relative distribution and cumulative frequency of top-six rotations under S3 with the highest chance of positive NPVs.
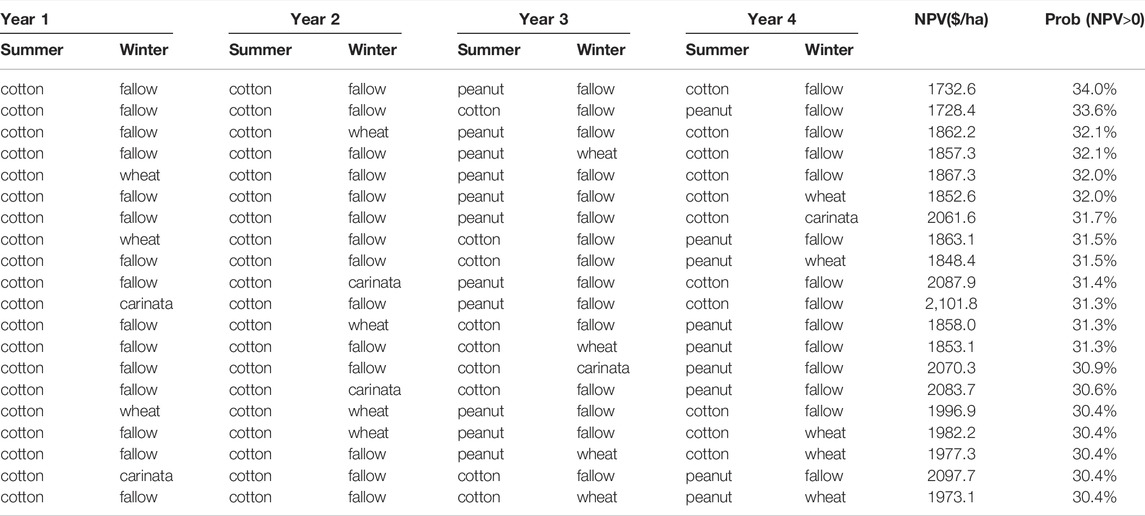
TABLE 6. Top 20 rotations under S1 with the highest probability of positive NPV.
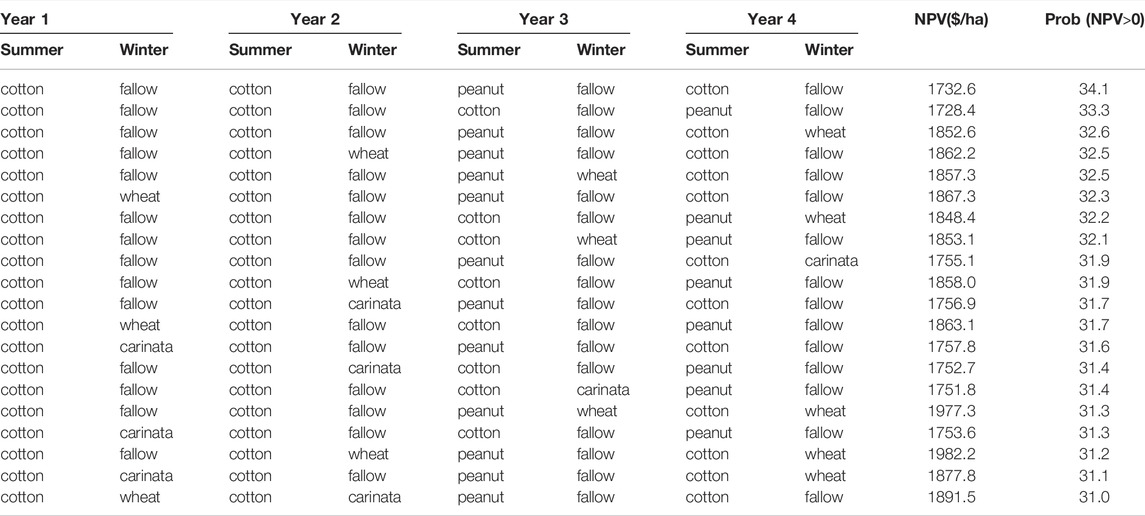
TABLE 7. Top 20 rotations under S2 with the highest probability of positive NPV.
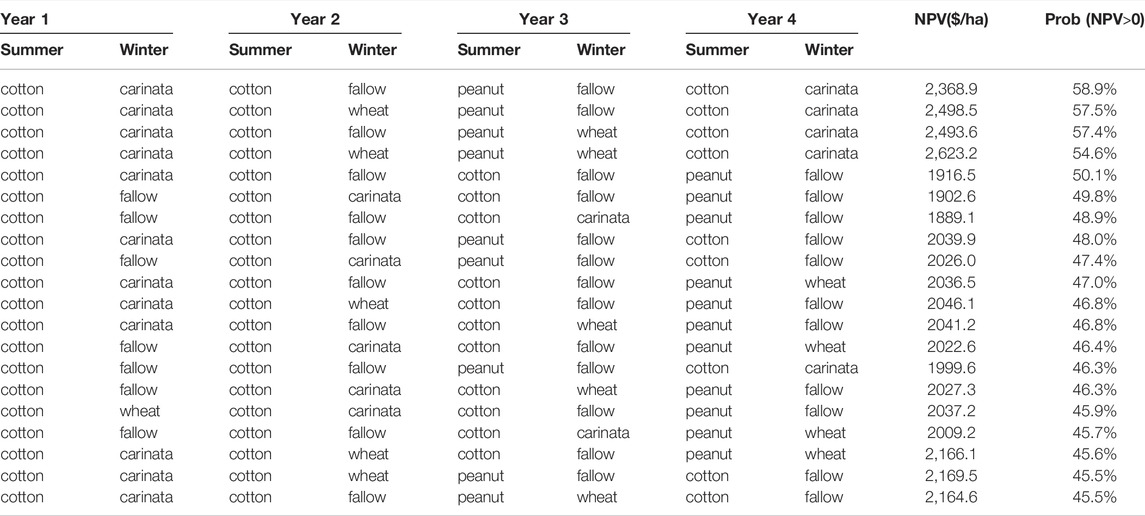
TABLE 8. Top 20 rotations under S3 with the highest probability of positive NPV.
Sensitivity Analysis
To see how changes in interest rate can make an impact on the results, a sensitivity analysis was conducted by changing the interest rate from 6 to 2% and 12%. The lower interest rate is as low as the inflation rate and the higher is the double the amount of the initial interest rate. Other interest rates were also tested but the results were not different extremely. The results indicate that the ranking of the rotations according to their NPV does not change since the interest rate changes NPV across all crop rotations with the same ratio. However, it may change the difference between NPVs and the possibility of positive NPV (or risk) across crop rotations (Figures 8, 9). The sensitivity analysis shows that the difference in the possibility of positive NPV between the rotations with and without carinata does not change much (Figure 9). For the 2% interest rate in S1, the risk difference between the rotations with and without carinata is -0.79%, and it rises to 0.25% for the 12% interest rate. The pattern is similar to S3. However, the risk difference between the rotations with and without carinata is higher. For a 6% interest rate, there is an 8.1% risk difference between the rotations with and without carinata. For S2, the difference between the possibility of positive NPV will be decreased while the interest rate increases. It shows that the risk difference tends to zero in higher interest rates.
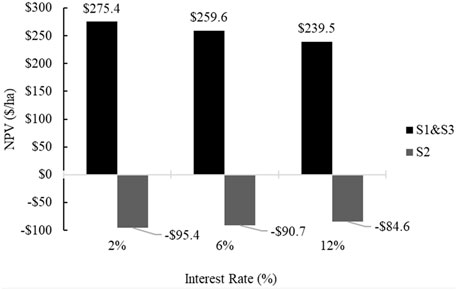
FIGURE 8. The effect of an interest rate change on NPV difference of crop rotations with and without carinata.
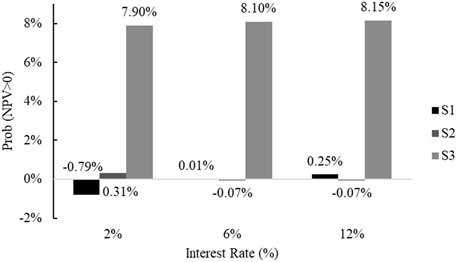
FIGURE 9. The effect of an interest rate change on the possibility of positive NPV difference of crop rotations with and without carinata.
Discussion and Conclusion
The challenge of meeting increasing energy demands in the aviation sector and related policies to climate change have made governmental support possible for renewable energy sources. These development policies may motivate farmers to grow energy crops, which are risky due to unpredictable yields and prices. Therefore, it is essential to know the effects of a new bioenergy crop on farmers’ risk and profit.
This study implemented a Monte Carlo simulation and historical data distribution of both yields and prices of corn, cotton, peanut, soybean, and winter wheat to assess the effects of market and production risks on the profitability of farms operations in a 4-year timeline. Considering the most popular rotations in South Georgia, this study examined whether the carinata fits in current rotations or not. The lowest risk in crop rotation exists when there is a contract price over a four period. When there is a fixed contract price, cotton-carinata-cotton-fallow-peanut-fallow-cotton-carinata rotation has the lowest risk with the possibility of positive rotation of 58.9%.
If we consider a price risk for carinata, the energy crop in the second year and wheat in the fourth year of corn-corn-soybean can make the highest NPV across all possible rotations. This case only happens in the scenario where a $440.9/t price is offered for carinata under S1. However, in the case of using canola price as a proxy for carinata price, it is corn-fallow-corn-wheat-soybean-fallow-corn-wheat that makes the highest profit. Regarding the risk analysis, carinata does not change the risk levels on average.
Only a few studies have found that energy crops can be profitable without any subsidy. Faasch and Patenaude (2012) concluded that SRECs are less profitable than conventional crops, and it is not economically feasible to have them in the rotation without any subsidy. In a comparable study, Spiegel et al. (2018) suggested a floor price policy to make it possible to have a short rotation coppice as an energy crop. To make the highest profit from energy crops, not only support from the government is needed, but also the farmers should choose efficient farming systems. Acuña et al. (2018), in a related study, proved that SRECs are not profitable when productivities are less than 351 m3/ha of green biomass. However, Styles et al. (2008) have comparable results to the third scenario of this investigation. They also showed that a fixed contract price can help to make the production of biomass feasible. They found that energy crops like miscanthus and willow make more profitable rotations compared to conventional agricultural systems. From the perspective of risk analysis, not many studies exist in the context of energy crops. Zafeiriou and Karelakis (2016), as an example, focused on the energy crop of rapeseed and could not obtain any clear picture related to the income volatility of the crop. However, (Chu et al., 2017), estimated the financial risk of SAF production from camelina, carinata, and cooking oil as the possibility of having positive NPVs of 29, 18, and 8%, sequentially.
Since carinata is a crop that makes the farms in South Georgia more profitable and less risky under a fixed contract price increasing extension efforts could help in promoting the adoption of carinata in the region. Farmers should know about the benefits of the crop to make better-informed decisions about their crop rotation. They should know that carinata in rotation with corn-corn-soybean has the highest profit; however, it makes the lowest risk in cotton-cotton-peanut rotation. It is also recommended to consider the interactions of the energy crops with conventional crops. Peanut can decrease the carinata yield if we sow carinata after peanut. However, if we sow carinata before peanut, it can decrease the risk on average. One-year NPV of an energy crop cannot be a reasonable criterion to decide about the benefits of the energy crop. The crop rotation in several years should be assessed, and then it will be possible to have a better picture of energy crops’ impacts on the overall profitability of farm operations. Crop rotation gives a realistic idea about the impacts of an energy crop on farmers’ profit.
This study used the price and yield of carinata in 2019, which were enough for estimating NPV, but did not provide enough data for the simulation. Therefore, the current study used the distribution of carinata yields across counties in South Georgia instead of one county over years. This study used three scenarios for carinata prices. The first and second scenarios (S1 and S2) used canola price distribution as a proxy for carinata price distribution. The assumptions made the study possible; however, the main limitation of the research is the lack of historical yield and price data for carinata as an energy crop.
Another limitation of this study is the lack of a long-term carinata yield dataset. The process-based DayCent model was used to predict variability in yields as a function of climate and soil quality across the study area. The model simulates daily plant growth as a function of air temperature and soil moisture state. While the rate of plant growth is reduced to zero on cold days, the current version of DayCent is unable to represent tissue mortality or crop failures due to frost in photoperiod-sensitive crops like carinata. Developmental versions of DayCent include a more detailed representation of crop phenology and senescence and are capable of capturing frost damage (Zhang et al., 2018; Zhang et al., 2020). Until this model version is more widely implemented or more expansive carinata field data becomes available, we have no rigorous quantitative basis to explore the impact of frost risk that could affect the economics of carinata production. However, we note that this risk is minimized in our assessment by the virtue of the selected study area (Alam & Dwivedi, 2019) and ongoing efforts to breed more frost-tolerant carinata varieties (Mulvaney et al., 2018; Seepaul et al., 2019; George et al., 2021).
This study analyzed the farm-level risk of carinata. Since the crop is used as an input for SAF production, the financial risk of the whole supply chain can be a subject for future investigations. The results suggest that carinata-based SAF production could increase profitability and decrease the risk of farm operations in the SE United States under a fixed supported contract price. Therefore, carinata should be promoted as an alternate winter crop. However, the adoption will still be challenging in the absence of demand for SAF production (e.g., the establishment of an actual SAF production facility) at the regional level.
Data Availability Statement
The original contributions presented in the study are included in the article/Supplementary Material, and further inquiries can be directed to the corresponding author.
Author Contributions
Conceptualization: OK, PD; Methodology: OK, PD; Data Assembly: OK, PD, ML, JF; Simulations: OK; Formal Analysis: OK, PD; Original Draft: OK; Final Draft: OK, PD; Virtualizations: OK, PD; Supervision: PD.
Funding
This material is based upon work supported by the National Institute of Food and Agriculture, United States Department of Agriculture, under award number 2017–68005-26807.
Conflict of Interest
The authors declare that the research was conducted in the absence of any commercial or financial relationships that could be construed as a potential conflict of interest.
Publisher’s Note
All claims expressed in this article are solely those of the authors and do not necessarily represent those of their affiliated organizations, or those of the publisher, the editors, and the reviewers. Any product that may be evaluated in this article, or any claim that may be made by its manufacturer, is not guaranteed or endorsed by the publisher.
Acknowledgments
The authors are thankful to Drs. Seepaul, George, and Wright for providing data on carinata yield and management from research plots located at Quincy, Florida.
Supplementary Material
The Supplementary Material for this article can be found online at: https://www.frontiersin.org/articles/10.3389/fenrg.2022.830227/full#supplementary-material
References
Acuña, E., Rubilar, R., Cancino, J., Albaugh, T. J., and Maier, C. A. (2018). Economic Assessment of Eucalyptus Globulus Short Rotation Energy Crops under Contrasting Silvicultural Intensities on Marginal Agricultural Land. Land Use Policy 76 (April), 329–337. doi:10.1016/j.landusepol.2018.05.028
Alam, A., and Dwivedi, P. (2019). Modeling Site Suitability and Production Potential of Carinata-Based Sustainable Jet Fuel in the Southeastern United States. J. Clean. Prod. 239, 117817. doi:10.1016/j.jclepro.2019.117817
Alam, A., Masum, M. F. H., and Dwivedi, P. (2021). Break‐even price and Carbon Emissions of Carinata‐based Sustainable Aviation Fuel Production in the Southeastern United States. GCB Bioenergy 13 (11), 1800–1813. doi:10.1111/gcbb.12888
Alexander, P., and Moran, D. (2013). Impact of Perennial Energy Crops Income Variability on the Crop Selection of Risk Averse Farmers. Energy Policy 52, 587–596. doi:10.1016/j.enpol.2012.10.019
Anderson, D. R. (2008). Model Based Inference in the Life Sciences: A Primer on Evidence. Verlag New York: Springer New York. doi:10.1007/978-0-387-74075-1
Bashyal, M., Mulvaney, M. J., Lee, D., Wilson, C., Iboyi, J. E., Leon, R. G., et al. (2021). Brassica Carinata Biomass, Yield, and Seed Chemical Composition Response to Nitrogen Rates and Timing on Southern Coastal Plain Soils in the United States. GCB Bioenergy 13 (8), 1275–1289. doi:10.1111/gcbb.12846
Bocquého, G., and Jacquet, F. (2010). The Adoption of Switchgrass and Miscanthus by Farmers: Impact of Liquidity Constraints and Risk Preferences. Energy Policy 38 (5), 2598–2607. doi:10.1016/j.enpol.2010.01.005
Boote, K. J., Seepaul, R., Mulvaney, M. J., HaganHagan, A. K., Bashyal, M., George, S., et al. (2021). Adapting the CROPGRO Model to Simulate Growth and Production of Brassica Carinata a Bio‐fuel Crop. GCB Bioenergy 13 (7), 1134–1148. doi:10.1111/gcbb.12838
Bryant, C. (2021). Soybean Production in Georgia. Athens, Georgia: University of Georgia. Available at: https://grains.caes.uga.edu/content/dam/caes-subsite/grains/docs/soybean/2021-Soybean-Production-Guide.pdf.
Bullock, D. G. (1992). Crop Rotation. Crit. Rev. Plant Sci. 11 (4), 309–326. doi:10.1080/07352689209382349
Capaz, R. S., Guida, E., Seabra, J. E. A., Osseweijer, P., and Posada, J. A. (2021). Mitigating Carbon Emissions through Sustainable Aviation Fuels: Costs and Potential. Biofuels, Bioprod. Bioref. 15 (2), 502–524. doi:10.1002/bbb.2168
Chu, P. L., Vanderghem, C., MacLean, H. L., and Saville, B. A. (2017). Financial Analysis and Risk Assessment of Hydroprocessed Renewable Jet Fuel Production from Camelina, Carinata and Used Cooking Oil. Appl. Energ. 198, 401–409. doi:10.1016/j.apenergy.2016.12.001
Clancy, D., Breen, J. P., Thorne, F., and Wallace, M. (2012). A Stochastic Analysis of the Decision to Produce Biomass Crops in Ireland. Biomass and Bioenergy 46, 353–365. doi:10.1016/j.biombioe.2012.08.005
Cox, K., Renouf, M., Dargan, A., Turner, C., and Klein-Marcuschamer, D. (2014). Environmental Life Cycle Assessment (LCA) of Aviation Biofuel from microalgae,Pongamia Pinnata, and Sugarcane Molasses. Biofuels, Bioprod. Bioref. 8 (4), 579–593. doi:10.1002/bbb.1488
Dwivedi, P. (2021). Sustainable Aviation Fuel Production from Brassica Carinata in the Southern United States. GCB Bioenergy n/a (n/a). doi:10.1111/gcbb.12900
EIA (2019). U.S. Energy-Related Carbon Dioxide Emissions. Washington, DC: Independent Statistics and Analysis. Available at: https://www.eia.gov/environment/emissions/carbon/.
European Aviation Safety AgencyEuropean Environment Agency andEUROCONTROL (2016). European Aviation Environmental Report 2016. Luxembourg: European Aviation Safety Agency. doi:10.2822/385503
Faasch, R. J., and Patenaude, G. (2012). The Economics of Short Rotation Coppice in Germany. Biomass and Bioenergy 45, 27–40. doi:10.1016/j.biombioe.2012.04.012
Field, J. L., Evans, S. G., Marx, E., Easter, M., Adler, P. R., Dinh, T., et al. (2018). High-resolution Techno-Ecological Modelling of a Bioenergy Landscape to Identify Climate Mitigation Opportunities in Cellulosic Ethanol Production. Nat. Energ. 3 (3), 211–219. doi:10.1038/s41560-018-0088-1
Field, J. L., Zhang, Y., Marx, E., Boote, K., Easter, M., George, S., et al. (2022). Modeling Yield, Biogenic Emissions, and Carbon Sequestration in Southeastern Cropping Systems with Winter Carinata. Front. Energ. Res. 9 (March).
George, S., Seepaul, R., Geller, D., Dwivedi, P., Di Lorenzo, N., Altman, R., et al. (2021). A Regional Inter‐disciplinary Partnership Focusing on the Development of a Carinata‐centered Bioeconomy. GCB Bioenergy 13 (May). doi:10.1111/gcbb.12828
Graver, B., Rutherford, D., and Zheng, S. (2020). CO2 Emissions from Commercial Aviation 2013, 2018, and 2019. San Francisco, CA, US: The International Council On Clean Transportation. Available at: https://theicct.org/wp-content/uploads/2021/06/CO2-commercial-aviation-oct2020.pdf.
Hansen, J. K., Roni, M. S., Nair, S. K., Hartley, D. S., Griffel, L. M., Vazhnik, V., et al. (2019). Setting a Baseline for Integrated Landscape Design: Cost and Risk Assessment in Herbaceous Feedstock Supply Chains. Biomass and Bioenergy 130, 105388. doi:10.1016/j.biombioe.2019.105388
Hauk, S., Gandorfer, M., Wittkopf, S., Müller, U. K., and Knoke, T. (2017). Ecological Diversification Is Risk Reducing and Economically Profitable - the Case of Biomass Production with Short Rotation Woody Crops in South German Land-Use Portfolios. Biomass and Bioenergy 98, 142–152. doi:10.1016/j.biombioe.2017.01.018
Hayward, J. A., O'Connell, D. A., Raison, R. J., Warden, A. C., O'Connor, M. H., Murphy, H. T., et al. (2015). The Economics of Producing Sustainable Aviation Fuel: A Regional Case Study in Queensland, Australia. GCB Bioenergy 7 (3), 497–511. doi:10.1111/gcbb.12159
Homer, C., Dewitz, J., Jin, S., Xian, G., Costello, C., Danielson, P., et al. (2020). Conterminous United States Land Cover Change Patterns 2001-2016 from the 2016 National Land Cover Database. ISPRS J. Photogrammetry Remote Sensing 162, 184–199. doi:10.1016/j.isprsjprs.2020.02.019
Huang, E., Zhang, X., Rodriguez, L., Khanna, M., de Jong, S., Ting, K. C., et al. (2019). Multi-Objective Optimization for Sustainable Renewable Jet Fuel Production: A Case Study of Corn Stover Based Supply Chain System in Midwestern U.S. Renew. Sustain. Energ. Rev. 115, 109403. doi:10.1016/j.rser.2019.109403
Iboyi, J. E., Mulvaney, M. J., Balkcom, K. S., Seepaul, R., Bashyal, M., Perondi, D., et al. (2021). Tillage System and Seeding Rate Effects on the Performance of Brassica Carinata. GCB Bioenergy 13 (4), 600–617. doi:10.1111/gcbb.12809
Lee, D. (2019). A Guide to Corn Production in Georgia. Athens, Georgia: University of Georgia. Available at: https://grains.caes.uga.edu/content/dam/caes-subsite/grains/docs/corn/2019-Corn-Production-Guide.pdf.
Mamun, S., Hansen, J. K., and Roni, M. S. (2020). Supply, Operational, and Market Risk Reduction Opportunities: Managing Risk at a Cellulosic Biorefinery. Renew. Sustain. Energ. Rev. 121, 109677. doi:10.1016/j.rser.2019.109677
McGrath, J. F., Goss, K. F., Brown, M. W., Bartle, J. R., and Abadi, A. (2017). Aviation Biofuel from Integrated Woody Biomass in Southern Australia. WIREs Energ. Environ. 6 (2), e221. doi:10.1002/wene.221
Michailos, S. (2018). Process Design, Economic Evaluation and Life Cycle Assessment of Jet Fuel Production from Sugar Cane Residue. Environ. Prog. Sustain. Energ. 37 (3), 1227–1235. doi:10.1002/ep.12840
Moore, K. J., Kling, C. L., and Raman, D. R. (2020). A Midwest USA Perspective on Von Cossel et al.’s Prospects of Bioenergy Cropping Systems for a More Social-Ecologically Sound Bioeconomy. Agronomy 10, 1658. doi:10.3390/agronomy10111658
Mulvaney, M., Seepaul, R., Small, I., Wright, D., Paula-Moraes, S., Crozier, C., et al. (2018). Frost Damage of Carinata Grown in the Southeastern US. EDIS 2018 (May). doi:10.32473/edis-ag420-2018
NASS (2020). Quick Stats. Washington, D.C., USA: USDA National Agriculture Statistics Service. Available at: https://quickstats.nass.usda.gov/.
National Peanut Research Laboratory (2020). Whole Farm. Dawson, Georgia: National Peanut Research Laboratory.
Parton, W. J., Hartman, M., Ojima, D., and Schimel, D. (1998). DAYCENT and its Land Surface Submodel: Description and Testing. Glob. Planet. Change 19 (1), 35–48. doi:10.1016/s0921-8181(98)00040-x
Perkis, D. F., and Tyner, W. E. (2018). Developing a Cellulosic Aviation Biofuel Industry in Indiana: A Market and Logistics Analysis. Energy 142, 793–802. doi:10.1016/j.energy.2017.10.022
PRISM Climate Group (2015). AN81 Gridded Climate Dataset. Corvallis, Oregon: Oregon State University. Available at: http://prism.oregonstate.edu/.
Reimer, J. J., and Zheng., X. (2017). Economic Analysis of an Aviation Bioenergy Supply Chain. Renew. Sustain. Energ. Rev. 77 (May 2015), 945–954. doi:10.1016/j.rser.2016.12.036
Richardson, J. W., Johnson, M. D., Zhang, X., Zemke, P., Chen, W., and Hu, Q. (2014). A Financial Assessment of Two Alternative Cultivation Systems and Their Contributions to Algae Biofuel Economic Viability. Algal Res. 4, 96–104. doi:10.1016/j.algal.2013.12.003
Salassi, M. E., Deliberto, M. A., and Guidry, K. M. (2013). Economically Optimal Crop Sequences Using Risk-Adjusted Network Flows: Modeling Cotton Crop Rotations in the Southeastern United States. Agric. Syst. 118, 33–40. doi:10.1016/j.agsy.2013.02.006
Schulmeister, T. M., Ruiz-Moreno, M., Silva Garcia-Ascolani, G. M., Ciriaco, M., Ciriaco, F. M., Henry, D. D., et al. (2019). Evaluation of Brassica Carinata Meal as a Protein Supplement for Growing Beef Heifers1,2. J. Anim. Sci. 97 (10), 4334–4340. doi:10.1093/jas/skz280
Seepaul, R., Small, I. M., Mulvaney, M. J., George, S., Leon, R. G., Geller, D., et al. (2019). Carinata , the Sustainable Crop for a Bio-Based Economy : 2018 – 2019 Production Recommendations for the Southeastern United States. Gainesville, Florida: University of Florida, IFAS Extension, 1–12.
Simões, D., Mosquera, G. A. D., Batistela, G. C., de Souza Passos, J. R., and Fenner, P. T. (2016). Quantitative Analysis of Uncertainty in Financial Risk Assessment of Road Transportation of Wood in Uruguay. Forests 7 (7), 1–11. doi:10.3390/f7070130
Skevas, T., Swinton, S. M., Tanner, S., and Gregg, S. (2016). Investment Risk in Bioenergy Crops. GCB Bioenergy 8, 1162–1177. doi:10.1111/gcbb.12320
Spiegel, A., Britz, W., Djanibekov, U., and Finger, R. (2018). Policy Analysis of Perennial Energy Crop Cultivation at the Farm Level: Short Rotation Coppice (SRC) in Germany. Biomass and Bioenergy 110 (May 2017), 41–56. doi:10.1016/j.biombioe.2018.01.003
Styles, D., Thorne, F., and Jones, M. B. (2008). Energy Crops in Ireland: An Economic Comparison of Willow and Miscanthus Production with Conventional Farming Systems. Biomass and Bioenergy 32 (5), 407–421. doi:10.1016/j.biombioe.2007.10.012
Tanzil, A. H., Brandt, K., Wolcott, M., Zhang, X., and Garcia-Perez, M. (2021). Strategic Assessment of Sustainable Aviation Fuel Production Technologies: Yield Improvement and Cost Reduction Opportunities. Biomass and Bioenergy 145, 105942. doi:10.1016/j.biombioe.2020.105942
University of Georgia Cooperative Extension (2019). Eastimated Per Acre Costs and Returns Data, South and East Georgia. Athens, Georgia: University of Georgia Cooperative Extension. Available at: https://agecon.uga.edu/extension/budgets.html.
U.S. Department of Agriculture (2020). Georgia Agricultural Facts. Washington, D.C., USA: U.S. Department of Agriculture. Available at: www.nass.usda.gov.
U.S. Department of Labor (2019). Bureau of Labor Statistics. Washington, D.C., USA: United States Department of Labor. Available at: https://www.bls.gov/data/.
U.S. Department of Transportation (2019). Bureau of Transportation Statistics. Washington, D.C., USA: U.S. Department of Transportation. Available at: https://www.transtats.bts.gov/Data_Elements.aspx?Data=4.
Yadav, S., Teng, P.-Y., Choi, J., Singh, A. K., and Kim, W. K. (2022). Nutrient Profile and Effects of Carinata Meal as Alternative Feed Ingredient on Broiler Performance, Tight Junction Gene Expression and Intestinal Morphology. Poult. Sci. 101 (2), 101411. doi:10.1016/j.psj.2021.101411
Zafeiriou, E., and Karelakis, C. (2016). Income Volatility of Energy Crops: The Case of Rapeseed. J. Clean. Prod. 122 (2016), 113–120. doi:10.1016/j.jclepro.2016.02.068
Zhang, F., Guo, P., Engel, B. A., Guo, S., Zhang, C., and Tang, Y. (2019). Planning Seasonal Irrigation Water Allocation Based on an Interval Multiobjective Multi-Stage Stochastic Programming Approach. Agric. Water Manage. 223 (August), 105692. doi:10.1016/j.agwat.2019.105692
Zhang, Y., Ram, G., Marx, E., Williams, S., Ogle, S. M., and Keith, P. (2020). DayCent Model Predictions of NPP and Grain Yields for Agricultural Lands in the Contiguous U.S. J. Geophys. Res. Biogeosciences 125 (7), e2020JG005750. doi:10.1029/2020jg005750
Zhang, Y., Suyker, A., and Paustian, K. (2018). Improved Crop Canopy and Water Balance Dynamics for Agroecosystem Modeling Using DayCent. Agron.j. 110 (2), 511–524. doi:10.2134/agronj2017.06.0328
Keywords: aviation, climate change, farm economics, risk, sustainable development
Citation: Karami O, Dwivedi P, Lamb M and Field JL (2022) Economics of Crop Rotations With and Without Carinata for Sustainable Aviation Fuel Production in the SE United States. Front. Energy Res. 10:830227. doi: 10.3389/fenrg.2022.830227
Received: 06 December 2021; Accepted: 29 March 2022;
Published: 10 May 2022.
Edited by:
Sylvain Leduc, International Institute for Applied Systems Analysis (IIASA), AustriaReviewed by:
Bheru Lal Salvi, Maharana Pratap University of Agriculture and Technology, IndiaBurton C English, The University of Tennessee, Knoxville, United States
Copyright © 2022 Karami, Dwivedi, Lamb and Field. This is an open-access article distributed under the terms of the Creative Commons Attribution License (CC BY). The use, distribution or reproduction in other forums is permitted, provided the original author(s) and the copyright owner(s) are credited and that the original publication in this journal is cited, in accordance with accepted academic practice. No use, distribution or reproduction is permitted which does not comply with these terms.
*Correspondence: Omid Karami, b2thcmFtaUBwdXJkdWUuZWR1