 Juliana D’Angela Mariano1,2*
 Jair Urbanetz Jr2
- 1College of Engineering and Computing Sciences, New York Institute of Technology, Department of Energy Management, Vancouver, BC, Canada
- 2Solar Energy Laboratory, Department of Electrotechnics, Graduate Program in Energy Systems, Federal University of Technology, Curitiba, Brazil
Energy storage system integration can reduce electricity costs and provide desirable flexibility and reliability for photovoltaic (PV) systems, decreasing renewable energy fluctuations and technical constraints. In this sense, this study aimed to propose energy management strategies through this integration, aiming to improve the demand profile of a university commercial consumer for compensation during peak hours. To achieve the objectives of this research, a pilot project was installed which included a 10 kWp grid-tie PV system (GTPVS), bidirectional inverters, and battery bank, as part of a research and development (R&D) project implemented in the Federal University of Technology–Paraná (UTFPR) Curitiba campus at Neoville headquarters. The methodology consisted of the analysis of variables that interfere with the operation of this system, such as a detailed university profile of demand and consumption, local energy pricing, PV generation profile as well as the interaction between PV generator and the energy storage system, and the variation in power fluctuations throughout the year. Additionally, a technical feasibility study was carried out aimed to determine this consumer’s optimal size through the Homer Grid software. The detailed demand profile allowed us to know in depth the peak values were above 80 kW, for university working days. Furthermore, the daily analysis of the PV generation profile confirmed that although the PV source is quite variable, the scheduled dispatch operation is not interfered by the variability and intermittency of the solar source, as the system was designed and programmed to operate in parallel with the electrical network. Regarding the energy consumed at the university, very significant values were obtained, in which the month of July presented the highest consumption for the base year 2019, with a total monthly value of 48,670 kWh. The established operating strategy for the battery bank with a 10% discharge depth resulted in a life cycle of 2,500 cycles which can extend its useful life by approximately 9.5 years. The results obtained by the simulation show different levels of energy contribution with percentages of 60.0, 33.6, and 2.7%, respectively.
Introduction
The energy storage system integration into PV systems is the process by which the energy generated is converted into electrochemical energy and stored in batteries (Akbari et al., 2018). PV-battery operating together (Figure 1) can bring a variety of benefits to consumers and the power grid because of their ability to maximize electricity self-consumption and power management (Choudar et al., 2015; Üçtuğ and Azapagic, 2018).
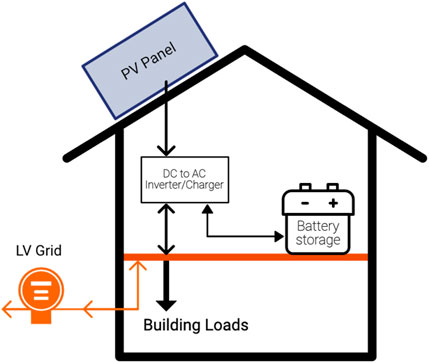
FIGURE 1. The residential PV-battery scheme.
According to Figure 1, it is possible to identify the addition of the battery and the use of the bidirectional inverter, which makes the power flow more dynamic. The battery can be charged by the PV system and the electric network (Nottrott et al., 2013). Additionally, the PV-battery system also allows consumers to contribute by reducing energy demand in response to market prices, using financial incentives (Gitizadeh and Fakharzadegan, 2014). PV-battery systems are complex because more variables need to be considered such as in design and implementation. These systems will operate with the power required to meet the load profile of this consumer, which may vary from day to day or seasonally. The amount of energy produced will depend on PV panel size and daily irradiation (Lawder et al., 2015). Finally, storing energy through batteries will create supply flexibility, requiring verification of the difference between the PV power generation curve, and power demand (Lee et al., 2017).
The financial benefits achieved depend largely on the exact pricing structure and policies of the place where the consumer is located (Nottrott et al., 2013; Gitizadeh and Fakharzadegan, 2014). Some power electricity companies introduced the Time of Use (TOU) rates and peak demand charges for their customers due to the increased implementation of smart meters, net metering policies, and electric vehicle penetration (Mulder et al., 2013; Hanna et al., 2014). Since batteries store direct current (DC) power and most household equipment requires alternate current (AC) power, an inverter is required. In addition to serving this type of application, the inverter/charger or bidirectional inverter can meet other applications such as electric and hybrid vehicles, uninterruptible power systems (UPS), etc. (Cheng et al., 2010; Rahimi-Eichi et al., 2013). In addition, bidirectional inverters are used in hybrid systems (more than one renewable power source), to increase the power supply capabilities (Lawder et al., 2014). Regarding its operation, this device is more complex than the grid-tie PV inverter controlling the entire system including load controllers and their connection to the power grid (Xing et al., 2011; Gallardo-Lozano et al., 2014).
The bidirectional inverters must ensure safe operation and are regulated by national and international standards. The equipment shall comply with operating specifications regarding electromagnetism emission, harmonic current, electromagnetic immunity, and electrical safety (Lo et al., 2016). Another important factor to consider is battery compatibility since there is a wide range of technologies available (Debnath and Chatterjee, 2016). Regarding batteries, the main classes of batteries are primary and secondary. Primary batteries cannot be recharged and therefore are not applicable in PV systems, such as carbon-zinc and lithium batteries used in consumer electronics. Secondary batteries can be recharged and therefore used in PV systems (Balcombe et al., 2015; Feng et al., 2015). The most common battery types applied in these systems are lead-acid, lithium-ion, and flow batteries that are applied in large-scale PV systems (Hanser et al., 2017).
Lead-acid batteries are the oldest and most widely used rechargeable electrochemical devices among energy storage technologies (Akhil et al., 2013). In 1859, they were invented mostly for domestic use and a variety of commercial applications such as motor starters, among other applications (Akbari et al., 2018). This type of battery consists of a lead sponge metal anode, a lead dioxide cathode, and a sulfuric acid solution electrolyte (Mahlia et al., 2014).In addition to the simplicity in the manufacturing process, the technology is relatively low cost compared to other batteries, with a good life cycle under controlled conditions, and fast electrochemical reaction kinetics (Luo et al., 2015). However, it also has some disadvantages related to its operation, such as performance impairment at extreme temperatures affecting its lifetime (Kousksou et al., 2014). Furthermore, there is a need for periodic water maintenance, low energy density, and the presence of heavy metals harmful to the environment make this technology unsuitable for certain applications (Luo et al., 2015).
Mahlia et al. (2014) highlight some technological advances achieved by this technology with the development of lead-acid ultra-battery. This development is a new long-life hybrid device that can operate in a continuous Partial State of Charge (PSoC) (Luo et al., 2015). The device is efficient and does not require charge maintenance cycles, has optimum stability with longevity to charge/discharge operation, is faster, and with a deep charge range. Its loading/unloading is approximately 50 per cent longer than traditional lead-acid batteries, and its life cycle is three times longer (Ecoult, 2019).
The contribution/motivation of this study is to look in detail at the demand characteristics of a university environment. Furthermore, how to improve the demand profile using this integration that can be replicated in another university environment, in order to improve the demand profile of a university consumer for compensation during peak hours.
Pilot Project Methodology
In order to simplify the materials and method applied in this study, we developed a flowchart presented in Figure 2. Thus, the main steps in the development and operation of this pilot project are described and will be explained in this session.
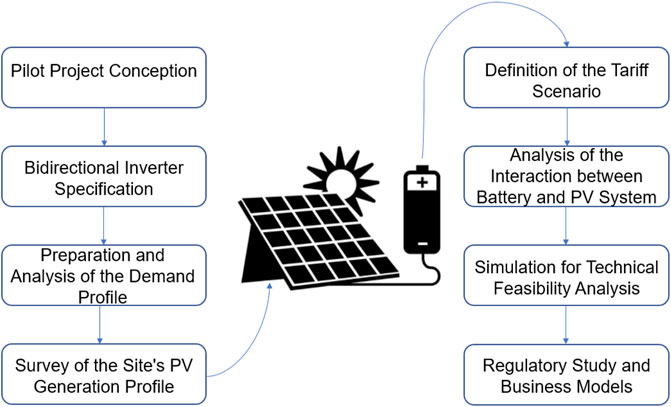
FIGURE 2. Flowchart of the proposed method.
To increase the PV generation, the Solar Energy Laboratory (LABENS) of the Federal University of Technology–Paraná (UTFPR) granted a research and development (R&D) project aiming to perform energy management strategies. To achieve this goal, a PV-battery-grid-tie-system (PV-Bat system) was installed as a pilot project, following the optimal operating conditions. In the southern hemisphere, these types of systems must follow some recommendations, such as PV panel tilt angle according to the latitude and oriented to the geographical north (latitude of −25,50° and longitude of −49,31° in this case of study).In addition to the conditions mentioned, the system complies with bidirectional inverters responsible to control and monitor electrical parameters. The described system was implemented in 2019 and aims to demonstrate several services, such as providing firm capacity in PV generation, peak shaving, power backup, load shifting, supply of essential loads in isolated operation from the grid, voltage and frequency regulation, and the reactive control of feeders (Mariano et al., 2021).
To meet the specifications of this project (project design), the system consisted of a 10.72 kWp PV generator, two bidirectional single-phase inverters of 5 kW, and two racks of lead-acid batteries in series, comprising80 batteries for each bidirectional inverter, stationary type of 60 Ah and 12 V, totaling 57.60 kWh of energy in these systems. As for the storage of energy in batteries, as its autonomy of energy supply varies, it was tested with the proposed study, to operate at times that coincide with peak hours. As for the depth of discharge in the battery bank, the percentage was considered and analyzed to prolong its useful life, according to the battery data sheet, since studies on aging of this type of technology carried out by Krieger et al. (2013) confirm that the maximum depth of discharge can be up to 50%. Furthermore, it is possible to prolong its useful life, avoiding critical operating conditions, such as overcharge and deep discharge (Duryea et al., 1999).
In the preparation phase and analysis of the demand profile, data provided by the electricity company Companhia Paranaense de Energia (COPEL) was used to collect data on monthly consumption and monthly and daily energy demand. With this resource, numerical data of demand and consumption parameters were collected, and graphically reproduced these results, which allowed the direct visualization of the profile of the electrical meters at the UTFPR Neoville headquarters. Figure 3 shows the behavior of peak (green) and off-peak (red) demand for the years 2019 and 2020.
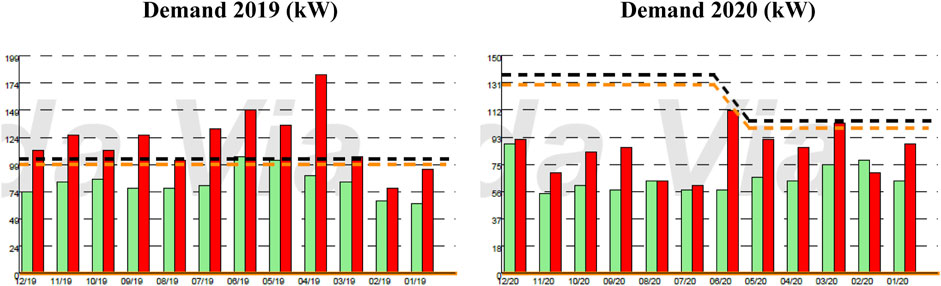
FIGURE 3. Billed monthly demands and contracted demand limits for 2019 (left) and 2020 (right). Data Sources: Electricity bills for the years 2019 and 2020.
In order to drill down further, actual daily demand spreadsheets were collected with measurements taken every 15 min. From this data set, the hourly demand profile average (every 15 min) of school and nonschool weekdays and weekends and holidays in the listed years was calculated. Thus, the average of the dataset collected, such as 365 spreadsheets from the years 2019 and 2020, represented the dataset of this research, with a total of 35,040 measurements per year for each complete year.
where A = arithmetic mean; n = number of variables; ai = dataset value.
Additionally, the hourly demand profile was calculated (using each quarter of hours) of university working days, nonworking days, weekends, and holidays in the listed years. In this sense, they were also considered as a data set, but with a reduced sample, in order to obtain a joint analysis with the PV generation and the energy delivered to the electricity grid. In this dataset of the hourly demand profile, the boxplot statistical analysis was also applied to identify the data distribution and outliners (extreme measured values).
PV generation can be obtained in several ways, including computational tools to automate the calculation process as well as the energy sizing and forecasting equations. However, understanding the results generated by these programs is essential for the design and operation of these systems, as the solar resource presents variability and intermittency (Pinho and Galdino, 2014; Urbanetz Junior et al., 2016). In this sense, the most elementary way to know the PV generation forecast is to study the variables that interfere with your energy production listed as follows:
where E: average daily electricity (Wh/day); PFV: peak photovoltaic power installed (Wp); Htot: monthly average daily solar irradiation for the locality in question (Wh/m2.day); PR: Performance Rate or Performance Ratio, typically between 70 and 80% (75% for this analysis); G: irradiance in the Standard Test Conditions (1,000 W/m2).
Among the variables shown in Eq. 2, the most relevant is the average daily incident solar irradiation at the site (Htot), which can be obtained through a highly reliable national database such as the Brazilian Atlas of Solar Energy (Pereira et al., 2017) or local database such as Paraná State Solar Energy Energy Atlas (Tiepolo et al., 2017) and can be used in design/sizing of PV systems, or for calculating actual PV generation and merit indices, as shown in Table 1.

TABLE 1. Horizontal global irradiation data from the Paraná State Solar Energy Atlas.
With the operation of the new PV-Bat system installed in this headquarters, there was the possibility of measuring and collecting real data, in the inverter mass memories, and these were collected and processed. As these are bidirectional inverters, in which there is power flow variation occurring at different times of the day, the equipment controls 19 variables related to voltage, current, and energy, among other quantities.
The implementation and operation of this pilot project have a large number of variables, as aforementioned, and they are considered common to the PV-Bat system. Gamarra and Guerrero (2015) state that there are three major problems in the planning and operation of these systems. The project must be dimensioned in detail, respecting the requirements of adequate storage technology and customer demand. Pinho and Galdino (2014) state that the Homer software has descriptions of simplified system models and performs hourly calculations for hundreds of configurations, presenting them according to cost. Additionally, it allows the optimization of specific technical parameters as well as detailed results of each configuration. Among the results, Homer presents graphs that display battery charge status, voltage, produced and consumed energy, etc. over the simulation time, which is done on an annual basis (Sarkar et al., 2019).
For the analysis of energy management scenarios, Homer Grid will be used, which is the most recent and appropriate version for the proposed analysis. Among the features of this tool, the software is able to determine the best combination of resources for the lowest cost solution; calculate energy demand reduction, arbitrage, and self-consumption; design a system with the best rate of return. In addition, it features flexibility with fixed or variable rate input data for any scenario (HOMER GRID, 2021).
Results and Discussion
After this analysis of the average demand profile for the years 2019 and 2020, it was established that the year used as the basis for analysis was 2019, as it does not represent a pandemic scenario. The study of the demand profile was also essential to assist in the modeling, which will be discussed in this chapter, which impacts the energy management carried out by the battery bank. Thus, the demand data for academic weekdays and weekends and holidays were used as input data in the PV-Bat system simulation software, used to analyze the optimal size, life expectancy, and system behavior according to the changing environment of this building.
Table 2 shows the average hourly demands calculated for the academic weekdays in the year 2019. Additionally, these average values were used as input data in the Homer Grid Software.
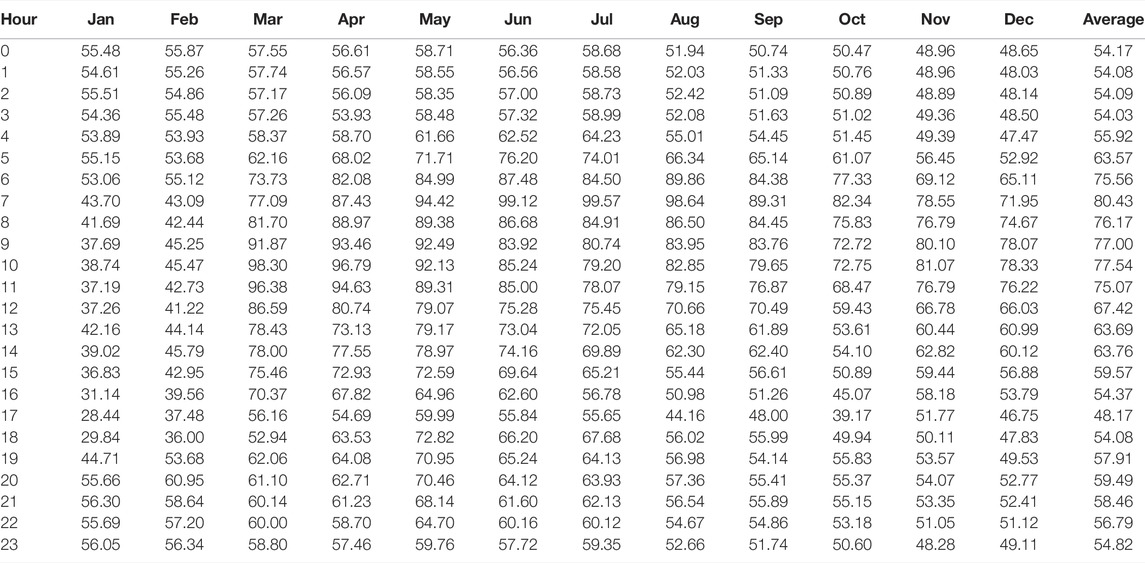
TABLE 2. Calculated average demand (kW) for the university working days of the year 2019.
In Table 2, the periods in which demand was above the average calculation for the respective months of the year 2019 were highlighted in red, which characterized the periods of peak demand during the academic year. There was a variation of 10 h in which the greatest demands occurred during the day, due to the profile of the headquarters with academic activities taking place during the day. In addition, there was a smaller variation when the demand in the months of November and December 2019, mainly due to the change in daylight-saving time and longer day length. Table 3 shows the average hourly demands calculated for the academic weekdays in the year 2020.
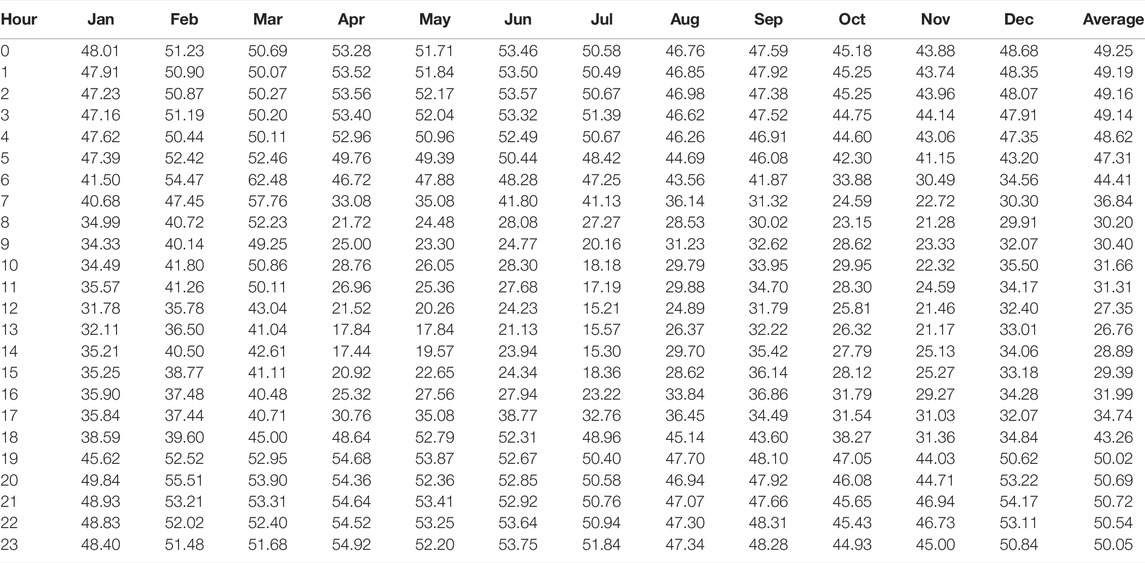
TABLE 3. Calculated average demand (kW) for the university working days of the year 2020.
It is noted that the academic weekdays show greater variability in relation to the maximum values, especially with a trend towards the maximum quartile starting in March with the beginning of the academic year. On the other hand, it is observed that on weekends and holidays there was greater variability in relation to the minimum values, due to the lack of academic activities at the Neoville headquarters.
Comparing the analyses of the average hourly demand profile for the years 2019 and 2020, there was a significant reduction in the average demand of more than 65% for university working days and more than 20% for weekends and holidays, caused by the pandemic scenario of Covid-19. In Figure 4, the boxplot analysis applied to the data set presented in the tables is shown.
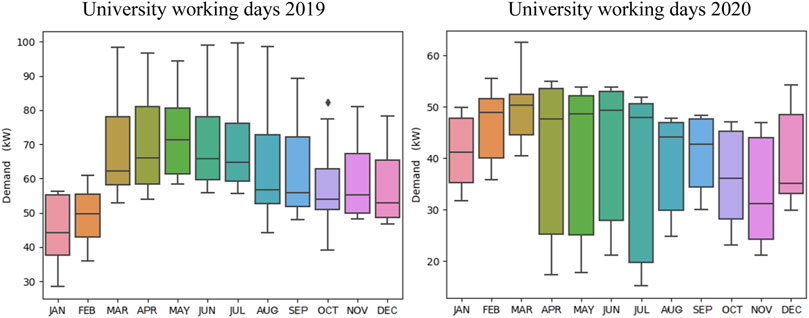
FIGURE 4. Boxplot of the average hourly demand profile for university working days.
Analyzing the calculated average hourly demand profile and their respective boxplots, it can be inferred that the values followed this trend, mainly due to the periods in which demand was above (weekday) or below (weekends and holidays) calculated average.
According to the boxplot analysis performed in Figure 3, it is highlighted that both weekdays and weekends and holidays showed greater variability in relation to the minimum values. Due to the suspension of academic activities in 2020, there was a significant reduction in demand values at the Neoville headquarters, which directly impacted monthly energy consumption. Table 4 shows the values of energy consumed at peak and off-peak for the months of the base year 2019. Additionally, the monthly total and daily averages of electricity consumption at the Neoville headquarters were calculated, with emphasis on the months of April, June, and July 2019 which is highlighted due to the major consumption along the year.
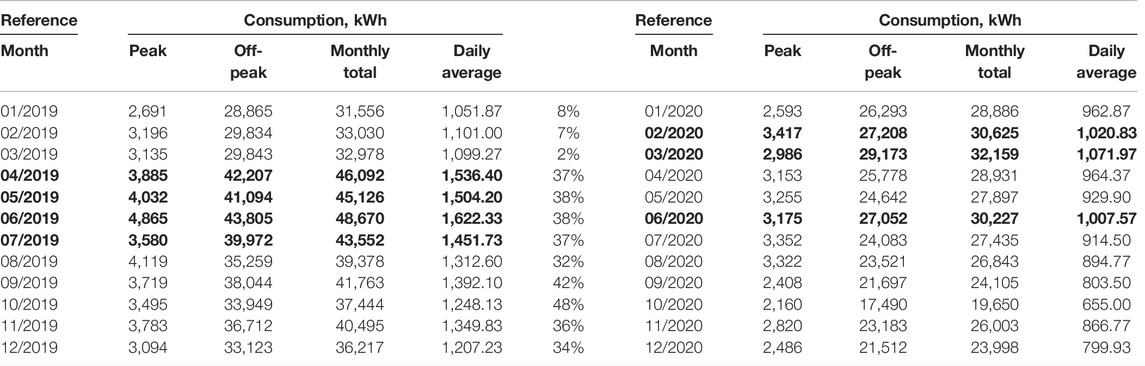
TABLE 4. Monthly energy consumption for the base years 2019 and 2020.
According to Table 4, it was observed that the energy consumed off-peak had values much higher than the energy consumed at the peak. Table 4 shows the energy values for the year 2020. Just as the pandemic impacted the calculated average hourly demand profile, there was also a very significant reduction in energy consumption. Regarding the calculated monthly total consumption, this presented a very high percentage, varying from at least 2% in March/2020 and at most up to 48% in October/2020.
The calculation of estimated monthly energy generation was performed using the irradiation data on the tilt angle of 25° at latitude from the Paraná State Solar Energy Atlas database (Tiepolo et al., 2017), presented in Table 1. Figure 5 shows the graph of PV generation calculated from the solar irradiation data for the tilt angle of the study site. Applying these values in Eq. 2 and considering the power of the PV-Bat system of 10.72 kWp plus 75% performance rate, we obtained the following monthly values shown in Figure 5.
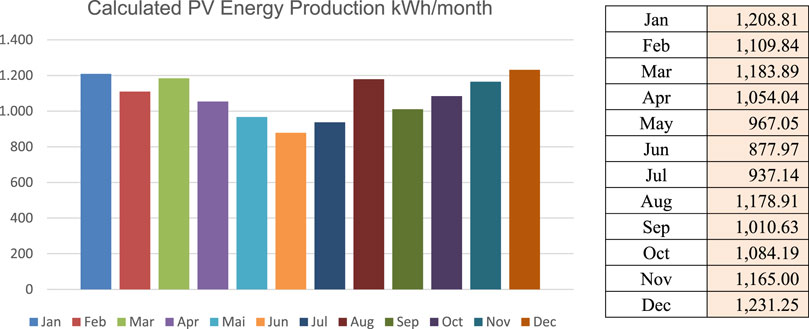
FIGURE 5. Calculated PV generation for the PV-Bat system of 10.72 kWp. Data sources: the authors.
Regarding the demand graphs for weekends and holidays, the profile observed for the years 2019 and 2020 was very similar but is not the focus of this study. In the pre-pandemic years, there were two moments with peaks in demand at night and at dawn, due to the activation of external lighting and with values close to 60 kW. In the pandemic years (2020 and 2021), the peak demand values were reduced to 50 kW, showing again two moments of peaks at night and dawn. It is important to emphasize that the analysis of demand behavior on weekends and holidays is relevant, as in addition to the very low profile, all PV generation is used to charge the battery bank, and its surplus is injected into the electricity grid when there is equalization from the store.
The purpose of the demonstration of daylight-saving daily charts was to assess in more detail the behavior of the aforementioned quantities. Furthermore, the daily analysis allowed for a broader view, especially regarding Pac. It is noteworthy that the quantities of PV power generated (Pdc - kWp) and power delivered to the grid/battery (Pac - kW) are in different power scales of the analyzed average hourly demand (kW) for the month of March 2019.
The following graphs refer to the 2 months selected for the analysis of the daily profile regarding PV generation, highlighting the four stages characterizing the charging and discharging of the battery bank, using data from the operation of bidirectional inverter 1 (Bid1). Figure 6 shows the PV generation curves for the selected academic weekday of maximum irradiation, being comprised in the period closest to summer and within the academic calendar.
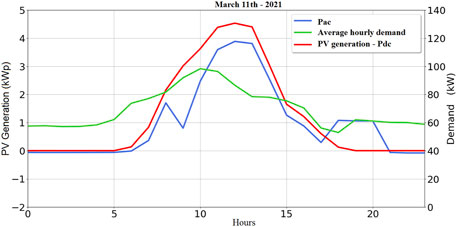
FIGURE 6. The PV generation profile with maximum hourly irradiation days for the academic weekday - 03/11/2021 versus average hourly demand of March/2019. Data Sources: the authors.
According to the graphs shown in Figure 6, as the irradiance increases throughout the day, the average power generated by the PV panel is being made available in the electrical network, represented by the red curve. As for battery charging, the storage system was programmed to start at 9:00 a.m., characterizing stage 1 of the charging cycle, represented by the blue curve. At around 13:00 h, the battery bank enters stage 2 where it presents its 100% state of charge. In the afternoon, when the irradiance reduction starts, there is also a reduction in the average power generated by the PV panel made available on the electrical network, contemplating stage 3. Due to the peak time starting at 18:00 h, the unloading cycle has been scheduled to dispatch power from 6:00 p.m. to 9:00 p.m. ending stage 4.
Figure 7 shows the daily results for the school day of minimum irradiation with PV generation, energy delivered to the grid/battery for the month of March/2021, and the hourly average demand curve for the month of March 2019.
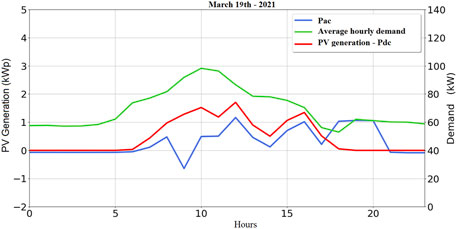
FIGURE 7. The PV generation profile with days of minimum hourly irradiation for the academic weekday – 03/19/2021 versus average hourly demand of March/2019. Data Sources: the authors.
As shown in Figure 7, the behavior of the daily PV generation was significantly reduced for the selected day, compared to 03/11/2021. Even for days with low irradiance, there are four stages taking place in the system, with stage 1, which is the battery charging, being started. In stage 2 the battery bank presents a 100% state of charge. In stage 3 there is a reduction of irradiance happening twice, and in stage 4 at 18:00 h, the unloading starts, ending the cycle at 21:00 h. It is noteworthy that even with reduced irradiation levels, PV generation is close to 0 kW, the bidirectional inverter operates by charging the batteries with energy from the electricity grid, showing the flexibility of power flow in this system.
As shown in the graph in Figure 8, PV generation presented a profile very similar to the maximum irradiation academic weekday of March/2021, but with a lower power generation range than in summer. As for the demand profile, this showed a difference in relation to its peak, which occurred earlier, because June is a month with reduced irradiance and the university requires greater lighting activation.
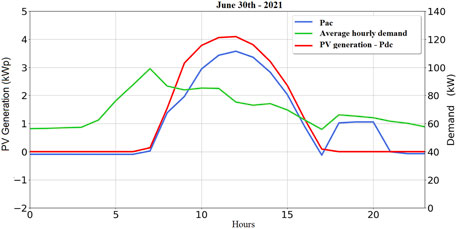
FIGURE 8. The PV generation profile with maximum hourly irradiation days for the academic weekday - 06/30/2021 versus average hourly demand of June/2019. Data Sources: the authors.
Figure 9 shows the PV generation curve for the selected day of minimum irradiation and its respective energy delivered to the grid/battery. It is noteworthy that this chosen day was the day with the lowest irradiance in June 2021, with energy generation being quite compromised, with no energy contribution from the PV system. Additionally, the hourly average demand curve for the month of June 2019, for the school business day, is also shown.
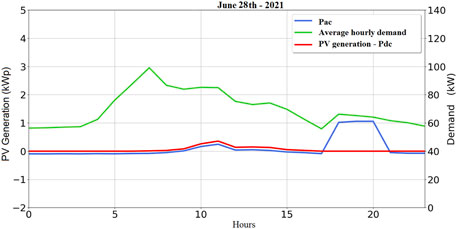
FIGURE 9. The PV generation profile with days of minimum hourly irradiation for the academic weekday – 06/28/2021 versus average hourly demand of June/2019. Data Sources: the authors.
Analyzing the graph shown in Figure 9, due to the irradiation on 06/28/2021 being quite reduced and occurring on a Monday, there was very low PV generation. In addition, on that same day, there was no electricity being extracted in stage 1, where battery charging usually occurs, due to the battery bank being charged during the weekend.
Finally, the software quantified the energy contribution levels for the three simulated scenarios showing different levels of energy contribution with percentages of 60.0, 33.6, and 2.7%, respectively. In other words, the higher the installed power, the higher the energy contribution and cost reduction levels would be, which can be reduced to 60.0% when a 320 kWp SFVCR-B and a 366 kWh storage system use lead-acid batteries. In the current scenario, the pilot project system is able to contribute 2.7% of electricity cost savings. However, the option in which the contracted demand of 130 kW is maintained and a 130 kWp SFVCR-B would come into operation, there would be a 33.6% reduction in electricity costs.
With the beginning of the fall season, the irradiation starts to be reduced and this behavior is explained by the decrease in the global horizontal irradiation rates and the tilt angle, as shown in Table 1. Accordoing to Figure 10 in the month of March, due to the decrease in PV generation, the Neoville headquarters would start importing more electricity from the grid and the battery bank would start dispatching energy at lower rates and peak hours.
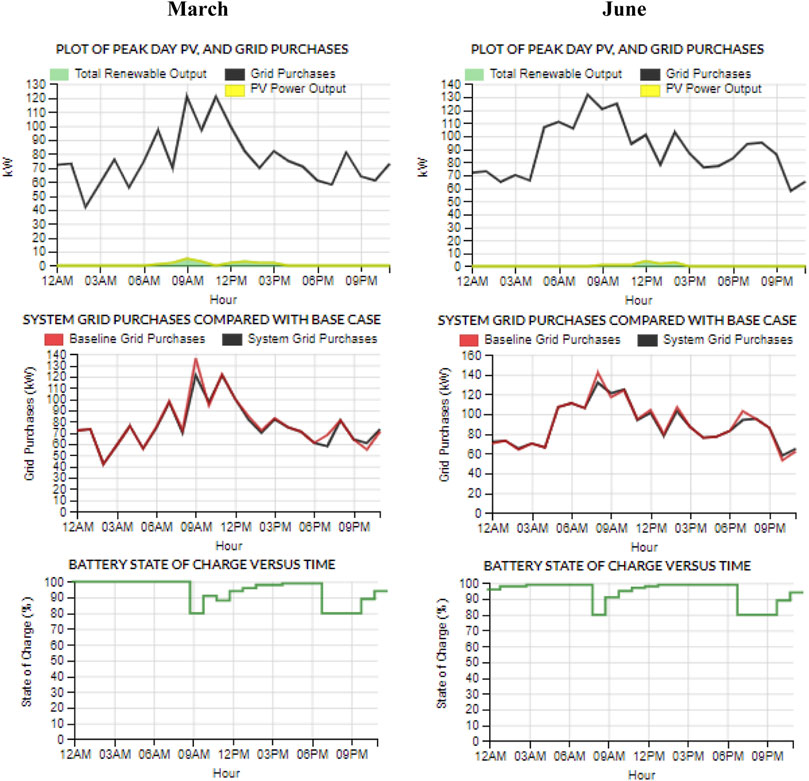
FIGURE 10. The Homer Grid simulation results for the pilot project for the Neoville headquarters in March and June. Data Sources: the authors.
During June, there is an increase in the demand curve, which is justified by the increase in electricity consumption at the Neoville headquarters, as shown in Table 1. Consequently, PV generation would have a smaller contribution, also having an impact on the charging of the passing battery, to be charged more frequently from the utility grid, maintaining the 80% charge state strategy.
The bidirectional inverter installed in this pilot project is capable to measure and register 19 variables, related to voltage, current, and energy, among other quantities and its measuring happens every minute. It works as a BMS (battery management system); however, the State of Charge - SOC and the State of Health - SOH and other functions are still under development with the local manufacturer that can update the algorithm and communication protocols, when the technology replacement is scheduled after 5 years of use. Regarding system reliability, its operating strategy was established only one daily cycle during peak working days. Every year there are 263 battery cycles, providing 3 kWh of energy in each battery bank, totaling 6 kWh for the two battery banks, representing a depth of discharge of 10%. This strategy enables the battery bank in up to 2,500 cycles, which is equivalent to approximately 9.5 years, according to the battery manufacturer.
Conclusion
In order to reduce uncertainties and overcome challenges arising from the mismatch between PV generation and electricity demand, UTFPR - Curitiba campus implemented sustainable strategies. They started with the installation of a technological innovation pilot project at the Neoville headquarters. In this sense, this study contributes to the sustainability transitions, through the application of energy storage systems, and is capable of promoting energy management in this building. With the installation of the pilot project at the university, it was possible to obtain advantages in the three areas of sustainability, as the system is able to avoid costs with electricity tariffs during peak hours. On the environmental issue, there is a benefit of using renewable generation sources and batteries with high recyclability. Overall, the significance of this study is related to the industrial level, due to the development of a national power control unit (bidirectional inverter), and at the community level the ability to enable professional and technological training as well as sociological-environmental impacts.
Additionally, the daily analysis of the PV generation profile confirmed that despite the PV source being quite variable, the scheduled dispatch operation is not interfered with by the variability and intermittency of the solar source, as the system was designed and programmed to operate in parallel with the power grid. Thus, when there is not enough energy to charge the battery bank, this energy is extracted from the electrical network, in order to prolong the life cycle and contribute to the storage capacity. This adopted strategy confirms the effectiveness of the joint operation of the elements of this system. It promotes energy management delivered to the grid and conservation of the battery bank, extending its life cycle, where this study made the greatest contribution and impact.
The installation and operation of a pilot project at UTFPR deserves a primary focus for this research, making its analysis effective in the real conditions of the institution. Therefore, it can be concluded that the application of energy management strategies using SFVCR-B presents itself as a sustainable solution, as it allows the reduction of demand peaks, increasing the energy supply in the electricity sector. At the building level, the most relevant and appropriate modes of operation are peak demand reduction, peak shaving, and self-consumption of energy. The pilot project enabled the investigation and analysis of many variables that interfere with the operation of GTPVS with energy storage. However, there is a need to continue the study knowing variables that were not addressed in this study, such as analysis of the performance, SOC, SOH, and electrical parameters related to the battery.
Data Availability Statement
The original contributions presented in the study are included in the article/Supplementary Material; further inquiries can be directed to the corresponding author.
Author Contributions
Conceptualization: JM; project administration and funding acquisition: JU; methodology: JM; resources: JU; statistical analyses and visualization: JM; and JU; writing—original draft preparation: JM; and writing—review and editing: JU. All authors have read and agreed to the published version of the manuscript.
Funding
The electricity company COPEL-Distribution provided funding through the grant “ANEEL PD2866-0464/2017- Methodology for Analysis, Monitoring and Management of Distributed Generation by encouraged sources.
Conflict of Interest
The authors declare that the research was conducted in the absence of any commercial or financial relationships that could be construed as a potential conflict of interest.
Publisher’s Note
All claims expressed in this article are solely those of the authors and do not necessarily represent those of their affiliated organizations, or those of the publisher, the editors, and the reviewers. Any product that may be evaluated in this article, or claim that may be made by its manufacturer, is not guaranteed or endorsed by the publisher.
Acknowledgments
The authors would like to thank UTFPR for the support and infrastructure made available for the development of this research and COPEL-Distribution for the support and funding. The authors also thank Lactec for their financial support.
References
Akbari, H., Browne, M. C., Ortega, A., Huang, M. J., Hewitt, N. J., Norton, B., et al. (2018). Efficient Energy Storage Technologies for Photovoltaic Systems. Sol. Ener. 192, 144–168. doi:10.1016/j.solener.2018.03.052
Akhil, A. A., Huff, G., Currier, A. B., Kaun, B. C., Rastler, D. M., Chen, S. B., et al. (2013). DOE/EPRI 2013 Electricity Storage Handbook in Collaboration with NRECA. Albuquerque, NM: Sandia National Laboratories, 1–340.
Balcombe, P., Rigby, D., and Azapagic, A. (2015). Energy Self-Sufficiency, Grid Demand Variability and Consumer Costs: Integrating Solar PV, Stirling Engine CHP and Battery Storage. Appl. Energy 155, 393–408. doi:10.1016/j.apenergy.2015.06.017
Cheng, K. W. E., Divakar, B. P., Wu, H., Ding, K., and Ho, H. F. (2010). Battery-management System (BMS) and SOC Development for Electrical Vehicles. IEEE Trans. Veh. Tech. 60, 76–88. doi:10.1109/TVT.2010.2089647
Choudar, A., Barkat, S., Brucker, J. M., and au, J.-M. (2015). A Local Energy Management of a Hybrid PV-Storage Based Distributed Generation for Microgrids. Energy Convers. Manag. 90, 21–33. doi:10.1016/j.enconman.2014.10.067
Debnath, D., and Chatterjee, K. (2016). Solar Photovoltaic‐based Stand‐alone Scheme Incorporating a New Boost Inverter. IET Power Electron. 9, 621–630. doi:10.1049/iet-pel.2015.0112
Duryea, S., Islam, S., and Lawrance, W. (1999). “A Battery Management System for Stand Alone Photovoltaic Energy Systems,” in Conference Record of the 1999 IEEE Industry Applications Conference. Thirty-Forth IAS Annual Meeting (Cat. No. 99CH36370), October 3, 1999 (IEEE) 4, 2649–2654. doi:10.1109/IAS.1999.799211
Ecoult (2019). UltraBattery the New Dimension in Lead–Acid Battery Technology. Available at: http://www.ecoult.com/technology/ultrabattery/(Accessed October 31, 2019).
Feng, X., Gooi, H. B., and Chen, S. (2015). Capacity Fade-Based Energy Management for Lithium-Ion Batteries Used in PV Systems. Electr. Power Syst. Res. 129, 150–159. doi:10.1016/j.epsr.2015.08.011
Gallardo-Lozano, J., Romero-Cadaval, E., Milanes-Montero, M. I., and Guerrero-Martinez, M. A. (2014). Battery Equalization Active Methods. J. Power Sources 246, 934–949. doi:10.1016/j.jpowsour.2013.08.026
Gamarra, C., and Guerrero, J. M. (2015). Computational Optimization Techniques Applied to Microgrids Planning: A Review. Renew. Sustain. Energy Rev. 48, 413–424. doi:10.1016/j.rser.2015.04.025
Gitizadeh, M., and Fakharzadegan, H. (2014). Battery Capacity Determination with Respect to Optimized Energy Dispatch Schedule in Grid-Connected Photovoltaic (PV) Systems. Energy 65, 665–674. doi:10.1016/j.energy.2013.12.018
Hanna, R., Kleissl, J., Nottrott, A., and Ferry, M. (2014). Energy Dispatch Schedule Optimization for Demand Charge Reduction Using a Photovoltaic-Battery Storage System with Solar Forecasting. Sol. Energy 103, 269–287. doi:10.1016/j.solener.2014.02.020
Hanser, P., Lueken, R., Gorman, W., Mashal, J., and Group, T. B. (2017). The Practicality of Distributed PV-Battery Systems to Reduce Household Grid Reliance. Util. Policy 46, 22–32. doi:10.1016/j.jup.2017.03.004
HOMER GRID (2021). Welcome to HOMER Grid. Available at: https://www.homerenergy.com/products/grid/docs/latest/index.html (Accessed June 7, 2021).
Kousksou, T., Bruel, P., Jamil, A., El Rhafiki, T., and Zeraouli, Y. (2014). Energy Storage: Applications and Challenges. Sol. Energy Mater. Sol. Cells 120, 59–80. doi:10.1016/j.solmat.2013.08.015
Krieger, E. M., Cannarella, J., and Arnold, C. B. (2013). A Comparison of Lead-Acid and Lithium-Based Battery Behavior and Capacity Fade in Off-Grid Renewable Charging Applications. Energy 60, 492–500. doi:10.1016/j.energy.2013.08.029
Lawder, M. T., Suthar, B., NorthropDe, P. W. C. S., De, S., Hoff, C. M., Leitermann, O., et al. (2014). Battery Energy Storage System (BESS) and Battery Management System (BMS) for Grid-Scale Applications. Proc. IEEE 102, 1014–1030. doi:10.1109/jproc.2014.2317451
Lawder, M. T., Viswanathan, V., and Subramanian, V. R. (2015). Balancing Autonomy and Utilization of Solar Power and Battery Storage for Demand Based Microgrids. J. Power Sources 279, 645–655. doi:10.1016/j.jpowsour.2015.01.015
Lee, S. B., Pathak, C., Ramadesigan, V., Gao, W., and Subramanian, V. R. (2017). Direct, Efficient, and Real-Time Simulation of Physics-Based Battery Models for Stand-Alone Pv-Battery Microgrids. J. Electrochem. Soc. 164, E3026–E3034. doi:10.1149/2.0031711jes
Lo, K. Y., Chen, Y. M., and Chang, Y. R. (2016). Bidirectional Single-Stage Grid-Connected Inverter for a Battery Energy Storage System. IEEE Trans. Ind. Electr. 64, 4581–4590. doi:10.1109/TIE.2016.2559453
Luo, X., Wang, J., Dooner, M., and Clarke, J. (2015). Overview of Current Development in Electrical Energy Storage Technologies and the Application Potential in Power System Operation. Appl. Energy 137, 511–536. doi:10.1016/j.apenergy.2014.09.081
Mahlia, T. M. I., Saktisahdan, T. J., Jannifar, A., Hasan, M. H., and Matseelar, H. S. C. (2014). A Review of Available Methods and Development on Energy Storage; Technology Update. Renew. Sustain. Energy Rev. 33, 532–545. doi:10.1016/j.rser.2014.01.068
Mariano, J. D., Souza, A. S., and Urbanetz Junior, J. (2021). “Battery Energy Storage System Integration in Photovoltaic Buildings: A Pilot Project in a Brazilian University,” in 5th International Conference of Energy Harvesting, Storage, and Transfer, Virtual Conference, May 21–May 23, 2021, 1–8. doi:10.11159/ehst21.112
Mulder, G., Six, D., Claessens, B., Broes, T., Omar, N., and Mierlo, J. V. (2013). The Dimensioning of PV-Battery Systems Depending on the Incentive and Selling Price Conditions. Appl. Energy 111, 1126–1135. doi:10.1016/j.apenergy.2013.03.059
Nottrott, A., Kleissl, J., and Washom, B. (2013). Energy Dispatch Schedule Optimization and Cost Benefit Analysis for Grid-Connected, Photovoltaic-Battery Storage Systems. Renew. Energy 55, 230–240. doi:10.1016/j.renene.2012.12.036
Pereira, E. B., Martins, F. R., Gonçalves, A. R., Costa, R. S., Lima, F. R., Rüther, R., et al. (2017). Atlas Brasileiro de Energia Solar. 2a edição. São José dos Campos: Inpe, 13.
Pinho, J. T., and Galdino, M. A. (2014). Manual de engenharia para sistemas fotovoltaicos. Rio de Janeiro, RJ: Cresesb - Centro de Referência para Energia Solar e Eólica Sérgio de Salvo Brito Press, 499.
Rahimi-Eichi, H., Ojha, U., Baronti, F., and Chow, M.-Y. (2013). Battery Management System: An Overview of its Application in the Smart Grid and Electric Vehicles. EEE Ind. Electron. Mag. 7, 4–16. doi:10.1109/mie.2013.2250351
Sarkar, T., Bhattacharjee, A., Samanta, H., Bhattacharya, K., and Saha, H. (2019). Optimal Design and Implementation of Solar PV-Wind-Biogas-VRFB Storage Integrated Smart Hybrid Microgrid for Ensuring Zero Loss of Power Supply Probability. Energy Convers. Manag. 191, 102–118. doi:10.1016/j.enconman.2019.04.025
Tiepolo, G. M., Pereira, E. B., Urbanetz, J., Pereira, S. V., Goncalves, A. R., Lima, F. J. L., et al. (2017). Atlas de Energia Solar do Estado do Paraná. Curitiba, PR: Itaipu Binacional Press, 97.
Üçtuğ, F. G., and Azapagic, A. (2018). Environmental Impacts of Small-Scale Hybrid Energy Systems: Coupling Solar Photovoltaics and Lithium-Ion Batteries. Scien. Tot. Envir. 643, 1579–1589. doi:10.1016/j.scitotenv.2018.06.290
Urbanetz Junior, J., Tiepolo, G. M., Junior, E. F. C., Tonin, F. S., and Mariano, J. D. A. (2016). “Geração Distribuída Fotovoltaica: O Caso dos Sistemas Fotovoltaicos da UTFPR em Curitiba,” in Congresso Brasileiro de Planejamento Energético, Gramado-RS, September 26–September 28, 2016.
Keywords: photovoltaic buildings, energy storage, renewable energy fluctuation, battery integration, peak demand reduction
Citation: Mariano JD and Urbanetz Jr J (2022) The Energy Storage System Integration Into Photovoltaic Systems: A Case Study of Energy Management at UTFPR. Front. Energy Res. 10:831245. doi: 10.3389/fenrg.2022.831245
Received: 08 December 2021; Accepted: 18 May 2022;
Published: 05 July 2022.
Edited by:
Sonia Ferreira Pinto, Instituto Superior Técnico, Universidade de Lisboa, PortugalReviewed by:
Narottam Das, Central Queensland University, AustraliaAnkur Bhattacharjee, Birla Institute of Technology and Science, India
Copyright © 2022 Mariano and Urbanetz Jr. This is an open-access article distributed under the terms of the Creative Commons Attribution License (CC BY). The use, distribution or reproduction in other forums is permitted, provided the original author(s) and the copyright owner(s) are credited and that the original publication in this journal is cited, in accordance with accepted academic practice. No use, distribution or reproduction is permitted which does not comply with these terms.
*Correspondence: Juliana D’Angela Mariano, am1hcmlhbm9AbnlpdC5lZHU=