 Wu Jiebo
 Yang Chao1,2*
- 1School of Nuclear Science and Technology, University of South China, Hengyang, China
- 2Research Center for Digital Nuclear Reactor Engineering and Technology of Hunan Province, University of South China, Hengyang, China
Highly accurate activation calculations are the basis of radiation protection optimization design, and the accuracy of activation calculations depends on nuclear data. Based on the ENDF/B-VIII.0 and JEFF3.3 decay evaluation libraries, the influence of different nuclear data on the reactor structural material activation calculation is analyzed, and the nuclear data-related sensitivity and uncertainty quantification of radioactivity, decay heat and photon sources are carried out by the global sensitivity analysis method and the Latin Hypercube Sampling method. Based on uncertainty data in ENDF/B-VIII.0 and JEFF3.3, quantifying the uncertainty of radioactivity, decay heat and photon source in the shutdown dose calculation of reactor structural materials, the maximum uncertainty of radioactivity and decay heat reach 4.54 and 1.45%, respectively. The half-life and decay energy of 55Fe are the main sources of uncertainty.
Introduction
Nuclear data are the basic input parameters of activation calculations, and their accuracy directly affects the activation calculation results (Liem and Sembiring, 2013; Tsilanizara and Huynh, 2021). Uncertainties are unavoidable when nuclear data are obtained through experimental measurements (Awan et al., 2012; Katakura, 2013), and nuclear data uncertainties are propagated in activation calculations, which eventually affect the accuracy of activation calculation results. Therefore, it is necessary to quantify the uncertainty in the activation calculation results caused by nuclear data. ORIGEN2 is a typical depletion and decay code widely used in the design of nuclear power plants and reprocessing plants (Croff, 1980; Croff, 1983). The code uses the matrix exponential method to solve the fuel inventory equation, which is a well-developed theoretical method, so its calculation accuracy depends mainly on the accuracy of the activation library (Mehboob et al., 2013; Foudil et al., 2017). The current activation library that comes with the ORIGEN2 code is processed based on the ENDF/B-VI.8 basic evaluation data library, which inevitably influences the activation calculation results. Therefore, the activation library for the ORIGEN2 code is obtained by processing nuclear data based on the latest version of the JEFF3.3 and ENDF/B-VIII.0 decay evaluation libraries (McLane, 1996; Herman, 2009; Brown et al., 2018; Trkov et al., 2018; Plompen et al., 2020). The two new versions of the decay evaluation libraries are compared to the ENDF/B-VI.8. First, the improvement of the experimental method making the measured nuclear data closer to the real values. Second, the new version of the evaluation libraries gives the variance information that can evaluate the uncertainty of the nuclear data, which is the basis for the uncertainty analysis performed in the paper. Therefore, based on uncertainty data in ENDF/B-VIII.0 and JEFF3.3, the uncertainty analysis program SIMLAB is used to carry out uncertainty quantification analysis and sensitivity analysis of the activation source term radioactivity, decay heat and photon source of the reactor structural materials after shutdown.
Theoretical Foundation
Activation Library Processing
The processing flow of the ORIGEN2 activation library is shown in Figure 1. Based on ENDF/B-VIII.0 and JEFF3.3 decay evaluation libraries, the half-life, decay energy, decay type, decay branching ratio and abundance of nuclides to be processed are read, and then the data are stored according to activation product group, fission product group and actinide group like the format of the ORIGEN2 activation library. Finally, the card image format library is generated.
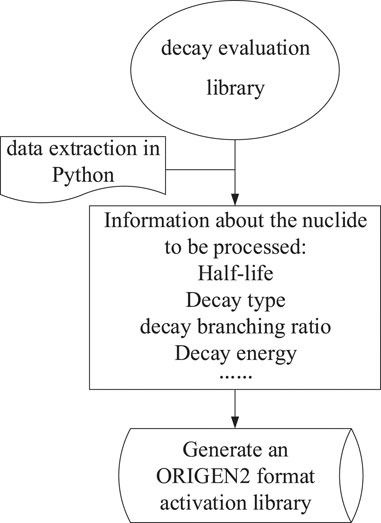
FIGURE 1. ORIGEN2 activation library processing flowchart.
Uncertainty Analysis Theory
Uncertainty quantification refers to determining the effect of input uncertainty on the model output. The main data-driven algorithms for uncertainty quantification include: the sampling statistics method, the alternative model method, the UMAE method (uncertainty methodology based on accuracy extrapolation), and the deterministic approach (Briggs, 2009).
The Latin Hypercube Sampling method was chosen as the sampling method due to its widespread use in reactor physics. For the number of samples, a nonparametric statistical method (Wilks formula) was used to determine the minimum number of n that samples required, based on the confidence level b of the distribution interval and the probability of the output parameter a. The Wilks formula is (Wilks, 1942):
Eq. 1 applies to the single-side limit distribution, and Eq. 2 applies to the bilateral limit distribution.
The minimum sample size n satisfying different confidence levels and tolerance intervals calculated by the Wilks formula are shown in Table 1. Based on nonparametric statistical theory, when the minimum sample size is 59, the upper tolerance limit value of the target parameter takes the maximum value; when the minimum sample size is 93, the upper tolerance limit value of the target parameter takes the next largest value (Mui and Kozlowski, 2018).
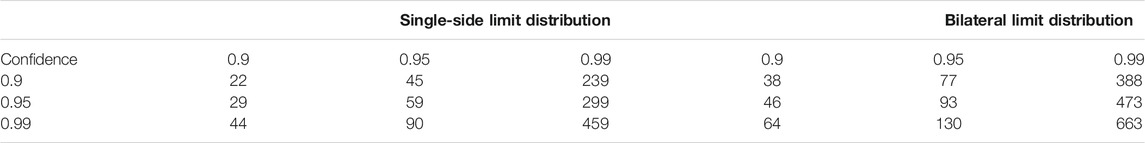
TABLE 1. Minimum samples with different confidence levels and tolerance intervals.
Uncertainty Analysis Program SIMLAB
Based on the above approach, this paper uses the SIMLAB program developed by the JRC (Joint Research Center) in Europe to perform uncertainty analysis (Bieda, 2012), which applies the LHS method, and has been carried out for uncertainty and sensitivity analysis in the fields of economics as well as fuzzy inference systems. The SIMLAB program includes a statistical preprocessing module, an execution module, and a statistical postprocessing module. The statistical preprocessing module of the SIMLAB program provides parameter distribution types and sampling methods, and users can choose different parameter distributions in SIMLAB, including normal, uniform, and discrete distributions. You can also create a new functional relationship and visualize the parameter distributions in the statistical preprocessing module of SIMLAB. The execution module needs a seed number (usually with more than a five-digit number) and then samples to generate the required number of samples. The statistical postprocessing module of the SIMLAB program is used for uncertainty analysis and sensitivity assessment. Uncertainty analysis can visualize the probability distribution of parameters and give statistical results such as the mean value, variance, standard deviations and maximum and minimum values of parameters. Sensitivity assessment gives the correlation coefficient or sensitivity index of input and output parameters.
Activation Calculation Uncertainty Analysis
As in Figure 2, the uncertain input parameters in the activation calculation are randomly sampled through the model import module interface in the SIMLAB program to generate the sample files. First, the sample files are passed to the ORIGEN2 code, and the output files are obtained by calculation. Second, the output files are passed back to the SIMLAB program through the external interface of the execution module, and the SIMLAB program is applied to statistically analyze the correlation coefficients of the sample input parameters and the output parameters. Finally, a sensitivity analysis of the output parameters is performed. The calculation process is shown in Figure 3: 1) Determine the nuclides that have important effects on the radioactivity, decay heat and photon source in the activation calculation model; 2) Specify the range of values and probability distribution of nuclear data of nuclides, select the sampling method and obtain different sample combinations; 3) Pass the sample combinations obtained by sampling to the ORIGEN2 code for calculation and obtain the output file; 4) Pass the output file to the SIMLAB program and use the program to perform sensitivity analysis on the results and obtain the correlation coefficients of the input and output values.
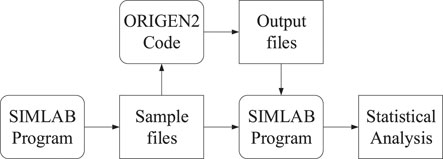
FIGURE 2. SIMLAB and ORIGEN2 coupling method.
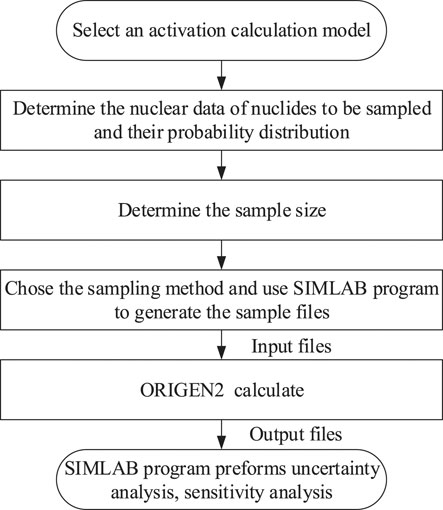
FIGURE 3. Calculation flowchart of the uncertainty method.
Reactor Structural Material Activation Calculation Uncertainty Analysis
Based on the above analysis, different nuclear data have a great impact on the activation calculation. Therefore, it is necessary to quantify the uncertainties in activation calculations introduced by the differences in nuclear data, and to clarify the important influencing nuclides in activation calculations for reactor structural materials.
NUREG/CR-6115 Reactor Structural Material Model
The important structural components in a pressurized water reactor are covered in the NUREG/CR-6115 reactor model. The reactor core has a total of 204 boxes of 21.485 × 21.485 × 335.28 cm3 fuel assemblies (Carew, 2001). The top and bottom of the core are reactor reflectors, and the radial periphery of the core is an envelope with a thickness of 1.5875 cm. The nuclide composition of the structural materials of the pressurized water reactor model is shown in Table 2.
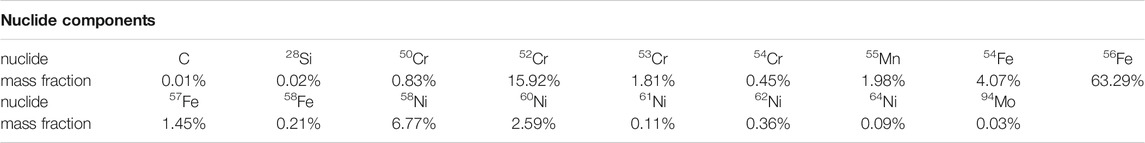
TABLE 2. Nuclide composition of 6,115 structural materials.
Selection of Uncertainty Parameters
First, the NUREG/CR-6115 reactor structure material model was irradiated for 50 years with a neutron injection rate of 1×1013 cm−2 s−1 and a shutdown time of 48 years. Using ORIGEN2 to output the nuclides with large contributions to radioactivity, decay heat and photon source during the 48-years time period after reactor shutdown.
We can see in Table 3, that dividing the time after reactor shutdown into three phases, the nuclides that have a large influence on the radioactivity, decay heat and photon source are 54Mn, 56Mn, 55Fe, 58Co, 64Cu and 66Cu, so after comprehensive consideration, these six nuclides are finally selected as uncertainty input parameters.
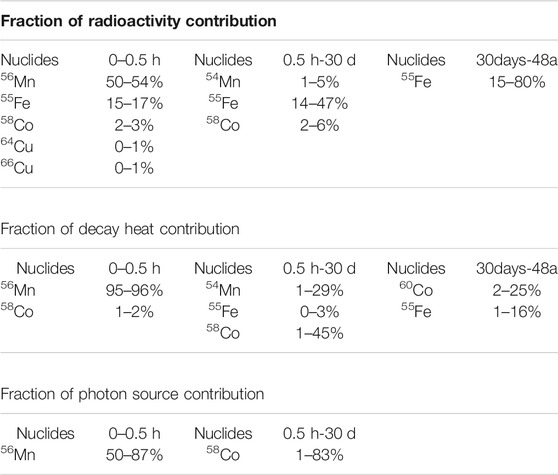
TABLE 3. The nuclides with large contributions to radioactivity, decay heat and photon source.
The six nuclides were finally determined as uncertainty input parameters with normal distribution of half-life and uniform distribution of decay energy, where the uncertainty variance information of decay energy is given by the evaluation data library of ENDF/B-VIII.0, and the uncertainty variance information of half-life is not provided by the evaluation data library, so the uncertainty information is obtained by the differences of ENDF/B-VI.8, ENDF/B-VIII.0 and JEFF3.3, with a more conservative uncertainty range taken as shown in Table 4. It should be pointed out that the uncertainty given in Table 4 is only part of the uncertainty sources, in which only six radionuclides that have a clear influence on radioactivity and decay heat in the reactor structure material are considered.
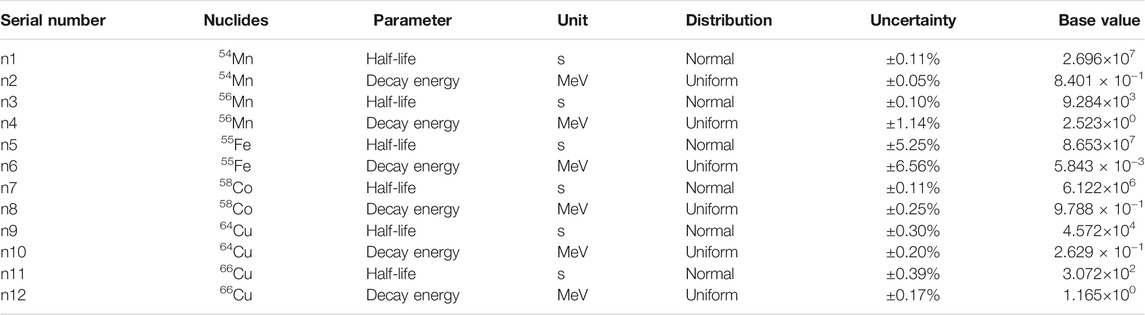
TABLE 4. Uncertainty input parameter information.
Finally, the important characteristic parameters of radioactivity, decay heat and photon source are used as uncertainty output parameters in the analysis of NUREG/CR-6115 reactor structural material activation calculations.
Uncertainty Analysis
The Latin hypercube method was selected to sample the input parameters, and according to Table 1, the minimum sample size to satisfy the two 95% bilaterally limited distributions was 93. For conservative estimation, 100 samples were taken as inputs (Zhao et al., 2021), and the 12 input parameters were sampled with the distribution shown in Figure 4.
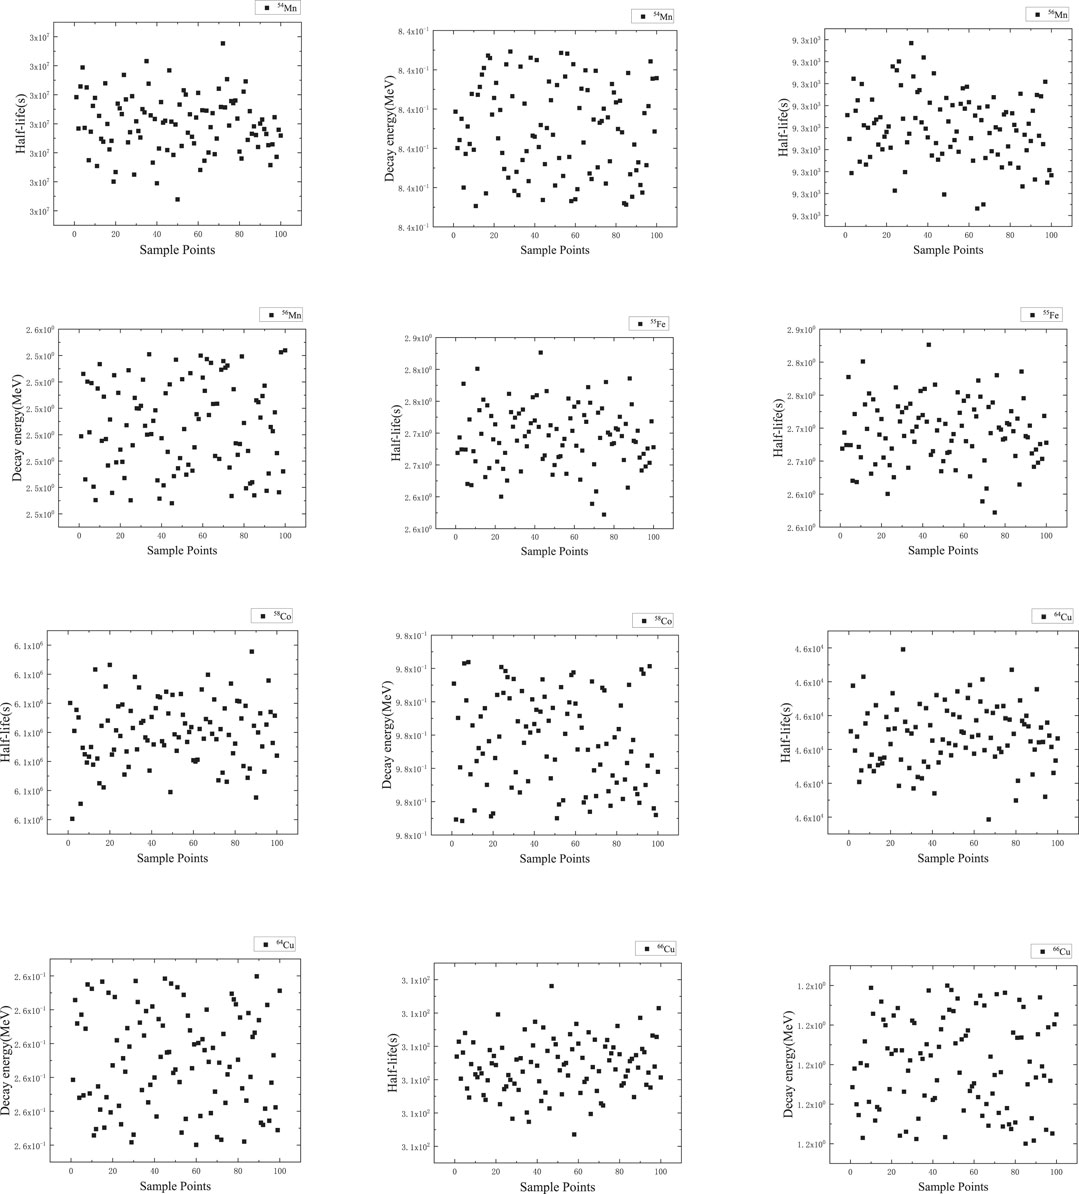
FIGURE 4. Distribution of half-lives and decay energies of nuclides.
To detect the distribution of the input parameters intuitively, the input parameters are normalized. Assuming that the upper limit value of the ith parameter is Uij, the lower limit value is Lij, and the parameter value of the jth sample is Kij, the normalized result Xij as Eq. 3:
It can be seen that the value of Xij is between 0 and 1. The distribution state of the sample in the interval reflects the kind of distribution to which it belongs. The normalized distribution of hypercube sampling samples is shown in Figure 5. It is evident that the normalized half-life parameter sample points are clustered in the middle and sparse on both sides, obeying a normal distribution; the decay energy sample points are distributed with equal probability in the interval, so the input parameters obey a uniform distribution, which verifies the rationality of the input parameter sampling.
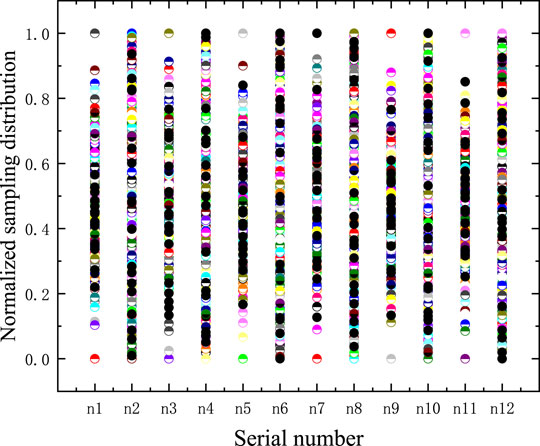
FIGURE 5. Normalized distribution of Latin hypercube sampling.
Figure 6A, Figure 6C, and Figure 6E show the changes in radioactivity, decay heat, and photon source over time for 100 different nuclear data samples from the NUREG/CR-6115 reactor structural material activation calculations. Figure 6B and Figure 6D show partially enlarged details from 2 to 11 years for radioactivity and decay heat (within the gray rectangle in Figure 6A and Figure 6C), respectively. Figure 6F shows the uncertainty variation of the calculated results for radioactivity, decay heat, and photon source for 48 years after reactor shutdown.
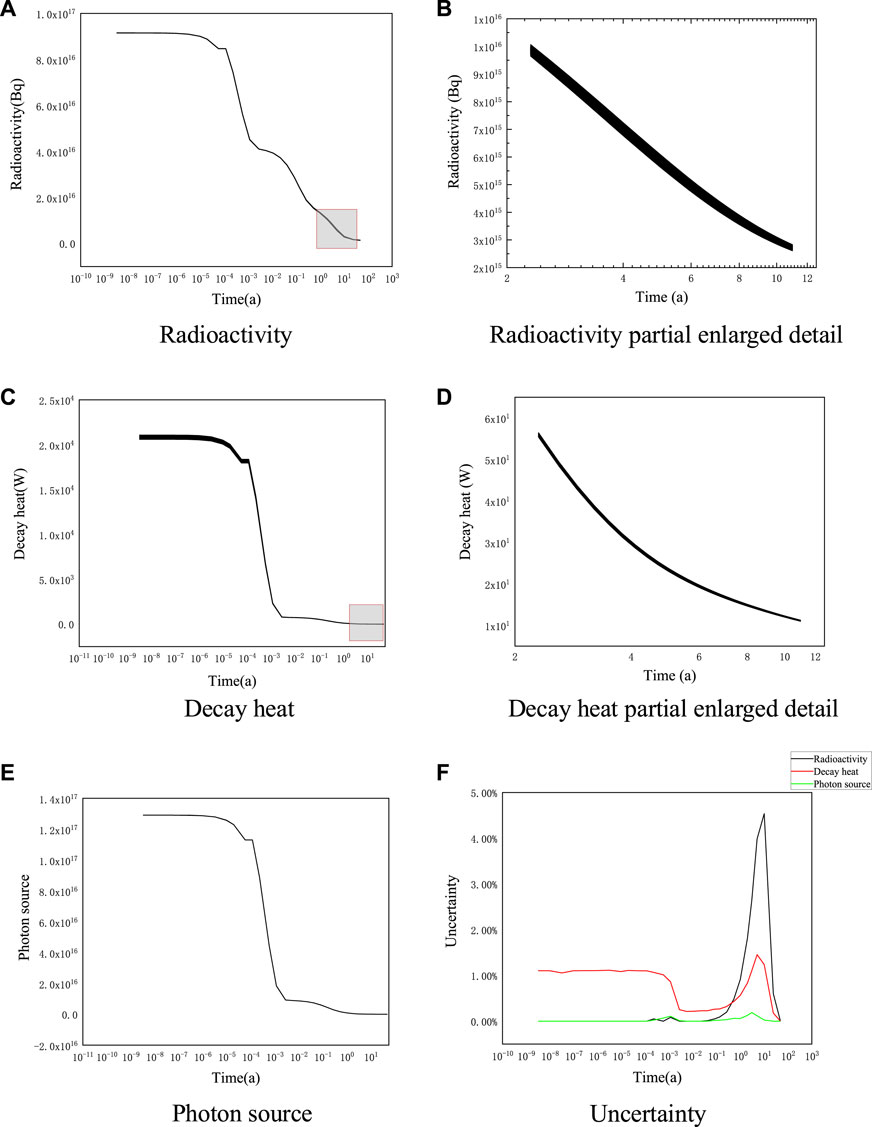
FIGURE 6. NUREG/CR-6115 structural material radioactivity, decay heat and photon uncertainty. (A) Radioactivity (B) Radioactivity partial enlarged detail (C) Decay heat (D) Decay heat partial enlarged detail (E). Photon source (F) Uncertainty.
The perturbation of nuclear data has a small effect on the photon source, and the uncertainty will reach a maximum of 4.54% at the 10th year of shutdown for radioactivity. The reason is that the half-life of 55Fe has great uncertainty, and 55Fe is the main contributor to radioactivity. From Table 4, it can be seen that 55Fe has the longest half-life of 2.774 years among the six nuclides, and from Table 3, it can be seen that the reactor structure material has the largest proportion of Fe by mass. These two reasons lead to the fact that 55Fe will have the largest impact on the inventory and radioactivity at this time. The uncertainty introduced by the half-life of 55Fe as a main contributing nuclide will be shown during this time. The uncertainty of the decay heat is approximately 1% within 1 day of the shutdown, and the decay heat is mainly produced by 56Mn and 58Co. From Table 4, the half-lives of 56Mn and 58Co were 2.579 h and 70.856 days, respectively, so the uncertainty is introduced by 56Mn and 58Co during this time. The uncertainty of the decay heat starts to rise to the maximum value of 1.45% at 5 years, because the 55Fe decay heat contribution is increasing (15.52%) at this time, which also introduces uncertainty to the decay heat. The maximum value of 0.19% uncertainty in the photon source occurs in the third year, which is the main photon source emitted by 54Mn. From Table 4, the half-life of 54Mn is 312.037 days. Additionally, the uncertainty is introduced by 54Mn.
Sensitivity Analysis
The Spearman correlation coefficient is one of the commonly used global sensitivity analysis methods to test the sensitivity of multiple input parameters to the response parameters (Sedgwick, 2014). The Spearman correlation coefficient was used as an output parameter for the analysis of radioactivity, decay heat and photon source sensitivity, and the correlation coefficient takes values in the range of [-1,1]. The magnitude of the absolute value indicates the strength of the sensitivity; the positive sign of the value indicates a positive correlation, the negative sign indicates a negative correlation, and 0 indicates no correlation, and its expression is shown in Eq. 4.
Where,
As shown in Figure 7, in the field of statistics, the correlation coefficient is defined as extremely strong correlation from 0.8 to 1, strong correlation from 0.6 to 0.8, moderate correlation from 0.4 to 0.6, weak correlation from 0.2 to 0.4, and extremely weak correlation from 0 to 0.2. Since the uncertainty in radioactivity is highest at the 10th year after reactor shutdown, the correlation between the input and output values (the half-life and decay energy of the nucleus are input values, and the radioactivity, decay heat and photon source are output values) at that moment is calculated in Figure 7. Therefore, the half-life of 55Fe is extremely strongly correlated with the decay heat and photon source, and the decay energy of 55Fe is extremely strongly correlated with the decay heat; it can also support the fact that the uncertainty introduced by 55Fe in the previous section is the largest. The half-life of 54Mn is moderately correlated with radioactivity, and the half-life and decay energy of other nuclides are weakly and extremely weakly correlated with the response of the three output parameters.
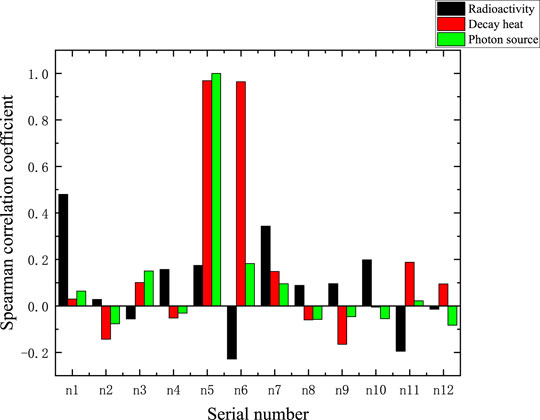
FIGURE 7. Spearman’s correlation coefficient of input and output parameters at 10th year.
Conclusion
In this paper, the activation library of the depletion and decay code ORIGEN2 was updated based on ENDF/B-VIII.0 and JEFF3.3 decay evaluation libraries, and uncertainty quantification analysis of activation calculations and global sensitivity analysis of nuclear data were carried out. The conclusions are as follows.
(1) The uncertainties of radioactivity, decay heat and photon source of the reactor structure material within 48 years of reactor shutdown due to nuclear data perturbation are obtained by uncertainty analysis, and the radioactivity will reach the maximum uncertainty of 4.54% at 10 years and the maximum uncertainty of 1.45% for decay heat at 5 years.
(2) The Spearman correlation coefficient shows that the changes in its half-life and decay energy have the greatest influence on the radioactivity, decay heat and photon source of the structural material after the reactor is deactivated. Therefore, for the design of the scheme of radiation shielding of the reactor structural material, the half-life and decay energy of 55Fe should be determined more precisely to improve the accuracy of the activation calculation.
Data Availability Statement
The original contributions presented in the study are included in the article/supplementary material, further inquiries can be directed to the corresponding authors.
Author Contributions
YC:Conceptualization, Methodology, Software WJ:Data curation, Writing Original draft preparation YT:Visualization, Investigation CZ:Supervision.
Funding
This work is supported by the National Natural Science Foundation of China (approved number: 12105136), the Hunan Province Natural Science Foundation of China (approved number: 2021JJ40449), and the Doctoral Research Fund of University of South China.
Conflict of Interest
The authors declare that the research was conducted in the absence of any commercial or financial relationships that could be construed as a potential conflict of interest.
Publisher’s Note
All claims expressed in this article are solely those of the authors and do not necessarily represent those of their affiliated organizations, or those of the publisher, the editors, and the reviewers. Any product that may be evaluated in this article, or claim that may be made by its manufacturer, is not guaranteed or endorsed by the publisher.
References
Awan, S. E., Mirza, N. M., and Mirza, S. M. (2012). Kinetic Study of Fission Product Activity Released inside Containment under Loss of Coolant Transients in a Typical MTR System. Appl. Radiat. Isot. 70 (12), 2711–2719. doi:10.1016/j.apradiso.2012.08.002
Bieda, B. (2012). “Risk Analysis of the Waste to Energy Pyrolysis Facility Designs for City of Konin, in Poland, Using SimLab® Toolpack,” in Novel Approaches and Their Applications in Risk Assessment (London, UK: intechopen), 245.
Briggs, L. L. (2009). Uncertainty Quantification Approaches for Advanced Reactor Analyses. Lemont: Argonne National Laboratory.
Brown, D. A., Chadwick, M. B., Capote, R., Kahler, A. C., Trkov, A., Herman, M. W., et al. (2018). ENDF/B-VIII.0: The 8 Th Major Release of the Nuclear Reaction Data Library with CIELO-Project Cross Sections, New Standards and Thermal Scattering Data. Nucl. Data Sheets 148, 1–142. doi:10.1016/j.nds.2018.02.001
Carew, J. F. (2001). PWR and BWR Pressure Vessel Fluence Calculation Benchmark Problems and Solutions. North Bethesda: Division of Engineering Technology, Office of Nuclear Regulatory Research, US Nuclear Regulatory Commission.
Croff, A. G. (1983). ORIGEN2: a Versatile Computer Code for Calculating the Nuclide Compositions and Characteristics of Nuclear Materials. Nucl. Tech. 62 (3), 335–352. doi:10.13182/NT83-1
Croff, A. G. (1980). User's Manual for the ORIGEN2 Computer Code (No. ORNL/TM--7175). Oak Ridge: Oak Ridge National Lab.
Foudil, Z., Mohamed, B., and Tahar, Z. (2017). Estimating of Core Inventory, Source Term and Doses Results for the NUR Research Reactor under a Hypothetical Severe Accident. Prog. Nucl. Energ. 100, 365–372. doi:10.1016/j.pnucene.2017.07.013
Herman, M.Cross Sections Evaluation Working Group (2009). ENDF-6 Formats Manual Data Formats and Procedures for the Evaluated Nuclear Data File ENDF/B-VI and ENDF/B-VII (No. BNL-90365-2009). Brookhaven National Lab. (BNL), Upton, NY (United States). Upton, New York: National Nuclear Data Center.
Katakura, J.-i. (2013). Uncertainty Analyses of Decay Heat Summation Calculations Using JENDL, JEFF, and ENDF Files. J. Nucl. Sci. Tech. 50 (8), 799–807. doi:10.1080/00223131.2013.808004
Liem, P. H., and Sembiring, T. M. (2013). Development of New ORIGEN2 Data Library Sets for Research Reactors with Light Water Cooled Oxide and Silicide LEU (20w/o) Fuels Based on JENDL-3.3 Nuclear Data. Nucl. Eng. Des. 262, 52–62. doi:10.1016/j.nucengdes.2013.03.049
McLane, V. (1996). ENDF-201, ENDF/B-VI Summary Documentation Supplement 1, ENDF/HE-VI Summary Documentation (No. BNL-NCS--17541-ED. 4-SUPPL. 1). Upton, New York: Brookhaven National Lab.
Mehboob, K., Xinrong, C., Ahmed, R., and Ali, M. (2013). Numerical Simulation of Radioisotope's Dependency on Containment Performance for Large Dry PWR Containment under Severe Accidents. Nucl. Eng. Des. 262, 435–451. doi:10.1016/j.nucengdes.2013.05.021
Mui, T., and Kozlowski, T. (2018). Confirmation of Wilks' Method Applied to TRACE Model of Boiling Water Reactor spray Cooling experiment. Ann. Nucl. Energ. 117, 53–59. doi:10.1016/j.anucene.2018.03.011
Plompen, A. J. M., Cabellos, O., De Saint Jean, C., Fleming, M., Algora, A., Angelone, M., et al. (2020). The Joint Evaluated Fission and Fusion Nuclear Data Library, JEFF-3.3. The Eur. Phys. J. A 56 (7), 181. doi:10.1140/epja/s10050-020-00141-9
Trkov, A., Brown, D. A., and Brown, D. A. (2018). ENDF-6 Formats Manual: Data Formats and Procedures for the Evaluated Nuclear Data Files (No. BNL-203218-2018-INRE). Upton, NY: Brookhaven National Lab. doi:10.2172/1425114
Tsilanizara, A., and Huynh, T. D. (2021). New Feature of DARWIN/PEPIN2 Inventory Code: Propagation of Nuclear Data Uncertainties to Decay Heat and Nuclide Density. Ann. Nucl. Energ. 164, 108579. doi:10.1016/j.anucene.2021.108579
Wilks, S. S. (1942). Statistical Prediction with Special Reference to the Problem of Tolerance Limits. Ann. Math. Statist. 13 (4), 400–409. doi:10.1214/aoms/1177731537
Keywords: nuclear data, activation calculation, uncertainty quantification, sensitivity analysis, evaluation library
Citation: Jiebo W, Chao Y, Tao Y and Zhenping C (2022) Uncertainty Analysis of Reactor Structure Material Activation Calculation Induced From Nuclear Data. Front. Energy Res. 10:841998. doi: 10.3389/fenrg.2022.841998
Received: 23 December 2021; Accepted: 27 January 2022;
Published: 14 February 2022.
Edited by:
Yapei Zhang, Xi’an Jiaotong University, ChinaCopyright © 2022 Jiebo, Chao, Tao and Zhenping. This is an open-access article distributed under the terms of the Creative Commons Attribution License (CC BY). The use, distribution or reproduction in other forums is permitted, provided the original author(s) and the copyright owner(s) are credited and that the original publication in this journal is cited, in accordance with accepted academic practice. No use, distribution or reproduction is permitted which does not comply with these terms.
*Correspondence: Yang Chao, eWFuZ2MwNjZAMTYzLmNvbQ==; Yu Tao, eXV0YW8yOUBzaW5hLmNvbQ==