 Jonathan D. Ogland-Hand
 Benjamin M. Adams2
 Richard S. Middleton
- 1Carbon Solutions LLC, Bloomington, IN, United States
- 2Independent Researcher, Minneapolis, MN, United States
CO2 Plume Geothermal (CPG) power plants can use gigatonne-levels of CO2 sequestration to generate electricity, but it is unknown if the resources that support low-cost CPG power align with the resources that support low-cost CO2 sequestration. Here, we estimate and compare the geospatially-distributed cost of CPG and CO2 storage across a portion of North America. We find that the locations with lowest-cost CO2 storage are different than the locations with lowest-cost CPG. There are also locations with low-cost CO2 storage (<$5/tCO2) that do not support CPG power generation due to insufficient reservoir transmissivity or temperature. Thus, CPG development may require electricity prices that are greater than the levelized cost of electricity (LCOE) to offset the increased cost of sequestration. We introduce the “Additional Cost of Electricity (ACOE)” metric to account for this cost and add it to the LCOE to calculate breakeven electricity prices that are required for CPG development. We find that breakeven prices are lower when new CO2 injection wells are drilled specifically for CPG (i.e., “greenfield” CPG development) compared to if only existing CO2 sequestration injection wells are used (i.e., “brownfield” CPG development). This is because comparatively few wells are needed for sequestration-only, and the increased power capacity from having more CPG wells outweighs the increased costs from more drilling. We also find that sequestered CO2 could be used to approximately triple the United States geothermal electricity power capacity via a single CPG “sweet spot” in South Dakota, but that breakeven electricity price for this development is on the order of $200/MWeh.
1 Introduction
1.1 Background and Motivation
Geologic CO2 sequestration is the injection of CO2 into the subsurface to permanently isolate it from the atmosphere, and is part of CO2 capture and storage (CCS), where CO2 is captured from large point sources or the air directly, possibly transported, and then injected underground (Bui et al., 2018; IPCC, 2005). Geologic CO2 storage is essential for meeting climate goals. The Intergovernmental Panel on Climate Change suggests that limiting climate warming to 1.5°C or 2°C could require injecting up to ∼1,200 gigatonnes of CO2 (GtCO2) by 2,100 (Rogelj et al., 2018), which may require injecting up to ∼70 GtCO2/yr (Zahasky and Krevor, 2020). For reference, global CCS infrastructure only supported injecting ∼40 million tonnes of CO2 per year (40 MtCO2/yr, or 0.04 GtCO2/yr) in 2020 (Global CCS Institute, 2020). In the United States, the Princeton Net Zero America study suggests that injecting between 0.9 and 1.7 GtCO2/yr is required to transition the country to a net-zero emission economy by 2050, which is 1.3–2.4 times larger than the country’s oil production on a volume equivalent basis and entails drilling thousands of CO2 injection wells across the country (Larson et al., 2020; Jenkins et al., 2021).
While sequestering CO2 across the United States and the world is necessary to address climate change, deciding where to inject the CO2 is not simple. Saline aquifers in sedimentary basins are the primary geologic formations considered for CO2 sequestration and the cost and capacity of a given CO2 storage site are dependent on the geology of these aquifers, which is inherently uncertain (Anderson, 2017; Middleton et al., 2020b; Vikara et al., 2017). First, even after a potential site has been thoroughly characterized, which requires substantial time and investment in itself, the CO2 injectivity and capacity of the site, and thus its cost, is largely unknown until at-scale CO2 injection starts (Eiken et al., 2011). Second, while sedimentary basins are ubiquitous (e.g., underlying approximately half of North America (NETL, 2015)), the geology of these formations also varies geospatially, so the cost and capacity of CO2 sequestration can change from one location to another (Ogland-Hand et al., 2022b). Third, knowledge of the lowest-cost CO2 sequestration locations alone is insufficient because the CO2 sources, CO2 transportation network, and existing energy infrastructure can all influence the targeted sequestration location (Hannon and Esposito, 2015; Grant et al., 2018; Middleton and Yaw, 2018). For example, it is possible that the lowest-cost CO2 sequestration site may not be the least-cost location to target when also considering the location of CO2 sources and the transportation infrastructure required to connect them together. Or, if the CO2 source is an electric power plant, it is also possible that injecting CO2 at more expensive sequestration sites is optimal if it avoids building new electricity transmission infrastructure (Ogland-Hand et al., 2022a).
In addition to these previously studied and more well-known considerations, the location for CO2 storage may also be influenced by the option of using the sequestered CO2 to generate electricity with a CO2 Plume Geothermal (CPG) power plant. In CPG power plants, geologically stored CO2 is used as a geothermal heat extraction fluid: a portion of the sequestered CO2 is intentionally produced back to the surface with a production well, expanded through a turbine to generate electricity, cooled and condensed, then re-injected with an injection well so none of the CO2 is released back to the atmosphere (Adams et al., 2015). While water is traditionally used to extract geothermal heat for power production, our prior work demonstrated that using CO2 results in more geothermal heat extracted and in lower-cost electricity generation (Adams et al., 2021, 2015). As a consequence, it is possible that CPG technology could expand the geothermal power resource base to include sedimentary basins, which have historically been excluded from geothermal power assessments (Adams et al., 2021; Van Brummen et al., 2022).
In addition to its potential to expand the geothermal resource base, CPG is also the only CO2 utilization technology we are aware of that can leverage gigatonne-levels of CO2 sequestration required to meet climate goals. For example, our prior work suggests that the CO2 requirements of CPG are on the order of 2 to 7 MtCO2/MWe, depending on the geology of the CO2 sequestration site (Adams et al., 2021). Thus, depending on the geology, the suggested 0.9 to 1.7 GtCO2/yr from the Princeton Net Zero America may support between 1.2 and 7.8 GWe/yr of CPG power capacity. For reference, the total installed capacity of geothermal power plants across the entire United States is ∼3.8 GWe (EIA, 2020). Consequently, there could be substantial value for sequestration projects to consider the potential for CPG when deciding where to inject CO2, especially because dispatchable low-carbon power (i.e., geothermal plants) has been shown to reduce the cost of decarbonizing electricity (Sepulveda et al., 2018; Bistline and Blanford, 2020). Despite this possibility, how the potential for CPG power generation may affect the location of CO2 sequestration has yet to be quantitatively investigated.
1.2 Contributions of This Paper
In this paper, we estimate the geospatial cost of CPG power and compare it to the geospatial cost of CO2 storage. This is novel for multiple reasons. For one, it is the first study to estimate the geospatial cost of CPG power and present fine-resolution supply curves for CPG power plants. This builds upon our prior work that presented lower-resolution capacity and cost estimates for CPG power plants (Adams et al., 2021). Our higher-resolution investigation allows us to answer, for example, if CPG power plants can be deployed across an entire sedimentary basin. Second, by comparing the geospatial costs of CPG and CO2 storage to one another, we are the first to investigate if the low-cost locations for CPG align with the low-cost locations for CO2 storage. This knowledge could have substantial implications for the future of both CPG and CCS. Lastly, our study is also the first to quantify the power implications of using pre-existing CO2 storage injection wells in CPG power plants (i.e., “brownfield” development) instead of drilling new injection wells (i.e., “greenfield” development). Our prior work demonstrated that brownfield development reduced the cost of CPG power plants compared to greenfield development, but did not investigate the impact of constraining the number of CPG power plants to the number of CO2 injection wells (Adams et al., 2021).
2 Materials and Methods
Our methodology consists of integrating pre-existing data and tools over three tasks:
1) Enhancing the professional version of the Sequestration of CO2 Tool [SCO2TPRO (Middleton et al., 2020a, 2020b; Ogland-Hand et al., 2022b), referred to as SCO2T in this paper] to estimate the cost of CPG and the power that a single CPG power plant could generate as a function of the five geologic properties that define a saline aquifer: geothermal temperature gradient, permeability, net thickness, porosity, and depth (or pressure). Section 2.1 further describes these enhancements. Section 2.1 also describes the CO2 storage site design conditions (e.g., number of monitoring wells per injection well) assumed within SCO2T for this study.
2) Applying SCO2T to a portion of the NATCARB dataset to determine the geospatial variability in the cost and capacity of geologic CO2 storage and of CPG power plants at a fine resolution. Section 2.2 describes this dataset and how it was used in this study.
3) Using the output data from SCO2T to estimate a) the levelized cost of electricity (LCOE) of CPG power; b) the total number of CPG power plants that a given area, volume of sequestered CO2, and CO2 injection wells could support, and c) the breakeven price of electricity needed to inject CO2 in the lowest-cost location for CPG compared to the lowest-cost location for CO2 storage. Section 2.3 describes these calculations.
2.1 Enhancements Made to SCO2T and Input Assumptions
SCO2T is an Excel-based tool that replicates full-physics dynamic reservoir simulations via reduced-order models to estimate the capacity and cost of geologic CO2 storage given five primary geologic properties (Chen et al., 2020; Middleton et al., 2020a; Middleton et al., 2020b; Ogland-Hand et al., 2022a; Ogland-Hand et al., 2022b). As such, when applied to an input dataset of geospatial geologic properties, SCO2T can be used to estimate the geospatially-distributed cost and capacity of CO2 storage. Section 2.1.1 describes how we enhanced SCO2T to also estimate the geospatial cost and capacity of CPG when applied to an input dataset of geospatial geologic properties.
Additionally, our prior work demonstrates that the site-level design factors of CO2 storage sites (e.g., number of monitoring wells drilled per injection well) can change the cost of geologic CO2 storage by a similar order of magnitude as geology (Ogland-Hand et al., 2022a). These site-level design factors are specified in SCO2T as user inputs. Section 2.1.2 describes the input assumptions used for this study.
2.1.1 Enhancements
Our prior work used the generalizable GEOthermal techno-economic simulator (genGEO) to estimate the cost and capacity of a CPG power plant over a large parameter space of reservoir depths, geothermal temperature gradients, and reservoir transmissivities (Adams et al., 2021). The reservoir transmissivity is the product of the reservoir thickness and permeability. This genGEO output data, which is publicly available on GitHub (https://github.com/GEG-ETHZ/genGEO), includes the specific capital cost of brownfield and greenfield CPG power plants [$/kWe] and the power generated by a single CPG power plant [MWe] for each combination of geologic conditions across the parameter space. In our prior work, we used the subset of this output data with a 35°C/km temperature gradient as a look-up table to estimate the specific cost and power capacity of a CPG power plant using 2-D linear interpolation (Adams et al., 2021). Here we follow the same approach: we create an Excel MACRO within SCO2T that uses 3-D linear interpolation (across depth, transmissivity, and temperature gradient) to estimate the generation capacity of a single CPG power plant and the specific capital cost for any combination of geologic input data. As such, we improve upon our prior work by no longer assuming a constant temperature gradient and embedding this interpolation within SCO2T directly.
The genGEO output data is in 2019 dollars and we use the dollar year adjustment factors from the Regional Energy Deployment System model to adjust to 2017 dollars, which are currently used in SCO2T (NREL, 2019).
2.1.2 Input Assumptions
In this study, we use the baseline SCO2T input assumptions that our prior work suggests provides representative costs across different scenarios of site-level designs (Ogland-Hand et al., 2022a), with thirteen exceptions:
1) A square well pattern
2) CO2 injection well diameter of 0.41 m
3) One CO2 injection well per site
4) A maximum of 1 MtCO2/yr injected per site
5) Zero brine production wells per site
6) One CO2 injection pump per well
7) Zero stratigraphic wells/site
8) Zero old oil and gas wells per site that must be plugged prior to CO2 injection
9) Zero old water drinking wells that need to be plugged prior to injection
10) Zero back-up CO2 injection wells drilled per site
11) Zero above-zone monitoring wells drilled per injection well
12) One in-zone monitoring well drilled per injection well
13) Zero drinking water monitoring wells drilled per injection well
We change these thirteen input assumptions from the SCO2T baseline scenario to align with the assumptions embedded within the genGEO data. Future work could improve how genGEO is integrated within SCO2T.
2.2 Data
As shown in Figure 1, we use the portion of the NATCARB dataset (NETL, 2015) that was collected and generated by the Plains CO2 Reduction (PCOR) partnership (PCOR, 2021). While the NATCARB dataset spans the entirety of the United States, our prior work demonstrates that the PCOR data is the only subset that is viable for SCO2T because it is the only portion that reports a permeability, porosity, temperature, depth, and thickness within the SCO2T input geology range (Ogland-Hand et al., 2022b). In other words, in this study, we apply SCO2T to all saline aquifers across the United States that can be defined from a single publicly available dataset. The NATCARB database divides the country into 10 × 10 km grid cells, thus using this data means our results have a 10 × 10 km resolution.
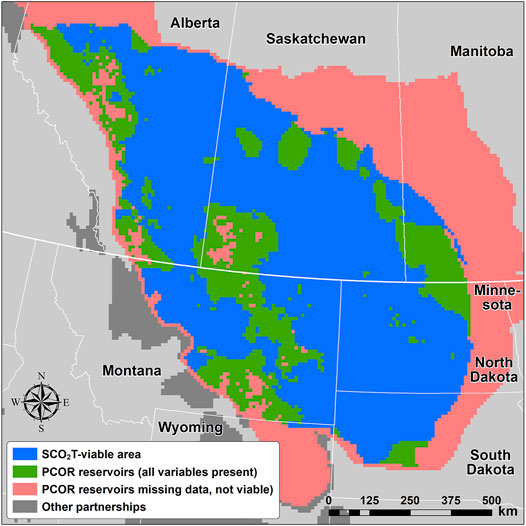
FIGURE 1. Geographic Area Used in This Study. Image taken from Ogland-Hand et al. (2022b).
The NATCARB dataset provides gross thickness data for each grid cell, but SCO2T is an effective parameter tool. As a result, we use three net-to-gross ratio assumptions to convert gross thickness to net (i.e., effective) thicknesses: 10%, 20%, and 60%. These ratios are the approximate p5, p50, and p95 net-to-gross ratios, respectively, from the USGS National Assessment of Geologic Carbon Dioxide Storage Resources for the subsurface formations in PCOR (USGS, 2013). In prior work, we used only the p50 value as the net-to-gross ratio instead of multiple scenarios (Ogland-Hand et al., 2022b). Here we use scenarios because 1) holding everything else constant, the cost of CPG power generation and the cost of CO2 storage both decrease with increasing reservoir thickness (i.e., with increasing net-to-gross ratio) (Middleton et al., 2020b; Adams et al., 2021), but 2) it has yet to be studied if the magnitude of this sensitivity is the same for CPG power generation and CO2 storage.
2.3 Using SCO2T Output Data
2.3.1 Levelized Cost of Electricity
Following our prior work, we estimate the LCOE for CPG power using Eq. 1 (Adams et al., 2021).
Where SpCC is the specific capital cost of the CPG power plant and is an output of SCO2T [$/MWe]; CRF is the capital recovery factor and is an input assumption that is a function of the interest rate and the number of years over which the power plant is financed [%/yr];
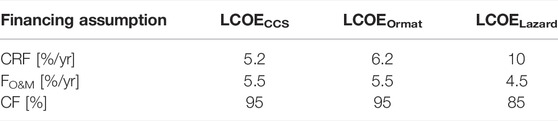
TABLE 1. Financing scenarios assumptions.
The LCOECCS scenario uses the same CRF used to estimate the annualized cost of CO2 storage within SCO2T. As a result, this scenario can be thought of as representative if the CPG power plant owners receive a similar cost of debt as the CO2 storage operators receive. The LCOEOrmat scenario uses the financing assumptions from Ormat, which is a major geothermal power plant company (Adams et al., 2021). This scenario is representative of financing conditions of the geothermal power industry. Lastly, LCOELazard scenario uses the financing assumptions used by Lazard when providing their annual LCOE reports that compare the cost of different electricity generation technologies (Lazard, 2019).
2.3.2 Total Number of CPG Power Plants
In prior work, we scaled up the power capacity of a single CPG power plant across sedimentary basins using 1) the CO2 storage capacity of the basin and 2) the amount of CO2 suggested to be required for a single CPG power plant (Adams et al., 2021). Here, we improve on this methodology by using SCO2T outputs directly. SCO2T estimates the CO2 storage capacity across a given area (e.g., a 10 × 10 km NATCARB grid cell) by estimating the CO2 plume area of a single CO2 injection well and then increasing the number of injection wells based on the number of plumes that fit in the given area (100 km2 for NATCARB grid cells). As a result, we limit the number of CPG power plants at a brownfield site to the number of CO2 injection wells that SCO2T suggests could be drilled for storing CO2. For greenfield CPG sites, we set the number of CPG power plants to be 78.5 in every NATCARB grid cell because 1) given the methodology of SCO2T, the CO2 plume area across all wells is 78.5% of the user-defined area (e.g., 78.5 km2 for a NATCARB grid cell) as a circle with a diameter equal to the side of a square will encompass 78.5% of the area of the square; and 2) the current CPG power plant design assumes a 1 km2/power plant footprint (Adams et al., 2021).
2.3.3 Breakeven Electricity Price
For this study, we define the breakeven electricity price as the price of electricity that is required to financially breakeven when CO2 is stored in a location with the least expensive CPG power compared to using the location with the least expensive CO2 storage. The breakeven electricity price is defined as Eq. 3, which is derived by equating revenue from electricity sales (left side of Eq. 2 to the cost of generating electricity and storing CO2 (right side of Eq. 2):
Where
Because Eq. 3 shows that the breakeven electricity price is the LCOE plus an additional factor, we simplify the breakeven price equation to Eq. 5 by defining the additional factor (Eq. 4):
Where the ACOE is the “Additional Cost of Electricity (ACOE)” and represents the change in cost of CO2 storage. As shown in Eq. 5, the breakeven electricity price would be equal to the LCOE in situations where the ACOE was zero [i.e., situations where there was no change in the cost of CO2 storage (i.e.,
For this study, we calculate the breakeven electricity price for three different scenarios of capacity factors for both greenfield and brownfield CPG development: 95%, 50%, and 30%. It is unknown what the capacity factor of dispatchable low-carbon power plants will be in the future, and we use these three scenarios to investigate a variety of possibilities. Across all three of these capacity factor scenarios, the LCOE is calculated using the CRF and
3 Results
3.1 Geospatial Cost of CPG Power Capacity and CO2 Storage
The left column of Figure 2 shows that, across all the net-to-gross ratio scenarios, there exists 1) a “sweet-spot” location in South Dakota with low-cost CPG power generation, and 2) locations that do not support CPG power generation (i.e., black grid cells). For example, even with an assumed net-to-gross ratio of 10%, there is still geology in South Dakota that could support <$150/MWh or cheaper power generation, depending on the financing of CPG. As South Dakota is not well-known for having geothermal energy resources amenable for power generation, Figure 2 supports our prior work that suggests CPG could vastly expand the geothermal resource base (Adams et al., 2021; Van Brummen et al., 2022). On the other hand, because there is also geology across PCOR that cannot support CPG geothermal power generation, even with a net-to-gross ratio of 60%, Figure 2 simultaneously demonstrates that CPG cannot expand the geothermal resource base to any location within a sedimentary basin.
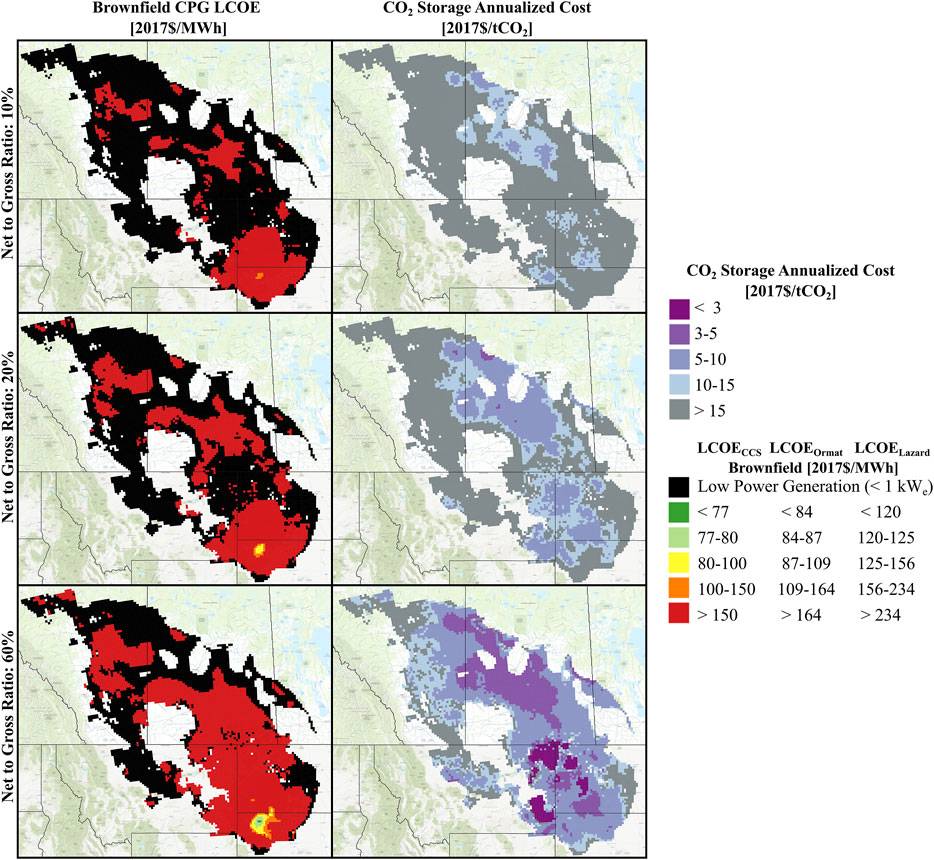
FIGURE 2. Geospatial Variability in Cost of CO2 Plume Geothermal Power Plants and CO2 Storage Across the PCOR Area. For CPG maps (left column), low power generation areas (black grid cells) are locations in which the power generation from one CPG power plant was less than 1 kWe.
Figure 2 also shows that across PCOR, the locations for lowest-cost CPG power plants are not the same locations for lowest-cost CO2 storage. For example, across all net-to-gross ratio assumptions, the “sweet-spot” locations with low-cost CO2 storage are not in the “sweet-spot” CPG location in South Dakota. This finding means that developing the cheapest CPG power plants in PCOR would require storing CO2 in more expensive locations than may otherwise be targeted if CCS projects only considered the cost of sequestration. Further, some locations with inexpensive CO2 storage (<$5/tCO2) are also locations that do not support CPG power generation at all. For example, in central Saskatchewan when the net-to-gross ratio is 60%. Thus Figure 2 suggests 1) it is possible for the cost of CPG to be higher if CO2 storage operators only inject where the cost of sequestration is the lowest, and 2) that it is also possible that CPG technology may be unable to use the geologically stored CO2 to provide power, depending on where CO2 is injected.
Figure 3 shows the least cost geologic data for both CPG and CO2 storage. CPG and CO2 storage maps are plotted on different rows because there are multiple formations within the PCOR data, so the geologic layer (depth) that results in the lowest-cost CPG can be different than the layer that results in the lowest-cost CO2 storage. Figure 3 can be used to understand 1) why the lowest-cost locations for CPG are not the same as the lowest-cost locations for CPG; and 2) why there are some locations that cannot support CPG power generation.
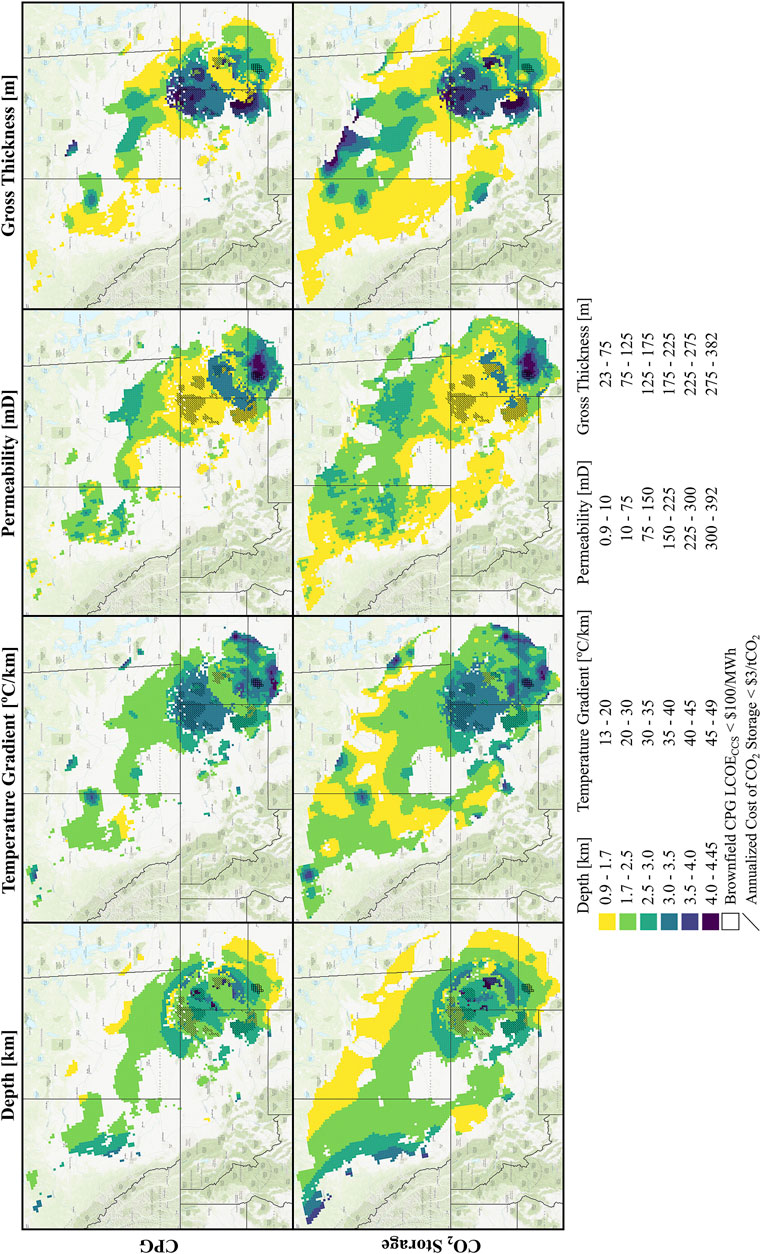
FIGURE 3. Geologic Conditions That Yield the Lowest Cost When the Net-to-Gross Ratio is 60%. For CPG (top row of maps), the geology of grid cells with low power generation (black area in Figure 2) are not plotted.
Our prior work collectively demonstrates that, holding everything else constant, the LCOE of CPG and the annualized dollar per tonne cost of CO2 storage both decrease with increasing depth, increasing thickness, increasing permeability, or increasing geothermal temperature gradient (Middleton et al., 2020b; Adams et al., 2021). As a result, a hypothetical deep and thick geologic formation with high permeability and a high temperature gradient would result in low-cost CPG power and low-cost geologic CO2 storage. Figure 3 demonstrates, however, that in the PCOR region, 1) these hypothetical subsurface conditions that are “optimal” across all four of these parameters do not exist, and 2) the magnitude of the cost sensitivities to geologic conditions are different between CPG and geologic CO2 storage. For example, Figure 3 suggests that in “non-optimal” (i.e., real) geologic conditions, the cost of CO2 storage can be low if the reservoir is thick and deep enough, even if permeability is low (see slashed locations where cost of CO2 storage is <$3/tCO2). In contrast, Figure 3 suggests that locations in PCOR with high permeability, moderate thickness, and a high temperature gradient provide the lowest-cost CPG power generation (see boxed locations where Brownfield CPG LCOE<$100/MWeh). In other words, even though the thickness and depth are high in the “sweet-spot” locations for CO2 storage, these are not the “sweet-spot” locations for CPG power generation because the permeability and temperature gradient are too low.
Figure 3 also suggests that the areas that cannot support CPG power generation (i.e., the black grid cells in Figure 2) are due to a too low transmissivity or a too low geothermal temperature gradient. For example, there are almost no grid cells on the CPG map with a geothermal temperature gradient between 13°C/km and 20°C/km (yellow grid cells). Further, the area in the northwest tip of the PCOR region has generally low transmissivity with permeabilities between 0.9 and 10 mD (yellow grid cells) and low gross thicknesses between 23 and 75 m (yellow grid cells), and this area also has almost no grid cells that support CPG power generation.
3.2 Breakeven Price of Electricity
Figure 4 shows the breakeven prices of electricity (subplots A and B) and the intermediate results that the breakeven electricity prices are a function of across the lowest-cost 500 MtCO2 injected: ACOE (subplots C and D); LCOE (subplots E and F); and the change in cost of CO2 storage,
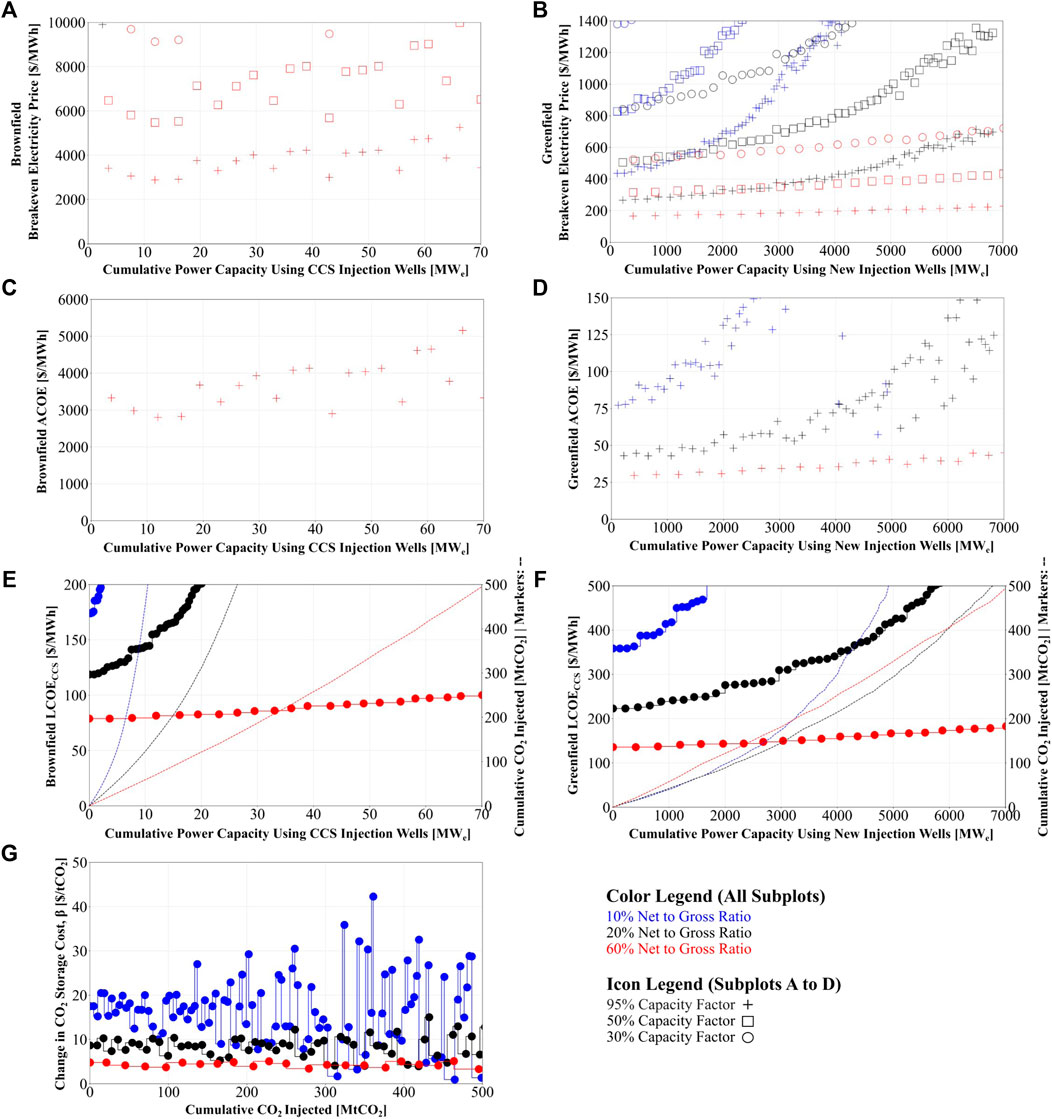
FIGURE 4. Brownfield Breakeven Electricity Prices (A), Greenfield Breakeven Electricity Prices (B), Brownfield ACOE Supply Curve (C), Greenfield ACOE Supply Curves (D), Brownfield LCOE Supply Curve (E), Greenfield LCOE Supply Curve (F), Change in Cost of CO2 Storage Between CPG “sweet spot” locations and CO2 storage “sweet spot” locations (G). Subplots E and F also show the cumulative CO2 injected as a function of the cumulative CPG power capacity on the right y-axis.
Subplots A and B of Figure 4 show that the breakeven electricity prices for greenfield developments are an order of magnitude smaller compared to brownfield development. For example, when the capacity factor is 95% and the net-to-gross ratio is 60%, the greenfield breakeven electricity price is between ∼$170/MWeh to ∼$220/MWeh compared to ∼$2,500/MWeh to ∼$5,000/MWeh for brownfield development. The breakeven electricity price is lower for greenfield development because the increase in power generation capacity from having more CPG power plants outweighs the increase in LCOE from having to drill more wells. As seen in subplot E, the 500 MtCO2 injected across the lowest-cost CPG grid cells can only support about 70 MWe of CPG power capacity with brownfield development. This power capacity is low because there is approximately one CO2 injection well in most of the grid cells within the CPG “sweet spot” thus only one CPG power plant with brownfield development. In contrast, as shown in subplot F, because 78.5 CPG power plants can be developed at greenfield sites, the power capacity that this 500 MtCO2 can support increases to about 7 GWe when the net-to-gross ratio is 60%.
The other primary takeaway from Figure 4 is that the ACOEs are greater than zero, thus the breakeven electricity prices are greater than the LCOEs. This occurs because the “sweet spot” CPG grid cells can hold megatonnes of CO2 and the change in cost of CO2 is also greater than zero (i.e.,
To complement the LCOE maps in Figure 2, Figure 5 shows the ACOE for both greenfield and brownfield development across the South Dakota CPG “sweet spot” when the capacity factor is 95%. As shown in Eq. 4, the ACOE increases with a decreasing capacity factor, which is expected because holding everything else constant, electricity would have to be worth more to financially break even if less electricity was sold. As a result, the ACOE values shown in Figure 5 are “floor” numbers that would increase with lower capacity factor scenarios.
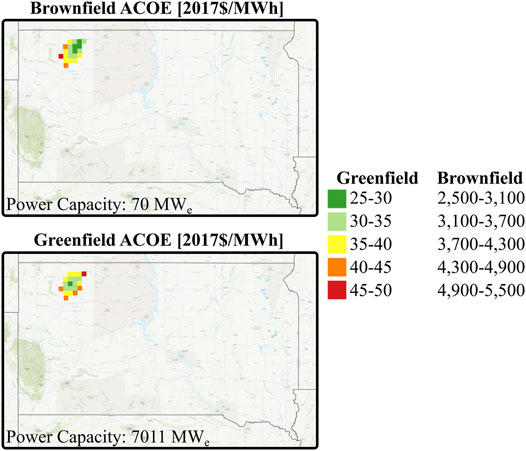
FIGURE 5. Additional Cost of Electricity (ACOE) for Brownfield and Greenfield Development Across the South Dakota CPG “Sweet Spot” When the Capacity Factor is 95%.
The PCOR dataset used in this study includes 8,346 10 × 10 km grid cells, and as shown in Figure 5, the geographic extent of the CPG “sweet spot” in South Dakota is only 21 of these grid cells. Thus, the South Dakota CPG “sweet spot” is only 0.25% of the geographic area considered for this study. But, as also shown in Figure 4 and referenced in Figure 5, the power capacity of this area for greenfield development is 7 GWe. As stated in Section 1, the total installed capacity of geothermal power plants across the entire United States is ∼3.8 GWe (EIA, 2020). In other words, if CO2 was stored in the CPG “sweet spot,” this 2,100 km2 area could have the potential to approximately triple the geothermal power capacity in the United States. But as shown in Figure 4, breakeven electricity prices are at least ∼$170/MWh (∼$140/MWh LCOE + ∼$30/MWh ACOE). For reference, from 2014 to 2020, average wholesale electricity prices across the United States ranged from $30/MWh to $50/MWh (EIA, 2021).
4 Discussion
Prior work has discussed the mutual benefits of CPG and CCS. For example, CPG was first introduced as an approach for offsetting costs of CCS by creating an additional revenue stream (i.e., selling electricity) for CO2 sequestration (Randolph and Saar, 2011). And, CCS could offset some costs of CPG via brownfield development if CCS injection wells are used within CPG power plants (Adams et al., 2021). Our results here suggest, for the first time, that these mutual benefits may not always be available: 1) because the ACOE can be greater than zero, CPG may increase the cost of CCS by requiring CO2 to be injected in more expensive locations than may otherwise be targeted; and 2) the breakeven price of electricity required for CPG deployment can be lower if new injection wells are drilled instead of using CO2 storage injection wells.
There are caveats to our findings, which are listed below. These were beyond the scope of this study but could be areas of focus for future work.
• We do not consider the cost of CO2 transportation. As discussed in Section 1, depending on the locations of CO2 sources, it may cost less to transport CO2 to the CPG “sweet spot” locations compared to the CO2 storage “sweet spot” locations. As a result, it is possible that the ACOE, thus the breakeven electricity prices, would be lower than suggested here if it accounted for transportation.
• Our breakeven electricity prices assume that the CO2 storage operator is considering CO2 storage locations across the entire PCOR region. But if this region was smaller, the “sweet spot” locations for CPG may better align with the “sweet spot” locations for CO2 storage. For example, the ACOE would be smaller if the region of consideration was constrained to just South Dakota because the lowest-cost resources for geologic CO2 storage in South Dakota are higher than the CO2 storage “sweet spots” across PCOR. There may be a good reason to limit the region of consideration of CCS infrastructure given the increased difficulty of building infrastructure like CO2 pipelines that cross political lines like state or country boundaries.
• We do not consider the option for CO2 storage operators to increase the injection well density by overlapping the CO2 plumes. Our prior work demonstrated that overlapping CO2 plumes is a viable approach to increasing the CO2 storage capacity of sequestration sites (Middleton et al., 2020b). By increasing the amount of CO2 injection wells, this planning decision would also in turn increase the number of CPG power plants under brownfield development and thus the amount of electricity that could be sold.
• We limit the per well CO2 injection rate to 1 MtCO2/yr because it is an accepted operational maximum for industrial CO2 injection wells (Middleton et al., 2020a), but our prior work demonstrates that the cost of geologic CO2 storage is sensitive to this assumption (Middleton et al., 2020b). For example, holding everything else constant, the cost of geologic CO2 storage begins to increase with increasing depth after the 1 MtCO2/yr constraint is reached. As a result, the ACOE could be smaller than reported here in scenarios that did not consider the 1 MtCO2/yr injection rate constraint. Relaxing this constraint could be appropriate in situations where CO2 was injected for the specific purpose of developing a CPG power plant.
5 Conclusion
In this study, we estimate and compare the geospatial cost of CPG with the geospatial cost of CO2 storage across the PCOR region subset of the NATCARB database. We find that:
1) In the PCOR region, the locations with lowest-cost CO2 storage are different than the locations with lowest-cost CPG power generation. Further, geologic conditions also exist that result in CO2 storage under $5/tCO2 but do not support CPG power generation. As a result, the breakeven electricity prices required to inject CO2 in “sweet spot” CPG locations may be greater than the LCOE to account for the increased cost of CO2 storage (i.e., the ACOE can be greater than zero).
2) In the PCOR region, the electricity price required to inject CO2 in locations with lowest-cost CPG power generation instead of lowest-cost CO2 sequestration are an order of magnitude greater for brownfield CPG developments than for greenfield CPG developments. Greenfield developments have a lower breakeven cost than brownfield because the increased power capacity from having more wells outweighs the increase in LCOE from more drilling.
3) In the PCOR region, there is potential to approximately triple the United States geothermal electricity generation capacity using CPG technology but high electricity prices are needed to develop this capacity (∼$140/MWeh LCOE + ∼$30/MWeh ACOE = ∼$170/MWeh electricity price).
In addition to the suggestions for future work listed in Section 4 another important next step for future work is applying SCO2T across the United States to identify additional “sweet spot” locations and determine how representative our PCOR findings are to the entire country. As our prior work demonstrated, there is no single publicly available dataset of deep saline formation properties that can be applied to SCO2T across the entire country (Ogland-Hand et al., 2022b). As a result, executing this idea would require combining multiple geologic property datasets with one another.
Data Availability Statement
The original contributions presented in the study are included in the article/supplementary material, further inquiries can be directed to the corresponding author.
Author Contributions
JO-H: Conceptualization, Methodology, Software, Validation, Formal analysis, Investigation, Data Curation, Writing—Original Draft, Visualization, Supervision. BA: Methodology, Resources, Writing—Review and Editing, Visualization. JB: Methodology, Writing—Review and Editing, Visualization. RM: Methodology, Resources, Writing—Review and Editing, Visualization, Project administration, Funding acquisition.
Funding
This material is based upon work supported by the U.S. Department of Energy, Office of Science, Small Business Innovations Research program under Award DE-SC0021570. The content is solely the responsibility of the authors and does not necessarily represent the official views of the Department of Energy.
Conflict of Interest
JO-H, JB, and RM are employed by Carbon Solutions LLC. a commercial entity, and BA declares that the research was conducted in the absence of any commercial or financial relationships that could be construed as a potential conflict of interest.
Publisher’s Note
All claims expressed in this article are solely those of the authors and do not necessarily represent those of their affiliated organizations, or those of the publisher, the editors and the reviewers. Any product that may be evaluated in this article, or claim that may be made by its manufacturer, is not guaranteed or endorsed by the publisher.
Supplementary Material
The Supplementary Material for this article can be found online at: https://www.frontiersin.org/articles/10.3389/fenrg.2022.855120/full#supplementary-material
References
Adams, B. M., Kuehn, T. H., Bielicki, J. M., Randolph, J. B., and Saar, M. O. (2015). A Comparison of Electric Power Output of CO2 Plume Geothermal (CPG) and Brine Geothermal Systems for Varying Reservoir Conditions. Appl. Energ. 140, 365–377. doi:10.1016/j.apenergy.2014.11.043
Adams, B., Ogland-Hand, J., Bielicki, J., Schädle, P., and Saar, M. (2021). Estimating the Geothermal Electricity Generation Potential of Sedimentary Basins Using genGEO (The Generalizable GEOthermal Techno-Economic Simulator). ChemRxiv Prepr. doi:10.26434/chemrxiv.13514440.v1
Anderson, S. T. (2017). Cost Implications of Uncertainty in CO2 Storage Resource Estimates: A Review. Nat. Resour. Res. 26, 137–159. doi:10.1007/s11053-016-9310-7
Bistline, J. E. T., and Blanford, G. J. (2020). Value of Technology in the U.S. Electric Power Sector: Impacts of Full Portfolios and Technological Change on the Costs of Meeting Decarbonization Goals. Energ. Econ. 86, 104694. doi:10.1016/j.eneco.2020.104694
Bui, M., Adjiman, C. S., Bardow, A., Anthony, E. J., Boston, A., Brown, S., et al. (2018). Carbon Capture and Storage (CCS): The Way Forward. Energy Environ. Sci. 11, 1062–1176. doi:10.1039/c7ee02342a
Chen, B., Harp, D. R., Pawar, R. J., Stauffer, P. H., Viswanathan, H. S., and Middleton, R. S. (2020). Frankenstein's ROMster: Avoiding Pitfalls of Reduced-Order Model Development. Int. J. Greenhouse Gas Control. 93, 102892. doi:10.1016/j.ijggc.2019.102892
EIA (2020). Electric Power Annual [WWW Document]. URL Available from: https://www.eia.gov/electricity/annual/.
EIA (2021). Wholesale Electricity and Natural Gas Market Data [WWW Document]. URL Available from: https://www.eia.gov/electricity/wholesale/.
Eiken, O., Ringrose, P., Hermanrud, C., Nazarian, B., Torp, T. A., and Høier, L. (2011). Lessons Learned from 14 Years of CCS Operations: Sleipner, in Salah and Snøhvit. Energ. Proced. 4, 5541–5548. doi:10.1016/j.egypro.2011.02.541
Global CCS Institute (2020). Global Status of CCS 2020 [WWW Document]. URL Available from: https://www.globalccsinstitute.com/resources/global-status-report/.
Grant, T., Guinan, A., Shih, C. Y., Lin, S., Vikara, D., Morgan, D., et al. (2018). Comparative Analysis of Transport and Storage Options from a CO2 Source Perspective. Int. J. Greenhouse Gas Control. 72, 175–191. doi:10.1016/j.ijggc.2018.03.012
Hannon, M. J., and Esposito, R. A. (2015). Screening Considerations for Caprock Properties in Regards to Commercial-Scale Carbon-Sequestration Operations. Int. J. Greenhouse Gas Control. 32, 213–223. doi:10.1016/j.ijggc.2014.11.016
Jenkins, J. D., Mayfield, E. N., Larson, E. D., Pacala, S. W., and Greig, C. (2021). Mission Net-Zero America: The Nation-Building Path to a Prosperous, Net-Zero Emissions Economy. Joule 5, 2755–2761. doi:10.1016/j.joule.2021.10.016
Larson, Eric., Greig, Chris., Jenkins, Jesse., Mayfield, Erin., Pascale, Andrew., Zhang, Chuan., et al. (2020). Net-Zero America: Potential Pathways, Infrastructure, and Impacts Interim Report [WWW Document]. URL Available from: https://netzeroamerica.princeton.edu/the-report.
Lazard (2019). Levelized Cost of Energy Analysis - Version 13.0 [WWW Document]. URL Available from: https://www.lazard.com/media/451086/lazards-levelized-cost-of-energy-version-130-vf.pdf.
Middleton, R. S., Chen, B., Harp, D. R., Kammer, R. M., Ogland-Hand, J. D., Bielicki, J. M., et al. (2020a). Great SCOT! Rapid Tool for Carbon Sequestration Science, Engineering, and Economics. Appl. Comput. Geosciences 7, 100035. doi:10.1016/j.acags.2020.100035
Middleton, R. S., Ogland-Hand, J. D., Chen, B., Bielicki, J. M., Ellett, K. M., Harp, D. R., et al. (2020b). Identifying Geologic Characteristics and Operational Decisions to Meet Global Carbon Sequestration Goals. Energ. Environ. Sci. 13, 5000–5016. doi:10.1039/d0ee02488k
Middleton, R. S., and Yaw, S. (2018). The Cost of Getting CCS Wrong: Uncertainty, Infrastructure Design, and Stranded CO2. Int. J. Greenhouse Gas Control. 70, 1–11. doi:10.1016/j.ijggc.2017.12.011
NETL (2015). NETL NATCARB ATLAS Fifth Edition [WWW Document]. URL Available from: https://www.netl.doe.gov/coal/carbon-storage/strategic-program-support/natcarb-atlas.
NREL (2019). Regional Energy Deployment System (ReEDS) Model Documentation: Version 2019 [WWW Document]. Available from: NREL/TP-6A20-67067.
Ogland-Hand, J., Cohen, S., Kammer, R., Ellett, K., Saar, M., and Middleton, R. (2022a). The Importance of Modeling Carbon Dioxide Transportation and Geologic Storage in Energy System Planning Tools. Front. Energ.. doi:10.3389/fenrg.2022.855105
Ogland-Hand, J. D., Kammer, R. M., Bennett, J. A., Ellett, K. M., and Middleton, R. S. (2022b). Screening for Geologic Sequestration of CO2: A Comparison between SCO2TPRO and the FE/NETL CO2 Saline Storage Cost Model. Int. J. Greenhouse Gas Control. 114, 103557. doi:10.1016/j.ijggc.2021.103557
PCOR (2021). The PCOR Partnership Initiative [WWW Document]. URL Available from: https://undeerc.org/pcor/.
Randolph, J. B., and Saar, M. O. (2011). Combining Geothermal Energy Capture with Geologic Carbon Dioxide Sequestration. Geophys. Res. Lett. 38, a–n. doi:10.1029/2011GL047265
Rogelj, J., Shindell, D., Jiang, K., Fifita, S., Forster, P., Ginzburg, V., et al. (2018). “Mitigation Pathways Compatible with 1.5°C in the Context of Sustainable Development,” in Global Warming of 1.5°C. An IPCC Special Report on the Impacts of Global Warming of 1.5°C above Pre-industrial Levels and Related Global Greenhouse Gas Emission Pathw [WWW Document]. URL Available from: https://www.ipcc.ch/site/assets/uploads/sites/2/2019/05/SR15_Chapter2_Low_Res.pdf.
Sepulveda, N. A., Jenkins, J. D., de Sisternes, F. J., and Lester, R. K. (2018). The Role of Firm Low-Carbon Electricity Resources in Deep Decarbonization of Power Generation. Joule 2, 2403–2420. doi:10.1016/j.joule.2018.08.006
USGS (2013). National Assessment of Geologic Carbon Dioxide Storage Resources — Data (Ver. 1.1, September 2013) [WWW Document]. URL Available from: http://pubs.usgs.gov/ds/774/.
Van Brummen, A. C., Adams, B., Wu, R., Ogland-Hand, J., and Saar, M. (2022). Using CO2-Plume Geothermal (CPG) Energy Technologies to Support Wind and Solar Power in Renewable-Heavy Electricity Systems. SSRN J.. doi:10.2139/ssrn.3880268
Vikara, D., Shih, C. Y., Lin, S., Guinan, A., Grant, T., Morgan, D., et al. (2017). U. S. DOE's Economic Approaches and Resources for Evaluating the Cost of Implementing Carbon Capture, Utilization, and Storage (CCUS). J Sustain. Energy Engng 5, 307–340. doi:10.7569/jsee.2017.629523
Keywords: sedimentary basin geothermal, SCO2T, CCS, site screening, genGEO, CPG
Citation: Ogland-Hand JD, Adams BM, Bennett JA and Middleton RS (2022) A Geospatial Cost Comparison of CO2 Plume Geothermal (CPG) Power and Geologic CO2 Storage. Front. Energy Res. 10:855120. doi: 10.3389/fenrg.2022.855120
Received: 14 January 2022; Accepted: 16 March 2022;
Published: 11 April 2022.
Edited by:
Greeshma Gadikota, Cornell University, United StatesReviewed by:
Peter Campbell Psarras, Colorado School of Mines, United StatesPrince Ochonma, Cornell University, United States
Copyright © 2022 Ogland-Hand, Adams, Bennett and Middleton. This is an open-access article distributed under the terms of the Creative Commons Attribution License (CC BY). The use, distribution or reproduction in other forums is permitted, provided the original author(s) and the copyright owner(s) are credited and that the original publication in this journal is cited, in accordance with accepted academic practice. No use, distribution or reproduction is permitted which does not comply with these terms.
*Correspondence: Jonathan D. Ogland-Hand, am9uYXRoYW4ub2dsYW5kLWhhbmRAY2FyYm9uc29sdXRpb25zbGxjLmNvbQ==