 Natalia Roslyakova
 Elena Vechkinzova
- 1Laboratory of Economic Dynamics and Innovation Management, V.A. Trapeznikov Institute of Control Sciences Russian Academy of Sciences, Moscow, Russia
- 2Academic Department of Management and Business Technologies, Plekhanov Russian University of Economic, Moscow, Russia
Our review focuses on statistical data on the relationship between electricity prices and emissions, energy availability, and energy consumption in 2017–2020. We used the nonparametric method of data envelopment analysis (DEA) as a methodological basis for analyzing the impact of the "green policy" on electricity consumption in the regions of Russia and regression analysis to quantify dependencies between the parameter. The results of the DEA allowed us to check the effectiveness of the ratio of costs (emissions) and results (electricity consumption by the population and industry). The results of the regression analysis allowed us to find the equation of the relationship between the amount of electricity generated by a renewable energy source (RES), the amount of consumption, and average electricity prices. The obtained equations proved the strong influence of an increase in the amount of energy generated from renewable energy sources on the average electricity price increase and a decrease in energy consumption. In the conclusion, we talk about the low elasticity of the demand for electricity from the Russian population and the significant impact of electricity generated by the RES on increasing the average prices of energy producers and reducing energy consumption.
Introduction
One of the modern development manifestations is the transition to smart technologies in various fields of activity. The most impressive success of this process has been achieved in the industry, where modern production using automation and robotization does almost without labor. To penetrate this trend into all spheres of life, not only high-tech innovations but also a resilience supply of electricity is needed. Thus, it can be predicted that the demand for electricity in all countries of the world will steadily grow. However, energy production causes significant harm to the environment. This is because of the fact that now the main source of energy production in the world is hydrocarbon raw materials and coal. The speed of green technologies and penetration and reduction of waste emissions is incomparable to the speed of production and consumption of electricity.
The collected information allows us to formulate a number of hypotheses about the structure of data and the nature of relationships. The most obvious of them is that one can expect a direct relationship of price dynamics with the amount of electricity production (hypothesis 1) and a reverse relationship with the amount of consumption (hypothesis 2). Furthermore, since the increase in electricity production in the region contributes to an increase in the level of energy supply, we can also expect a direct relationship between price and energy supply (hypothesis 3). In our opinion, the most multidirectional links exist between electricity prices and emissions of pollutants. Hence, there may be a co-directional change in the price of electricity and emissions (hypothesis 4). This is possible if the business does not have internal reserves for efficiency growth and the growth of energy tariffs will lead to an even greater drop in capital efficiency. Consequently, opportunities to invest in environmental projects and activities will be reduced. In conditions when regional authorities do not pay due attention to environmental policy and emissions control, and environmental innovations are too expensive, emissions may increase. Such behavior of enterprises is a way to increase production using cheaper and energy-intensive technologies, internalizing external negative effects in the form of environmental pollution at an accelerated pace. On the other hand, there may be a situation where an increase in electricity tariffs will stimulate a more economical use of this resource. This situation is more typical for regions where pollution charges and tariff increases cover the cost of environmental modernization measures, which will reduce electricity consumption and reduce emissions (hypothesis 5).
Methods
We have summarized data of 2017–2020 on electricity prices, pollution emissions, energy availability, and energy production and consumption in the regions of Russia. The data were collected on the basis of open statistical information (Rosstat, 2022). In addition, information from the Unified Interdepartmental Statistical Information System was used to estimate the amount of electricity consumption by the manufacturing sector and the population (Fedstat, 2022), and information from specialized analytical agencies (the dynamics of electricity prices) (Energo, 2021). The data were collected on sheet Data_regions in the data file (Supplementary material). First of all, it is possible to make a correlation analysis, it will allow us to identify the presence of linear relationships between the parameters and assess their strength. The matrix is given in sheet Corr in the data file (Supplementary material).
It is obvious that the process of distribution of green technologies in the space of Russian regions is uneven. Regions where larger enterprises operating in the energy sector (including the extraction of hydrocarbon resources) are concentrated can concentrate significant resources for the implementation of complex environmental measures. Here, the parameters of emissions and electricity consumption by the industry and the population are more effective. In other regions, there may be significant deviations from the performance parameters of the leaders. Therefore, it is of great interest to study the parameters of the optimal combination of costs-inputs (emissions) and results-outputs (electricity consumption by the industry and the population) across the regions of Russia using DEA tools. Models with a variable return of scale (VRS) are considered because in the practice of power supply and power consumption, the scale effect is limited by the available energy generation production capacity (for energy supply) and the available capacity of the transportation power grids (for energy consumption). A model with a constant return of scale (CRS) and the assumption of “limitless” possibilities for reducing costs or increasing results in this case does not correspond to reality. Also, calculations are carried out in one input (emissions) and two outputs (electricity consumption by the industry and the population), which makes it possible to visually present the results of the analysis. Calculations were carried out for 2017 and 2020 to assess the initial and final states of the considered system of regions and changes over the period on the basis of normalized data (sheet Data_regions_norn in the data file; Supplementary material). Figure 1 reflects the distribution of real data, and estimates of optimal parameters obtained from input-oriented models VRS.
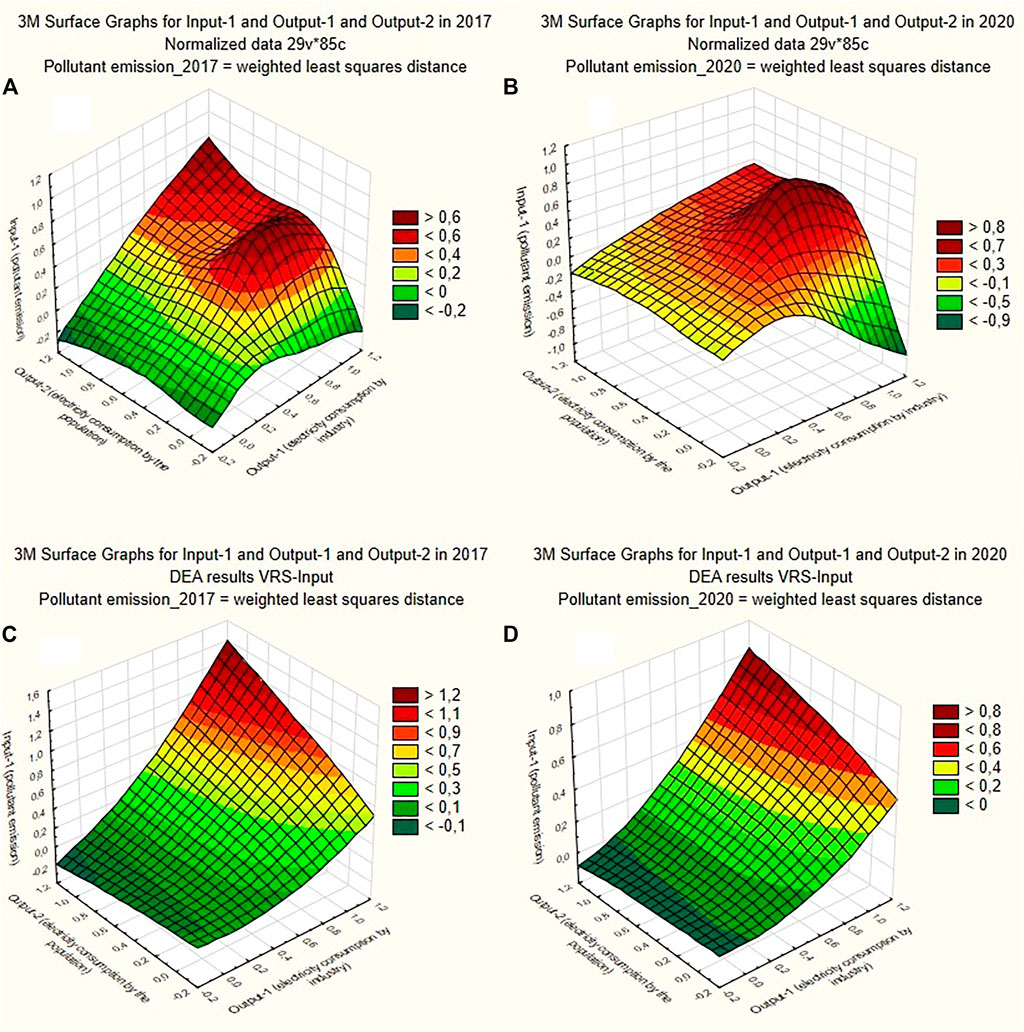
FIGURE 1. Surface graphs for real data in 2017 (A) and 2020 (B) and results of VRS models with one input and two outputs in 2017 (C) and 2020 (D).
The correlation analysis allows us to make conclusions only about the presence or absence of a linear relationship between the parameters. However, it can be assumed that there are other forms of relationship. Therefore, an additional analysis using the STUDIO software is carried out to clarify the type of finite functions. We tested stepwise regression, multiple linear regression, and 23 models of a one-factor model (parabola, polynomial, logarithmic, power, exponents, hyperbola, optimal, logistic, and sinusoidal).
Analysis
Correlation Analysis
A deeper analysis of the data will confirm or refute the hypotheses put forward. The data of the correlation analysis refute hypothesis 1, that is, there is a very non-standard situation when, with an increase in the price of electricity, its production decreases (for all considered periods a correlation coefficient (K) is in the range from −0.29 to −0.22).
Hypothesis 2 is confirmed, since there is a negative dependence of consumption and prices (K varies from −0.25 to −0.23). At the same time, if we divide the demand for electricity into production and consumption, then we can see differences in the degree of intensity of the link. Electricity consumption on the part of the population has a small elasticity, that is, people are very limited in their ability to refuse electricity. Accordingly, we see a weak relationship between the amount of electricity consumed by the population and price dynamics (the correlation coefficient varies from −0.07 to −0.03). On the other hand, electricity consumption by the industry has much greater elasticity and with rising electricity prices, enterprises receive an additional stimulus for the active implementation of energy-saving and energy-efficient technologies, which can cause significant fluctuations in demand from production. Accordingly, in this segment, we see a significantly greater degree of mutual change (K varies from −0.33 to −0.30).
Hypothesis 3 tests give ambiguous results. So, in 2017–2018 there is a positive relationship with prices (K varies from 0.01 to 0.04), whereas in 2019–2020 this relationship becomes negative (K varies from −0.06 to −0.04). This is happening against the background of the fact that in 2017–2020, the correlation between electricity production and energy supply is steadily increasing from 0.48 to 0.62.
With respect to hypotheses 4 and 5, the results are in favor of hypothesis 5, when price increases contribute to reducing emissions (the correlation coefficient varies from −0.30 to −0.27). This situation characterizes positive trends in electricity consumption by the population and industry. Here, a more detailed consideration of consumption by economic spheres is of great interest. The analysis of the correlation matrix allows us to see that the main source of pollution is industrial production (K varies from 0.76 to 0.83), while emissions from the population are of a secondary nature (K varies from 0.32 to 0.37).
The successful implementation of energy-saving technologies in industry is supported by the fact that the correlation between electricity production and industrial consumption is reduced. In 2017–2018, it is 0.82, and in 2019–2020–0.53–0.55. Also, the environmental policy is confirmed by the systematic reduction of the correlation coefficient between the parameters of electricity production and emissions from 0.67 to 0.54, that is, in 2017–2020, electricity production occupies an increasingly smaller share in the dynamics of emissions.
Data Envelopment Analysis Results
If we compare a) and b) Figure 1, which describe real data, we can see that, on the one hand, the spread of the controlled parameter (pollution emission) has increased. On the other hand, it is obvious that for most of the units, the emission parameters have approached each other, and strong deviations, which form the scope of variation, are characteristic of single units. That is, there is a decrease in the number of regions with excessively large emissions. Accordingly, the solutions proposed in c) and d) Figure 1 also reduced the range from 1.4 to 0.9. At the same time, the constancy of the shape and degree of curvature of the surface indicates that the main proportions of efficiency and the spatial distribution of parameters in the period 2017–2020 have been fixed.
It is also noteworthy in the DEA estimates that in 2017, with higher pollution levels, the absolute majority of regions demonstrate effective parameters of the links between inputs and outputs. In the model, this is shown in the fact that the regions can come to the optimum due to a proportional movement in emissions. Slack movement assumes a change in the parameters of the internal efficiency of outputs, in our case, this is electricity consumption by the industry and the population. Such technological gaps and efficiency improvements are required for the industry of Dagestan, Kalmykia, the Chechen Republic, and Sevastopol (see slack movement in electricity consumption by the industry at sheet VRS_2017 in the data file; Supplementary material). These regions are located in desert and mountainous areas and cannot use the advantages of grid distribution of electricity, which gives objective reasons for their low efficiency and increased emissions. Technological gaps and efficiency improvements are required for electricity consumption by the population of the Republics of Altai, Tyva, Kalmykia, Komi and Yamalo-Nenets, Nenets and Chukotka Autonomous Okrugs, and Magadan Region.
The results of DEA modeling in 2020 give slightly different results (sheet VRS_2020 in the data file; Supplementary material). Because of the decrease in the average level of emissions by the leading regions and the lag in the pace of energy-efficient technology implementation in the regions of Russia, the possibility of achieving the optimum only through the proportional movement of emissions is reduced. The number of slack movements is increasing significantly, and they are concentrated in the sphere of electricity consumption by the population. For the industry, a technological gap is required by the same regions (the Republics of Altai, Kalmykia, Dagestan, Chechnya, and Sevastopol). On the hand, for the population, the number of inefficient regions requiring technology changes increases from 8 to 67. In 2020, there are only 18 efficient regions in the sphere of electricity consumption by the population—Moscow, Sverdlovsk, Chelyabinsk, Irkutsk, Kemerovo regions, the cities of Moscow and Sevastopol, the Republics of Dagestan, Ingushetia, Kabardino-Balkaria, North Ossetia, Chechnya, Bashkortostan, Tatarstan, Khakassia, Perm and Krasnoyarsk Territories, and Khanty-Mansi Autonomous Okrug.
The main question in this regard is to what extent the “green policy” is an important ideological factor for Russian consumers (population) does it make them save and consume less energy or is the price still the main factor in the amount of consumption. Because of the lack of data on sources of electricity production in the context of Russian regions, we analyzed the data for the whole country from 1990–2000, and average producer prices for electric energy from 1998–2020 (sheet Data_Russia in the data file; Supplementary material).
Regression Modeling
The results of the correlation analysis show a significant link between the amount of electricity generated by an RES and the amount of consumption: the correlation coefficient is 0.592. However, the correlation coefficient between the amount of electricity generated by classical sources and the amount of consumption is 0.988, and the correlation coefficient between the total amount of electricity generated and the amount of consumption is 0.995. That is, despite the significant correlation between the amount of electricity generated by the RES and the amount of consumption, it is almost twice as low as the link between classical energy sources and consumption. We offer the hypothesis that the link between the amount of electricity generated by the RES and the amount of consumption is weaker because of the fact that the price of electricity generated by the RES is almost two times higher than the price of electricity generated by classical sources. The correlation coefficient between the amount of electricity generated by the RES and the average producer prices for electricity for 1998–2020 is 0.793, which shows a strong link between these factors. To understand the form of the influence of the amount of energy produced by the RES (X32) on the formation of the price (X33), a linear regression model was evaluated as follows:
As you can see, the correlation coefficient of the linear model is high (see table on sheet Regression in the Supplementary Material) and the STADIA software confirms the hypothesis about the adequacy of the linear model to the real data. To find the best type of regression dependence, we considered 23 types of models. The best results are presented as follows:
The obtained equations (see table on sheet Regression in the Supplementary Material) once again proved the strong influence of the growth of the amount of energy generated by the RES on the growth of average prices. The forecast errors according to retro data are different: according to model 1—36.25%, according to model 2—18.3%, and according to model 3—16.69%. The graphs of the evaluated regression models and the actual price dynamics are shown in a) Figure 2.
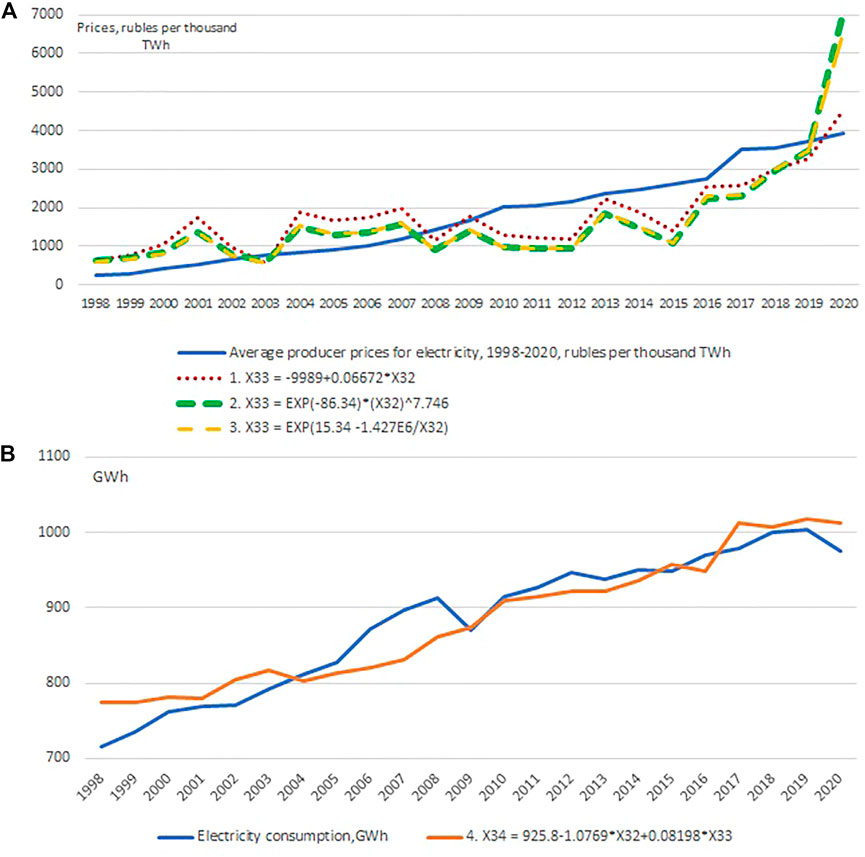
FIGURE 2. Regression modeling results and real data for electricity price (A) and electricity consumption (B).
To answer the research question—how does the “green policy” affect energy consumption prices in Russia—we will evaluate a multiple linear regression. The model reflects the influence of the amount of electricity generation by the RES (X32) and the price of electricity (X33) on the amount of consumption (X34) and has the following specification:
The average forecast error of the evaluated model is only 0.15%. Graphically, this model and the actual dynamics of electricity consumption are shown in b) Figure 2. The regression shows that the growth of electricity generated by the RES almost proportionally reduces the amount of electricity consumption; price growth slightly increases the amount of electricity consumption (which may be due to inflationary price changes). Thus, we can state the significant impact of electricity generated by renewable energy sources on the increase in average electricity prices and a decrease in energy consumption.
Discussion
The rejection of hypothesis 1 by the correlation analysis underscores the monopolistic nature of the Russian energy market. That is, a single operator of the Russian power grid implements a policy of regulating the amount of supply to maximize profits. This is exactly what leads to a drop in supply with an increase in electricity prices. At the same time, market segmentation shows that households bear the brunt of such an increase since they have the lowest elasticity of demand.
Changing the relationship between electricity supply and prices from positive to negative indicates the development of trends of drop in the market efficiency of capital, when favorable external conditions cannot be realized in positive economic effects. These results are confirmed by the example of capital investment in the construction of renewable energy sources. The efficiency of such investments is extremely low because the price of renewable energy is higher than the energy prices of classical sources. That is, green energy is more expensive for Russian consumers. Because of the excessively high cost of construction and maintenance of renewable energy storage, the market is balanced by classical energy sources. With an increase in the supply of renewable energy to the grid, the export of cheaper energy from classical sources increases. This creates conditions for the growth of the average price of electricity in Russia.
Confirmation of the issue about ecology measures stimulated by the price increase indicates the consistency of environmental policy, successful implementation of energy-saving solutions, and technologies to reduce harmful effects on the environment in practice. The successful implementation of energy-saving technologies in the industry is shown by the fact that the correlation between electricity production and industrial consumption is reduced.
It is also noteworthy that in the DEA in 2017, with higher pollution levels, the absolute majority of regions demonstrate effective parameters of the links between inputs and outputs. In the model, this is shown in the fact that the regions can come to the optimum due to a proportional movement in emissions. Only 12 regions of Russia were identified as inefficient (they are located in mountainous, desert, and remote areas). These regions are characterized by increased emissions from electricity production and low involvement in the Russian energy system, a large share of the use of inefficient and non-ecological fuel sources, which creates an objective basis for their low efficiency. The results of the DEA in 2020 show almost the opposite result, when only 18 regions are effective in terms of electricity consumption by the population.
Such results determine the transformations that took place in the field of energy consumption in 2017–2020. They allow us to make recommendations aimed at finding and implementing energy-efficient technologies as quickly as possible, first of all for the population (not for the industry). Green energy is an actual trend for the whole world, including Russia. The main question in this regard is to what extent the “green policy” is an important ideological factor for Russian consumers (population) does it make them save and consume less energy, or is the price still the main factor in the amount of consumption.
The total amount of energy produced in 1990 was 1,082,152 GWh, including classical non-renewable energy source (NRES) generation—916,207 GWh (84.67%) and renewable energy source (RES)—165,945 GWh (15.33%). In 2020, in general, the amount of energy production increased slightly to 1,085,418 GWh, including classical sources—867,757 GWh (79.95%) and RES—217,661 GWh (20.05%). With an overall increase in energy production by only 0.3%, the data show a decrease in energy production from classical sources by 5.29%, mainly due to a significant decrease in energy production from oil by 93.64% and natural gas by 9.23%. The amount of electricity generation from renewable energy sources increased by 31% mainly due to an increase in the use of hydropower and the construction and commissioning of a significant number of solar and wind energy facilities since 2014. Electricity consumption in the same period decreased slightly from 989,580 GWh in 1990 to975,600 GWh in 2020, or by 1.41%, while the increase in producer prices for the period increased 16 times. This confirms the idea expressed previously, the low elasticity of demand for electricity from the population.
Conclusion
We have tested many hypotheses regarding the relationship between the parameters of the energy market of Russia. Thus, a high level of market monopolization was proved, which consists in regulating the amount of supply for the purpose of maximizing profits in the industry. Using the correlation matrix, it was proved that a large share of losses from price increases falls on the population since their electricity demand function is much less elastic compared to the demand function of industrial organizations.
Also, using the DEA tools, we showed that the regions of Russia in 2017–2020 underwent a serious change in the parameters of efficiency. If in 2017 the majority of regions were in the zone of effective ratios, by 2020, the number of effective regions has decreased to 18. This is because of the fact that during the reviewed period, the country’s industrial organizations, with a consistent policy of supporting the implementation of environmental innovations, completed the process of optimizing emissions and insufficiently efficient electricity consumption by the population came to the fore. Therefore, further movement toward optimum emissions for most regions of Russia is now associated with the search and implementation of energy-saving technologies for the population.
The regression analysis allowed us to quantify the relationship between electricity prices, the amount of renewable energy generation, and electricity consumption. The reverse dependence of renewable energy generation and price growth (correlation coefficient 0.79344) is proved, which indicates a high explanatory power of the evaluated equations. The same conclusions are confirmed by the evaluated model of multiple linear regression (correlation coefficient of 0.93701): the growth in the volume of renewable energy generation proportionally reduces the volume of electricity consumption and slightly increases its prices. Thus, the “green policy” produces a small increase in prices and significant savings in energy resources in Russia.
Data Availability Statement
The datasets presented in this study can be found in online repositories. The names of the repository/repositories and accession number(s) can be found at: http://roslyakova24.ru/load/6-1-0-94.
Author Contributions
All authors listed have made a substantial, direct, and intellectual contribution to the work and approved it for publication.
Conflict of Interest
The authors declare that the research was conducted in the absence of any commercial or financial relationships that could be construed as a potential conflict of interest.
Publisher’s Note
All claims expressed in this article are solely those of the authors and do not necessarily represent those of their affiliated organizations, or those of the publisher, the editors, and the reviewers. Any product that may be evaluated in this article, or claim that may be made by its manufacturer, is not guaranteed or endorsed by the publisher.
Supplementary Material
The Supplementary Material for this article can be found online at: https://www.frontiersin.org/articles/10.3389/fenrg.2022.869588/full#supplementary-material
References
Data and statistics (2022). Data from: Data and Statistics. Moscow: International Energy Agency Digital Repository. Available at: https://www.iea.org/data-and-statistics/data-products.
EES EAEC (2022). Data from: Energy Complex of Russia. Moscow: EES EAEC Digital Repository. Available at: https://www.eeseaec.org/elektroenergeticeskij-kompleks-rossi.
Energo (2021). Data from: Rating of Electricity Tariffs in Russia from January 1, 2021. Ufa: Energo-24 Digital Repository. Available at: https://energo-24.ru/news/13582.html.
Fedstat (2022). Data from: Electricity Consumption by Industrial Organizations. Moscow: Unified Interdepartmental Information and Statistical System (UIISS) Digital Repository. Available at: https://www.fedstat.ru/indicator/58653.
Rosstat (2022). Data from: Regions of Russia. Main Characteristics of the Subjects of the Russian Federation. Moscow: Rosstat Digital Repository. Available at: https://rosstat.gov.ru/folder/210/document/13205.
Keywords: electricity consumption, energy availability, emissions, regression analysis, Russia, renewable energy sources, data envelopment analysis
Citation: Roslyakova N and Vechkinzova E (2022) Eco-Friendly Energy Production: The Influence of Price Factors in the Regions of Russia. Front. Energy Res. 10:869588. doi: 10.3389/fenrg.2022.869588
Received: 04 February 2022; Accepted: 11 May 2022;
Published: 21 June 2022.
Edited by:
Elena G. Popkova, Moscow State Institute of International Relations, RussiaReviewed by:
Maria Harja, Gheorghe Asachi Technical University of Iași, RomaniaDhavamani Doss Sakthidoss, Annamalai University, India
Copyright © 2022 Roslyakova and Vechkinzova. This is an open-access article distributed under the terms of the Creative Commons Attribution License (CC BY). The use, distribution or reproduction in other forums is permitted, provided the original author(s) and the copyright owner(s) are credited and that the original publication in this journal is cited, in accordance with accepted academic practice. No use, distribution or reproduction is permitted which does not comply with these terms.
*Correspondence: Natalia Roslyakova, bmFAcm9zbHlha292YTI0LnJ1