 Hongji Zeng
 Zhenggui Li1*
- 1Key Laboratory of Fluid and Power Machinery, Xihua University, Chengdu, China
- 2School of Energy Science and Power Engineering, Harbin Institute of Technology, Harbin, China
- 3China Three Gorges Construction Engineering Group Co., Ltd., Chengdu, China
- 4China Gezhouba Group Electromechanical Construction Co., Ltd., Chengdu, China
Research on the S-shaped region of pump turbines requires a detailed understanding of the vortex distribution law and energy losses under various working conditions. In this study, numerical simulations of a pump turbine model were conducted, and the results were consistent with the experimental results. The |ω|-criterion in the vortex analysis method was combined with the Q-criterion to reveal vortex distribution in the S-shaped region for each working condition along the Q11-n11 curve for all the conditions. Under the runaway and turbine break conditions, the flow field vortices were mainly the leaf channel vortex and separation vortex. Under zero-flow-rate and reverse-pump conditions, the vortices developed towards the stay-guide vanes, obstructing the flow path. Combined with the entropy production rate distribution, vorticity is closely related to energy loss. Compared to the rotation, the vorticity generated by the strong shear effect is significant.
Introduction
Climate change is a global issue, and the increasing emission of greenhouse gases, particularly carbon dioxide, is a threat to humankind. Consequently, countries are reducing their greenhouse gas emissions through a global compact. In September 2020, China announced at the United Nations General Assembly its goal to achieve carbon peaking by 2030 and carbon neutrality by 2060 (Caide, 2021; Peng 2021; Li et al., 2022). In response to its national policy, China has accelerated the construction of pumped-storage power plants. As the core of a pumped-storage power plant, the pump turbine needs to switch back and forth between different operating conditions during operations and is likely to enter the “S” characteristic instability region (Chen 2018). When operating in this area, the internal fluid of the pump turbine exhibits a strong nonlinear turbulent motion (Wangxu et al., 2021), and the turbulent motion is a critical factor for determining pulsating physical quantities, such as flow-field pressure and velocity. Under the combined action of complex boundary conditions of the pump turbine and the three-dimensional transient turbulent motion of the internal fluid, the flow and speed in the unit change significantly, accompanied by a strong pressure pulsation and significant energy loss.
Pejovic et al. (1976) first published relevant findings on the S-shaped region of pump turbines in 1976. Kinoue et al. (2019) investigated the start-up process of a low-specific-speed pump turbine and found that when it was close to the S-shaped region, more vortices appeared in the channel. Cavazzini et al. (2016) examined the load-shedding process of a pump turbine under a large guide vane opening and analyzed the causes of impeller rotation stall under turbine brake conditions. Singh et al. (2015) conducted a velocity triangle analysis at an impeller inlet, determined the velocity and pressure distribution, and comprehensively evaluated the changes in the internal flow pattern in the S-shaped region. However, in the operation process under various working conditions of the S-shaped region of pump turbines, the variations in the flow pattern and energy of the internal flow field are difficult to observe. With the development of the vortex motion theory, entropy generation theory, and computational fluid dynamics (CFD), several relevant studies have been conducted using these new techniques.
Liu et al. (2016), Liu et al. (2019) developed vortex identification methods based on the Omega and Liutex systems. Peng (2020) applied the |ω|-criterion, Q-criterion, and regularized helicity in the vortex analysis method to investigate the internal vortex under the solid–liquid two-phase flow of a tubular turbine. Peng (2020) found that the sediment significantly influences the size, position, and rotation direction of the vortex. Li et al. (2021a) reported that cavitation generates a degree of large-scale vortices in the hump area of a pump turbine. Zhang et al. (2018a) applied a new omega vortex identification method to examine an S-shaped region and verified its effectiveness. Fu et al. (2021) investigated the load-shedding process of a pump turbine and found that the leading causes of flow-field pressure fluctuation are the water hammer, reflux, and water-retaining ring. Ni et al. (2018) assessed the instantaneous vortex structure in a nuclear reactor coolant pump using the Q-criterion and found that the vortex structure in the impeller was critical. Kye et al. (2018) used a large eddy simulation model and found that the dynamic and static interferences between the centrifugal pump impeller and volute generate extremely strong vorticity at the casing tongue. Zhang N. et al. (2019) performed unsteady computations for a centrifugal pump using a delayed detached-eddy simulation model. They found that the vorticity in the volute was large, and the distribution of turbulent kinetic energy was similar to that of vorticity. Li et al. (2016) applied the Q-criterion in the hump area of a pump turbine. They demonstrated that the vortex originated from blade surface friction, and the hump characteristics were related to the blade suction surface pressure, friction, and vortex motion. Ji et al. (2016) applied the Q-criterion to analyze cavitation in Francis turbines and revealed the potential interaction mechanism between cavitation and vortices. However, the vortex analysis method has been applied to vorticity and vortex distribution studies. The entropy production theory needs to be introduced to evaluate energy characteristics.
Qin et al. (2017) conducted experimental tests and CFD simulations and proved that the hydraulic loss during the load rejection process of pump turbines is related to vortex distribution. Yuan et al. (2021) confirmed that a significant shearing effect is a sufficient condition for intense irreversible losses compared to the rotation effect. Lu et al. (2019) analyzed a pump turbine based on the entropy production theory and found that the total entropy production of the runner and draft tube is significantly higher than that of the guide vane and volute. Ren et al. (2021) evaluated a centrifugal pump using the entropy production theory and Q-criterion and found that the volute and impeller are the core areas where internal energy loss occurred in the centrifugal pump. The vortex analysis method and entropy production theory have been rarely used in studies on the S-shaped region of pump turbines, and the relationship between vortex distribution and energy loss is unclear.
The internal vortex dynamics characteristics of the S-shaped region of pump turbines under different working conditions were investigated using a vortex analysis method. The internal flow law was established, and a quantitative study on the internal energy conversion and loss of pump turbines was conducted using the entropy production theory to establish the relationship between vortex and energy loss. This study serves as a reference for further research on pump turbines.
Calculation Method and Theory
Vortex Analysis Method
Vortex motion is prevalent in fluids that cause vibration and fatigue in hydraulic turbines (Zhang et al., 2018b), and vortices are often difficult to observe in complex turbulent flows within fluid machinery. Therefore, with the development of CFD and vortex dynamics, vortex analysis methods that do not depend on the selection of coordinates and rotational variations have gradually been developed.
Vorticity can be regarded as twice the angular velocity of a fluid microcluster rotating rigidly around its center, derived from the flow-field velocity gradient. The vorticity of a flow field can be quantified using the |ω|-criterion, mathematically expressed as follows:
where
The Q-criterion can be expressed as follows:
where S and Ω are the symmetry and antisymmetry tensors, respectively, S is the strain, Ω is the rotation, and ∇v is the velocity gradient. When Q > 0, rotation is dominant, but when Q < 0, the shear strain is dominant.
Entropy Production Theory
According to the second law of thermodynamics, a fluid system is always accompanied by increased entropy (Li et al., 2017). The relationship between the entropy production rate and energy dissipation is expressed as follows.
where
Therefore, the entropy production rate can characterize the energy loss. When the fluid flow inside the pump turbine is turbulent, the entropy production rate is influenced by the time-averaged and pulsating velocities, expressed as follows:
where
For the k–ω turbulence model, the entropy production rate of the pulsating velocity can be calculated using Eq. 10.
Where
Numerical Model and Calculation Setup
Computational Domain
In this study, a pump turbine model machine was used for calculations. The overflow components included the volute, stay vane, guide vane, runner blade, and draft tube. The geometric parameters of the model are listed in Table 1.
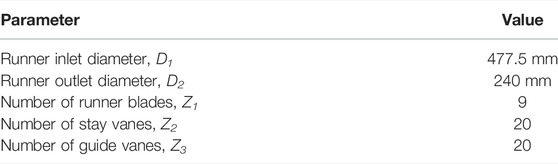
TABLE 1. Parameters of model.
Turbulence Model
Fluid motion follows the continuity equation and momentum equation, the continuity equation that the net mass flow into the control body and the control body due to density changes in the mass added per unit of time is equal, the momentum equation that a system is not subject to external forces or the sum of the external forces is zero, expressed by Eqs 12–15:
In computational fluid dynamics, the shear stress transport SST k–ω model is an optimization model of the k–ω and k–ε models, expressed by Eqs 16, 17:
where ρ is the fluid density, k is the turbulent kinetic energy, ω is the turbulent dissipation rate, and
The SST k–ω model considers the transfer of principal shear stress in the near-wall inverse pressure gradient boundary layer (Li et al., 2021b). It precisely predicts the inverse pressure gradient and flow separation, while the entropy production is closely related to the viscous force in the boundary layer. Therefore, the SST k–ω model was adopted for the calculations.
Grid Information and Grid Irrelevance Verification
The entire model was meshed using ICEM Surf. Because the grid quality significantly impacts the calculation accuracy and considering that the structured grid simulation results are highly accurate (Li Z. et al., 2021; Li et al., 2021d), all parts of the computing domain were meshed to form a structured grid. Table 2 lists the grid details for the six sets of grids in the model. Taking the normal turbine working condition as the calculation working condition point, we obtained the relative values of the calculated head, test head, and pump turbine efficiency as the independent verification standard (Figure 1).
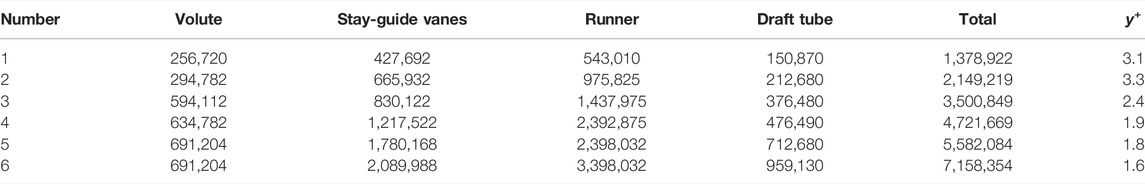
TABLE 2. Grid information.
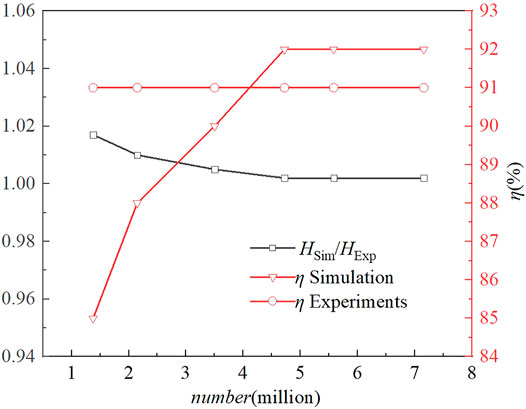
FIGURE 1. Validation of grid independence.
The y+ values for all six grid sets were lower than 11.6 (Table 2), and the velocity field in the wall region could be obtained directly using the SST k–ω model (Li 2017). The head and efficiency were in the grid number exceeding 4.7 million close to the test data and tended to stabilize, considering the calculation accuracy (Figure 1). Finally, the sixth grid set was selected as the grid model for the calculations. The grid division is depicted in Figure 2.
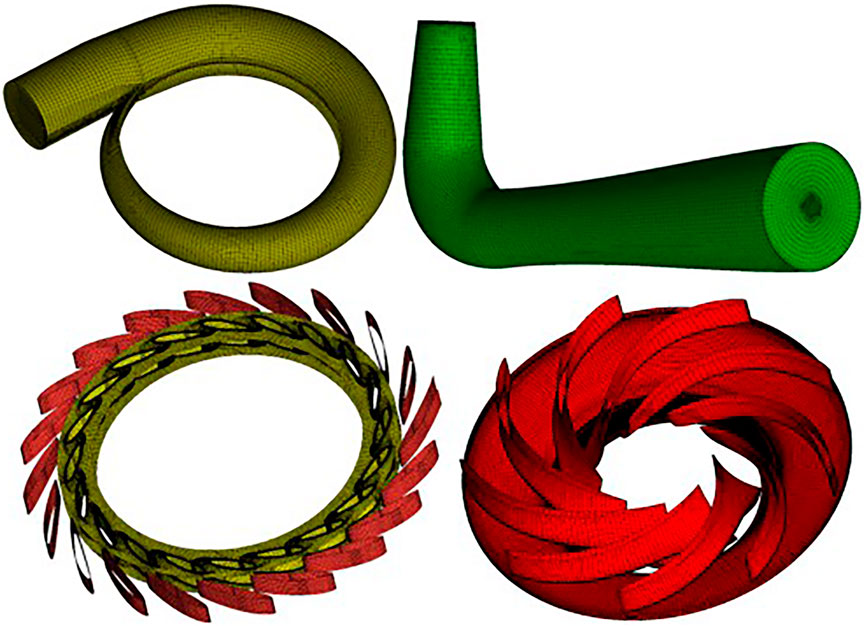
FIGURE 2. Grids of different parts.
Boundary Conditions
Ansys Fluent was used to perform a constant numerical simulation of the entire fluid domain. The inlet boundary condition was set as the mass flow inlet, and the draft tube outlet was the pressure outlet. The solid wall surface had a no-slip boundary condition. In addition, the flow field applied SIMPLEC pressure–velocity coupling, the rotation was set to a frame motion, and the convergence residual was set to 10−4. The energy characteristics were analyzed for all cases without considering cavitation.
Test Verification
The reliability of the numerical simulations was verified experimentally using a model pump turbine. A schematic of the testbed is shown in Figure 3. The test bench adopted a circular closed two-way operating system, and the experimental accuracy and operational stability satisfied relevant requirements.
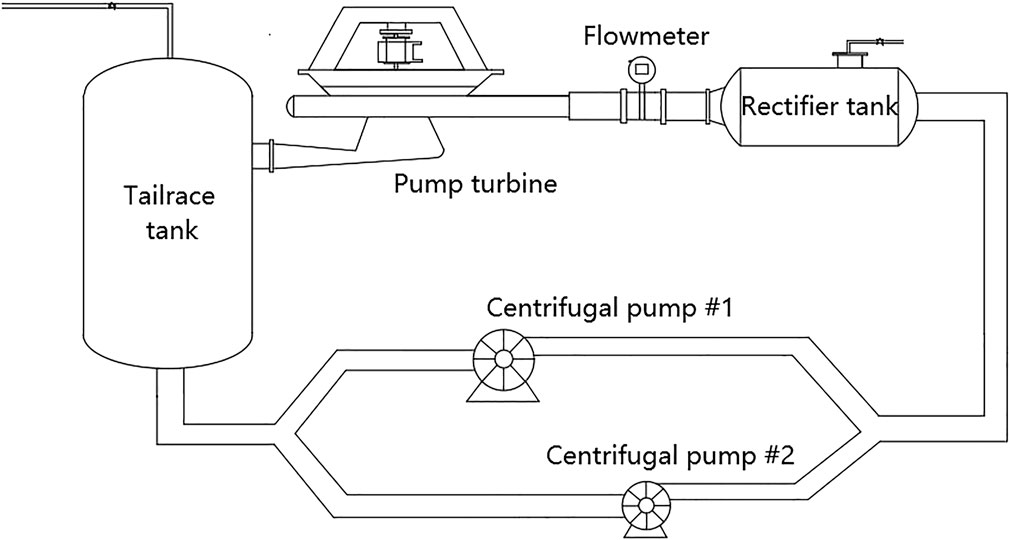
FIGURE 3. Pump turbine test bench.
In the numerical simulations, a minimum flow was selected to replace the zero flow because it is impossible to select the flow as zero under the zero-flow-rate condition; otherwise, the flow cannot be calculated. The specific operating point data are listed in Table 3, where n11 and Q11 are the unit speed and unit flow rate, respectively. n11 and Q11 are transformed using Eqs 18, 19, respectively:
where n is the rotational speed, Q is the flow rate, D is the nominal diameter of the runner, and H is the water head.
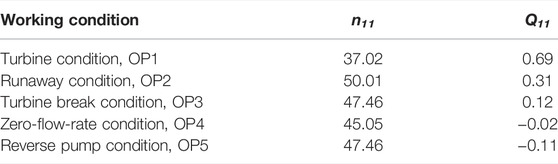
TABLE 3. Calculated working points.
The Q11-n11 curve of the pump turbine depicts the inverse “S” shape of the guide vane opening line; hence, this area is called the S-shaped region of the pump turbine. The “S” property of the pump turbine is unique, and its existence can create difficulties in grid connection in the unit and fail to achieve no-load stability after load shedding. The test data for the turbine operating conditions were presented as the Q11-n11 curve and compared with the CFD results for verification (Figure 4).
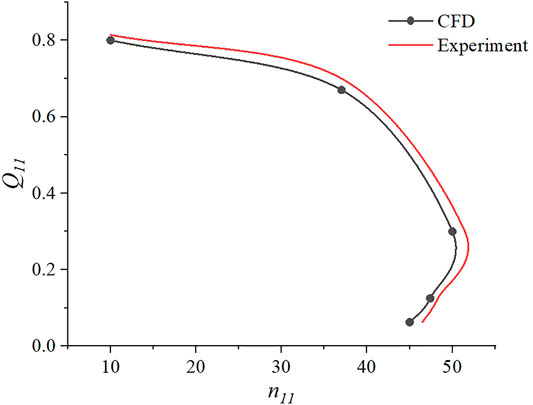
FIGURE 4. Turbine operating characteristic curves.
The most significant difference between the numerical simulation and test results near the runaway condition is attributed to the high speed and flow mismatch under this condition (Figure 4). However, the maximum error was still lower than 3%, and the numerical simulation and test results were consistent and satisfied the accuracy requirements (Liu 2013).
Analysis of Vortex in S-Shaped Region
The physical quantity that characterizes the angular velocity of rotation of a fluid microelement is vorticity, which originates from the velocity gradient of the flow field (Norizan et al., 2018; Tajul 2018). The |ω|-criterion uses the modulus of vorticity as the criterion for vortex. However, because vorticity originates from the velocity gradient of a flow field, it cannot distinguish between the rotation and shear motion, although it can intuitively show the difference in velocity gradient. When the vorticity modulus is very high, it becomes inconsistent with the existence of a vortex. Therefore, the Q-criterion was introduced to identify vortices (Zhang Y.-n. et al., 2019). Figure 5 shows the vorticity distribution of the stay-guide vanes and runner for each operating condition in the S-shaped region. Figure 6 shows the Q-criterion discrimination results of the stay-guide vanes and runner for each operating condition in the S-shaped region.
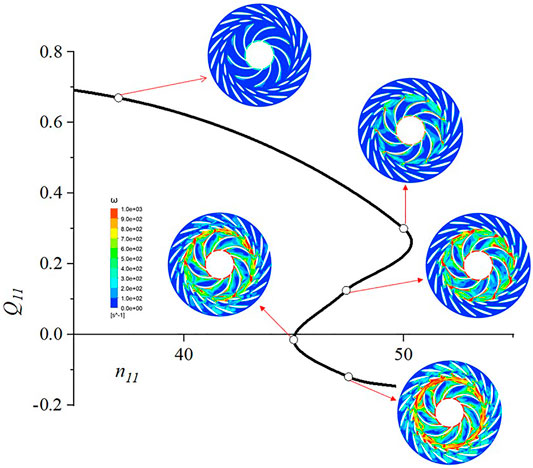
FIGURE 5. Vorticity distribution.
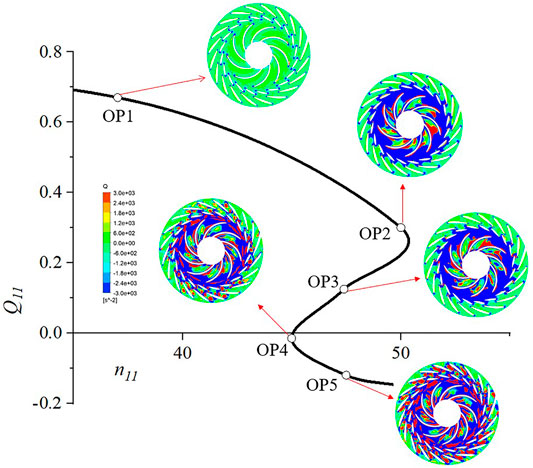
FIGURE 6. Results for Q-criterion discrimination.
The velocity gradient of the internal flow field of the turbine condition was mainly induced by the impact of the incoming flow on the runner (Figures 5, 6). Therefore, the vorticity modulus was very low, and the vortices were small-scale vortices.
The vorticity under the runaway condition was significantly increased compared with OP1. Not only did vorticity exceeding 600 s−1 occur on each blade pressure surface, but the vorticity in the vaneless space also increased. A significant velocity gradient existed at the entrance of each runner flow channel, obstructing the normal passage of water and blocking the flow channel. The Q-criterion discrimination results for the runaway condition indicated that the blade pressure surface exhibited a larger-scale vortex because the runaway condition had a high speed and low flow rate, and flow separation occurred on the blade wall. However, the Q value of the vaneless space was lower than zero. Based on the Q-criterion definition and velocity gradient equation, the vorticities in these areas were dominated by shear strain. Under the turbine brake condition, its speed slightly decreased compared with OP2, but the flow decreased rapidly; therefore, the flow separation and the rotating stall of the runner were intense. The unit exhibited significant instability, and the scales of the passage and separation vortices increased.
Under the zero-flow-rate condition, numerous vortices started to appear in the stay-guide vane flow paths. These vortices, formed by the secondary and cross flows, prevented water from flowing smoothly into the runner area. This obstruction indicated that the vortex propagated towards the stay-vane and guide-vane flow channels. Under the reverse pump condition, the vorticity inside the pump turbine was very large. In many areas, it exceeded 900 s−1. Numerous vortices were distributed in the circumferential direction in the vaneless space. The stress on the blade became complex, and the flow channel of the stay-guide vanes was almost wholly occupied by vortices. These phenomena mainly occurred because the rotation direction of the blade was inconsistent with the incoming flow direction. Therefore, the water could not smoothly enter the volute and flow out, generating strong exciting forces in the mainstream area. In engineering practice, the unit should prevent reaching this working condition as much as possible.
In summary, the vorticity increased in all the areas for all the conditions. The OP1, OP2, and OP3 vortices were mainly distributed on the blade pressure surface, and the velocity gradient in the vaneless space was mainly generated by shear strain. The OP4 and OP5 vortices propagated towards the stay-guide vane flow paths, and the flow patterns in the entire mainstream area were highly turbulent.
Analysis of Entropy Production Rate in S-Shaped Region
According to the second law of thermodynamics, entropy always increases in fluid systems (Gong et al., 2013). Yao (2018) found that the high entropy production rate in the main flow area of a pump turbine is mainly caused by flow separation, impact, and circulation. The entropy production rate can characterize the energy loss. The entropy production rate distribution was plotted to determine the energy loss of each working condition in the S-shaped region (Figure 7).
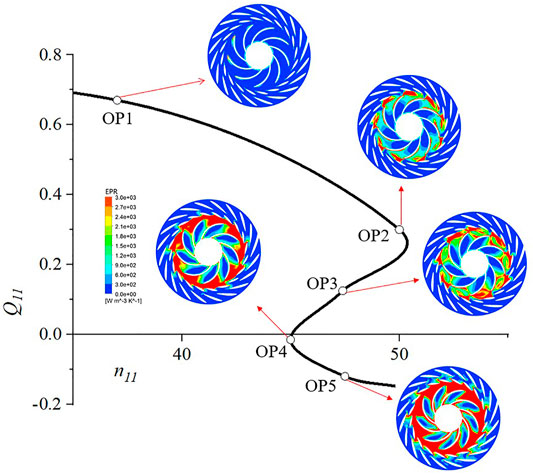
FIGURE 7. Entropy production rate distribution.
The entropy production rate of the turbine condition was low and lower than 1,000 Wm−3K−1 in most areas (Figure 7). Under the runaway condition, the entropy production rate in the vaneless space increased, the energy loss was significant, and the overall distribution of the entropy production rate exhibited periodicity and symmetry. At this time, the energy loss of the pump turbine was mainly generated by the rotating stall and rotor–stator interaction. The entropy production rate distribution of the turbine break condition was similar to that of the runaway condition; however, the flow rate of the turbine break condition was halved, and the internal flow pattern of the turbine break condition was more turbulent than that of the runaway condition. Thus, the mechanical energy loss propagated towards the middle of the runner channel, the maximum entropy production rate exceeded 8,000 Wm−3K−1, and the efficiency of the unit decreased.
Under the zero-flow-rate condition, the entropy production rate of the blade pressure surface and vaneless space continued to increase compared to the turbine condition, owing to the low flow rate. However, the energy loss of the blade suction surface was still minimal. Entropy production rates exceeding 5,000 Wm−3K−1 were observed for the stay-guide vane channel, indicating that the energy loss spread outward. The reverse pump condition had a comparable speed but in the opposite direction of fluid flow of the turbine break condition. The mismatch between the incoming flow and blade rotation direction increased the energy loss. At this time, the vortices blocked the flow channel, forming a high-speed water-blocking ring, and a significant amount of mechanical energy inside the unit was transformed into internal energy.
Relationship Between Vortex Distribution and Energy Loss
Although vortices are caused by shear, no rotational flow occurs when the shear stress direction is parallel, which explains why intense vorticity exists in laminar boundary flow but without vortex structures (Yuan 2020). Because the vorticity and entropy production rates were distributed periodically, the relationship between the energy loss and adverse flow was investigated. Three monitoring points were selected from the guide vane channel, vaneless space, and runner channel, and their vorticities and entropy production rates were quantitatively analyzed and averaged. Figure 8 shows the locations of the monitoring points, and Figure 9 shows the variations in the average vorticity and average entropy production rate.
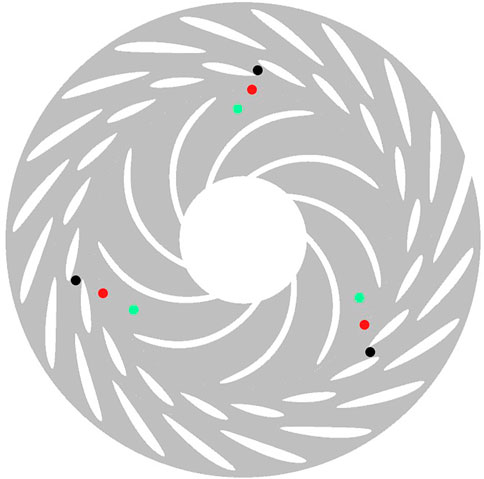
FIGURE 8. Monitoring point setting.
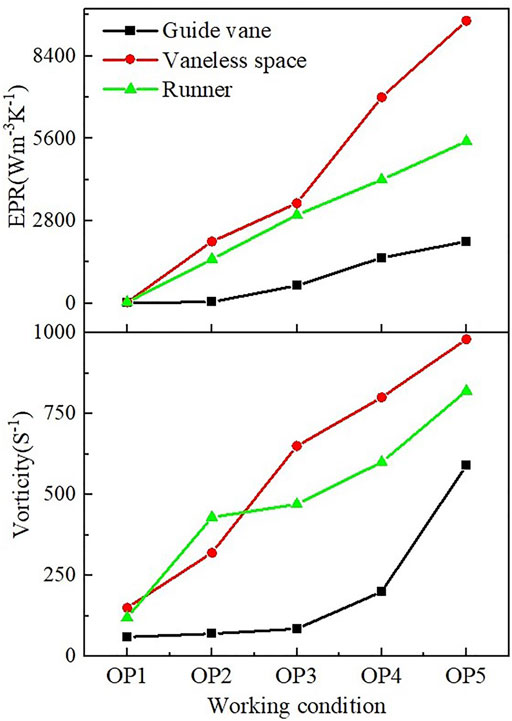
FIGURE 9. Variations in vorticity and entropy production rate.
As can be seen from Figure 9, OP1 has small vorticity everywhere. The average vorticity of the guide vane flow channel in OP2, OP3 is almost no increase, this is because although the high speed flow rate is small, but the bad flow mainly occurs in the runner and vaneless space, the guide vane flow channel does not appear larger velocity gradient. And in OP4, OP5 vorticity increased more, when the blade rotation direction and the direction of incoming flow does not match, vorticity is mainly caused by the guide vane flow channel vortex. The maximum average vorticity is 590 s−1. The vorticity of the runner flow channel is mainly due to the velocity gradient generated by the flow separation. The vorticity increases more in the vaneless space, and the average vorticity is close to 1000 s−1 at OP5, which is also the location of the largest velocity gradient in the whole mainstream area. This indicates that the rotor-stator interaction effects have the greatest impact on the vorticity inside the pump turbine (Li et al., 2021e).
The growth rate of the average EPR is similar to that of the vorticity, which also indicates that the vorticity and energy loss have a strong correlation. At OP5, the average EPR in the vaneless space is close to 10,000 Wm−3K−1, and at this time, the strong rotor-stator interaction effects cause strong vibration, and the mechanical energy is converted into internal energy in a large amount.
The vorticity and entropy production rate in each working condition not only increase in a similar pattern, but also correspond to high entropy production rate in places with high vorticity, which are all near the vaneless space, showing a good match. Vorticity is strongly correlated with energy loss. The runaway and turbine break conditions had more shear strains in the vaneless space dominating the flow. Under both conditions, the rotor–stator interaction in the vaneless space was intense, and the strong shear effect generated larger vorticity than the rotation. Under the zero-flow-rate and reverse-pump conditions, the vaneless space still had the largest vorticity and entropy production rate. Although there are many vortices and large energy loss in the stay-guide vanes channel, the vorticity caused by shear strain reaches 980 s−1 in reverse-pump conditions, while the vorticity caused by rotation is only 590 s−1. Therefore, the vorticity caused by the strong shear effect was more significant than that caused by the rotation.
Conclusion
The aim of this study was to investigate the characteristics of vortex distribution and its relationship with energy losses in the S-shaped region of a pump turbine. The following conclusions are drawn.
1) The |ω|-criterion can be used to derive the vorticity distribution in a flow field based on the vortex analysis of each working condition of the S-shaped region. However, the |ω|-criterion cannot distinguish between rotation and shear motion, whereas the Q-criterion can effectively solve this problem.
2) Under all the conditions, the vorticity and entropy production rate increased, and the passage and separation vortices were densely distributed gradually. Under the zero-flow-rate and reverse pump conditions, vortices propagated towards the stay-guide vanes, significantly blocking the flow channel and obstructing the smooth flow of water.
3) The vorticity and entropy production rates in the vaneless space were the highest. The vorticity and energy loss were strongly correlated, and the vorticity induced by the strong shear effect was more significant than that induced by the rotation.
Data Availability Statement
The raw data supporting the conclusion of this article will be made available by the authors, without undue reservation.
Author Contributions
HZ completed the main writing of the paper, ZEL revised the paper, DL provided writing opinions, HC provided experimental guidance, and ZIL provided software guidance.
Funding
The work was supported by the National Natural Science Foundation of China (Grant No. 52079118), Central leading local (scientific and technological innovation base construction) project XZ202201YD0017C, National Key Research and Development Program (2018YFE0128500).
Conflict of Interest
HC was employed by the company China Three Gorges Construction Engineering Group Co., Ltd., China, ZIL was employed by the company China Gezhouba Group Electromechanical Construction Co., Ltd., China.
The remaining authors declare that the research was conducted in the absence of any commercial or financial relationships that could be construed as a potential conflict of interest.
Publisher’s Note
All claims expressed in this article are solely those of the authors and do not necessarily represent those of their affiliated organizations, or those of the publisher, the editors and the reviewers. Any product that may be evaluated in this article, or claim that may be made by its manufacturer, is not guaranteed or endorsed by the publisher.
References
Caide, P. (2021). Contribute to the Realization of the Goal of “Carbon Peak and Carbon Neutrality” Speed up the Development of Pumped Storage Power Plants[J]. Hydropower and Pumped Storage 7 (06), 4–6. doi:10.3969/j.issn.2096-093X.2021.06.002
Cavazzini, G., Giovanna, Covi, A., Pavesi, G., and Ardizzon, G. (20162016). Analysis of the Unstable Behavior of a Pump-Turbine in Turbine Mode: Fluid-Dynamical and Spectral Characterization of the S-Shape Characteristic. J. Fluids Eng. Trans. ASME 138 (2). doi:10.1115/1.4031368
Chen, Q. F. (2018). Entropy Production Rate Analysis in S Zone for a Pump-turbine[D]. Beijing: Tsinghua University.
Fu, X., Zuo, Z., Chang, H., Li, D., Wang, H., and Wei, X. (2021). Mechanism of Low Frequency High Amplitude Pressure Fluctuation in a Pump-Turbine during the Load Rejection Process. J. Hydraulic Res. 59 (2), 280–297. doi:10.1080/00221686.2020.1780488
Gong, R., Wang, H., Chen, L., Li, D., Zhang, H., and Wei, X. (20132013). Application of Entropy Production Theory to Hydro-Turbine Hydraulic Analysis. Sci. China Technol. Sci. 56 (07), 1636–1643. doi:10.1007/s11431-013-5229-y
Ji, B., Wang, J., and Luo, X. (20162016). Numerical Simulation of Cavitation Surge and Vortical Flows in a Diffuser with Swirling Flow[J]. J. Mech. Sci. Technol. 30 (6). doi:10.1007/s12206-016-0511-0
Kinoue, Y., Shiomi, N., and Sakaguchi, M. (2019). A Pump System with Wave Powered Impulse Turbine[J]. IOP Conf. Ser. Earth Environ. Sci. 240 (5). doi:10.1088/1755-1315/240/5/052009
Kye, B., Park, K., and Choi, H. (2018). Flow Characteristics in a Volute-type Centrifugal Pump Using Large Eddy Simulation[J]. Int. J. Heat Fluid Flow 72, 52–60. doi:10.1016/j.ijheatfluidflow.2018.04.016
Li, D., Chang, H., Zuo, Z., Wang, H., and Liu, S. (2021b). Aerodynamic Characteristics and Mechanisms for Bionic Airfoils with Different Spacings. Phys. Fluids 33 (66), 064101. doi:10.1063/5.0049704
Li, D., Song, Y., Lin, S., Wang, H., Qin, Y., and Wei, X. (2021a). Effect Mechanism of Cavitation on the Hump Characteristic of a Pump-Turbine. Renew. Energ. 167, 369–383. doi:10.1016/j.renene.2020.11.095
Li, D. Y., Gong, R. Z., and Wang, H. J. (2016). Analysis of Vorticity Dynamics for Hump Characteristics of a Pump Turbine Model[J]. J. Mech. Sci. Technol. 30 (8). doi:10.1007/s12206-016-0725-1
Li, D. Y. (2017). Investigation on Flow Mechanism and Transient Characteristics in Hump Region of a pump-turbine[D]. Harbin: Harbin Institute of Technology.
Li, D. Y., Wang, H. J., and Qin, Y. L. (2017). Entropy Production Analysis of Hysteresis Characteristic of a Pump-Turbine Model[J]. Energ. Convers. Manage. 149, 175–191. doi:10.1016/j.enconman.2017.07.024
Li, W., Li, Z., Qin, Z., Yan, S., Wang, Z., and Peng, S. (2022). Influence of the Solution pH on the Design of a Hydro-Mechanical Magneto-Hydraulic Sealing Device. Eng. Fail. Anal. 135, 106091. doi:10.1016/j.engfailanal.2022.106091
Li, W., Li, Z., Wang, Z., Wu, F., Xu, L., and Peng, S. (2021d). Turbulence Intensity Characteristics of a Magnetoliquid Seal Interface in a Liquid Environment. Coatings 11 (11), 1333. doi:10.3390/coatings11111333
Li, Y. B., Wang, Z. K., and Wang, Z. J. (2021e). Numerical Evaluation of Unsteady Flow in a Centrifugal Pump by Omega Vortex Identification Method[J]. JOURNAL ENGINEERING THERMOPHYSICS 42 (12), 3187–3194.
Li, Z., Li, W. X., Li, W., Wang, Q., Xiang, R., Cheng, J., et al. (2021c). Effects of Medium Fluid Cavitation on Fluctuation Characteristics of Magnetic Fluid Seal Interface in Agricultural Centrifugal Pump. Int. J. Agric. Biol. Eng. 14 (6), 85–92. doi:10.25165/j.ijabe.20211406.6718
Liu, C. Q., Gao, Y. S., and Dong, X. R. (2019). Third Generation of Vortex Identification Methods: Omega and Liutex/Rortex Based Systems[J]. J. Hydrodynamics 31 (2). doi:10.1007/s42241-019-0022-4
Liu, C. Q., Wang, Y. Q., and Yang, Y. (2016). New omega Vortex Identification Method[J]. Sci. China(Physics,Mechanics Astronomy) 59 (08), 62–70. doi:10.1007/s11433-016-0022-6
Liu, D. X. (2013). Internal Flow Instability Analysis in Misalignment Guide Vanes of Francis Pump Turbine at Low Specific speed[D]. Lanzhou: Lanzhou University of Technology.
Lu, J. L., Wang, L. K., and Liao, W. L. (2019). Entropy Production Analysis for Vortex Rope of a Turbine Model[J]. SHUILI XUEBAO 50 (02), 233–241. doi:10.13243/j.cnki.slxb.20180762
Ni, D., Yang, M. G., and Gao, B. (2018). Experimental and Numerical Investigation on the Pressure Pulsation and Instantaneous Flow Structure in a Nuclear Reactor Coolant Pump. Nucl. Eng. Des. 337, 261–270. doi:10.1016/j.nucengdes.2018.07.014
Norizan, T. A., RedaReda, E., and Harun, Z. (2018). Enhancement of Vorticity Reduction by Floor Splitter in Pump Sump to Improve Pump Efficiency. Sustainable Energ. Tech. Assessments 26, 28–36. doi:10.1016/j.seta.2017.06.001
Pejovic, S., Krsmanovic, L., and Jemcov, R. (1976). Unstable Operation of High-Head Reversible pump-turbines[J]. Leningrad: IAHR 8th Symposium.
Peng, S. Y. (2020). Numerical Simulation of Solid-Liquid Two-phase Flow of Tubular Turbine Based on Vortex Analysis[D]. Chengdu: Xihua University.
Qin, D. Q., Li, D. Y., and Zhang, G. H. (2017). Energy Analysis in a Pump-Turbine during the Load Rejection Process[J]. J. Fluids Eng. 140 (10). doi:10.1115/1.4040038
Ren, Y., Zhu, Z. C., and Wu, D. H. (2021). Flow Loss Characteristics of a Centrifugal Pump Based on Entropy Production[J]. J. Harbin Eng. Univ. 42 (02), 266–272. doi:10.11990/jheu.201906053
Singh, P. M., Chen, C., and Choi, Y.-D. (2015). Hydrodynamic Performance of a Pump-Turbine Model in the "S" Characteristic Region by CFD Analysis. J. Korean Soc. Mar. Eng. 39 (10), 1017–1022. doi:10.5916/jkosme.2015.39.10.1017
Wangxu, L., Zhenggui, L., Wanquan, D., Lei, J., Yilong, Q., and Huiyu, C. (2021). Particle Image Velocimetry Flowmeter for Natural Gas Applications. Flow Meas. Instrumentation 82, 102072. doi:10.1016/j.flowmeasinst.2021.102072
Yao, Q. W. (2018). Mechanism Study on S-Shaped Characteristics and Hysteresis Effect of a pump-turbine[D]. Harbin: Harbin Institute of Technology.
Yuan, Z. Y., Zhang, Y. X., and Wang, C. (2021). Study on Characteristics of Vortex Structures and Irreversible Losses in the Centrifugal Pump. Proc. Inst. Mech. Eng. A: J. Power Energ. 235 (5), 1080–1093. doi:10.1177/0957650920983061
Zhang, N., Liu, X. K., and Gao, B. (2019a). DDES Analysis of the Unsteady Wake Flow and its Evolution of a Centrifugal Pump. Renew. Energ. 141, 570–582. doi:10.1016/j.renene.2019.04.023
Zhang, Y.-n., Wang, X.-y., Zhang, Y.-n., and Liu, C. (2019b). Comparisons and Analyses of Vortex Identification between Omega Method and Q Criterion. J. Hydrodyn 31 (2), 224–230. doi:10.1007/s42241-019-0025-1
Zhang, Y. N., Liu, K. H., and Li, J. W. (2018a). Analysis of the Vortices in the Inner Flow of Reversible Pump Turbine with the New omega Vortex Identification Method[J]. J. Hydrodynamics 30 (3). doi:10.1007/s42241-018-0046-1
Keywords: pump turbine, S-shaped region, vortex analysis method, vortex distribution, entropy production rate
Citation: Zeng H, Li Z, Li D, Chen H and Li Z (2022) Vortex Distribution and Energy Loss in S-Shaped Region of Pump Turbine. Front. Energy Res. 10:904202. doi: 10.3389/fenrg.2022.904202
Received: 25 March 2022; Accepted: 12 April 2022;
Published: 09 May 2022.
Edited by:
Kan Kan, College of Energy and Electrical Engineering, ChinaReviewed by:
Tianyi Li, University of Minnesota Twin Cities, United StatesDan Zi, China Agricultural University, China
Copyright © 2022 Zeng, Li, Li, Chen and Li. This is an open-access article distributed under the terms of the Creative Commons Attribution License (CC BY). The use, distribution or reproduction in other forums is permitted, provided the original author(s) and the copyright owner(s) are credited and that the original publication in this journal is cited, in accordance with accepted academic practice. No use, distribution or reproduction is permitted which does not comply with these terms.
*Correspondence: Zhenggui Li, bHpoZ3VpQG1haWwueGh1LmVkdS5jbg==