 Fengxue Wang
 Yangsen Ou*
 Xi Xin
 Moyuan Yang
- School of Electric Power, South China University of Technology, Guangzhou, China
The trend of DC development in the medium voltage AC distribution network is obvious. However, due to the constraints of reliability, cost, and power quality, not every AC distribution network is suitable for DC transformation. As for the AC distribution network suitable for DC transformation, it is necessary to solve the problems of multivariable constraint solutions and the demand for sorting and optimizing multi-schemes in DC transformation. Therefore, this study proposes a comprehensive decision-making method for the DC transformation object of the medium voltage AC distribution network. Firstly, a comprehensive evaluation index system for DC transformation is established from four aspects: improving power supply reliability, technical requirements, social benefits, and economic benefits. Among them, the reliability of power supply mainly examines the completion degree of the target. In terms of the technical requirements of DC transformation, it is necessary to consider the constraints of AC transformation and the driving force of DC transformation. As for the social benefits, it reflects the indirect demand for DC transformation, which reflects social development. In terms of economic benefits, it pays attention to the transformation cost and input–output ratio. Then, the combined optimization model is used to solve the index’s comprehensive weight based on the subjective and objective weight model. Moreover, the comprehensive evaluation value of the transformation object is determined by the double-base point method. The scheme optimization model is used to determine the final transformation scheme to guide the power grid enterprises to prioritize the DC transformation projects. Finally, several medium-voltage distribution networks in Guangzhou, Guangdong province, China, are taken as examples to verify the effectiveness of the proposed method.
1 Introduction
The traditional AC distribution network faces the following difficulties: 1) because of the rapid growth of urban power supply load, the load demand and pressure of power supply reliability increase; 2) the continuous development of high-tech industries has higher requirements for power quality; and 3) the reform of the new energy system has led to a continuous surge in urban renewable energy penetration, which puts forward higher requirements for the ability of the grid to absorb clean energy. However, the traditional AC transformation has technical bottlenecks in solving these new problems: 1) under the constraints of space resources, it is difficult to meet the higher requirements of high-density urban loads for power supply capacity; 2) it is difficult to meet the requirements of safe, flexible, and efficient access of renewable energy under the constraints of frequency, phase, and angle; 3) under short-term interruption constraints of power outage transfer, it is difficult to meet the requirements of sensitive loads for uninterrupted high-quality power supply; 4) it is difficult to meet the requirements of the distribution network for closed-loop operation power accommodation under open-loop operation constraints; and 5) under the constraints of the technology level of current distribution equipment, it is difficult to meet the requirements of the distribution network for capacity expansion without exceeding the short-circuit current. The above technical bottlenecks make the DC transformation an important consideration. How to select the object of DC transformation and determine its sequence has become the first consideration. Therefore, this study focuses on the decision-making method for the DC transformation object of the medium voltage AC distribution network.
In the DC transformation, the bipolar three-wire DC distribution network system has more advantages than the urban AC distribution network: 1) the power supply capacity can be increased to about 1.6 times of the original (Rentschler et al., 2018), which is conducive to greatly improving the power supply capacity under the condition of limited space resources and solving the demand problem of rapid load growth; 2) according to the active power dispatching instruction of the system, the converter can realize the power fusion under the closed-loop operation and improve the power supply reliability; 3) through the fast controllability of power electronic equipment and the rational allocation of energy storage devices, high quality power supply of important loads can be realized (Wang et al., 2020), which can solve the problems of the development of high-tech industries; 4) compared with AC, DC grids do not have the frequency and phase angle problem, which can solve the problem of clean energy access; and 5) the current control effect of the inverter can significantly inhibit the short-circuit current. Based on the above analysis, this study determines the means of DC transformation: transforming the urban AC distribution network into a bipolar three-wire DC distribution network system.
Under the limited investment conditions, how to formulate a reasonable DC transformation and investment plan is the concern of power supply enterprises. At present, there are few studies on the DC transformation of urban distribution networks. Rentschler et al. (2018) analyzed the advantages of power supply capacity in DC transformation of the urban distribution network. Chen et al. (2019) comparatively analyzed three DC distribution application scenarios and showed that DC transformation can effectively reduce transmission loss and meet the needs of green power grid development. Cui et al. (2019) proposed an AC/DC party-line power distribution scheme based on Z-type transformer and showed the feasibility and technical advantages of the scheme. Li et al. (2020) used empirical mode decomposition (EMD) for data preprocessing and then evaluated the DC power quality after transformation based on the neural network. Huang et al. (2020) evaluated the DC transformation scheme of the power grid in a large city based on the analytic hierarchy process and entropy weight method. However, all the above studies evaluated the DC transformation of a single distribution network, lacking the basis for selecting this single distribution network for DC transformation. Moreover, the influence of the AC transformation bottleneck on the optimization of DC transformation objects of the urban distribution network is not considered.
In order to formulate a reasonable DC transformation strategy, it is necessary to make comprehensive decisions on multiple urban distribution networks and optimize the distribution network that can give full play to the advantages of DC transformation and maximize the comprehensive benefits of DC transformation. The comprehensive decision-making of urban distribution network transformation objects is an optimization problem, including the establishment of comprehensive evaluation indexes and the optimization of objects under the comprehensive decision-making model. At present, there are a few studies on comprehensive decision-making of distribution network transformation objects. Zhao and Li (2021) proposed evaluation indexes based on the pressure-state-response (PSR) model, combined with principal component analysis and correlation analysis to screen redundant indexes, thus constructing a dynamic energy efficiency index system to evaluate and transform the energy efficiency of industrial park users. Chen et al. (2020) considered the economy and efficiency of social capital participating in the operation of the distribution network, which can make comprehensive decisions on the transformation objects and planning schemes of the distribution network. However, there is still a lack of research on the comprehensive decision-making of DC transformation objects in the urban distribution network. Zhao and Li (2021) and Chen et al. (2020) mentioned that the research subjects are traditional AC transformation objects. Without considering the characteristics of DC transformation, they cannot reflect the direct demand for DC transformation, which can have the driving force by replacing the AC transformation constraints in the urban distribution network, or the indirect demand for DC transformation, which is driven by social development.
At present, the research on decision-making methods mainly focuses on the analytic hierarchy process (AHP) (Huang et al., 2020), interval-valued intuitionistic fuzzy method (De Miguel et al., 2016; Ma and Zhang, 2020), and entropy weight method (Zhao and Li, 2021; Wang et al., 2017; Hu et al. 2020), among others. However, the above methods have some shortcomings in practical engineering: 1) the analytical method ignores the fuzziness and uncertainty of decision-makers; 2) the process of establishing interval-valued intuitionistic fuzzy judgment matrix and the consistency test is complicated, and experts’ risk attitude is not considered effectively; 3) the entropy weight method ignores the value information brought by the correlation and conflict of index data; and 4) there is a lack of effective integration of subjective and objective value information.
According to the above problems, this study proposes a comprehensive decision-making method for the DC transformation object of the urban distribution network, which can make a decision by constructing an evaluation index system, solving the index weight, and determining the comprehensive evaluation value. Firstly, this study constructs a comprehensive evaluation index system of DC transformation objects of the urban distribution network from four aspects: power supply quality improvement demand, DC transformation demand, social benefit demand, and transformation economical efficiency demand. Then, the improved G2 method and the improved criteria importance through the intercriteria correlation weight method (CRITIC) are used to solve the comprehensive weight through the relative entropy combinatorial optimization model, and the comprehensive evaluation value of the object is calculated based on the double-base point method. Combined with the scheme selection model, the optimal scheme is determined to arrange the investment in DC transformation reasonably. Finally, the effectiveness of the method is verified by an example.
2 Comprehensive Evaluation Index System
In order to determine the construction priority of DC transformation objects of the urban distribution network, this study establishes a comprehensive evaluation index system, considering the power supply quality improvement demand, DC transformation demand, social benefit demand, and transformation economical efficiency demand. The structure of this system is shown in Figure 1. The index system aims to guide the optimization of DC transformation objects of the urban distribution network and maximize the comprehensive benefits of DC transformation investment.
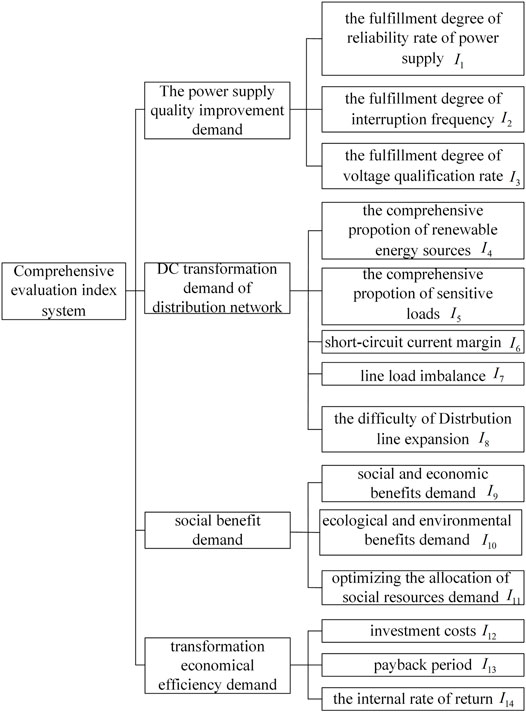
FIGURE 1. Comprehensive evaluation index system of DC transformation object of the urban distribution network.
2.1 The Power Supply Quality Improvement Demand
Improving power supply reliability is the main task of traditional distribution network transformation. In practical engineering, the average reliability rate of power supply and system average interruption frequency index are the main indexes, reflecting the continuity of power supply. In addition, the quality of voltage directly affects the power supply availability and cannot be ignored in the distribution network transformation.
Accordingly, this study uses the power supply quality (Zhao and Li, 2021) covering the above two aspects to characterize the continuous availability of power supply in the distribution network. The power supply quality in this study is comprehensively characterized by the average reliability rate of power supply, the system average interruption frequency index, and the voltage qualification rate (Chen et al., 2020; De Miguel et al., 2016). In the actual planning, it is necessary to consider the matching degree between the current situation of power supply quality and the target level to guide the optimization of the transformation objects. Therefore, this study introduces the fulfillment degree of reliability rate of power supply I1, the fulfillment degree of interruption frequency I2, and the fulfillment degree of voltage qualification rate I3, which can reflect the demand for power supply quality improvement in the distribution network. The definition is as follows:
In this formula, RASAI-1, RSAIFI-1, RVQR-1 and RASAI-T, RSAIFI-T, RVQR-T are the current and target values of the average reliability rate of power supply, system average interruption frequency, and voltage qualification rate of the distribution network, respectively.
The above target values are different from different power supply zones. Usually, the power supply enterprises formulate corresponding planning objectives according to the five types of power supply zones and can be selected according to the actual situation in engineering application.
2.2 DC Transformation Demand of the Distribution Network
In addition to the power supply quality improvement demand, the comprehensive decision-making method of DC transformation objects in the urban distribution network also needs to focus on the DC demand of the urban distribution network. In this regard, from the source-load characteristics, network-side security, and the construction conditions of distribution lines, this study sets up five DC transformation demanding indicators of the distribution network to reflect the different planning areas and different transformation demands of different scenes. The indicators are shown in Figure 1.
The comprehensive proportion of renewable energy sources (RES) and the comprehensive proportion of sensitive loads reflect the DC demand of source-load characteristics in the distribution network, which is from the two aspects of the safe and efficient access demand for RES and the high power supply quality demand for sensitive loads. Short-circuit current margin and line load imbalance reflect the DC demand of network-side security from two aspects of the constraint of substation capacity expansion and the incoordination of line development. From the perspective of spatial resource constraints, the difficulty of distribution line expansion reflects the limited expansion of AC lines with different planning objects and the demand for DC lines with high transmission capacity. The above indicators establish an evaluation system from the three dimensions of source, network, and load, which comprehensively reflects the DC demand for the urban distribution network.
2.2.1 DC Transformation Demand Based on Source and Load Characteristics
Compared with AC, there is no synchronization problem and power quality problem caused by frequency and phase angle in DC distribution, and the reasonable configuration of voltage source converter can effectively play a role in power quality control, which satisfies the demand for renewable energy development for flexible and efficient access, as well as the demand for sensitive load development for high power quality (Wang et al., 2020; Wang et al., 2017). Therefore, this study sets the comprehensive proportion of RES and sensitive load to reflect the DC transformation demand of source and load characteristics for the urban distribution network.
The comprehensive proportion index of RES is defined as
In this formula,
Sensitive loads refer to the user loads that cannot work normally or causes serious losses when the voltage drops instantaneously or breaks shortly (Hu et al., 2020). This kind of loads has high requirements for voltage quality and power supply reliability. The comprehensive proportion index of sensitive loads
In this formula,
2.2.2 DC Transformation Demand Based on Network-Side Security
According to the security constraints of the heterogeneity of short-circuit current level and line load development on the AC distribution network capacity expansion, this study sets short-circuit current margin and line load imbalance index to reflect the DC transformation demand of network-side security.
In the traditional AC distribution network, substation capacity expansion improves the power supply capacity to meet the demand for growing loads, which may lead to excessive short-circuit current of the distribution network and difficult selection of circuit breakers and even affect the safety of the whole network. If the line is expanded by the DC transformation, the short-circuit current will not be significantly increased due to the current control effect of the inverter, which is conducive to the short-circuit current control of the AC system (Wang et al., 2020).
In addition, due to the open-loop operation mode of the traditional AC distribution network, the heterogeneity of line load development will significantly affect the load transfer capacity, reduce the reliability of power supply, and cause a crisis in the safety of the distribution network. However, AC lines are interconnected through DC transformation, and the power flow control ability of the converter can effectively balance the line load rate and maintain the benign development of distribution network lines.
The short-circuit current margin
In the formula,
In the formula, L is the line return;
2.2.3 DC Transformation Demand Based on Construction Conditions of Distribution Lines
The national standard GB 50217 points out that the selection of cable path should be convenient for laying and maintenance and ensure the shortest path under the condition of meeting the safety requirements (Liao et al., 2016). The DC transformation of AC lines into bipolar three-line DC lines can increase the power supply capacity to about 1.6 times the original. In the complex areas of the underground pipe network, such as the urban center, it can effectively reduce the laying path of cable lines and the late operation and maintenance and reduce the influence of cable line laying and maintenance on the complex underground pipe network. It has the advantages of construction and maintenance and economic advantages. On the contrary, when using overhead lines, the high transmission capacity of DC distribution lines can also effectively reduce the occupied corridor of overhead lines. In the urban center area with the high land price and difficult new corridors, DC overhead lines will play obvious economic and construction advantages. Therefore, this study sets the difficulty of distribution line expansion (index I8) to reflect the demand for space resource constraints for the DC distribution network. The index I8 in this study is defined as
In the formula,
2.3 Social Benefit Demand
Social benefit demand is the indirect demand for social development for DC transformation of urban distribution network, including social and economic benefits demand, ecological and environmental benefits demand, and optimizing the allocation of social resources demand.
Social and economic benefit demand refers to the indirect promotion effect of DC transformation on social and economic development, which is characterized by the ratio of gross domestic product (GDP) of loads to total electricity consumption, reflecting the social and economic value of unit electricity consumption. The social and economic benefit demand is defined as
In the formula,
The safe and efficient consumption of RES after DC transformation of the distribution network can effectively reduce the emissions of
The DC transformation of the distribution network can directly or indirectly promote the development of related industries to promote social employment (State Grid Corporation of China estimates that every 100 million RMB investment will increase 700 people’s employment) and play the employment benefits (Liu et al., 2019). In addition, the large-scale consumption of RES after DC transformation can alleviate the transportation and scheduling problem of primary energy to a certain extent and alleviate the pressure of land and water transportation (State Grid Corporation of China, 2017). In addition, the DC transformation also plays a positive role in promoting technological upgrading and innovation, ensuring the power market. According to the local labor, traffic, and other conditions, optimizing the allocation of social resources demand is determined. Like the ecological environment benefit demand, optimizing the allocation of social resources demand (index I11) is also a qualitative index. Its specific calculation is shown in Supplementary Table SA4.
2.4 Transformation Economical Efficiency Demand
The transformation economical efficiency demand of the urban distribution network is the effective control of the cost of transformation investment, financial anti-risk ability, and capital efficiency under the premise of reaching the target level of power supply quality, power supply capacity, and RES access capacity, which means meeting the established transformation goal. In this study, the economic indicators of the DC transformation include investment costs, the payback period, and the internal rate of return (Ministry of Construction of the People’s Republic of China, 2007). Among them, the investment cost is defined as
In the formula, G1 is the cost of equipment purchase, installation, and debugging fees and G2 is the fees for the research and design of new projects and the land renovation and construction.
3 The Comprehensive Decision-Making Model
In this study, a comprehensive decision-making model is designed to optimize the DC transformation objects of the urban distribution network. The steps are as follows: 1) compute the comprehensive weight based on the subjective and objective weight model; 2) solve the comprehensive value of the evaluation objects based on the double-base point method; and 3) constrained by the industry benchmark of total annual investment and financial-economic indicators, the final scheme is determined with the maximum total evaluation value of the scheme as the optimization objective. The process of comprehensive decision-making is shown in Figure 2.
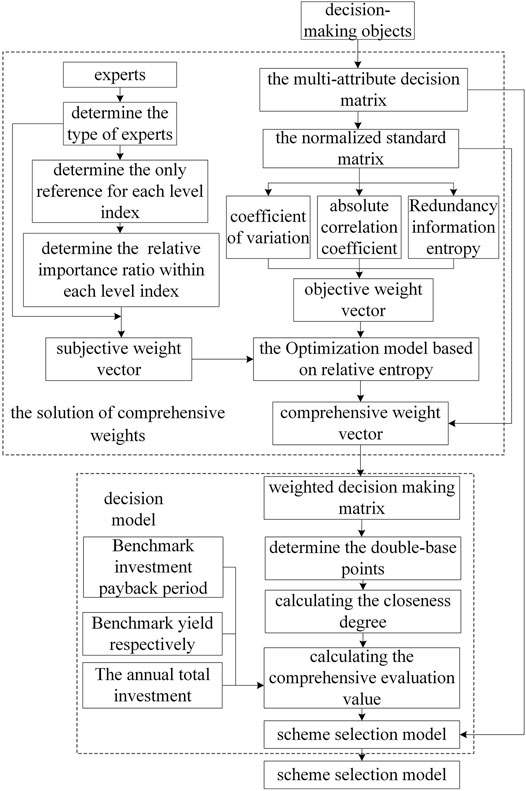
FIGURE 2. Comprehensive decision process.
3.1 The Solution of Comprehensive Weights
The comprehensive decision-making of DC transformation objects in the urban distribution network is a complex multi-index evaluation and optimization problem (Shen et al., 2019). The rationality of index weight is crucial to the evaluation results. A simple subjective or objective weight model has one-sidedness and little credibility (Wang et al., 2021). Therefore, this study combines the subjectivity and objectivity of the improved G2 method and the improved CRITIC method to optimize the combination weighting through the relative-entropy model.
3.1.1 Preprocessing the Indicators
Assuming that
In this formula,
3.1.2 Improved G2 Method
The G2 method is a function-driven subjective weighting method. This method judges the importance of indicators according to expert experience, which can effectively consider the fuzziness of expert experience and the risk state of expert individuals. It is particularly practical in dealing with uncertain decision-making problems (Xie et al., 2010).
In this study, the improved G2 method is introduced on the basis of the original G2 method. The comprehensive decision-making index system is divided into the target layer, criterion layer, and index layer, and the hierarchical structure is shown in Figure 1. Let an upper index be described by the corresponding lower index set
(1) First, determine the least important indicators in the index set, denoted as
(2) Then,
If
(3) After that, the index weight
In this formula,
(4) Finally, the weight obtained is multiplied layer by layer to get the subjective weight vector
3.1.3 Improved CRITIC Method
The CRITIC method (Lin et al., 2018) is a new weighting method for solving weights based on objective data. This method can consider both the comparative strength between transformation objects and the degree of conflict between evaluation indexes so that the weight is objective and accurate. Among them, the contrast intensity reflects the difference of different objects in the same index, which is quantified by standard deviation. The degree of conflict reflects the correlation between different indicators and is quantified by the correlation coefficient.
In this study, the original CRITIC method is improved as follows: 1) the contrast strength between indicators is reflected by the coefficient of variation, and the defects that standard deviation is susceptible to dimension and the mean value are corrected. 2) The absolute value of the correlation coefficient reflects the degree of conflict between indicators and corrects the defect that the original correlation coefficient cannot reflect the same correlation when the positive and negative correlations have the same absolute values; 3) redundancy information entropy (Iuculano et al., 2007) is introduced to reflect the dispersion of indicators so that the empowerment process integrates contrasting strength, conflict degree, and dispersion. The model of the improved CRITIC method based on the objective weighting calculation is
In this formula,
3.1.4 Comprehensive Weight
According to the principle of Kullback relative entropy derived from probability measures and considering the consistency requirement of information contained in the subjective weight vector acquired from the G2 method, the objective weight vector obtained by the improved CRITIC method, and the real weight vector, this study establishes a comprehensive weight optimization model based on relative entropy and solves the comprehensive weight
In the formula, the decision variable is
3.2 Decision Model
3.2.1 Double-Base Point Method
According to the obtained comprehensive weight vector and the standardized attribute decision-making matrix, the weighted decision-making matrix
By taking the optimal value and the worst value of each evaluation index as the double-base points, the optimal and the worst base point vectors are introduced. The optimal base point vector of the weighted decision-making matrix is
The optimal and the worst base point vectors are used as the reference standards of the optimal and the worst transformation objects, respectively. The closeness degree between the selected object and the optimal reference standard is calculated by the double-base point method. The smaller the closeness degree is, the closer the evaluation object is to the optimal transformation object. The closeness degree is
The comprehensive evaluation value of the DC transformation object is
The larger the comprehensive evaluation value is, the higher the planning investment benefit of the DC transformation of the evaluated object is. When formulating the planning scheme, the investment objects of the DC transformation should be selected according to the evaluation value from high to low.
3.2.2 Scheme Selection Model
By taking the maximum overall evaluation value of the scheme as the goal and the total annual investment and industry benchmark of economic indexes as the constraint, the final scheme is determined, namely,
In the formula, F is the objective function of the scheme selection model; K is the number of distribution networks selected for the DC transformation in turn; and
In this formula,
4 Example Analysis
Based on the above comprehensive decision-making method for the DC transformation of urban distribution network, seven 10 kV urban distribution networks in a southern province of China are selected and recorded as S1∼S7, respectively, to verify the feasibility of the proposed method.
The indexes of seven distribution networks are shown in Table 1. Due to the lack of data, indexes I8, I10, and I11 (bold type) in Table 1 are transformed from qualitative value information to quantitative score by the Delphi-gold segmentation cloud generation method (Zhu et al., 2020; Han et al., 2020).
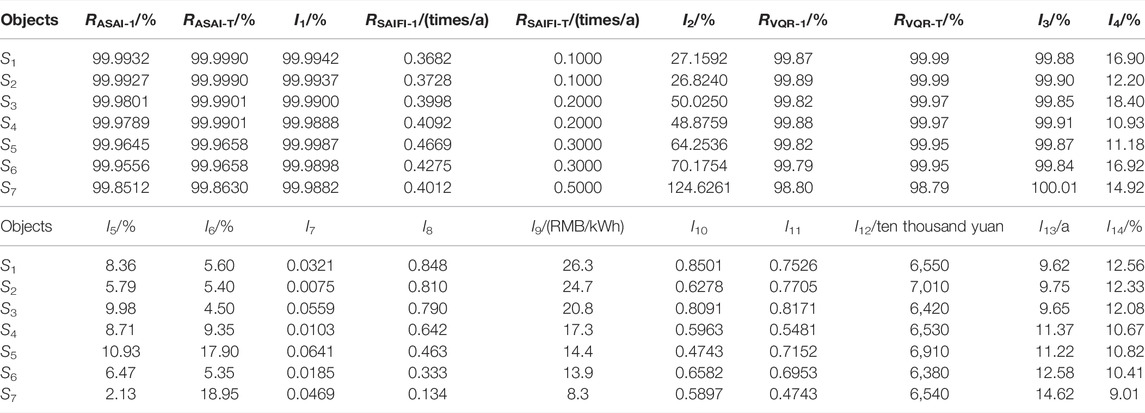
TABLE 1. Index data of each distribution network.
4.1 Analysis of Evaluation Results
The comprehensive evaluation values of seven distribution networks are shown in Table 2. It can be seen that the comprehensive evaluation value of S3 is the highest among the seven urban distribution networks (S1∼S7) to be DC retrofitted, which means the comprehensive benefit of S3’s DC transformation is the best. When upgrading the urban distribution network, S3 should be the preferred DC transformation object.
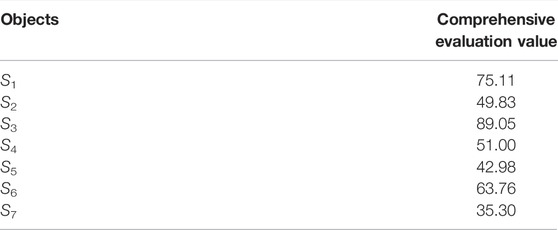
TABLE 2. Comprehensive evaluation value of different objects.
In order to analyze the transformation demand and transformation economy of urban distribution network S1∼S7 in more detail, the radar chart for index evaluation of criteria level is analyzed by evaluating the indexes in the criterion layer, and the radar chart for index evaluation of criteria level is shown in Figure 3.
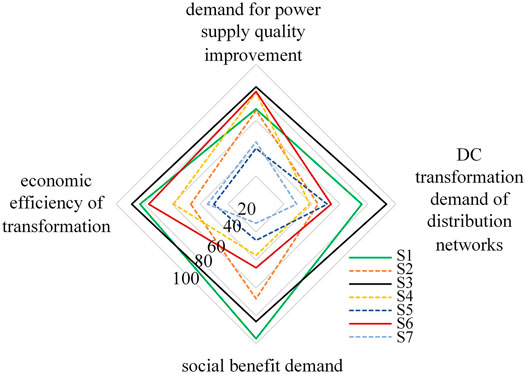
FIGURE 3. Radar chart for index evaluation of criteria level.
Further, as shown in Figure 3, the demands for the upgrade and transformation of S1 in all the aspects are large and the transformation economical efficiency is also good. Table 2 shows that the comprehensive evaluation value is second only to S3. Therefore, the DC transformation of S1 is further carried out when the investment after S3 is still sufficient.
Overall, considering the investment cost constraints, the project should prioritize the DC transformation of the distribution network with a larger comprehensive evaluation value.
4.2 Comparative Analysis of Evaluation Methods
In order to further illustrate the rationality of the comprehensive weight proposed by this study, the improved G2 method, the improved CRITIC method, the method proposed by Xie et al. (2010) (G2—entropy weight method), and the comprehensive method in this study are used to evaluate seven distribution networks comprehensively. The evaluation results are shown in Figure 4.

FIGURE 4. Comparison of comprehensive evaluation results.
Through the intuitive comparison in Figure 4, it can be seen that the differences in the evaluation results are mainly reflected in the distribution network S2, S4, S5, and S7. The evaluation results of the improved G2 method and improved CRITIC method are S2>S4>S5>S7 and S7>S5>S2>S4, respectively. This is mainly because the index weight of the improved G2 method is only determined subjectively by decision-makers, ignoring the objective information of the index. Similarly, the improved CRITIC method focuses on objective information and ignores the importance of expert opinions in decision-making, which will also lead to deviation in evaluation results. Although the evaluation results obtained by the method proposed by Xie et al. (2010) are consistent with those in this study, compared with Xie et al. (2010), the comprehensive method in this study introduces the analytical theory in the process of expert decision-making. In the process of handling objective information, the comparative strength, conflict degree, and discreteness of the index data are comprehensively considered. In summary, the evaluation results in this study will be more reasonable and accurate. In addition, the sensitivity of the evaluation results obtained by this method is 152.24%, which is also significantly better than 100.59% of the method proposed by Xie et al. (2010).
In summary, the evaluation results obtained by the method in this study are more reasonable, accurate, and with greater identification, which can be well applied to the optimization of DC transformation objects of urban distribution networks in this study.
4.3 Analysis of Decision Results
In order to illustrate the correctness of the comprehensive decision-making results in this study, the decision-making results under five selection principles are compared and analyzed. Principle A is the low average reliability of power supply; principle B is the low reliability of traditional power supply; principle C is the high demand for power supply quality improvement; principle D is the high demand for DC distribution network; and principle E is the comprehensive evaluation value of this study that is high. The comprehensive evaluation results under the five principles are shown in Table 3.
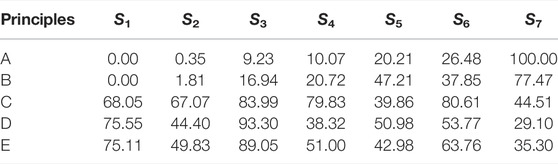
TABLE 3. Evaluation results under five principles.
Assume that the total annual investment is 20 million yuan, the industry benchmark investment payback period is 16 years, and the benchmark yield is 8%. The investment priorities, selected distribution network, and total investment costs of the five principles are shown in Table 4. Because the investment payback period and internal rate of return of the seven distribution networks meet the financial and economic constraints, Table 4 only shows the total investment cost of the preferred object under investment cost constraints.
(1) Principle A takes the low average power supply reliability as the basis for the optimization of the transformation objects. As shown in Tables 3, 4, the preferred objects are S7, S6, and S5. However, with the continuous improvement of users’ demand for uninterrupted power supply, the interruption frequency will become the main factor affecting users’ electricity experience at a high level of power supply reliability. Therefore, in principle B, the traditional power supply reliability is comprehensively reflected by two indicators: power supply reliability rate and system average interruption frequency. Although the optimization objects are still S7, S5, and S6, the order of optimization has changed. This is mainly because the average interruption frequency of S5 is 0.4669, which is significantly higher than the 0.4275 of S6. The optimization of the transformation objects through method B has the significance of improving power supply reliability but does not consider the differentiated demand of distribution networks.
(2) Principle C is based on the improvement of power supply quality. According to Tables 3, 4, the selected objects are S3, S6, and S4, which are different from principle B. This is mainly because principle C considers the different requirements of distribution networks for power supply quality. Table 1 shows that compared with S7 and S6, although S3 and S4 have higher power supply reliability, their gap with the target level is larger than that of S7 and S6. In addition, principle C also reflects the demand for the improvement of power availability of distribution networks through the voltage qualification rate. In general, the optimization of the transformation objects through principle C has the significance of improving the differentiated power supply quality level. However, the direct and indirect demand for the DC transformation of urban distribution networks is not considered.
(3) Although the principle D effectively considers the DC transformation demand of distribution networks, it abandons the demand for the improvement of power supply quality without considering the social benefit and the economical efficiency, which is not comprehensive enough. However, principle E considers the differentiated demand of distribution networks and fully considers the direct and indirect demand of DC transformation, which can effectively bring into play the comprehensive benefits of DC transformation. As shown in Tables 3, 4, the optimization objects and method D are the same as S3, S1, and S6. This is because of the highest importance of the DC transformation demand of distribution networks under the indexes in the four-criterion layer, the large demand for upgrading and transformation in all aspects of S3, S1, and S6, and the good economic efficiency of transformation. It can be analyzed in detail through the radar diagram in Figure 2, which is not repeated here.
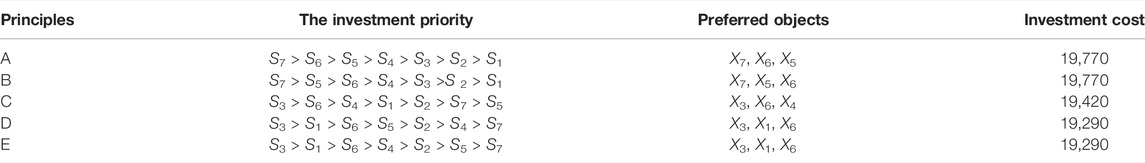
TABLE 4. Optimization results under five principles.
It can be seen that the comprehensive decision results in this study can effectively reflect the comprehensive benefits of DC transformation of urban distribution networks, which can guide the distribution network planning department to arrange the priority scheme of DC transformation objects reasonably.
5 Conclusion
Aiming at the problem that there is no quantitative decision-making method for DC transformation priority of multiple distribution networks in urban distribution network upgrading, this study carried out the following work:
(1) Starting from the demand and economy of urban distribution network upgrading and transformation, considering the differentiated demand for power supply quality of distribution network transformation, and taking the direct demand of DC transformation driven by the restrictive DC transformation of AC transformation and the indirect demand of DC transformation driven by social development as the starting point, a comprehensive evaluation index system for DC transformation objects is designed, which comprehensively considers the demand for power supply quality improvement, DC transformation demand of distribution networks, social benefit demand, and transformation economical efficiency.
(2) The G2 method is improved by introducing the principle of the analytic hierarchy process to determine the subjective weight of the index, which can comprehensively consider the fuzziness of expert experience and the risk state of expert individuals. At the same time, the improved CRITIC method is used to determine the objective weight, which can comprehensively consider the contrast strength, conflict degree, and discreteness between indicators so that the weight is objective and accurate. The comprehensive weight optimization model based on relative entropy is established to make the evaluation results more reasonable, accurate, and identifiable. The example shows that the sensitivity of evaluation results is increased by about 50%.
(3) Based on the double-base point method and scheme selection model, a comprehensive decision model for the DC transformation of the urban distribution network is established. The example shows that the model can comprehensively consider the power supply quality improvement demand, DC transformation demand, social benefit demand, and transformation economical efficiency demand; maximize the comprehensive benefits in many aspects; arrange investment priorities to form transformation schemes; and prioritize the transformation of urban distribution network with the optimal comprehensive benefits.
China is vigorously promoting distributed renewable energy, electric vehicles, and energy storage, including distributed the photovoltaic, distributed energy storage system, microgrid, and electric vehicle cluster. Among them, there are many demands for DC transformation of the existing AC distribution network and for fine planning considering electric vehicles, renewable energy, and energy storage on the basis of DC transformation.
In this paper, the comprehensive decision of the DC transformation object is preliminarily made. However, the concrete DC transformation scheme has not been discussed. Therefore, after selecting the DC transformation object, designing the refined DC transformation scheme, which needs to consider the global optimization/sub-optimization that meets the multi-objectives of reliability, economy, power quality, safety, and flexibility of the transformation distribution network, and considering the optimal allocation of distributed renewable energy in time and space, such electric vehicles and energy storage, is the next need for further research.
Data Availability Statement
The raw data supporting the conclusion of this article will be made available by the authors without undue reservation.
Author Contributions
YO proposed the technical ideas and key formula derivation of the full text and presided over the content of the example design. XX mainly provided great support for simulation calculation and verification of results. MY put forward many positive suggestions on the technical content of the manuscript. FW was responsible for writing this manuscript.
Funding
This study received funding from the science and technology project of China Southern Power Grid, project number GDKJXM20173253. The funder was not involved in the study design, collection, analysis, interpretation of data, the writing of this article, or the decision to submit it for publication.
Conflict of Interest
The authors declare that the research was conducted in the absence of any commercial or financial relationships that could be construed as a potential conflict of interest.
Publisher’s Note
All claims expressed in this article are solely those of the authors and do not necessarily represent those of their affiliated organizations or those of the publisher, the editors, and the reviewers. Any product that may be evaluated in this article, or claim that may be made by its manufacturer, is not guaranteed or endorsed by the publisher.
Acknowledgments
The authors thank the planning center of Guangdong Power Grid Co., Ltd. for its financial and technical support. The discussion with the personnel of the organization enables the authors to understand the application demand and development trend of the distribution network in China.
Supplementary Material
The Supplementary Material for this article can be found online at: https://www.frontiersin.org/articles/10.3389/fenrg.2022.906047/full#supplementary-material
References
Chen, X., Han, J., Zhang, Q., and Wang, Q. (2019). “Economic Comparison of AC and DC Distribution System,” in IEEE 8th International Conference on Advanced Power System Automation and Protection (APAP), Xi'an, China, 21-24 Oct. 2019 (IEEE), 769–774. doi:10.1109/APAP47170.2019.9225098
Chen, Y., Li, J., Sheng, K., Yang, T., Xu, X., Han, Z., et al. (2020). Many-criteria Evaluation of Infrastructure Investment Priorities for Distribution Network Planning. IEEE Access 8, 221111–221118. doi:10.1109/ACCESS.2020.3043248
Cui, S., Lee, J.-H., Hu, J., De Doncker, R. W., and Sul, S.-K. (2019). A Modular Multilevel Converter with a Zigzag Transformer for Bipolar MVDC Distribution Systems. IEEE Trans. Power Electron. 34 (2), 1038–1043. doi:10.1109/TPEL.2018.2855082
De Miguel, L., Bustince, H., Pekala, B., Bentkowska, U., Da Silva, I., Bedregal, B., et al. (2016). Interval-Valued Atanassov Intuitionistic OWA Aggregations Using Admissible Linear Orders and Their Application to Decision Making. IEEE Trans. Fuzzy Syst. 24 (6), 1586–1597. doi:10.1109/TFUZZ.2016.2543744
Han, W., Lu, X. S., Zhou, M., Shen, X., Wang, J., and Xu, J. (2020). An Evaluation and Optimization Methodology for Efficient Power Plant Programs. IEEE Trans. Syst. Man. Cybern. Syst. 50 (2), 707–716. doi:10.1109/TSMC.2017.2714198
Hu, W., Guo, Q., Zhou, Y., Kang, Y., Bing, H., and Bao, D. (2019). Dynamic Comprehensive Methodology for Assessing Power Development Level Based on Provincial Data. Csee Jpes 6 (3), 672. doi:10.17775/CSEEJPES.2018.00910
Huang, C., Zhu, Z., Cao, Y., Liu, Z., and Shi, J. (2021). “Comprehensive Evaluation of Wiring Mode of Distribution Network in Large Overseas Cities,” in The 16th IET International Conference on AC and DC Power Transmission (ACDC 2020) (IEEE), 1024. doi:10.1049/icp.2020.0276
Iuculano, G., Nielsen, L., Zanobini, A., and Pellegrini, G. (2007). The Principle of Maximum Entropy Applied in the Evaluation of the Measurement Uncertainty. IEEE Trans. Instrum. Meas. 56 (3), 717–722. doi:10.1109/TIM.2007.894915
Li, H., Yi, B., Li, Q., Ming, J., and Zhao, Z. (2020). Evaluation of DC Power Quality Based on Empirical Mode Decomposition and One-Dimensional Convolutional Neural Network. IEEE Access 8, 34339–34349. doi:10.1109/ACCESS.2020.2974571
Liao, S., Xu, J., Sun, Y., Gao, W., Ma, X.-Y., Zhou, M., et al. (2016). Load-Damping Characteristic Control Method in an Isolated Power System with Industrial Voltage-Sensitive Load. IEEE Trans. Power Syst. 31 (2), 1118–1128. doi:10.1109/TPWRS.2015.2424240
Lin, Z., Wen, F., Wang, H., Lin, G., Mo, T., and Ye, X. (2018). CRITIC-based Node Importance Evaluation in Skeleton-Network Reconfiguration of Power Grids. IEEE Trans. Circuits Syst. II 65 (2), 206–210. doi:10.1109/TCSII.2017.2703989
Liu, X., Liu, Y., Liu, Y., Xiang, Y., and Yuan, X. (2019). Optimal Planning of AC-DC Hybrid Transmission and Distributed Energy Resource System: Review and Prospects. Csee Jpes 5 (3), 409. doi:10.17775/CSEEJPES.2019.00540
Ma, L., and Zhang, X. (20202020). Economic Operation Evaluation of Active Distribution Network Based on Fuzzy Borda Method. IEEE Access 8, 29508–29517. doi:10.1109/ACCESS.2020.2972015
Ministry of Construction of the People's Republic of China (2007). General Administration of Quality Supervision, Inspection and Quarantine of the People's Republic of China. GB 50217-2007 Code for Design of Cables of Electric Engineering. Beijing: China Electric Power Press.
Okoli, C., and Pawlowski, S. D. (2004). The Delphi Method as a Research Tool: An Example, Design Considerations and Applications. Inf. Manag. 42 (1), 15–29. doi:10.1016/j.im.2003.11.002
Rentschler, A., Kuhn, G., Delzenne, M., and Kuhn, O. (2018). “Medium Voltage DC, Challenges Related to the Building of Long Overhead Lines,” in IEEE/PES Transmission and Distribution Conference and Exposition (T&D), Denver, CO, USA, 16-19 April 2018 (IEEE), 1–5. doi:10.1109/TDC.2018.8440219
Shen, Y., Chen, Y., Zhang, J., Sang, Z., and Zhou, Q. (2019). Self-Healing Evaluation of Smart Distribution Network Based on Uncertainty Theory. IEEE Access 7, 140022–140029. doi:10.1109/ACCESS.2019.2939537
State Grid Corporation of China (2017). Q/GDW 11723-2017 the Guidelines of Comprehensive Evaluation on AC/DC Hybrid Power Distribution Network. Beijing: China Electric Power Press.
Wang, J., Liu, S., Wang, S., Liu, Q., Liu, H., Zhou, H., et al. (2021). Multiple Indicators-Based Health Diagnostics and Prognostics for Energy Storage Technologies Using Fuzzy Comprehensive Evaluation and Improved Multivariate Grey Model. IEEE Trans. Power Electron. 36 (11), 12309–12320. doi:10.1109/TPEL.2021.3075517
Wang, J., Pang, W., Pang, W., Wang, L., Pang, X., and Yokoyama, R. (2017). Synthetic Evaluation of Steady-State Power Quality Based on Combination Weighting and Principal Component Projection Method. Csee Jpes 3 (2), 160–166. doi:10.17775/CSEEJPES.2017.0020
Wang, Y., Chen, S.-Z., Wang, Y., Zhu, L., Guan, Y., Zhang, G., et al. (2020). A Multiple Modular Isolated DC/DC Converter with Bidirectional Fault Handling and Efficient Energy Conversion for DC Distribution Network. IEEE Trans. Power Electron. 35 (11), 11502–11517. doi:10.1109/TPEL.2020.2985232
Xie, J., Qin, Y., Xu, J., Wang, L., and Meng, X. (2010). “Study on the Fuzzy Comprehensive Evaluation of the Railway Emergency Plan Based on G2 Method,” in 5th International Conference on Computer Science & Education, 1254–1257. doi:10.1109/ICCSE.2010.5593722
Zhao, H., and Li, J. (2021). Energy Efficiency Evaluation and Optimization of Industrial Park Customers Based on PSR Model and Improved Grey-TOPSIS Method. IEEE Access 9, 76423–76432. doi:10.1109/ACCESS.2021.3081142
Keywords: urban distribution network, DC transformation, optimization of object, comprehensive decision making, comprehensive evaluation index system
Citation: Wang F, Ou Y, Xin X and Yang M (2022) Comprehensive Decision-Making Method for DC Transformation Object of Medium Voltage AC Distribution Network. Front. Energy Res. 10:906047. doi: 10.3389/fenrg.2022.906047
Received: 28 March 2022; Accepted: 20 April 2022;
Published: 27 May 2022.
Edited by:
Ke-Jun Li, Shandong University, ChinaCopyright © 2022 Wang, Ou, Xin and Yang. This is an open-access article distributed under the terms of the Creative Commons Attribution License (CC BY). The use, distribution or reproduction in other forums is permitted, provided the original author(s) and the copyright owner(s) are credited and that the original publication in this journal is cited, in accordance with accepted academic practice. No use, distribution or reproduction is permitted which does not comply with these terms.
*Correspondence: Yangsen Ou , MTQwMDE2NjA3N0BxcS5jb20=