 Weifeng Xu1
 Liguo Weng
- 1State Grid Hangzhou Xiaoshan Power Supply Company, Hangzhou, China
- 2Zhejiang Zhongxin Power Engineering Construction Co., Ltd., Hangzhou, China
Normal power line insulators ensure the safe transmission of electricity. The defects of the insulator reduce the insulation, which may lead to the failure of power transmission systems. As unmanned aerial vehicles (UAVs) have developed rapidly, it is possible for workers to take and upload aerial images of insulators. Proposing a technology to detect insulator defects with high accuracy in a short time can be of great value. The existing methods suffer from complex backgrounds so that they have to locate and extract the insulators at first. Some of them make detection relative to some specific conditions such as angle, brightness, and object scale. This study aims to make end-to-end detections using aerial images of insulators, giving the locations of insulators and defects at the same time while overcoming the disadvantages mentioned above. A DEtection TRansformer (DETR) having an encoder–decoder architecture adopts convolutional neural network (CNN) as the backbone network, applies a self-attention mechanism for computing, and utilizes object queries instead of a hand-crafted process to give the direct predictions. We modified this for insulator detection in complex aerial images. Based on the dataset we constructed, our model can get 97.97 in mean average precision when setting the threshold of intersection over union at 0.5, which is better than Cascade R-CNN and YOLOv5. The inference speed of our model can reach 25 frames per second, which is qualified for actual use. Experimental results demonstrate that our model meets the robustness and accuracy requirements for insulator defect detection.
1 Introduction
Insulators play an important role in the electric transmission line system since they provide insulation and hold electric transmission lines mechanically. These components assist transmission lines which transmit a quantity of high-quality electrical power to the users. Insulators are subjected to large mechanical tension and extremely high voltage with a long time of exposure outdoors. The working environment can lead to some defects of insulators which are direct threats to the stability and safety of transmission lines (Park et al., 2017; Tao et al., 2018; Zhai et al., 2018). Hence, considering the importance of insulators and the danger caused by insulator defects, efficient detection of insulator defects can be practical and significant.
To figure out how to detect insulator defects, it is essential to understand the main types of insulators and defects. Insulators can be divided into glass insulators, porcelain insulators, andcomposite insulators according to the material type. Among them, the porcelain insulator is the most common one. Defects such as dirty, crack, and burst often occur during the daily running process. Among them, burst results in caps missing, which is why burst defects can be the most dangerous defects. Also, when a crack occurs, the glass insulator is designed to burst so that it can be easily detected. The harm to the power system brought by these defects can be concluded into one: the rated insulation level of the insulator decreases. As a result, reclosing devices of transmission lines fail to coincide, causing permanent fault of transmission lines and seriously threatening the safety and stability of the power grid. Considering the problems mentioned above, it is reasonable for us to design a capable network to detect burst defects occurring in the porcelain insulator.
Power transmission systems transfer electric energy over a long distance and stretch over mountains and rivers where workers have difficulty getting a close view of transmission lines. In this case, aerial inspection platforms are available to get pictures of electrical equipment from a short distance at different angles. The high efficiency and safety provided by aerial inspection platforms used in the task of visually inspecting power transmission systems have been proven in many studies (Wang et al., 2010; Luque-Vega et al., 2014). As unmanned aerial vehicles (UAVs) have developed rapidly nowadays, they have been equipped with a larger battery, stabler gimbal, and high-definition camera. Compared with helicopters, UAVs can obtain images which have the same or even better performance in the subsequent work, while having a lower cost and more convenient experience. A study by Takaya et al. (2019) presents a UAV system designed for autonomous inspection of electrical transmission lines. Wang et al. (2022) gives a review of UAV power line inspection.
The background of images taken by UAVs can be quite complicated, which may result in false detections. In order to reduce the disadvantageous impact of this issue, former studies usually locate insulators at first and detect defects based on the results of the first step. Traditional computer vision methods principally finish the task of location through Histogram of Oriented Gradient (HOG) features and Support Vector Machine (SVM) classifiers (Zhao et al., 2016; Zuo et al., 2017). These traditional methods have problems such as high computational costs and tight requirements of images. With the development of a deep learning network, quite a few efficient methods have been proposed to locate defects of insulators. Hu et al. (2019) and Zhao et al. (2019) located insulators using Fast RCNN and Faster RCNN. Wu et al., 2019 used improving YOLOv3 as a location method. Xia et al. (2022) and Qiu et al. (2022) show the possibility of using CenterNet and YOLOv4 in this task. Compared to traditional methods, a deep learning network can accomplish tasks faster and more accurately according to these works mentioned above.
Throughout the development of insulator defect detection methods, there is no study that uses a transformer as a backbone network. This study aims to bring a transformer, which makes big success in Natural Language Processing (NLP) tasks, to this specific task. When it comes to object detection, Carion et al. (2020) developed a DEtection TRansformer (DETR) that showed a significant performance on the challenging Common Objects in Context (COCO) dataset. Moreover, this approach can get rid of many hand-designed components like a Non-Maximum Suppression (NMS) procedure or anchor generation. It achieves better performance on large objects than a faster region-based convolutional neural network (Faster R-CNN). The better performance than the state-of-art CNN backbone network shows great potential in object detection tasks or insulator defect detection more specifically.
The main contributions of this study are as follows.
1) As far as we know, we are the first to introduce a transformer structure in the insulator defect detection task. The final results show that the self-attention mechanism and encoder–decoder structure have great potential in computer vision tasks.
2) While former studies have a complicated detection pipeline, DETR is a true end-to-end approach which directly outputs the final set of predictions containing not only bounding boxes but also object classes due to parallel decoding.
3) The public insulator dataset is small in number and single in insulator category; hence, we triple the number of images by data augmentation and adding other types so that the model is less likely overfitting and the result is more convictive.
The rest of this study is organized as follows: Section 2 briefly discusses related works of insulator defect detection and Transformer. Section 3 presents the method we used and details of our model. The settings and results of our experiment are shown in Section 4. Eventually, we come to a conclusion in Section 5.
2 Related Work
In this section, we have a review of former works on insulator defect detection. Since the method we proposed is based on deep learning, only deep learning frameworks are reviewed. After that, a brief introduction of Transformer, which is proposed in NLP originally, is presented.
2.1 Insulator Defect Detection
With computers developing at top speed in the past decade, deep neural networks, such as convolutional neural networks (CNNs), requiring a high calculation power, can be realized and put into use. As for object detection networks, there are two main categories: one-stage networks and two-stage networks. It is necessary to do research on these two categories. In the work of Zhao et al. (2016), CNN is applied to extract features of insulators; then they adopt Support Vector Machine (SVM) to give results based on these features. This method does not carry through deep learning and suffers from the problem that different sizes of insulators affect feature extraction. To overcome the disadvantage brought by traditional vision-based methods, CNN is applied in the second step called Defect Detector (Tao et al., 2018). The cascading architecture used in that study transforms defect detection into a two-level object detection, which can improve precision effectively. Nevertheless, it costs a long time to give the final result. One-stage object detection methods such as You Only See Once (YOLO) are also applied in the same task. YOLOv2 has already been used to detect insulators, and it can output in an average time of 0.04 s, while the accuracy only reaches 88% (Sadykova et al., 2019). In the work of Liu et al. (2021), a YOLO-based model called MTI-YOLO is trained to detect insulators in real time. The result shows that it only takes 6.44 ms to output. A high processing speed makes it possible to handle 155 frames per second, so it can process videos taken by UAV, which is usually 24 or 30 frames per second. As a side effect of high speed, the precision of 95% is not as high as that of the two-stage methods.
In summary, the performance that the latest CNN-based models achieve shows the possibility to meet the practical needs of insulator defect detection. As mentioned above, two-stage networks can achieve high precision and recall rates benefited from the two separated steps. At the same time, this structure causes a problem that it is difficult to train and costs much more time to process an image than one-stage networks. The processes of two-stage networks have a common issue, which is that they extract features of images at first and train a classifier to classify boxes acquired in the first step. This makes it more like a classification task rather than an object detection task. In contrast, one-stage networks can achieve real time since these models process an image within 10 ms. However, they have a disadvantage, which is low accuracy. Considering the advantages and disadvantages existing in both networks, this work prefers one-stage networks because of the simple training and real time. Hence, low accuracy is the most urgent problem to work out. The CNN backbone used in the latest one-stage networks still shows weakness. To achieve a better performance, the CNN backbone should be replaced with a more advanced backbone.
2.2 Transformer
With the advent of Vaswani et al. (2017), attention models are widely used in NLP, automatic speech recognition (ASR), computer vision (CV), and so on. Since most competitive neural sequence transduction models have an encoder–decoder structure, the Transformer follows this overall architecture. Inputs of Transformer are embedded into a sequence. After adding positional encoding, input embedding is imported into the encoder. The correlation among inputs is calculated. As for the decoder, it is designed to output an element corresponding to the relation of inputs since Transformer is applied in machine translation.
With the big success of Transfomer, models based on Transformer are proposed for many other tasks such as object detection (Carion et al., 2020) and medical image segmentation (Chen et al., 2021). To the best of our knowledge, we are the first to bring a transformer-based network into the task of insulator defect detection.
3 Proposed Method
For the purpose of detecting insulators and defects if any in aerial images with a complex background, the method proposed here aims to give a prediction bounding box fast and accurately. In Figure 1, we show the whole pipeline of detection. To begin with, the image is fed into a CNN backbone to generate a set of image features. After that, features along with positional encoding are passed into the transformer encoder. The transformer decoder takes as input a number of embeddings called object queries. The output of the encoder is added during the computation of the decoder to generate the same number of embeddings. In the end, each output embedding of the decoder can be computed by a prediction feed-forward network (FFN) to give every box with the corresponding class. In a special class, “no object” stands for the meaning that nothing is detected in this box.
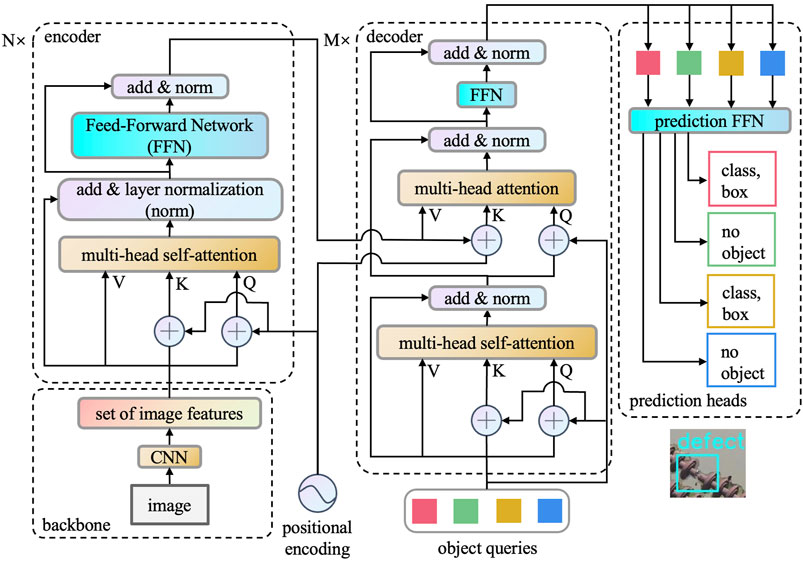
FIGURE 1. DETR—model architecture.
3.1 Backbone
DETR starts from inputting images
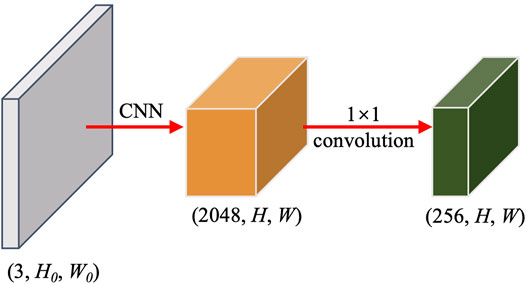
FIGURE 2. Architecture of the backbone.
3.2 Positional Encoding
Since the self-attention layer in the encoder and decoder cannot capture the absolute position of the sequence inputted, it is necessary to inject additional information to input embeddings. The process of adding extra infromation is positional encoding. In the original work of Transformer (Vaswani et al., 2017), sine and cosine functions of different frequencies are used:
where dmodel equals d in the feature map z0, pos denotes the position in sequence and pos ∈ [1, HW], i denotes the dimension, and i ∈ [0, dmodel/2). With the help of sine and cosine functions,
the relative position relationship between token pos and pos + k can be calculated by
The reason why the relative position of tokens is considered is that objects in the image have their own positions. It is important to add positional encoding to the feature map so that the model can output a more accurate result. Since the feature map of the image is 2-D, not only direction x but also y should be taken into account. The amended positional encoding which is used here looks like
where i ∈ [0, dmodel/4), posx ∈ [1, HW], and posy ∈ [1, HW]. The positional encoding of axis x and y is calculated by 4, 5. We can get two vectors
The outputs of backbone and positional encoding are reshaped into (HW, 1, d = 256) and added together. The process described above is visualized in Figure 3.
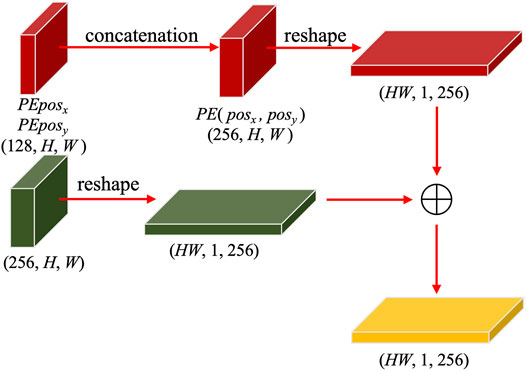
FIGURE 3. Add positional encoding to the feature map.
3.3 Transformer Encoder
The encoder is built up of N identical layers, and each layer is made up of four sublayers. To be specific, the layer contains these components: multi-head self-attention, add and layer normalization, and feed-forward network. Details of every part will be introduced below.
3.3.1 Self-Attention
The input matrix can be split into 1-D vectors with dimension d = 256, and the number of vectors is HW. Every 1-D vector is transformed into query vector q, key vector k, and value vector v via multiplying by three different transformation matrixes: Wq, Wk, and Wv,
The whole process of calculation can be divided into four steps:
1 Compute the dot products of query and all keys as scores: S = Q ⋅ KT
2 Normalize scores to avoid the vanishing gradient of the softmax function:
3 Obtain weights from scores: W = softmax (S′)
4 The attention score of itself is obtained by W ⋅ V
Scores obtained in step 1 reflect the correlation between query and key. The higher the score is, the more the attention given when there is output prediction in the following procedure. Assuming that d is large, the results of step 1 can be excessively large and function softmax has a problem of vanishing gradient. Hence, the results of step 1 should be divided by
There is a disadvantage to single-head attention. Considering the situation that several objects appear in one image, it is hard for the model to catch all objects at one glance. Hence, multi-head attention is proposed, as shown in Figure 4. Combining several single-head self-attention layers, we can get the result containing different information worth noticing, which is distributed in different positions of the image. 7) can explain the whole computing.
where
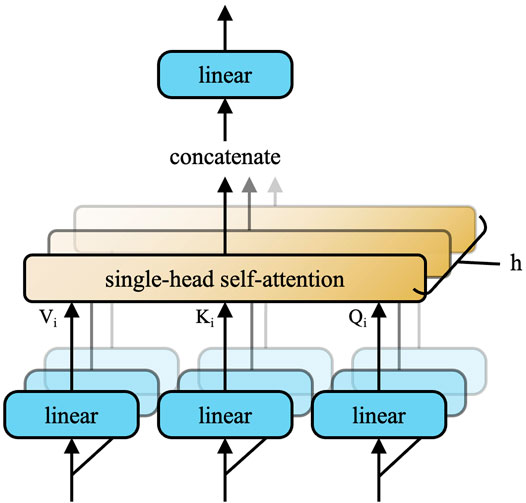
FIGURE 4. Multi-head attention consists of h single-head attention running in parallel.
3.3.2 Add and Layer Normalization
In this sublayer, add represents adding original input, which is the feature map, to the output of the last sublayer. This can ensure that some important features will not be forgotten after computing, which is called residual connection. Layer normalization (Ba et al., 2016), which is the norm for short, is applied after residual connection. Norm is designed for normalizing a layer so that it can avoid the exploding gradient and vanishing gradient largely. To be specific, the mean and standard deviation of these data are set to 0 and 1, respectively, as shown in 8)
where H denotes the number of layer units, a denotes the old unit, and a′ denotes the new unit. The whole computing is shown as
3.3.3 Feed-Forward Network
Another sublayer of the decoder is the feed-forward network, which is added after attention computing and can be denoted like (10)
where W1 and W2 denote two parameter matrixes used for linear transformation and σ denotes the activation function, which is ReLU here. FFN will not change dimensions of input, while the dimensions of the hidden layer are usually larger.
3.4 Transformer Decoder
As can be seen from Figure 1, the decoder contains the same sublayers as the encoder since it follows the original architecture of Vaswani et al. (2017). Nevertheless, there still exist differences between them. The output of the original one is probability denoting the prediction distribution of words, which means that it predicts one word in sequence at a time. The design of object queries makes it possible to output N embeddings in parallel at the same time. After that, embeddings are transformed into N predictions with a box and labeled by prediction FFN.
3.4.1 Object Queries
Object queries have a similar function as positional encoding, it is learnable, while the former is fixed, as shown by 1). The role of object queries is to introduce a fixed-size set of predictions, and the number is N (here, N = 100), which is usually larger than the number of existing objects in the input image. With a combination of encoder output that carries information of input images, optimal bipartite matching between predicted and ground truth objects can be inferred by loss functions.
3.4.2 Computing of the Decoder
The input of the decoder is initialized as zero vectors
As for the multi-head attention sublayer, its query comes from object queries and the output of the last sublayer. The output of the encoder acts as a key after adding positional encoding. The value directly derives from the encoder. As mentioned before, attention computes the relevancy between key and query. Putting it another way, query carries information of different objects, while key and value carry global information of the input image since they derive from the encoder. If an image exhibits the feature of an object proposed in object queries, the attention score will be large enough. The following computing of the decoder is similar to that of the encoder.
3.5 Prediction Heads
In this layer, final prediction bounding boxes and the corresponding classes are output. A 3-layer perceptron with the ReLU activation function and a linear projection layer compose the prediction FFN. As mentioned before, N is usually larger than the number of objects in the image, so the embedding which has nothing to match after prediction FFN is classified as
where yi and
where yi = (ci, bi) and ci is the label of ground truth i, bi ∈ [0,1]4 is the box carrying information of center coordinates, height and weight,
where λL1 and λiou denote two common loss functions used in object detection. Since ℓ1 loss has different scales for small and large boxes, even if their relative errors are similar and the later one is scale-invariant, a linear combination of these two losses is adopted here to make the best of both loss functions.
After finding the optimal bipartite matching
4 Experiments
In this section, our method is evaluated for insulator defect detection. To begin with, experimental configurations, an overview of our dataset, evaluation criteria, and supplements of the experiment are presented. Afterward, we adopt different pretrained models in our method and evaluate some other competitive methods on our dataset. The results of these methods are compared after evaluation. Finally, some results are visualized on examples of datasets.
4.1 Experiment Description
4.1.1 Experimental Configuration
In this study, all experiments are finished on the following experimental configurations: a server with an Intel Xeon Gold 6136 CPU, four NVIDIA TITAN Xp with 12 GB GPU memory each, and 192 GB RAM with a frequency of 2666 MHz. More specific configurations are presented in Table 1.
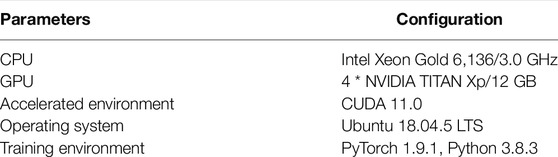
TABLE 1. Details of experimental configurations.
4.1.2 Dataset
As far as we know, there is no standard insulator dataset for widespread use. In the work of Tao et al. (2018), they proposed a public dataset called “CPLID” based on aerial images captured by a UAV with a DJI M200 camera. However, all images containing defects are synthesized by data augmentation so that it can easily result in overfitting. To improve the robustness of our model, another 40 aerial images are included and some data augmentation methods such as horizontal and vertical flip, 90° rotation clockwise and counter-clockwise, and upside down are adopted here.
After that, a novel dataset of 2085 images is generated and divided into training, validation, and testing sets, which contain 1800, 225, and 60 images, respectively. The size of every image is 576 × 432 here. Figure 5 shows the positive and negative samples of the dataset. Figure 6 shows an overview of the dataset we constructed here.
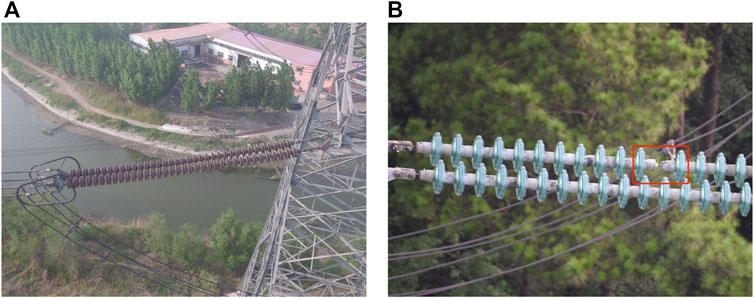
FIGURE 5. Examples of training samples: (A) negative sample and (B) positive sample.
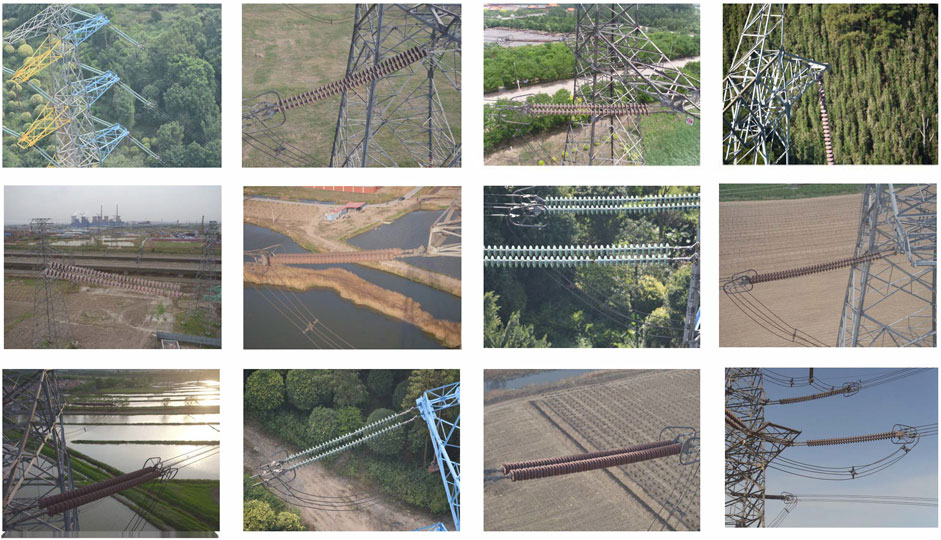
FIGURE 6. Overview of the dataset constructed here.
4.1.3 Evaluation Criteria
On the basis of former works, there are four criteria widely used for evaluation in object detection: precision(P), recall(R), F1, and mean average precision (mAP) (Powers, 2020). The formulas of criteria used in this study are shown below:
where TP, FP, TN, and FN are defined as shown in Table 2. Denominators of P and R denote the number of defects of prediction and ground truth, respectively. P(R) denotes a precision-recall curve, AP is the area under the curve, and the mean AP of all classes is mAP.
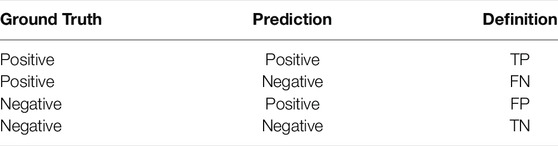
TABLE 2. Definition of confusion matrix.
When classifying the prediction as positive or negative, it involves an important judgment: Intersection over Union (IoU). The IoU for comparing similarity between two arbitrary shapes A and B is attained by Rezatofighi et al., 2019:
where G and P denote the bounding box of ground truth and prediction, respectively. In the aerial image after detection, the model outputs several prediction bounding boxes with the corresponding labels, and it is easy to do the calculation of each box. Setting a threshold, prediction boxes are classified as positive or negative by comparing IoU with the threshold.
FPS is used for measuring the detection speed of the model. The higher FPS is, the higher the number of images the model can handle per second.
4.1.4 Supplements of the Experiment
Training parameter settings are shown in Table 3.
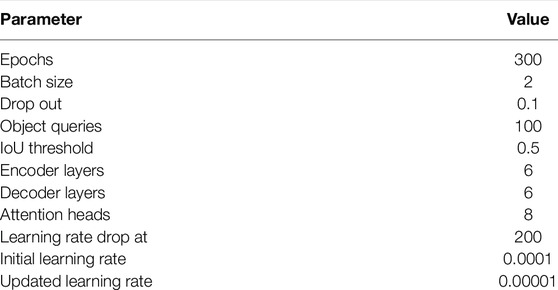
TABLE 3. Training parameter settings of DETR.
4.2 Performance of DETR
4.2.1 Performance of Different Backbones
As mentioned in Section 3, CNN is adopted to generate a feature map of the input image. ResNet-50 and ResNet-101 put up a good performance, so both are adopted here. In addition, according to Li et al., 2017, the resolution of the feature map can be increased by removing a stride from the first stage of the backbone and adding a dilation to the last convolution, which can be called ResNet-50-DC5 and ResNet-101-DC5, where DC5 denotes dilated C5 stage. Benefitting from higher resolutions of the feature map, a small object can be better detected. As Table 4 shows, considering the accuracy and time consumption, it is reasonable for us to adopt ResNet-50 as the backbone.
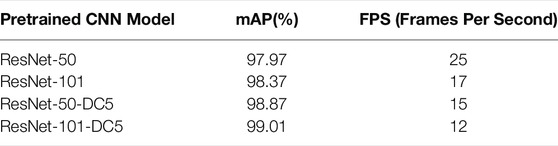
TABLE 4. Detection performance of different pretrained CNN models.
4.2.2 Comparison With Other Object Detection Models
As mentioned above, one-stage and two-stage methods have their own features. To be specific, one-stage models conclude results within a shorter time than two-stage models, while the accuracy is lower. The latest work shows that Cascade R-CNN has been used in insulator defect detection (Wen et al., 2021). Feng et al. (2021) have proved that YOLOv5 can achieve the highest accuracy at 86.8%, and mAP is 95.5%. In order to evaluate the advantage of the proposed model compared with other models, we have Cascade Mask R-CNN (Cai and Vasconcelos, 2019) and YOLOv5 (Jocher et al., 2022) as strong competitors.
The dataset used here is exactly the same as that we used in our model. The performance of these detection methods is shown in Table 5. The best performance of every column is highlighted in bold. In addition, the backbone of Cascade R-CNN and YOLOv5 used here is ResNet-50, the same as that of DETR. DETR gets the best average precision in all classes and the mean average precision. However, YOLOv5 as a strong one-stage method achieves a much higher FPS than DETR and Cascade R-CNN. The standard FPS of the video shot by UAV is 24, 30, 60, or 120. Hence, DETR can handle a normal video as well as YOLOv5. The design of object queries makes it possible for DETR to achieve the highest accuracy. Even though one-stage and two-stage methods have some hand-craft design such as anchor and proposal box, it is an unstable way to detect an object in images because these methods need prior knowledge of the dataset to get good results.
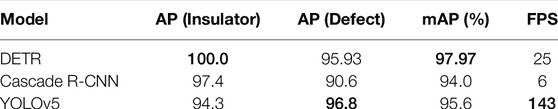
TABLE 5. Detection performance of different methods.
Aerial images shot by UAVs usually contain complex backgrounds and insulators that differ from one another in appearance, shape, and size because of different filming angles, distance, and ambient light. To validate the accuracy and robustness of our proposed model, it is necessary to visualize the performance of DETR and compare it with two competitors as shown in Figures 7–10, where each figure contains three subfigures corresponding to Cascade R-CNN, YOLOv5, and DETR. Prediction bounding boxes, class labels (insulator or defect), and confidence scores are plotted and written on figures. Figure 7 shows a scene with woods in the background, which is common in power line inspection. All models are really good at insulator detection, while YOLOv5 does not have high confidence in giving answers. Something goes wrong in defect detection where cascade R-CNN gives a false positive prediction and YOLOv5 gives no detection. DETR detects all objects wanted with high confidence. Figure 8 shows another common scene, which is earth in the background. The three models all detect the right objects, while YOLOv5 still suffers from low confidence. Figure 9 has a background similar to Figure 8, whereas the insulator is incomplete, which may be challenging for models to detect accurately. The results show that Cascade R-CNN has a problem in detecting defects, while YOLOv5 and DETR can give accurate detections. YOLOv5 is somewhat affected in giving confidence. The attention mechanism, which computes attention scores among features extracted from input images, enables our model to recognize another category of insulators. Figure 10 shows that DETR can detect a single suspension string; however, the dataset has nothing about this category. Based on the results observed in Figures 7–10, DETR achieves better performances than the representative models of two-stage and one-stage methods no matter how complex the background of aerial images is.
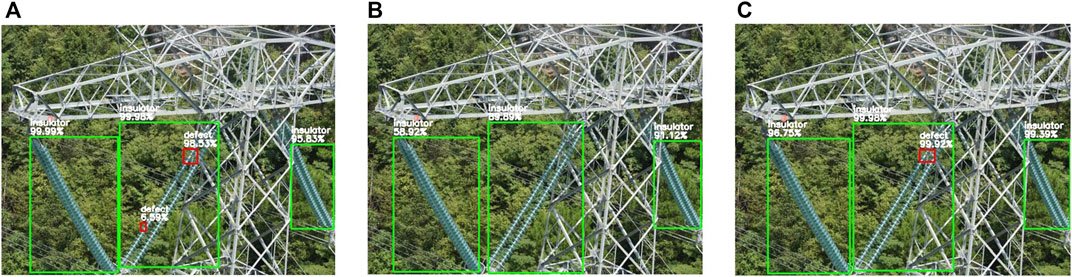
FIGURE 7. Aerial image with woods in the background: (A) cascade R-CNN, (B) YOLOv5, and (C) DETR.
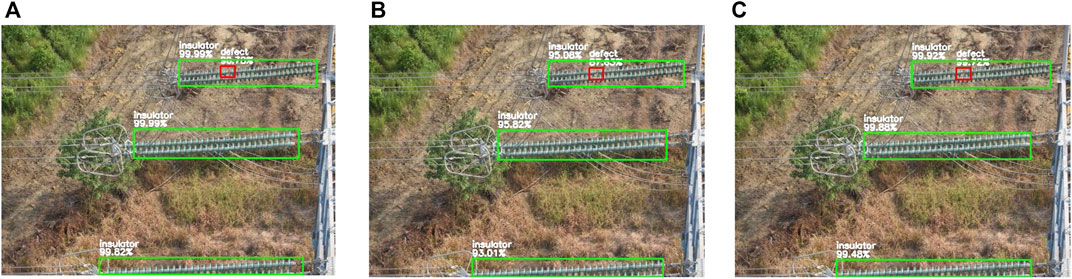
FIGURE 8. Aerial image with earth in the background: (A) cascade R-CNN, (B) YOLOv5, and (C) DETR.
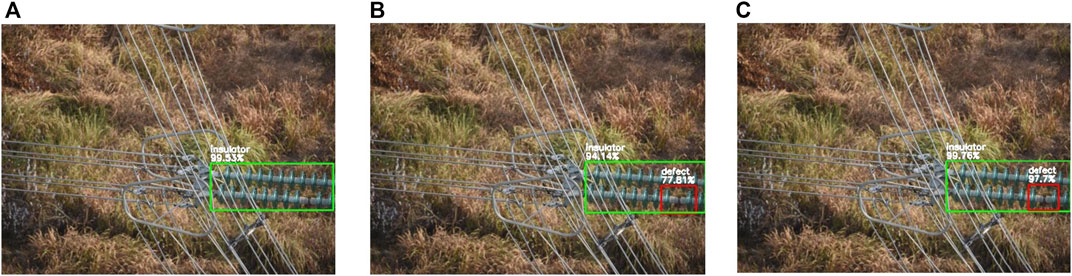
FIGURE 9. Aerial image with the half insulator: (A) cascade R-CNN, (B) YOLOv5, and (C) DETR.
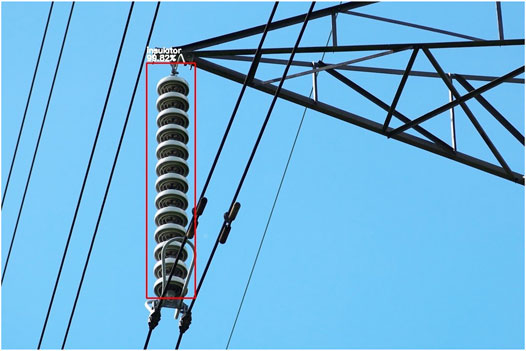
FIGURE 10. Demonstration that our model has learned how to detect other categories of insulators.
5 Conclusion
In this study, a novel encoder–decoder architecture is presented for insulator and defect detection. The attention mechanism is adopted for computing the relevance of features in images extracted by CNN. A learnable positional encoding called object queries is adopted to acquire prior knowledge about the locations of objects needed to detect instead of the hand-crafted process used in two-stage and one-stage methods. Bipartite matching loss between ground truth and prediction is adopted for giving optimal results. Based on a public insulator dataset called “CPLID”, a 3 times larger dataset containing more categories of the insulator is constructed here. DETR gets 97.97 in mean average precision, which is the best among the three models. We can conclude from experimental results that our model has the ability to achieve end-to-end insulator defect detection accurately in real time.
Data Availability Statement
Publicly available datasets were analyzed in this study. These data can be found here: https://github.com/InsulatorData/InsulatorDataSet.
Author Contributions
WX: Conceptualization, methodology, writing, and editing. XZ: Codification of concepts. ML: Data collection, data preprocessing, and dataset construction. LW: Project administration and funding acquisition. GZ: Writing review and re-examining details of the article.
Conflict of Interest
Authors WX, XZ, LW, and GZ were employed by The State Grid Hangzhou Xiaoshan Power Supply Company, and Author ML was employed by The Zhejiang Zhongxin Power Engineering Construction Co., Ltd.
The remaining author declares that the research was conducted in the absence of any commercial or financial relationships that could be construed as a potential conflict of interest.
Publisher’s Note
All claims expressed in this article are solely those of the authors and do not necessarily represent those of their affiliated organizations or those of the publisher, the editors, and the reviewers. Any product that may be evaluated in this article or claim that may be made by its manufacturer is not guaranteed or endorsed by the publisher.
References
Ba, J. L., Kiros, J. R., and Hinton, G. E. (2016). Layer Normalization. arXiv preprint arXiv:1607.06450.
Cai, Z., and Vasconcelos, N. (2019). Cascade R-Cnn: High Quality Object Detection and Instance Segmentation. IEEE Trans. Pattern Anal. Mach. Intell. 43, 1483–1498. doi:10.1109/TPAMI.2019.2956516
Carion, N., Massa, F., Synnaeve, G., Usunier, N., Kirillov, A., and Zagoruyko, S. (2020). “End-to-end Object Detection with Transformers,” in European Conference on Computer Vision (Cham: Springer), 213–229. doi:10.1007/978-3-030-58452-8_13
Chen, J., Lu, Y., Yu, Q., Luo, X., Adeli, E., Wang, Y., et al. (2021). Transunet: Transformers Make Strong Encoders for Medical Image Segmentation. arXiv preprint arXiv:2102.04306.
Feng, Z., Guo, L., Huang, D., and Li, R. (2021). “Electrical Insulator Defects Detection Method Based on Yolov5,” in 2021 IEEE 10th Data Driven Control and Learning Systems Conference (DDCLS) (Suzhou: IEEE), 979–984. doi:10.1109/ddcls52934.2021.9455519
Hu, L., Ma, J., and Fang, Y. (2019). “Defect Recognition of Insulators on Catenary via Multi-Oriented Detection and Deep Metric Learning,” in 2019 Chinese Control Conference (CCC) (Guangzhou: IEEE), 7522–7527. doi:10.23919/chicc.2019.8866485
Jocher, G., Chaurasia, A., Stoken, A., Borovec, J., Kwon, Y., Xie, T., et al. (2022). ultralytics/yolov5: v6.1 - TensorRT, TensorFlow Edge TPU and OpenVINO Export and Inference. doi:10.5281/zenodo.6222936
Li, Y., Qi, H., Dai, J., Ji, X., and Wei, Y. (2017). “Fully Convolutional Instance-Aware Semantic Segmentation,” in Proceedings of the IEEE Conference on Computer Vision and Pattern Recognition (Honolulu: IEEE), 2359–2367. doi:10.1109/cvpr.2017.472
Liu, C., Wu, Y., Liu, J., and Han, J. (2021). Mti-yolo: a Light-Weight and Real-Time Deep Neural Network for Insulator Detection in Complex Aerial Images. Energies 14, 1426. doi:10.3390/en14051426
Luque-Vega, L. F., Castillo-Toledo, B., Loukianov, A., and Gonzalez-Jimenez, L. E. (2014). “Power Line Inspection via an Unmanned Aerial System Based on the Quadrotor Helicopter,” in MELECON 2014-2014 17th IEEE Mediterranean Electrotechnical Conference (Beirut: IEEE), 393–397. doi:10.1109/melcon.2014.6820566
Park, K.-C., Motai, Y., and Yoon, J. R. (2017). Acoustic Fault Detection Technique for High-Power Insulators. IEEE Trans. Ind. Electron. 64, 9699–9708. doi:10.1109/tie.2017.2716862
Powers, D. M. (2020). Evaluation: from Precision, Recall and F-Measure to Roc, Informedness, Markedness and Correlation. arXiv preprint arXiv:2010.16061.
Qiu, Z., Zhu, X., Liao, C., Shi, D., and Qu, W. (2022). Detection of Transmission Line Insulator Defects Based on an Improved Lightweight Yolov4 Model. Appl. Sci. 12, 1207. doi:10.3390/app12031207
Rezatofighi, H., Tsoi, N., Gwak, J., Sadeghian, A., Reid, I., and Savarese, S. (2019). “Generalized Intersection over Union: A Metric and a Loss for Bounding Box Regression,” in Proceedings of the IEEE/CVF Conference on Computer Vision and Pattern Recognition (Long Beach: CVF), 658–666. doi:10.1109/cvpr.2019.00075
Sadykova, D., Pernebayeva, D., Bagheri, M., and James, A. (2019). In-yolo: Real-Time Detection of Outdoor High Voltage Insulators Using Uav Imaging. IEEE Trans. Power Deliv. 35, 1599–1601.
Takaya, K., Ohta, H., Kroumov, V., Shibayama, K., and Nakamura, M. (2019). “Development of Uav System for Autonomous Power Line Inspection,” in 2019 23rd International Conference on System Theory, Control and Computing (ICSTCC) (Sinaia: IEEE), 762–767. doi:10.1109/icstcc.2019.8885596
Tao, X., Zhang, D., Wang, Z., Liu, X., Zhang, H., and Xu, D. (2018). Detection of Power Line Insulator Defects Using Aerial Images Analyzed with Convolutional Neural Networks. IEEE Trans. Syst. Man, Cybern. Syst. 50, 1486–1498.
Vaswani, A., Shazeer, N., Parmar, N., Uszkoreit, J., Jones, L., Gomez, A. N., et al. (2017). Attention Is All You Need. Adv. neural Inf. Process. Syst. 30.
Wang, B., Chen, X., Wang, Q., Liu, L., Zhang, H., and Li, B. (2010). “Power Line Inspection with a Flying Robot,” in 2010 1st International Conference on Applied Robotics for the Power Industry (Montreal: IEEE), 1–6. doi:10.1109/carpi.2010.5624430
Wang, Z., Gao, Q., Xu, J., and Li, D. (2022). “A Review of Uav Power Line Inspection,” in Advances in Guidance, Navigation and Control (Singapore: Springer Singapore), 3147–3159. doi:10.1007/978-981-15-8155-7_263
Wen, Q., Luo, Z., Chen, R., Yang, Y., and Li, G. (2021). Deep Learning Approaches on Defect Detection in High Resolution Aerial Images of Insulators. Sensors 21, 1033. doi:10.3390/s21041033
Wu, T., Wang, W., Yu, L., Xie, Y., and Yin, W. (2019). Insulator Defect Detection Method for Lightweight Yolov3. Comput. Eng. 45, 275–280. doi:10.19678/j.issn.1000-3428.0053695
Xia, H., Yang, B., Li, Y., and Wang, B. (2022). An Improved Centernet Model for Insulator Defect Detection Using Aerial Imagery. Sensors 22, 2850. doi:10.3390/s22082850
Zhai, Y., Chen, R., Yang, Q., Li, X., and Zhao, Z. (2018). Insulator Fault Detection Based on Spatial Morphological Features of Aerial Images. IEEE Access 6, 35316–35326. doi:10.1109/access.2018.2846293
Zhao, Z., Xu, G., Qi, Y., Liu, N., and Zhang, T. (2016). “Multi-patch Deep Features for Power Line Insulator Status Classification from Aerial Images,” in 2016 International Joint Conference on Neural Networks (IJCNN) (Vancouver: IEEE), 3187–3194. doi:10.1109/ijcnn.2016.7727606
Zhao, Z., Zhen, Z., Zhang, L., Qi, Y., Kong, Y., and Zhang, K. (2019). Insulator Detection Method in Inspection Image Based on Improved Faster R-Cnn. Energies 12, 1204. doi:10.3390/en12071204
Keywords: insulator defect, object detection, DETR, deep learning, aerial image
Citation: Xu W, Zhong X, Luo M, Weng L and Zhou G (2022) End-to-End Insulator String Defect Detection in a Complex Background Based on a Deep Learning Model. Front. Energy Res. 10:928162. doi: 10.3389/fenrg.2022.928162
Received: 25 April 2022; Accepted: 24 May 2022;
Published: 18 July 2022.
Edited by:
Jun Liu, Xi’an Jiaotong University, ChinaReviewed by:
Siqi Bu, Hong Kong Polytechnic University, Hong Kong SAR, ChinaKeyu Wu, Institute for Infocomm Research (A∗STAR), Singapore
Copyright © 2022 Xu, Zhong, Luo, Weng and Zhou. This is an open-access article distributed under the terms of the Creative Commons Attribution License (CC BY). The use, distribution or reproduction in other forums is permitted, provided the original author(s) and the copyright owner(s) are credited and that the original publication in this journal is cited, in accordance with accepted academic practice. No use, distribution or reproduction is permitted which does not comply with these terms.
*Correspondence: Liguo Weng, d2xnenhkakAxNjMuY29t